Anreicherung von Reis mit Vitaminen und Mineralstoffen zur Vorbeugung eines Mikronährstoffmangels
Information
- DOI:
- https://doi.org/10.1002/14651858.CD009902.pub2Copy DOI

- Database:
-
- Cochrane Database of Systematic Reviews
- Version published:
-
- 25 October 2019see what's new
- Type:
-
- Intervention
- Stage:
-
- Review
- Cochrane Editorial Group:
-
Cochrane Public Health Group
- Copyright:
-
- Copyright © 2019 The Cochrane Collaboration. Published by John Wiley & Sons, Ltd.
Article metrics
Altmetric:
Cited by:
Authors
Contributions of authors
Protocol development: Joseph Ashong drafted an initial protocol with technical input from Sumithra Muthayya, Arnaud Laillou, Luz Maria De‐Regil and Juan Pablo Pena‐Rosas. Luz Maria De‐Regil, Belinda Burford and Juan Pablo Pena‐Rosas developed the methods of the protocol. All authors provided input and contributed to drafting the final version of the protocol.
Review development: all authors contributed to screening, extraction and assessment of data, as described in the Methods. MNGC, JPP and LMD prepared the GRADE 'Summary of findings' tables. All the review authors wrote and approved the final manuscript.
Juan Pablo Peña‐Rosas is the guarantor for the review.
Disclaimer: Juan Pablo Peña‐Rosas and Maria Nieves Garcia‐Casal are full‐time staff members of the World Health Organization. The review authors alone are responsible for the views expressed in this publication and they do not necessarily represent the official position, decisions, policy or views of the World Health Organization.
Sources of support
Internal sources
-
Centre for Health Innovation and Partnership, NSW Health, North Parramatta, Australia.
-
Department of Nutrition for Health and Development, World Health Organization, Switzerland.
External sources
-
Evidence and Programme Guidance, Department of Nutrition for Health and Development, World Health Organization, Switzerland.
WHO provided partial financial support from the Department of Nutrition for Health and Development for this work for some of the authors of this review.
-
Global Alliance for Improved Nutrition (GAIN), Switzerland.
WHO thanks GAIN for their financial support for conducting systematic reviews on micronutrient interventions. SM received partial financial support from GAIN during the preparation of the protocol.
-
Centers for Disease Control and Prevention (CDC), USA.
The National Center for Birth Defects and Developmental Disabilities provided financial support for conducting this systematic review.
-
Nutrition International, Canada.
WHO thanks Nutrition International for their financial support for conducting systematic reviews on micronutrient interventions.
-
The Bill & Melinda Gates Foundation, USA.
WHO acknowledges the financial support from the Bill & Melinda Gates Foundation for the development of systematic reviews of the evidence on the effects of nutrition interventions.
Declarations of interest
Juan Pablo Peña‐Rosas (JPP) co‐ordinates the Evidence and Programme Guidance Unit, Department of Nutrition for Health and Development, which received financial resources from the Bill & Melinda Gates Foundation (2013‐2019); US Centers for Disease Control and Prevention (CDC) (2014‐2019); Nutrition International (2014‐2019) and USAID (2014‐2019). Donors do not fund specific guidelines and do not participate in any decision related to the guideline development process including the composition of policy questions, membership of the guideline groups, the conduct and interpretation of systematic reviews, or the formulation of recommendations.
Prasanna Mithra (PM) received partial financial support from the Department of Nutrition for Health and Development, World Health Organization for this work.
B Unnikrishnan (BUK) received partial financial support from the Department of Nutrition for Health and Development, World Health Organization for this work.
Nithin Kumar (NK) received partial financial support from the Department of Nutrition for Health and Development, World Health Organization for this work.
Luz Maria De‐Regil (LMD) was a full‐time staff member of Nutrition International (formerly Micronutrient Initiative), an international not‐for‐profit organisation that delivers nutrition interventions to children, women of reproductive age and pregnant women. Nutrition International supports the implementation of large‐scale research projects on food fortification. None of them met the inclusion criteria of this review. Nutrition International is a partner of the Food Fortification Initiative and receives funds from the Canadian Department of Foreign Affairs. LMD was an Editor for the Cochrane Developmental, Psychosocial and Learning Problems Group.
Sreekumar Nair (SN) received partial financial support from the Department of Nutrition for Health and Development, World Health Organization for this work.
Maria Nieves Garcia‐Casal (MNG) is a scientist in the Evidence and Programme Guidance Unit, Department of Nutrition for Health and Development, which received financial resources from the Bill & Melinda Gates Foundation (2013‐2019); US Centers for Disease Control and Prevention (CDC) (2014‐2019); Nutrition International (2014‐2019) and USAID (2014‐2019). Donors do not fund specific guidelines and do not participate in any decision related to the guideline development process including the composition of policy questions, membership of the guideline groups, the conduct and interpretation of systematic reviews, or the formulation of recommendations.
Juan Antonio Solon (JAS) is president of the Nutrition Center of the Philippines, a non‐profit organisation working towards nutrition security (www.ncp.org.ph). He received partial financial support for this work. His involvement with the review was at the final stage where he helped with the interpretation of the results.
Acknowledgements
We would like to thank the editorial staff of Cochrane Public Health, in particular Solange Durao, Anke Rohwer, Reza Yousefi‐Nooraie, Irma Klerings, Hilary Thomson and Newton Opiyo (Cochrane Public Health and Health Systems Network)” for their support throughout the preparation of this review. The review team also acknowledges the external referees, Mark Lawrence and Annhild Mosdøl for their useful input to this work.
We would to thank Joseph Ashong, Sumithra Muthayya, Arnaud Laillou, Christophe Guyondet, Regina Moench‐Pfanner, and Belinda J Burford for their work in the protocol and in the early stages of the review. Joseph Ashong, Sumithra Muthayya, Arnaud Laillou and Christophe Guyondet initially screened independently the records for eligibility in an early search in 2012. The whole process was repeated in 2016 to 2017 for this version of the review with a new review team.
We are grateful for technical support from Dr Lucero Lopez and Dr Ricardo X Martinez for the interpretation of the results from two non‐randomised studies.
Special thanks are due to Joanne Abbott, for her support in designing and running various updates to the search strategy. We would like to thank Mr Thomas Allen and Jose Luis Garnica from the World Health Organization Library Services for their support with the search in Agricola. We also thank all the authors who contributed additional details of their studies.
The World Health Organization retains copyright and all other rights in the manuscript of this review as submitted for publication, including any revisions or updates to the manuscript that they may make from time to time.
Version history
| Published | Title | Stage | Authors | Version |
| 2019 Oct 25 | Fortification of rice with vitamins and minerals for addressing micronutrient malnutrition | Review | Juan Pablo Peña‐Rosas, Prasanna Mithra, Bhaskaran Unnikrishnan, Nithin Kumar, Luz Maria De‐Regil, N Sreekumaran Nair, Maria N Garcia‐Casal, Juan Antonio Solon | |
| 2012 Jun 13 | Fortification of rice with vitamins and minerals for addressing micronutrient malnutrition | Protocol | Joseph Ashong, Sumithra Muthayya, Luz Maria De‐Regil, Arnaud Laillou, Christophe Guyondet, Regina Moench‐Pfanner, Belinda J Burford, Juan Pablo Peña‐Rosas | |
Differences between protocol and review
We aimed at searching two databases in the protocol that were not available to us at the review stage: BIOSIS and Food Science and Technology Abstracts (FSTA). We also made the following changes from the published protocol (Ashong 2012).
-
We removed the subgroup analysis by prevalence of stunting in children under five years in the study site: moderate (number of children whose height‐for‐age Z‐score is between −2.0 and 2.99 standard deviations (SD) below the mean) versus severe stunting (number of children whose height‐for‐age Z‐score is less than −3.0 SD below the mean) versus mixed/unknown/unreported. This information was not available in most studies and not all studies were conducted in children. The most commonly used form of reporting was by mean Z‐score in each group rather than the prevalence.
-
We removed the subgroup by iron compound as most studies used micronized pyrophosphate and ferrous sulphate, which have similar bioavailability with differences varying depending on encapsulation, particle size and other factors not captured in these studies.
-
Given the different ways that diarrhoea was reported, we changed our protocol definition of three liquid stools in a single day, to any as defined by study authors in order to be able to capture this adverse effect, if present.
-
We have included any adverse effects to primary outcomes. They are reported separately.
-
We did not consider before‐and‐after studies without a control group for inclusion in this review as planned in protocol.
-
We did not include data from non‐randomised studies in the quantitative synthesis and the review conclusions, since these studies provided little information on the comparative effectiveness of rice fortification in improving nutrition. However, we did include them in the qualitative synthesis because of their details on contextual aspects and concepts of fortification. We mentioned their findings under the subheading 'Summary of non‐randomised studies' at the end of the main synthesis.
-
We have made the change from the proposed type of participants in the protocol being general population of all age groups (including pregnant women) from any country to general population older than two years of age (including pregnant women) from any country.
-
We planned to examine the effects of two or more nutrients (in the same study arm) in multiple comparisons. However, owing to the duplication of findings because most of the studies had iron as one of the micronutrients in the fortification arm, we included multi nutrient studies in comparison 1 only and since one study had vitamin A only in one of the arms, we included it in comparison 2.
Keywords
MeSH
Medical Subject Headings (MeSH) Keywords
- Anemia, Iron-Deficiency [prevention & control];
- Avitaminosis [*prevention & control];
- *Food, Fortified;
- Malnutrition [prevention & control];
- *Micronutrients [administration & dosage, deficiency];
- Minerals [*administration & dosage];
- Oryza;
- Randomized Controlled Trials as Topic;
- Vitamins [*administration & dosage];
Medical Subject Headings Check Words
Adolescent; Adult; Child; Child, Preschool; Female; Humans; Male; Pregnancy; Young Adult;
PICOs

WHO/CDC logic model for micronutrients interventions in public health (with permission from WHO)

'Risk of bias' summary: review authors' judgements about each 'Risk of bias' item for each included study
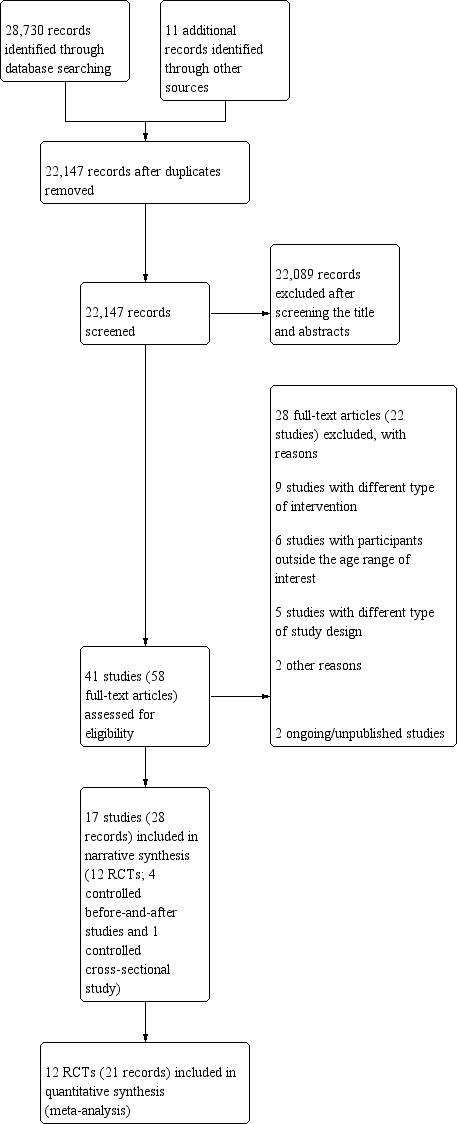
Four studies were controlled before‐and‐after studies (Ara 2019; Della Lucia 2016; Gershoff 1977; Nogueira Arcanjo 2013), and one was a controlled cross‐sectional study (Salcedo 1950)

'Risk of bias' graph: review authors' judgements about each 'Risk of bias' item presented as percentages across all included studies

Funnel plot of comparison 1. Rice fortified with iron alone or in combination with other micronutrients versus unfortified rice (no micronutrients added), outcome 1.13, haemoglobin concentration (g/L)

Comparison 1 Rice fortified with iron alone or in combination with other micronutrients versus unfortified rice (no micronutrients added)., Outcome 1 Anaemia (defined as haemoglobin (Hb) below the WHO cut‐off, adjusted for altitude as appropriate).

Comparison 1 Rice fortified with iron alone or in combination with other micronutrients versus unfortified rice (no micronutrients added)., Outcome 2 Anaemia (subgroup: by micronutrient content).

Comparison 1 Rice fortified with iron alone or in combination with other micronutrients versus unfortified rice (no micronutrients added)., Outcome 3 Anaemia (subgroup: by rice fortification method).

Comparison 1 Rice fortified with iron alone or in combination with other micronutrients versus unfortified rice (no micronutrients added)., Outcome 4 Anaemia (subgroup: by cooking method most commonly used in trial setting).

Comparison 1 Rice fortified with iron alone or in combination with other micronutrients versus unfortified rice (no micronutrients added)., Outcome 5 Anaemia (subgroup: by public health significance of anaemia at baseline ).

Comparison 1 Rice fortified with iron alone or in combination with other micronutrients versus unfortified rice (no micronutrients added)., Outcome 6 Anaemia (subgroup: by malaria endemicity).

Comparison 1 Rice fortified with iron alone or in combination with other micronutrients versus unfortified rice (no micronutrients added)., Outcome 7 Iron deficiency (as defined by study authors, based on a biomarker of iron status).

Comparison 1 Rice fortified with iron alone or in combination with other micronutrients versus unfortified rice (no micronutrients added)., Outcome 8 Iron deficiency (subgroup: by micronutrient content).

Comparison 1 Rice fortified with iron alone or in combination with other micronutrients versus unfortified rice (no micronutrients added)., Outcome 9 Iron deficiency (subgroup: by rice fortification method).

Comparison 1 Rice fortified with iron alone or in combination with other micronutrients versus unfortified rice (no micronutrients added)., Outcome 10 Iron deficiency (subgroup: by cooking method most commonly used in trial setting).

Comparison 1 Rice fortified with iron alone or in combination with other micronutrients versus unfortified rice (no micronutrients added)., Outcome 11 Iron deficiency (subgroup: by public health significance of anaemia at baseline ).

Comparison 1 Rice fortified with iron alone or in combination with other micronutrients versus unfortified rice (no micronutrients added)., Outcome 12 Iron deficiency (subgroup: by malaria endemicity).

Comparison 1 Rice fortified with iron alone or in combination with other micronutrients versus unfortified rice (no micronutrients added)., Outcome 13 Haemoglobin concentration (g/L).

Comparison 1 Rice fortified with iron alone or in combination with other micronutrients versus unfortified rice (no micronutrients added)., Outcome 14 Haemoglobin concentration (subgroup: by micronutrient content).

Comparison 1 Rice fortified with iron alone or in combination with other micronutrients versus unfortified rice (no micronutrients added)., Outcome 15 Haemoglobin concentration (subgroup: by rice fortification method).

Comparison 1 Rice fortified with iron alone or in combination with other micronutrients versus unfortified rice (no micronutrients added)., Outcome 16 Haemoglobin concentration (subgroup: by cooking method most commonly used in trial setting).

Comparison 1 Rice fortified with iron alone or in combination with other micronutrients versus unfortified rice (no micronutrients added)., Outcome 17 Haemoglobin concentration (subgroup: by public health significance of anaemia at baseline).

Comparison 1 Rice fortified with iron alone or in combination with other micronutrients versus unfortified rice (no micronutrients added)., Outcome 18 Haemoglobin concentration (subgroup: by malaria endemicity).

Comparison 1 Rice fortified with iron alone or in combination with other micronutrients versus unfortified rice (no micronutrients added)., Outcome 19 Vitamin A deficiency (as defined by study authors, by using a biomarker of vitamin A).

Comparison 1 Rice fortified with iron alone or in combination with other micronutrients versus unfortified rice (no micronutrients added)., Outcome 20 Vitamin A deficiency (subgroup: by micronutrient content).

Comparison 1 Rice fortified with iron alone or in combination with other micronutrients versus unfortified rice (no micronutrients added)., Outcome 21 Vitamin A deficiency (subgroup: by rice fortification method).

Comparison 1 Rice fortified with iron alone or in combination with other micronutrients versus unfortified rice (no micronutrients added)., Outcome 22 Vitamin A deficiency (subgroup: by cooking method most commonly used in trial setting).

Comparison 1 Rice fortified with iron alone or in combination with other micronutrients versus unfortified rice (no micronutrients added)., Outcome 23 Vitamin A deficiency (subgroup: by public health significance of anaemia at baseline ).

Comparison 1 Rice fortified with iron alone or in combination with other micronutrients versus unfortified rice (no micronutrients added)., Outcome 24 Vitamin A deficiency (subgroup: by malaria endemicity).

Comparison 1 Rice fortified with iron alone or in combination with other micronutrients versus unfortified rice (no micronutrients added)., Outcome 25 Serum or plasma folate (nmol/L).

Comparison 1 Rice fortified with iron alone or in combination with other micronutrients versus unfortified rice (no micronutrients added)., Outcome 26 Any adverse effects.

Comparison 1 Rice fortified with iron alone or in combination with other micronutrients versus unfortified rice (no micronutrients added)., Outcome 27 Diarrhoea (as defined by study authors).

Comparison 1 Rice fortified with iron alone or in combination with other micronutrients versus unfortified rice (no micronutrients added)., Outcome 28 Serum or plasma retinol (µmol/L).

Comparison 1 Rice fortified with iron alone or in combination with other micronutrients versus unfortified rice (no micronutrients added)., Outcome 29 Serum or plasma zinc (µmol/L).

Comparison 1 Rice fortified with iron alone or in combination with other micronutrients versus unfortified rice (no micronutrients added)., Outcome 30 Height‐for‐age Z‐score.

Comparison 1 Rice fortified with iron alone or in combination with other micronutrients versus unfortified rice (no micronutrients added)., Outcome 31 Weight‐for‐height Z‐score.

Comparison 2 Rice fortified with vitamin A alone or in combination with other micronutrients versus unfortified rice (no micronutrients added), Outcome 1 Haemoglobin concentration (g/L).

Comparison 2 Rice fortified with vitamin A alone or in combination with other micronutrients versus unfortified rice (no micronutrients added), Outcome 2 Serum or plasma retinol (µmol/L).
| Rice fortified with iron alone or in combination with other micronutrients compared to unfortified rice (no micronutrients added) for addressing micronutrient malnutrition | ||||||
| Patient or population: general population older than 2 years of age (including pregnant women) from any country | ||||||
| Outcomes | Anticipated absolute effects* (95% CI) | Relative effect | № of participants | Certainty of the evidence | Comments | |
| Risk with unfortified rice (no micronutrients added) | Risk with rice fortified with iron alone or in combination with other micronutrients | |||||
| Anaemia (defined as haemoglobin below the WHO cut‐off, adjusted for altitude as appropriate) | Study population | RR 0.72 (0.54 to 0.97) | 1634 (7 RCTs) | ⊕⊕⊝⊝ Low1 | Included studies: Angeles‐Agdeppa 2008; Hardinsyah 2016; Hotz 2008; Parker 2015 (C); Perignon 2016 (C); Radhika 2011; Thankachan 2012 | |
| 388 per 1000 | 279 per 1000 | |||||
| Iron deficiency (as defined by study authors, based on a biomarker of iron status) | Study population | RR 0.66 (0.51 to 0.84) | 1733 | ⊕⊕⊝⊝ | Included studies: Angeles‐Agdeppa 2008; Hardinsyah 2016; Hotz 2008; Moretti 2006b; Perignon 2016 (C); Pinkaew 2013; Radhika 2011; Thankachan 2012 | |
| 228 per 1000 | 150 per 1000 | |||||
| Haemoglobin concentration (in g/L) | The mean haemoglobin concentration (g/L) in the intervention groups was 1.83 higher (0.66 to 3.00 higher) | ‐ | 2163 | ⊕⊕⊝⊝ | Included studies: Angeles‐Agdeppa 2008; Hardinsyah 2016; Hotz 2008; Hussain 2014; Losso 2017; Moretti 2006b; Parker 2015 (C); Perignon 2016 (C); Pinkaew 2013; Radhika 2011; Thankachan 2012 | |
| Vitamin A deficiency (as defined by the study authors) | Study population | RR 0.68 (0.36 to 1.29) | 927 (4 RCTs) | ⊕⊕⊝⊝ | Included studies: Hardinsyah 2016; Perignon 2016 (C); Pinkaew 2014; Thankachan 2012 | |
| 105 per 1000 | 71 per 1000 (38 to 135) | |||||
| Serum or plasma folate (nmol/L) | The mean serum or plasma folate (nmol/L) in the intervention group was 4.30 higher (2.00 to 6.60 higher) | ‐ | 215 (1 RCT) | ⊕⊕⊝⊝ | Included study: Hardinsyah 2016 | |
| Any adverse effects (hookworm infection risk) | Study population | RR 1.78 | 785 | ⊕⊕⊝⊝ | Included study: Perignon 2016 (C) | |
| 119 per 1000 | 211 per 1000 | |||||
| Diarrhoea (as defined by study authors) | Study population | RR 3.52 | 258 | ⊕⊝⊝⊝ | Included study: Thankachan 2012 | |
| 0 per 1000 | 0 per 1000 | |||||
| *The risk in the intervention group (and its 95% confidence interval) is based on the assumed risk in the comparison group and the relative effect of the intervention (and its 95% CI). | ||||||
| GRADE Working Group grades of evidence | ||||||
| 1Downgraded 2 levels: one for serious limitations in study design or execution (risk of bias) and one for indirectness. The baseline characteristics were not similar in all groups and the method of randomisation was unclear in half of the studies. Also studies used different cut‐off levels of haemoglobin to define anaemia. Hardinsyah 2016; Parker 2015 (C); Perignon 2016 (C); Radhika 2011 used WHO cut‐off levels, Hotz 2008 used CDC criteria and Angeles‐Agdeppa 2008 and Thankachan 2012 did not name the criteria they used. | ||||||
| Rice fortified with vitamin A alone or in combination with other micronutrients compared to unfortified rice (no micronutrients added) for addressing micronutrient malnutrition | |||||
| Patient or population: general population older than 2 years of age (including pregnant women) from any country | |||||
| Outcomes | Anticipated absolute effects* (95% CI) | Relative effect | № of participants | Certainty of the evidence | Comments |
| Risk with rice fortified with vitamin A alone or in combination with other micronutrients | |||||
| Haemoglobin concentration (g/L) | MD 10 higher | ‐ | 74 | ⊕⊕⊕⊝ | Included study: Hussain 2014 |
| Serum or plasma retinol (µmol/L) | MD 0.17 higher | ‐ | 74 | ⊕⊕⊕⊝ | Included study: Hussain 2014 |
| *The risk in the intervention group (and its 95% confidence interval) is based on the assumed risk in the comparison group and the relative effect of the intervention (and its 95% CI). | |||||
| GRADE Working Group grades of evidence | |||||
| 1Downgraded by 2 levels: one level for risk of bias and one level for indirectness. The only study was carried out in India with a small sample size (250 children aged 5‐8 years) attending a school with a subsidised lunch feeding programme (Hussain 2014). | |||||
| Forms of rice | Description of rice |
| Rough rice (paddy rice) | Rice kernels still enclosed in an inedible, protective hull |
| Brown rice | Rice with only the hull removed. Bran layers and rice germ remain, giving the rice a brown colour |
| Parboiled rice | Rice pressurised to gelatinise the starch within the rice kernel, resulting in a firmer, more separate grain that is more stable and less susceptible to overcooking than regular‐milled white rice |
| Regular‐milled white rice (milled rice) | Polished whole rice, or polished rice. Hull, bran layer and germ have all been removed |
| Precooked rice | Regular milled white rice, parboiled milled white rice, and brown rice can be precooked and dehydrated before packaging. Examples of precooked rice are quick‐cooking rice, instant rice, and boil‐in‐the‐bag rice |
| Individually quick frozen (IQF) rice | Cooked grains are individually frozen before packaging |
| Crisped/puffed/expanded rice | Kernels can be processed in a number of different ways and shapes to meet particular manufacturing need |
| Adapted from Dexter 1998. | |
| Study and year (Country) | Participants | Type of rice fortification and dosage | Duration of intervention | Overall risk of bias |
| RCTs (individual randomisation) | ||||
| (Philippines) | 180 anaemic children aged 6‐9 years excluding severe anaemia (Hb < 70 g/L), history of blood disorders and other haemoglobinopathies |
| 6 months | High |
| (Indonesia) | 200 post‐menarchal adolescent girls 14‐18 years of age attending boarding school |
| 4 months | High |
| (Mexico) | 180 non‐pregnant, non‐lactating women 18‐49 years of age with moderate to low Hb concentrations from 6 factories |
| 6 months | High |
| (India) | 222 iron‐ and vitamin A‐depleted children 5‐8 years of age attending a subsidised lunch feeding programme |
| 6 months | High |
| (USA) | 17 menstruating women with iron‐deficiency anaemia |
| 2 weeks | High |
| (India) | 184 iron‐depleted children aged 6‐13 years from a primary school serving the Rock‐Colony neighbourhood |
| 7 months | Low |
| (Thailand) | The study was conducted in 8 primary schools with children aged 4‐12 years and they were mainly from low‐income families. |
| 5 months | High |
| (Thailand) | One primary school in the Muang district, of Thailand with children aged 8‐12 years, were the study participants |
| 2 months | High |
| (India) | 140 children aged between 5 and 11 years (with haemoglobin > 70 g/L) |
| 8 months | Low |
| (India) | Total of 258 anaemic (Hb concentrations 115 g/L for 6–11 years and 120 g/L for 12 years) children attending 4 primary schools aged 6‐12 years |
| 6 months | High |
| RCTs (cluster randomisation) | ||||
| (Burundi) | The study included 1071 children from 12 schools in Burundi aged between 7 and 11 years |
| 7 months | High |
| (Cambodia) | The study was a double‐blind cluster‐randomised, placebo‐controlled trial conducted among a total of 2440 school‐going children aged 6‐16 years. |
| 6 months | High |
| Non‐randomised studies (controlled before‐and‐after studies) | ||||
| (Bangladesh) | 870 women aged 15‐49 years excluding severe anaemia (435/group) at baseline and 800 (400/group) at end line |
| 12 months | High |
| (Brazil) | 131 non‐anaemic children between 2 and 6 years old, of both genders, participated in the study. |
| 4 months | High |
| (Thailand) | 2250 children aged 1.5‐9 years from 29 villages |
| 4 years | High |
| (Brazil) | 303 children 2‐5 years of age attending 2 public schools in City of Sobral‐Ceará, in the northeast of Brazil, between August and December 2010 |
| 18 weeks | High |
| Non‐randomised studies (controlled cross‐sectional study) | ||||
| (Philippines) | 574 children aged between 3 and 18 years 2188 Government employees with their families 1416 military personnel (clinical assessment limited to 350 in the experimental group and 116 in the control group) |
| 8 months | High |
| CBA: controlled before‐and‐after study; Hb: haemoglobin; RCT: randomised controlled trial | ||||
| Study | Place | Race/ethnicity | Occupation | Gender | Religion/ culture/education | Socio‐economic status | Social status | Others/ disability/ age/ sexual orientation | Overall PROGRESS‐Plus |
| Metro Manila, Division Pasig; Philippines | No specific mention, apart from the locality of the school in the capital city | School children | Male 99 + female 81 | No religion mentioned; children going to San Joaquin Elementary School (public) | Not mentioned | Not mentioned | Anaemic children; sexual orientation not mentioned | This study was carried out among 180 anaemic children going to a government elementary school. | |
| Vulnerable Group | Not mentioned specifically, however, they were the local resident women. | It included professional workers, | Non‐pregnant women aged 15‐49 years | No religion mentioned; nearly 25% without any education | No direct estimate provided; however, most of the study participants were from lower socioeconomic strata | Not mentioned | Women with severe anaemia were excluded. Sexual orientation is not mentioned | The study was carried out among 870 women of reproductive age and local residents of Bangladesh | |
| Brazil | Not specified | School‐going children | No religion mentioned, attending philanthropic schools | Not mentioned | Not mentioned | Children, 2‐6 years old | This study was carried out in 2 public schools among non‐anaemic children 2‐6 years of age during 4 consecutive months. | ||
| Chiang Mai villages in tile valley of the Ping River, Thailand | Thai children | Children in the community | Male 1121 + female 1109 | No religion mentioned. Children in the study villages | Not mentioned | Low/middle | Normal children; sexual orientation not mentioned | The study included 2230 children attending pre‐school and school from the low/middle social background | |
| Medan of North Sumatra Province, Indonesia | The majority of participants' ethnicity was Javanese and Bataknese | Teenage girls attending boarding school | Female | There is mention of the Ramadan fasting month during the second week of June | The family income ranges from 4.9 million to 5.5 million Rupiahs (Approximately 340 to 390 US Dollars) | Not mentioned | Age 14‐18 years of age | This study was carried out among post‐menarchal adolescent girls attending boarding school in Indonesia. The study lasted 4 months. | |
| Morelos State, Mexico | Mexican women | Factory workers | Women only | No religion mentioned; 18‐49 years | Low/middle school | Low/middle | Anaemic women; sexual orientation not mentioned | This study included women with altitude‐adjusted Hb concentrations between 105 | |
| India | Iron and vitamin A‐depleted 5‐8‐year‐old children attending a subsidised lunch feeding programme | Children attending a school‐based feeding programme | Not specified | Not reported | Not reported | Not mentioned, although programme is subsidised | 5‐8 years of age | This study included 222 children aged 5‐8 years attending a school where there was a subsidised lunch feeding programme in India receiving a 200‐250 g meal of cooked rice daily. | |
| Baton Rouge, USA | In the iron‐fortified group: 4 white, 3 black or African‐American, 1 Asian, 1 other; in the unfortified rice group: 3 white, 2 black or African American, 1 Asian | Women only | Not reported | Not mentioned | Not mentioned | 18‐50 years of age | This study included women with iron‐deficiency anaemia recruited through web and phone interviews and then in a clinic. | ||
| Franciscan primary school serving the | Indian | School‐going children | Not mentioned | 6‐13 years | Low | Low | Children with iron deficiency; sexual orientation not mentioned | Study included children having iron deficiency from an urban slum neighbourhood in India, belonging to low socioeconomic status and low social class | |
| Public schools in City of Sobral‐Ceará, in the northeast of Brazil | Not reported | School‐going children | Fortified rice group: 65 male: 73 female; unfortified rice group: 79 male: 86 female | 2‐5 years of age | Not reported. Family income 300 USD or less (it is unclear if this is weekly or monthly income ‐ not reported). 126/138 participants from iron‐fortified group versus 154/165 participants from unfortified group. | Not mentioned | Children 2‐5 years of age. Other information not reported | This before‐and‐after study included children 2‐5 years of age from 2 public schools in northeast Brazil receiving the school lunch programme and the fortified/unfortified intervention once a week. | |
| The study was carried out in Muyinga Province in Burundi catering to mainly agrarian population | Burundians | School‐going children | Female: 51.1% in intervention arm, 55.3% in control arm | Religion was not mentioned. 7‐11 years | Mean socioeconomic status score quintile = 3.03 (1.45) for intervention arm and 2.97 (1.37) for control arm | Not mentioned | Children with Hb level 70‐110 g/L and those who had not taken any nutritional supplements during the past 1 month since commencement of the study were included. Sexual orientation is not mentioned. | This cluster‐RCT included 904 children who were mild to moderately anaemic from the selected schools of Burundi and mainly with an agricultural background. | |
| The study was carried out in Kampung Speu Province of Cambodia | Cambodians | School‐going children | Male and female participants had equal representation (50% each) | 6‐16 years | Not mentioned | Not mentioned | Excluding severely anaemic children. All in the eligible age group were included in the study. Sexual orientation not mentioned | The cluster‐RCT included children from selected schools of Cambodia in KamPong Speu province with rice farming as a predominant occupation and income source. | |
| Satun province, west coast of southern Thailand | Thai Muslims | School children | Male, 98 + female 105 | Majority Muslim, age group of 7‐12 years | Low | Low/middle | Children with zinc deficiency; sexual orientation not mentioned | This study included school‐going children from low socioeconomic status and having zinc deficiency in Thailand. | |
| Muang District, Satun Province of southern Thailand | Thai Muslims | School Children | Males, 24 and females, 26 | Majority Muslims in the age group 8‐12 years | Low | Low/middle | Children who had consumed the triple‐fortified rice before or showed clinical symptoms of VAD (Bitots spot or ocular signs of xerophthalmia) or serum retinol values of < 0.7m mol/L were | This study included school‐going children from low socioeconomic status and having zinc deficiency in Thailand. | |
| Village of Keesara; Andhra Pradesh State in India | Indian | School children | Male 56 + female 90 | No mention of religion; age group of 5‐11 years | Low/middle | Low/middle | Anaemic children; sexual orientation not mentioned | The study included anaemic children from low‐middle socioeconomic background belonging to a rural area in India. | |
| Bataan, Philippines | Filipinos | Children and military personnel | Male and female, but proportions not reported | No mention of religion or education | Children lived in a welfare institution; military personnel were fully employed | Not mentioned | No exclusions were reported; sexual orientation was not mentioned | The study was conducted among children living in a welfare institution and among military personnel in the Philippines. | |
| Primary schools in | Indians | School children | Male 47%, female 53% | Hindu > Christians > Muslim; 6‐12 years | Low/middle school | Low | Anaemic children; sexual orientation not mentioned | This study included anaemic school going children from low socioeconomic background from an urban area India. | |
| Hb: haemoglobin; RCT: randomised controlled trial | |||||||||
| Study | Elemental iron (mg) | Vitamin Aa (mg) | Zinc (mg) | Folic acid (µg) | Vitamin B1 (thiamin) (mg) | Vitamin B2 (riboflavin) (mg) | Vitamin B3 (niacin) (mg) | Vitamin B6 (pyridoxine) (mg) | Vitamin B12 (cobalamin) (µg) |
| 6.25 | ‐ | ‐ | ‐ | ‐ | ‐ | ‐ | ‐ | ‐ | |
| Ara 2019 (CBA) | 6 | 0.15 | 4.00 | 130 | 0.40 | 1.0 | |||
| Della Lucia 2016 (CBA) | 8.4 | ‐ | 4.20 | 144 | 0.72 | ‐ | ‐ | ‐ | ‐ |
| Gershoff 1977 (CBA) | 0.2 | 0.81 | 0.087 | 0.04 | |||||
| 0.2 | 0.81 | 0.087 | 0.04 | ||||||
| 0.2 | 0.81 | 0.087 | 0.04 | ||||||
| 10.8 | 0.28 | 5.20 | 145 | ‐ | 3.2 | ||||
| 26.6 | ‐ | ‐ | ‐ | ‐ | ‐ | ‐ | ‐ | ‐ | |
| 4 | ‐ | ‐ | ‐ | ‐ | ‐ | ‐ | ‐ | ||
| ‐ | 1.20 (as beta‐carotene) | ‐ | ‐ | ‐ | ‐ | ‐ | ‐ | ‐ | |
| ‐ | 0.18 | ‐ | ‐ | ‐ | ‐ | ‐ | ‐ | ‐ | |
| 4 | 0.18 | ‐ | ‐ | ‐ | ‐ | ‐ | ‐ | ‐ | |
| 4 | 1.20 (as beta‐carotene) | ‐ | ‐ | ‐ | ‐ | ‐ | ‐ | ‐ | |
| 18 | ‐ | ‐ | ‐ | ‐ | ‐ | ‐ | ‐ | ‐ | |
| 20 | ‐ | ‐ | ‐ | ‐ | ‐ | ‐ | ‐ | ‐ | |
| Nogueira Arcanjo 2013 (CBA) | 112.8 | ‐ | ‐ | ‐ | ‐ | ‐ | ‐ | ‐ | ‐ |
| 11.9 | ‐ | 5.70 | 400 | 1.80 | ‐ | ‐ | ‐ | ‐ | |
| 10.67 | ‐ | 3.04 | 170 | 1.06 | ‐ | ‐ | ‐ | ‐ | |
| 7.55 | 0.64 | 2.02 | 280 | 1.43 | ‐ | 12.57 | ‐ | 3.8 | |
| 7.46 | 0.29 | 3.68 | 140 | 0.69 | ‐ | 7.98 | 0.92 | 1.26 | |
| 20 | 2.10 | 18 | ‐ | ‐ | ‐ | ‐ | ‐ | ‐ | |
| 20 | 2.10 | 18 | ‐ | ‐ | ‐ | ‐ | ‐ | ‐ | |
| 15 | ‐ | ‐ | ‐ | ‐ | ‐ | ‐ | ‐ | ‐ | |
| Salcedo 1950 (CBA) | 2.86 | ‐ | ‐ | ‐ | 0.44 | ‐ | 0.33 | ‐ | ‐ |
| 12.5 | 0.50 | 3 | 75 | 0.38 | ‐ | 5 | 0.38 | 0.75 | |
| 6.25 | 0.50 | 3 | 75 | 0.38 | ‐ | 5 | 0.38 | 0.75 | |
| C: cluster randomised; CBA: controlled before‐and‐after study | |||||||||
| aOne international unit (IU) vitamin A is equivalent to 0.0003 mg of retinol, 0.0006 mg of beta‐carotene and 0.0012 mg of other pro‐vitamin A carotenoids. | |||||||||
| Study | Haemoglobin threshold (g/L) | Criteria |
| Anaemia was defined as haemoglobin concentration in blood < 120 g/L | Not mentioned | |
| < 120 g/L in non‐pregnant and non‐lactating women | Not mentioned | |
| ≥ 110 g/L was used as a cut off for including children in the study. Anaemia was not defined | Not reported | |
| Haemoglobin levels were categorised as deficient < 100, low 100‐90 (g/L) | Not mentioned | |
| Severe anaemia: < 80 g/L; moderate anaemia: 80‐109 g/L; mild anaemia: 110‐119 g/L; non anaemia: ≥ 120 g/L | WHO (WHO 2011a) | |
| < 122 g/L, adjusted for average altitude of the study sites (1100 m) with the use of an equation | CDC (CDC 1989) | |
| < 110 g/L and severely anaemic (Hb < 75 g/L) were excluded | Not mentioned | |
| Not reported (iron‐deficiency anaemia was defined based on iron and ferritin levels in serum) | Not reported | |
| < 115 g/L in children aged 5–11 years | WHO (WHO 2001) | |
| < 110 g/L in children < 5 years of age | WHO (WHO 2001) | |
| For school‐aged children at 1500 m above sea level, mild anaemia was defined as Hb 115‐119 g/L, moderate anaemia Hb 85‐114 g/L, and severe anaemia Hb < 85 g/L | WHO (WHO 2011f) | |
| < 115 g/L for children aged 6‐11 years, < 120 g/L for children aged 12‐14 years and girls aged ≥ 15 years and < 130 g/L for boys aged ≥ 15 years | WHO (WHO 2001) | |
| < 120 g/L | Not mentioned | |
| Not reported | Not reported | |
| In children aged 5–11 years, anaemia (mild to moderate) was defined as Hb 70‐115 g/L. | WHO (WHO 2001) | |
| Not reported | Not reported | |
| < 115 g/L in children aged 6–11 years and < 120 g/L in participants aged ≥ 12 years | Not mentioned | |
| CDC: Centers for Disease Control and Prevention; Hb: haemoglobin; WHO: World Health Organization | ||
| Outcome (all studies included in the analysis) | Study (ICC) | RR (95% CI) | Tau² | Chi² | P value | I² |
| Anaemia (Angeles‐Agdeppa 2008; Hardinsyah 2016; Hotz 2008; Parker 2015 (C); Perignon 2016 (C); Radhika 2011; Thankachan 2012) | Parker 2015 (C) (0) | 0.83 (0.64 to 1.08) | 0.06 | 16.06 | 0.01 | 63% |
| Parker 2015 (C) (0.001) | 0.83 (0.64 to 1.08) | 0.06 | 15.72 | 0.02 | 62% | |
| Parker 2015 (C) (0.002) | 0.83 (0.64 to 1.08) | 0.06 | 15.71 | 0.02 | 62% | |
| Parker 2015 (C) (0.005) | 0.83 (0.64 to 1.07) | 0.06 | 15.12 | 0.02 | 60% | |
| Parker 2015 (C) (0.01) | 0.83 (0.64 to 1.08) | 0.06 | 14.80 | 0.02 | 59% | |
| Parker 2015 (C) (0.02723) | 0.83 (0.64 to 1.07) | 0.05 | 13.08 | 0.04 | 54% | |
| Parker 2015 (C) (0.1) | 0.81 (0.64 to 1.03) | 0.04 | 10.03 | 0.12 | 40% | |
| 0.83 (0.67 to 1.03) | 0.04 | 13.17 | 0.04 | 54% | ||
| Perignon 2016 (C) (0.001) | 0.83 (0.67 to 1.04) | 0.04 | 13.15 | 0.04 | 54% | |
| Perignon 2016 (C) (0.002) | 0.83 (0.66 to 1.04) | 0.04 | 13.16 | 0.04 | 54% | |
| Perignon 2016 (C) (0.005) | 0.83 (0.66 to 1.05) | 0.04 | 13.12 | 0.04 | 54% | |
| Perignon 2016 (C) (0.01) | 0.83 (0.65 to 1.05) | 0.05 | 13.12 | 0.04 | 54% | |
| Perignon 2016 (C) (0.02723) | 0.83 (0.64 to 1.07) | 0.05 | 13.08 | 0.04 | 54% | |
| Perignon 2016 (C)( 0.1) | 0.83 (0.63 to 1.09) | 0.06 | 13.08 | 0.04 | 54% | |
| Outcome (all studies included in the analysis) | Study (ICC) | MD (95% CI) | Tau² | Chi² | P value | I² |
| Haemoglobin concentration (Angeles‐Agdeppa 2008; Hardinsyah 2016; Hotz 2008; Hussain 2014; Losso 2017; Moretti 2006b; Parker 2015 (C); Perignon 2016 (C); Pinkaew 2013; Radhika 2011; Thankachan 2012) | Parker 2015 (C) (0) | 1.69 (0.48 to 2.91) | 1.82 | 24.15 | 0.007 | 59% |
| Parker 2015 (C) (0.001) | 1.70 (0.48 to 2.92) | 1.81 | 23.90 | 0.008 | 58% | |
| Parker 2015 (C) (0.002) | 1.71 (0.49 to 2.93) | 1.81 | 23.69 | 0.008 | 58% | |
| Parker 2015 (C) (0.005) | 1.73 (0.51 to 2.96) | 1.80 | 23.18 | 0.01 | 57% | |
| Parker 2015 (C) (0.01) | 1.77 (0.54 to 3.00) | 1.79 | 22.62 | 0.01 | 56% | |
| Parker 2015 (C)) (0.02723) | 1.85 (0.61 to 3.10) | 1.77 | 21.73 | 0.02 | 54% | |
| Parker 2015 (C)) (0.1) | 1.98 (0.71 to 3.25) | 1.76 | 20.96 | 0.02 | 52% | |
| Perignon 2016 (C)) (0) | 1.85 (0.61 to 3.09) | 1.77 | 21.98 | 0.02 | 55% | |
| Perignon 2016 (C)) (0.001) | 1.85 (0.61 to 3.09) | 1.77 | 21.97 | 0.02 | 54% | |
| Perignon 2016 (C)) (0.002) | 1.85 (0.61 to 3.09) | 1.77 | 21.96 | 0.02 | 54% | |
| Perignon 2016 (C)) (0.005) | 1.85 (0.61 to 3.10) | 1.77 | 21.93 | 0.02 | 54% | |
| Perignon 2016 (C)) (0.01) | 1.85 (0.61 to 3.10) | 1.77 | 21.89 | 0.02 | 54% | |
| Perignon 2016 (C)) (0.02723) | 1.85 (0.61 to 3.10) | 1.77 | 21.73 | 0.02 | 54% | |
| Perignon 2016 (C)) (0.1) | 1.86 (0.61 to 3.11) | 1.78 | 21.15 | 0.02 | 53% | |
| C: cluster‐randomised trial; CI: confidence interval; ICC: intra‐cluster correlation coefficient; MD: mean difference; RR: risk ratio | ||||||
| Outcome or subgroup title | No. of studies | No. of participants | Statistical method | Effect size |
| 1 Anaemia (defined as haemoglobin (Hb) below the WHO cut‐off, adjusted for altitude as appropriate) Show forest plot | 7 | 1634 | Risk Ratio (M‐H, Random, 95% CI) | 0.72 [0.54, 0.97] |
| 2 Anaemia (subgroup: by micronutrient content) Show forest plot | 7 | 1634 | Risk Ratio (M‐H, Random, 95% CI) | 0.83 [0.66, 1.04] |
| 2.1 Iron alone | 3 | 444 | Risk Ratio (M‐H, Random, 95% CI) | 0.63 [0.36, 1.09] |
| 2.2 Iron + other micronutrients | 4 | 1190 | Risk Ratio (M‐H, Random, 95% CI) | 0.95 [0.82, 1.11] |
| 3 Anaemia (subgroup: by rice fortification method) Show forest plot | 7 | 1634 | Risk Ratio (M‐H, Random, 95% CI) | 0.73 [0.55, 0.97] |
| 3.1 Hot extrusion | 5 | 1197 | Risk Ratio (M‐H, Random, 95% CI) | 0.72 [0.52, 1.01] |
| 3.2 Cold extrusion | 3 | 437 | Risk Ratio (M‐H, Random, 95% CI) | 0.75 [0.41, 1.38] |
| 3.3 Coating | 0 | 0 | Risk Ratio (M‐H, Random, 95% CI) | 0.0 [0.0, 0.0] |
| 3.4 Dusting | 0 | 0 | Risk Ratio (M‐H, Random, 95% CI) | 0.0 [0.0, 0.0] |
| 3.5 Mixed/unknown/unreported | 0 | 0 | Risk Ratio (M‐H, Random, 95% CI) | 0.0 [0.0, 0.0] |
| 4 Anaemia (subgroup: by cooking method most commonly used in trial setting) Show forest plot | 7 | 1634 | Risk Ratio (M‐H, Random, 95% CI) | 0.72 [0.54, 0.97] |
| 4.1 Soaking, and boiling with excess water | 0 | 0 | Risk Ratio (M‐H, Random, 95% CI) | 0.0 [0.0, 0.0] |
| 4.2 Boiling without excess water | 0 | 0 | Risk Ratio (M‐H, Random, 95% CI) | 0.0 [0.0, 0.0] |
| 4.3 Rinsing and boiling without excess water | 1 | 215 | Risk Ratio (M‐H, Random, 95% CI) | 0.40 [0.26, 0.63] |
| 4.4 Frying and boiling without excess water | 0 | 0 | Risk Ratio (M‐H, Random, 95% CI) | 0.0 [0.0, 0.0] |
| 4.5 Unknown/unreported | 6 | 1419 | Risk Ratio (M‐H, Random, 95% CI) | 0.81 [0.63, 1.05] |
| 5 Anaemia (subgroup: by public health significance of anaemia at baseline ) Show forest plot | 7 | 1634 | Risk Ratio (M‐H, Random, 95% CI) | 0.72 [0.54, 0.97] |
| 5.1 Not a problem (lower than 5%) | 0 | 0 | Risk Ratio (M‐H, Random, 95% CI) | 0.0 [0.0, 0.0] |
| 5.2 Mild and moderate (5% to 39.9%) | 4 | 1129 | Risk Ratio (M‐H, Random, 95% CI) | 0.69 [0.44, 1.06] |
| 5.3 Severe (40% and more) | 2 | 360 | Risk Ratio (M‐H, Random, 95% CI) | 0.87 [0.67, 1.12] |
| 5.4 Mixed/unknown/unreported | 1 | 145 | Risk Ratio (M‐H, Random, 95% CI) | 0.31 [0.09, 1.10] |
| 6 Anaemia (subgroup: by malaria endemicity) Show forest plot | 7 | 1634 | Risk Ratio (M‐H, Random, 95% CI) | 0.72 [0.54, 0.97] |
| 6.1 Some malaria risk setting | 1 | 445 | Risk Ratio (M‐H, Random, 95% CI) | 0.85 [0.55, 1.32] |
| 6.2 Malaria‐free area | 2 | 403 | Risk Ratio (M‐H, Random, 95% CI) | 0.70 [0.48, 1.03] |
| 6.3 Unknown/unreported | 4 | 786 | Risk Ratio (M‐H, Random, 95% CI) | 0.67 [0.34, 1.31] |
| 7 Iron deficiency (as defined by study authors, based on a biomarker of iron status) Show forest plot | 8 | 1733 | Risk Ratio (M‐H, Random, 95% CI) | 0.66 [0.51, 0.84] |
| 8 Iron deficiency (subgroup: by micronutrient content) Show forest plot | 8 | 1733 | Risk Ratio (M‐H, Random, 95% CI) | 0.66 [0.51, 0.84] |
| 8.1 Iron alone | 4 | 628 | Risk Ratio (M‐H, Random, 95% CI) | 0.56 [0.40, 0.80] |
| 8.2 Iron + other micronutrients | 4 | 1105 | Risk Ratio (M‐H, Random, 95% CI) | 0.78 [0.57, 1.06] |
| 9 Iron deficiency (subgroup: by rice fortification method) Show forest plot | 8 | 1733 | Risk Ratio (M‐H, Random, 95% CI) | 0.66 [0.52, 0.83] |
| 9.1 Hot extrusion | 6 | 1283 | Risk Ratio (M‐H, Random, 95% CI) | 0.66 [0.51, 0.87] |
| 9.2 Cold extrusion | 3 | 450 | Risk Ratio (M‐H, Random, 95% CI) | 0.65 [0.38, 1.09] |
| 9.3 Coating | 0 | 0 | Risk Ratio (M‐H, Random, 95% CI) | 0.0 [0.0, 0.0] |
| 9.4 Dusting | 0 | 0 | Risk Ratio (M‐H, Random, 95% CI) | 0.0 [0.0, 0.0] |
| 9.5 Mixed/unknown/unreported | 0 | 0 | Risk Ratio (M‐H, Random, 95% CI) | 0.0 [0.0, 0.0] |
| 10 Iron deficiency (subgroup: by cooking method most commonly used in trial setting) Show forest plot | 8 | 1733 | Risk Ratio (M‐H, Random, 95% CI) | 0.66 [0.51, 0.84] |
| 10.1 Soaking, and boiling with excess water | 0 | 0 | Risk Ratio (M‐H, Random, 95% CI) | 0.0 [0.0, 0.0] |
| 10.2 Boiling without excess water | 0 | 0 | Risk Ratio (M‐H, Random, 95% CI) | 0.0 [0.0, 0.0] |
| 10.3 Rinsing and boiling without excess water | 1 | 215 | Risk Ratio (M‐H, Random, 95% CI) | 0.79 [0.51, 1.21] |
| 10.4 Frying and boiling without excess water | 0 | 0 | Risk Ratio (M‐H, Random, 95% CI) | 0.0 [0.0, 0.0] |
| 10.5 Unknown/unreported | 7 | 1518 | Risk Ratio (M‐H, Random, 95% CI) | 0.63 [0.46, 0.84] |
| 11 Iron deficiency (subgroup: by public health significance of anaemia at baseline ) Show forest plot | 8 | 1733 | Risk Ratio (M‐H, Random, 95% CI) | 0.66 [0.51, 0.84] |
| 11.1 Not a problem (lower than 5%) | 0 | 0 | Risk Ratio (M‐H, Random, 95% CI) | 0.0 [0.0, 0.0] |
| 11.2 Mild and moderate (5% to 39.9%) | 4 | 1046 | Risk Ratio (M‐H, Random, 95% CI) | 0.77 [0.55, 1.07] |
| 11.3 Severe (40% and more) | 2 | 358 | Risk Ratio (M‐H, Random, 95% CI) | 0.57 [0.26, 1.27] |
| 11.4 Mixed/unknown/unreported | 2 | 329 | Risk Ratio (M‐H, Random, 95% CI) | 0.63 [0.39, 1.01] |
| 12 Iron deficiency (subgroup: by malaria endemicity) Show forest plot | 8 | 1733 | Risk Ratio (M‐H, Random, 95% CI) | 0.66 [0.51, 0.84] |
| 12.1 Some malaria risk setting | 1 | 485 | Risk Ratio (M‐H, Random, 95% CI) | 0.86 [0.48, 1.53] |
| 12.2 Malaria‐free area | 3 | 585 | Risk Ratio (M‐H, Random, 95% CI) | 0.58 [0.41, 0.84] |
| 12.3 Mixed/unknown/unreported | 4 | 663 | Risk Ratio (M‐H, Random, 95% CI) | 0.61 [0.39, 0.96] |
| 13 Haemoglobin concentration (g/L) Show forest plot | 11 | 2163 | Mean Difference (IV, Random, 95% CI) | 1.83 [0.66, 3.00] |
| 14 Haemoglobin concentration (subgroup: by micronutrient content) Show forest plot | 11 | 2163 | Mean Difference (IV, Random, 95% CI) | 2.09 [0.75, 3.44] |
| 14.1 Iron alone | 6 | 698 | Mean Difference (IV, Random, 95% CI) | 3.93 [1.24, 6.62] |
| 14.2 Iron + other micronutrients | 6 | 1465 | Mean Difference (IV, Random, 95% CI) | 1.06 [0.15, 1.98] |
| 15 Haemoglobin concentration (subgroup: by rice fortification method) Show forest plot | 11 | 2163 | Mean Difference (IV, Random, 95% CI) | 1.60 [0.81, 2.38] |
| 15.1 Hot extrusion | 7 | 1563 | Mean Difference (IV, Random, 95% CI) | 1.93 [0.53, 3.32] |
| 15.2 Cold extrusion | 3 | 437 | Mean Difference (IV, Random, 95% CI) | 1.54 [0.58, 2.51] |
| 15.3 Coating | 1 | 15 | Mean Difference (IV, Random, 95% CI) | 8.20 [‐12.14, 28.54] |
| 15.4 Dusting | 0 | 0 | Mean Difference (IV, Random, 95% CI) | 0.0 [0.0, 0.0] |
| 15.5 Mixed/unknown/unreported | 1 | 148 | Mean Difference (IV, Random, 95% CI) | ‐4.0 [‐11.72, 3.72] |
| 16 Haemoglobin concentration (subgroup: by cooking method most commonly used in trial setting) Show forest plot | 11 | 2163 | Mean Difference (IV, Random, 95% CI) | 1.83 [0.66, 3.00] |
| 16.1 Soaking, and boiling with excess water | 0 | 0 | Mean Difference (IV, Random, 95% CI) | 0.0 [0.0, 0.0] |
| 16.2 Boiling without excess water | 0 | 0 | Mean Difference (IV, Random, 95% CI) | 0.0 [0.0, 0.0] |
| 16.3 Rinsing and boiling without excess water | 1 | 215 | Mean Difference (IV, Random, 95% CI) | 3.80 [0.86, 6.74] |
| 16.4 Unknown/unreported | 10 | 1948 | Mean Difference (IV, Random, 95% CI) | 1.62 [0.43, 2.81] |
| 17 Haemoglobin concentration (subgroup: by public health significance of anaemia at baseline) Show forest plot | 11 | 2163 | Mean Difference (IV, Random, 95% CI) | 1.83 [0.66, 3.00] |
| 17.1 Not a problem (lower than 5%) | 0 | 0 | Mean Difference (IV, Random, 95% CI) | 0.0 [0.0, 0.0] |
| 17.2 Mild and moderate (5% to 39.9%) | 6 | 1459 | Mean Difference (IV, Random, 95% CI) | 1.67 [‐0.10, 3.44] |
| 17.3 Severe (40% and more) | 2 | 360 | Mean Difference (IV, Random, 95% CI) | 1.07 [‐0.84, 2.98] |
| 17.4 Mixed/unknown/unreported | 3 | 344 | Mean Difference (IV, Random, 95% CI) | 3.42 [1.10, 5.73] |
| 18 Haemoglobin concentration (subgroup: by malaria endemicity) Show forest plot | 11 | 2163 | Mean Difference (IV, Random, 95% CI) | 1.83 [0.66, 3.00] |
| 18.1 Some malaria risk setting | 1 | 445 | Mean Difference (IV, Random, 95% CI) | 0.90 [0.65, 1.15] |
| 18.2 Malaria‐free area | 3 | 587 | Mean Difference (IV, Random, 95% CI) | 3.15 [0.98, 5.31] |
| 18.3 Mixed/unknown/unreported | 7 | 1131 | Mean Difference (IV, Random, 95% CI) | 1.33 [‐0.48, 3.14] |
| 19 Vitamin A deficiency (as defined by study authors, by using a biomarker of vitamin A) Show forest plot | 4 | 927 | Risk Ratio (M‐H, Random, 95% CI) | 0.68 [0.36, 1.29] |
| 20 Vitamin A deficiency (subgroup: by micronutrient content) Show forest plot | 4 | 927 | Risk Ratio (M‐H, Random, 95% CI) | 0.68 [0.36, 1.29] |
| 20.1 Iron alone | 0 | 0 | Risk Ratio (M‐H, Random, 95% CI) | 0.0 [0.0, 0.0] |
| 20.2 Iron + other micronutrients | 4 | 927 | Risk Ratio (M‐H, Random, 95% CI) | 0.68 [0.36, 1.29] |
| 21 Vitamin A deficiency (subgroup: by rice fortification method) Show forest plot | 4 | 927 | Risk Ratio (M‐H, Random, 95% CI) | 0.68 [0.41, 1.14] |
| 21.1 Hot extrusion | 4 | 765 | Risk Ratio (M‐H, Random, 95% CI) | 0.70 [0.35, 1.39] |
| 21.2 Cold extrusion | 1 | 162 | Risk Ratio (M‐H, Random, 95% CI) | 0.61 [0.24, 1.54] |
| 21.3 Coating | 0 | 0 | Risk Ratio (M‐H, Random, 95% CI) | 0.0 [0.0, 0.0] |
| 21.4 Dusting | 0 | 0 | Risk Ratio (M‐H, Random, 95% CI) | 0.0 [0.0, 0.0] |
| 21.5 Mixed/unknown/unreported | 0 | 0 | Risk Ratio (M‐H, Random, 95% CI) | 0.0 [0.0, 0.0] |
| 22 Vitamin A deficiency (subgroup: by cooking method most commonly used in trial setting) Show forest plot | 4 | 927 | Risk Ratio (M‐H, Random, 95% CI) | 0.68 [0.36, 1.29] |
| 22.1 Soaking, and boiling with excess water | 0 | 0 | Risk Ratio (M‐H, Random, 95% CI) | 0.0 [0.0, 0.0] |
| 22.2 Boiling without excess water | 0 | 0 | Risk Ratio (M‐H, Random, 95% CI) | 0.0 [0.0, 0.0] |
| 22.3 Rinsing and boiling without excess water | 1 | 215 | Risk Ratio (M‐H, Random, 95% CI) | 1.10 [0.47, 2.60] |
| 22.4 Frying and boiling without excess water | 0 | 0 | Risk Ratio (M‐H, Random, 95% CI) | 0.0 [0.0, 0.0] |
| 22.5 Unknown/unreported | 3 | 712 | Risk Ratio (M‐H, Random, 95% CI) | 0.55 [0.25, 1.22] |
| 23 Vitamin A deficiency (subgroup: by public health significance of anaemia at baseline ) Show forest plot | 4 | 927 | Risk Ratio (M‐H, Random, 95% CI) | 0.68 [0.36, 1.29] |
| 23.1 Not a problem (lower than 5%) | 0 | 0 | Risk Ratio (M‐H, Random, 95% CI) | 0.0 [0.0, 0.0] |
| 23.2 Mild and moderate (5% to 39.9%) | 3 | 695 | Risk Ratio (M‐H, Random, 95% CI) | 0.60 [0.29, 1.24] |
| 23.3 Severe (40% and more) | 1 | 232 | Risk Ratio (M‐H, Random, 95% CI) | 1.46 [0.30, 7.07] |
| 23.4 Mixed/unknown/unreported | 0 | 0 | Risk Ratio (M‐H, Random, 95% CI) | 0.0 [0.0, 0.0] |
| 24 Vitamin A deficiency (subgroup: by malaria endemicity) Show forest plot | 4 | 927 | Risk Ratio (M‐H, Random, 95% CI) | 0.68 [0.36, 1.29] |
| 24.1 Some malaria risk setting | 1 | 442 | Risk Ratio (M‐H, Random, 95% CI) | 0.57 [0.30, 1.08] |
| 24.2 Malaria‐free area | 1 | 232 | Risk Ratio (M‐H, Random, 95% CI) | 1.46 [0.30, 7.07] |
| 24.3 Unknown/unreported | 2 | 253 | Risk Ratio (M‐H, Random, 95% CI) | 0.55 [0.12, 2.59] |
| 25 Serum or plasma folate (nmol/L) Show forest plot | 1 | Mean Difference (IV, Random, 95% CI) | Totals not selected | |
| 26 Any adverse effects Show forest plot | 2 | 1019 | Risk Ratio (M‐H, Random, 95% CI) | 1.21 [0.53, 2.76] |
| 26.1 Hookworm infection risk | 1 | 785 | Risk Ratio (M‐H, Random, 95% CI) | 1.78 [1.18, 2.70] |
| 26.2 Abdominal pain more than 3 days | 1 | 234 | Risk Ratio (M‐H, Random, 95% CI) | 0.77 [0.42, 1.42] |
| 27 Diarrhoea (as defined by study authors) Show forest plot | 1 | Risk Ratio (M‐H, Random, 95% CI) | Totals not selected | |
| 28 Serum or plasma retinol (µmol/L) Show forest plot | 5 | 727 | Mean Difference (IV, Random, 95% CI) | 0.04 [‐0.13, 0.21] |
| 29 Serum or plasma zinc (µmol/L) Show forest plot | 3 | 618 | Mean Difference (IV, Random, 95% CI) | 0.38 [‐0.08, 0.83] |
| 30 Height‐for‐age Z‐score Show forest plot | 1 | Mean Difference (IV, Random, 95% CI) | Totals not selected | |
| 31 Weight‐for‐height Z‐score Show forest plot | 1 | Mean Difference (IV, Random, 95% CI) | Totals not selected | |
| Outcome or subgroup title | No. of studies | No. of participants | Statistical method | Effect size |
| 1 Haemoglobin concentration (g/L) Show forest plot | 1 | Mean Difference (IV, Random, 95% CI) | Totals not selected | |
| 2 Serum or plasma retinol (µmol/L) Show forest plot | 1 | Mean Difference (IV, Random, 95% CI) | Totals not selected | |