L'enrichissement du riz en vitamines et minéraux pour lutter contre la malnutrition en micronutriments
Résumé scientifique
Contexte
L'enrichissement du riz avec des vitamines et des minéraux a le potentiel d’améliorer l’état nutritionnel des populations dans les pays consommateurs de riz où des carences en micronutriments existent. Au niveau mondial, 490 millions de tonnes métriques de riz sont consommées chaque année. C'est la culture vivrière de base d'environ trois milliards de personnes.
Objectifs
Déterminer les avantages et les inconvénients de l'enrichissement du riz en vitamines et en minéraux (fer, vitamine A, zinc ou acide folique) sur l'état micronutritionnel et la santé dans la population générale.
Stratégie de recherche documentaire
Nous avons fait des recherches dans les bases de données CENTRAL, MEDLINE, Embase, CINAHL et 16 autres jusqu'au 10 décembre 2018. Nous avons effectué une recherche sur le site ClinicalTrials.gov et dans le site Web de l'Organisation Mondiale de la Santé (OMS) intitulé International Clinical Trials Registry Platform (ICTRP) le 10 décembre 2018.
Critères de sélection
Nous avons inclus des essais randomisés et quasi‐randomisés (avec randomisation individuelle ou en grappes) et des études avant/après contrôlées. Les participants étaient des personnes âgées de plus de deux ans (y compris les femmes enceintes) de n'importe quel pays. L'intervention portait sur du riz enrichi d'au moins un micronutriment ou d'une combinaison de plusieurs micronutriments (fer, acide folique, zinc, vitamine A ou autres vitamines et minéraux) par rapport au riz non enrichi ou sans intervention.
Recueil et analyse des données
Nous avons suivi les procédures méthodologiques standard définies par Cochrane. Deux auteurs de la revue ont indépendamment examiné les études et extrait les données.
Résultats principaux
Nous avons inclus 17 études (10 483 participants) et identifié deux études en cours. Douze études incluses étaient des essais contrôlés randomisés (ECR), avec 2 238 participants après ajustement pour le regroupement dans deux ECR en grappes, et cinq étaient des études non randomisées avec quatre études avant/après contrôlées et une étude transversale cas‐témoins (8 245 participants). Quatre études ont été menées en Inde, trois en Thaïlande, deux aux Philippines, deux au Brésil, deux au Bangladesh, au Burundi, au Cambodge, en Indonésie, au Mexique et aux États‐Unis. Deux études portaient sur des femmes non enceintes et non allaitantes et dix sur des enfants d'âge préscolaire ou scolaire.
Les 17 études ont toutes fait état d'enrichissement en fer. Parmi ces études, six ont enrichi du riz uniquement avec du fer ; onze ont ajouté d'autres micronutriments (fer, zinc et vitamine A, et acide folique). Une étude avait un bras avec de la vitamine A seule et un bras avec des caroténoïdes seuls. La teneur en fer variait de 0,2 à 112,8 mg/100 g de riz non cuit, donné pendant une période variant de deux semaines à 48 mois.
Treize études n'ont pas clairement décrit ni la génération de séquences, ni le masquage de l’allocation. Onze études présentaient un faible taux d'attrition. Rien n'indique qu’il y ait eu une publication sélective parmi ces études Nous avons examiné deux ECR présentant un faible risque global de biais et dix un risque global élevé de biais. Un ECR présentait un risque élevé ou peu clair de biais dans la plupart des domaines. Toutes les études avant/après contrôlées présentaient un risque élevé ou un risque incertain de biais dans la plupart des domaines. Les études incluses ont été financées par des gouvernements, des organisations privées et non gouvernementales, ainsi que d'autres institutions universitaires. Les sources de financement ne semblent pas avoir modifié les résultats. Nous avons utilisé les études non randomisées dans la synthèse qualitative, mais nous les avons exclues de l'analyse quantitative et des conclusions de la revue parce qu'elles fournissaient surtout de l'information contextuelle et une information quantitative limitée.
Riz enrichi de fer seul ou en combinaison avec d'autres micronutriments par rapport au riz non enrichi (aucun micronutriment ajouté)
L'enrichissement du riz en fer (seul ou en combinaison avec d'autres micronutriments) semble faire peu ou pas de différence dans le risque d'anémie (risque relatif (RR) 0,72, intervalle de confiance à 95% (IC) 0,54 à 0,97 ; I2 = 74% ; 7 études, 1634 participants ; faible certitude) et semble réduire le risque de déficience en fer (RR 0,66, 95% IC 0,51 à 0,84 ; 8 études, 1733 participants ; preuve faible certitude). L'enrichissement du riz semble augmenter l'hémoglobine moyenne (différence moyenne (DM) de 1,83, IC à 95 % de 0,66 à 3,00 ; I2 = 54 % ; 11 études, 2163 participants ; preuve de faible certitude) et semble faire peu ou pas de différence avec une carence en vitamine A (la vitamine A étant un des micronutriments du groupe enrichissement) (RR 0,68, IC à 95 % 0,36‐1,29 ; I2 = 37 % ; 4 études, 927 participants ; preuve de faible certitude). Selon une étude, l'enrichissement du riz (avec de l'acide folique comme micronutriment) pourrait améliorer le taux de folate sérique ou plasmatique (nmol/L) (DM 4,30, IC à 95 %, 2,00 à 6,60 ; 215 participants ; données peu fiables). Selon une étude, l'enrichissement du riz en fer seul ou avec d'autres micronutriments semble légèrement augmenter le risque d'infection par l'ankylostome (RR 1,78, IC à 95 %, 1,18 à 2,70 ; 785 participants ; données peu fiables). Nous ne sommes pas certains de l'effet du riz enrichi sur la diarrhée (RR 3,52, IC à 95 % : 0,18 à 67,39 ; 1 étude, 258 participants ; preuve de très faible certitude).
Riz enrichi en vitamine A seul ou en combinaison avec d'autres micronutriments par rapport au riz non enrichi (aucun micronutriment ajouté)
Dans un bras d’une étude, le riz était enrichi en vitamine A seulement, comparé à un bras avec du riz non enrichi. L'enrichissement du riz en vitamine A (en combinaison avec d'autres micronutriments) peut augmenter le taux moyen d'hémoglobine (DM 10,00, IC à 95 % : 8,79 à 11,21 ; 1 étude, 74 participants ; données peu fiables). Le riz enrichi en vitamine A peut légèrement améliorer la concentration sérique de rétinol (DM 0,17, IC à 95 % : 0,13 à 0,21 ; 1 étude, 74 participants ; preuve de faible certitude).
Aucune étude n'a fourni de données permettant de comparer l'enrichissement du riz par rapport à l'absence d'intervention. Les études sur l'acide folique et le zinc incluaient également une supplémentation en fer dans les bras avec enrichissement. Nous les avons donc présentées dans le cadre de la première comparaison.
Conclusions des auteurs
L'enrichissement du riz en fer seul ou en combinaison avec d'autres micronutriments semble faire peu ou pas de différence dans le risque de souffrir d'anémie ou de carence en fer et nous sommes incertains quant à une augmentation des concentrations moyennes d'hémoglobine dans la population générale de plus de 2 ans. L'enrichissement du riz avec du fer et d'autres micronutriments tels que la vitamine A ou l'acide folique semble faire peu ou pas de différence dans le risque de carence en vitamine A ou dans la concentration sérique de folate. On dispose de peu de données sur les effets néfastes de l'enrichissement du riz.
PICOs
Résumé simplifié
L'enrichissement du riz en vitamines et minéraux pour lutter contre la malnutrition en micronutriments
Quel est l’objectif de la revue ?
L'objectif de cette revue Cochrane était d'évaluer si l'enrichissement du riz avec un ou plusieurs micronutriments (vitamines ou minéraux) dans la population générale âgée de deux ans ou plus améliore l'état nutritionnel.
Messages principaux
L'enrichissement du riz en fer seul ou en combinaison avec d'autres micronutriments semble faire peu ou pas de différence dans le risque d'anémie, mais réduit probablement le risque de carence en fer et augmente les concentrations moyennes d'hémoglobine dans la population de deux ans ou plus. Si de la vitamine A est ajoutée, elle peut réduire le risque de carence en vitamine A et, lorsque de l'acide folique est ajouté, le riz enrichi peut légèrement augmenter les concentrations sériques de folate.
Qu'est‐ce qui a été étudié dans cette revue ?
La malnutrition en micronutriments compromet la santé et le bien‐être des populations dans de nombreux pays à revenu faible ou intermédiaire. L'enrichissement est l'ajout d'éléments nutritifs aux aliments pour améliorer leur qualité nutritionnelle. Le riz est largement consommé comme aliment de base et peut être adopté comme véhicule alimentaire pour l'enrichissement. Cette revue porte sur les avantages et les inconvénients de l'enrichissement du riz avec des vitamines et des minéraux sur l'état micronutritionnel et sur la santé, chez les participants âgés de deux ans et plus, en plus des résultats relatifs aux carences en fer, vitamine A, zinc et folate.
Quels sont les principaux résultats de la revue ?
Nous avons identifié 17 études (impliquant 10 483 participants) du Bangladesh, du Brésil, du Burundi, du Cambodge, de l'Inde, de l'Indonésie, du Mexique, des Philippines, de Thaïlande et des États‐Unis. Douze études ont été randomisées (2 238 participants) ; 10 portaient sur des enfants et deux sur des femmes non enceintes non allaitantes. En plus du fer, certaines études contenaient de la vitamine A, du zinc ou de l'acide folique comme agents fortifiants, seuls ou en combinaison. Cinq études non randomisées (8245 participants) ont été évaluées pour compléter l'information sur la mise en œuvre et l'impact de l'enrichissement. Les études incluses ont été financées par des gouvernements, des organisations privées et non gouvernementales, ainsi que d'autres institutions universitaires. Les sources de financement ne semblent pas avoir modifié les résultats.
Nous ne savons pas si l'enrichissement du riz en fer et autres micronutriments réduit le risque d'anémie, bien que cette intervention puisse augmenter les concentrations moyennes d'hémoglobine (un biomarqueur de l'anémie). Nous ne savons pas si l'enrichissement du riz en fer seul ou en combinaison avec d'autres micronutriments, comparé à l'absence d'enrichissement, réduit le risque de carence en fer.
De plus, la consommation de vitamine A dans le riz enrichi semble faire peu de différence sur les concentrations d'hémoglobine et de rétinol sérique (un biomarqueur de la vitamine A nutritionnelle). Nous ne savons pas si l'enrichissement du riz a des effets négatifs, à moyen ou à long terme, car les preuves étaient très limitées. Nous avons constaté que la certitude globale des éléments de preuve variait de très faible à faible. De plus, toutes les études ont utilisé du fer pour fortifier le riz, de sorte que l'effet des nutriments isolés peut être caché. Il n'y a pas eu de biais de publication significatif parmi ces études.
Dans quelle mesure cette revue est‐elle à jour ?
Les auteurs de la revue ont recherché les études qui avaient été publiées jusqu'au 10 décembre 2018.
Authors' conclusions
Summary of findings
| Rice fortified with iron alone or in combination with other micronutrients compared to unfortified rice (no micronutrients added) for addressing micronutrient malnutrition | ||||||
| Patient or population: general population older than 2 years of age (including pregnant women) from any country | ||||||
| Outcomes | Anticipated absolute effects* (95% CI) | Relative effect | № of participants | Certainty of the evidence | Comments | |
| Risk with unfortified rice (no micronutrients added) | Risk with rice fortified with iron alone or in combination with other micronutrients | |||||
| Anaemia (defined as haemoglobin below the WHO cut‐off, adjusted for altitude as appropriate) | Study population | RR 0.72 (0.54 to 0.97) | 1634 (7 RCTs) | ⊕⊕⊝⊝ Low1 | Included studies: Angeles‐Agdeppa 2008; Hardinsyah 2016; Hotz 2008; Parker 2015 (C); Perignon 2016 (C); Radhika 2011; Thankachan 2012 | |
| 388 per 1000 | 279 per 1000 | |||||
| Iron deficiency (as defined by study authors, based on a biomarker of iron status) | Study population | RR 0.66 (0.51 to 0.84) | 1733 | ⊕⊕⊝⊝ | Included studies: Angeles‐Agdeppa 2008; Hardinsyah 2016; Hotz 2008; Moretti 2006b; Perignon 2016 (C); Pinkaew 2013; Radhika 2011; Thankachan 2012 | |
| 228 per 1000 | 150 per 1000 | |||||
| Haemoglobin concentration (in g/L) | The mean haemoglobin concentration (g/L) in the intervention groups was 1.83 higher (0.66 to 3.00 higher) | ‐ | 2163 | ⊕⊕⊝⊝ | Included studies: Angeles‐Agdeppa 2008; Hardinsyah 2016; Hotz 2008; Hussain 2014; Losso 2017; Moretti 2006b; Parker 2015 (C); Perignon 2016 (C); Pinkaew 2013; Radhika 2011; Thankachan 2012 | |
| Vitamin A deficiency (as defined by the study authors) | Study population | RR 0.68 (0.36 to 1.29) | 927 (4 RCTs) | ⊕⊕⊝⊝ | Included studies: Hardinsyah 2016; Perignon 2016 (C); Pinkaew 2014; Thankachan 2012 | |
| 105 per 1000 | 71 per 1000 (38 to 135) | |||||
| Serum or plasma folate (nmol/L) | The mean serum or plasma folate (nmol/L) in the intervention group was 4.30 higher (2.00 to 6.60 higher) | ‐ | 215 (1 RCT) | ⊕⊕⊝⊝ | Included study: Hardinsyah 2016 | |
| Any adverse effects (hookworm infection risk) | Study population | RR 1.78 | 785 | ⊕⊕⊝⊝ | Included study: Perignon 2016 (C) | |
| 119 per 1000 | 211 per 1000 | |||||
| Diarrhoea (as defined by study authors) | Study population | RR 3.52 | 258 | ⊕⊝⊝⊝ | Included study: Thankachan 2012 | |
| 0 per 1000 | 0 per 1000 | |||||
| *The risk in the intervention group (and its 95% confidence interval) is based on the assumed risk in the comparison group and the relative effect of the intervention (and its 95% CI). | ||||||
| GRADE Working Group grades of evidence | ||||||
| 1Downgraded 2 levels: one for serious limitations in study design or execution (risk of bias) and one for indirectness. The baseline characteristics were not similar in all groups and the method of randomisation was unclear in half of the studies. Also studies used different cut‐off levels of haemoglobin to define anaemia. Hardinsyah 2016; Parker 2015 (C); Perignon 2016 (C); Radhika 2011 used WHO cut‐off levels, Hotz 2008 used CDC criteria and Angeles‐Agdeppa 2008 and Thankachan 2012 did not name the criteria they used. | ||||||
| Rice fortified with vitamin A alone or in combination with other micronutrients compared to unfortified rice (no micronutrients added) for addressing micronutrient malnutrition | |||||
| Patient or population: general population older than 2 years of age (including pregnant women) from any country | |||||
| Outcomes | Anticipated absolute effects* (95% CI) | Relative effect | № of participants | Certainty of the evidence | Comments |
| Risk with rice fortified with vitamin A alone or in combination with other micronutrients | |||||
| Haemoglobin concentration (g/L) | MD 10 higher | ‐ | 74 | ⊕⊕⊕⊝ | Included study: Hussain 2014 |
| Serum or plasma retinol (µmol/L) | MD 0.17 higher | ‐ | 74 | ⊕⊕⊕⊝ | Included study: Hussain 2014 |
| *The risk in the intervention group (and its 95% confidence interval) is based on the assumed risk in the comparison group and the relative effect of the intervention (and its 95% CI). | |||||
| GRADE Working Group grades of evidence | |||||
| 1Downgraded by 2 levels: one level for risk of bias and one level for indirectness. The only study was carried out in India with a small sample size (250 children aged 5‐8 years) attending a school with a subsidised lunch feeding programme (Hussain 2014). | |||||
Background
Description of the condition
Adequate vitamin and mineral nutrition is required for optimal growth and development of children and for the maintenance of adequate health and nutrition of adult populations. Vitamin and mineral deficiencies may result in conditions such as anaemia, blindness, birth defects, retarded growth, diminished mental development and other poor health outcomes (Howson 1998; Oakley 2004; Darnton‐Hill 2005; A2Z Project 2008). Micronutrient deficiencies have also long been demonstrated to increase the risk of morbidity and, in some cases, mortality, especially from infection (Bhaskaram 2002; Singhal 2002; Black 2003). They also significantly and negatively impact on socioeconomic development at the individual, community and national levels (Darnton‐Hill 2005). Iron, vitamin A, iodine and zinc deficiencies constitute the world’s most common micronutrient deficiencies (WHO 2009b).
Iron
The World Health Organization (WHO) estimates that approximately 1.6 billion people are anaemic worldwide with half being women and children under five years of age (WHO 2015a). It is estimated that in 2016, 41.7% of children, 40% of pregnant women and 32.5% of non‐pregnant women had anaemia (Stevens 2013; WHO 2015a; WHO 2019). Although anaemia can be caused by multiple factors, iron deficiency is estimated to account for up to 50% at least of the anaemia burden, making it the single most widespread nutritional deficiency in the world (Graham 2001; Rastogi 2002; Stoltzfus 2011). Other conditions such as parasitic infections, inherited haemoglobin disorders, or nutritional deficiencies such as of folate or vitamin B12 can also cause anaemia (WHO 2017). Thus, low haemoglobin concentrations are indicators of both poor nutrition and poor health (WHO 2011a). Before birth and during the first years of life, iron deficiency affects growth, neurodevelopment and cognitive performance (Lozoff 2006; Carter 2010), and may increase susceptibility to infections (Scrimshaw 2010). In adults, iron deficiency and anaemia cause the loss of healthy and productive lives due to their effects on work and physical capacity (Haas 1996). Pregnant women with iron deficiency are at higher risk of suboptimal pregnancy outcomes, including complications at delivery, low birthweight infants and preterm births (Peña‐Rosas 2015).
Vitamin A
Vitamin A deficiency causes xerophthalmia, which leads to night blindness and weakens the immune system, thereby increasing the risk of childhood morbidity and mortality (Sommer 1996). Vitamin A deficiency may increase the risk of morbidity and mortality during infancy, pregnancy and in the postpartum period (Sommer 1996; West 1999). It is estimated that vitamin A deficiency results in 18 million disability‐adjusted life years (DALYs) lost, a measure of overall disease burden that is expressed as the number of years lost due to ill‐health, disability or early death (WHO 2002). Vitamin A deficiency occurs mostly after prolonged deprivation of this vitamin (WHO/FAO 2004), and is a significant public health problem in many low‐ and middle‐income countries, most seriously affecting young children, women of reproductive age and pregnant women. According to recent estimates, 190 million preschool‐age children (under five years of age) and 19.1 million pregnant women have inadequate concentrations of retinol. Roughly 45% of all preschool‐age children and pregnant women with vitamin A deficiency live in the WHO regions of South‐East Asia, while Africa accounts for another 30% of cases (WHO 2009b). An analysis of trends of vitamin A deficiency showed a decline in the overall prevalence from 39% to 29% from 1991 to 2013, but Africa and South Asia had the least decline (Stevens 2015). Vitamin A deficiency alone is responsible for almost 6% of child deaths under the age of five years in Africa and 8% in South‐East Asia (WHO 2009a). It was estimated that in 2013, 1.7% of all deaths in children younger than five years were attributable to vitamin A deficiency (Stevens 2015).
Zinc
Zinc deficiency is considered to be associated with morbidity and mortality in low‐ and middle‐income countries. Severe zinc deficiency in children may cause short stature, impaired immune function and other disorders, and is a significant cause of respiratory infections, malaria and diarrhoeal disease (WHO 2002). Adequate zinc nutrition is essential for human health because of zinc’s critical structural and functional roles in multiple enzyme systems that are involved in gene expression, cell division and growth, and immunologic and reproductive functions (Hess 2009). Although there is very limited national‐ or first administrative‐level survey data on the prevalence of zinc deficiency, it has been estimated that zinc deficiency is responsible for approximately 4% of child mortality and DALYs (Black 2008). An estimated 17.3% of the global population is at risk of inadequate zinc intake. The regional estimated prevalence of inadequate zinc intake ranged from 7.5% in high‐income regions to 30% in South Asia. These country‐specific prevalences of inadequate zinc intake were calculated based on the estimated absorbable zinc content of the national food supply (Wessells 2012).
Folate
Inadequate intake is a leading cause of folate deficiency and insufficiency in the population although increased requirements from pregnancy or neoplastic diseases, malabsorptive conditions, use of antifolate drugs or other metabolic inhibitors can also cause folate deficiency (Bailey 2015). Inadequate periconceptional folate status and folic acid intake are associated with congenital malformations including neural tube defects (IOM 2003). Folic acid is a synthetic form of folate used in supplements and fortified foods (like wheat and maize flour) to reduce the occurrence of neural tube defects (NTDs). These defects include spina bifida (or cleft spine), where there is an opening in one or more of the bones (vertebrae) of the spinal column and anencephaly where the head (cephalic) end of the neural tube fails to close. It has been demonstrated through controlled studies that the risk of neural tube defects can be substantially reduced (risk ratio (RR) 0.31, 95% confidence interval (CI) 0.17 to 0.58; 5 studies, 6708 births; high‐certainty evidence) with daily folic acid supplementation, alone or in combination with other vitamins and minerals (De‐Regil 2015). The effectiveness of mandatory folic acid fortification in wheat flour programmes has also been documented by a decline in the prevalence of neural tube defects, in the USA, Canada, Costa Rica, Chile and South Africa (Berry 2010). In general, populations from lower socioeconomic status do not consume sufficient high‐folate‐content foods, and although their diets may be adequate in folate intake to preventing clinical deficiency (i.e. megaloblastic anaemia), they may be insufficient to reach red blood cell folate concentrations associated with optimal health and fetal development (i.e. greatest NTD risk reduction) in women of reproductive age, that is concentrations above 400 ng/mL (906 nmol/L) (WHO 2015b).
Other vitamins and minerals
In addition to iron, vitamin A, zinc and folate deficiencies, those of iodine, calcium, vitamin B12 and vitamin D impair health and development. For example, iodine deficiency is a major threat to the health and development of populations worldwide, particularly in preschool children and pregnant women, resulting in goitre, stillbirth and miscarriage, hypothyroidism, and impaired growth (Andersson 2012). Vitamin D deficiency (defined as low concentrations of serum 25‐hydroxyvitamin D) may be a common health problem worldwide (Bandeira 2006; Palacios 2014). A recent review found an important proportion of infants, children, adolescents, adults and older persons living in different countries with low serum vitamin D concentrations (Palacios 2014). These low concentrations were seen in all age groups, but in particular in girls and women from the Middle East. Vitamin D deficiency and/or perturbations of vitamin D metabolism; very low chronic calcium intake or a combination of both vitamin D deficiency and low chronic calcium intake, can cause nutritional rickets. Rickets is mostly associated with very low calcium intake in older children while in adolescents, the studies suggest that nutritional rickets is more associated with vitamin D deficiency (Munns 2016).
Intervention strategies for micronutrient malnutrition
Current recommended intervention strategies for the prevention and treatment of micronutrient deficiencies include either one or a combination of supplementation, food‐based approaches such as dietary diversification, mass food fortification or point‐of‐use food fortification; other public health control measures include deworming, health and nutrition education (Howson 1998; Zimmermann 2007; WHO 2011c). These strategies can be delivered through at least four platforms, the health systems, agriculture, market‐based, and social protection programmes (Olney 2012). Supplementation is still the most widely practiced intervention to control iron (WHO 2011b; WHO 2011d; WHO 2016) and vitamin A deficiencies in high‐risk populations (WHO 2011e).
Some adverse effects observed with high‐dose supplements, as well as active participation from users, may affect compliance and the long‐term sustainability of such programmes. Supplementation programmes (Baltussen 2004; Alderman 2007), usually face logistical and human‐resource constraints, such as bad road networks and generally fragile institutions, which may hinder their effectiveness, especially in low‐ and middle‐income countries where the intervention is needed most (Zimmermann 2007). In such cases, mass fortification of staple foods becomes an important option to combat vitamin and mineral deficiencies. There are fewer concerns related to mass food fortification and it can be a complementary intervention to supplementation for efforts to reduce vitamin and mineral deficiencies.
Meeting the recommended dietary intakes (WHO/FAO 2004), through the daily diet is desirable but not always possible for many populations. Poor dietary diversity and dependence on cereal‐based diets, which are common in low‐ and middle‐income countries, are major contributing factors to the high prevalence of micronutrient deficiencies (Welch 1999). Cereals, in addition to being poor sources of vitamins and minerals, also contain high quantities of other dietary compounds, such as phytates, which decrease the absorption of certain micronutrients, often called 'anti‐nutrients' (Graham 2001). For instance, iron and zinc absorption is significantly inhibited by phytic acid, present in cereals and other grains; polyphenols, contained in red wine and chocolate; or calcium, abundant in dairy products (Gibson 1998; Hurrell 2010; Kim 2011). On this basis, dietary bioavailability of iron has been estimated to be in the range of 14% to 18% for mixed diets and 5% to 12% for vegetarian diets.
Cereals, however, are overwhelmingly the major source of food supplies for direct human consumption. In 2014, around 2.5 billion tonnes of cereals were produced with roughly 1.1 billion tonnes (43%) used as food; around 900 million tonnes (35%) used as animal feed and the remaining 500 million tonnes were diverted to industrial usage or seed, or were wasted (FAO 2016). While rice is produced in vast areas of the world, the physical requirements for growing this crop are limited to certain zones. Rice is the primary staple for more than half the world’s population. Production and consumption is greatest in Asia (Muthayya 2014), and in recent years, it has also become an important staple in Africa (FAO 2012). About 741 million tonnes of rice (paddy) were harvested in 2014 (FAOSTAT 2016). The milled equivalent of rice produced is 490 million tonnes (FAO 2016).
Description of the intervention
Fortification is “the addition of one or more essential nutrients to a food, whether or not it is normally contained in the food, for the purpose of preventing or correcting a demonstrated deficiency of one or more nutrients in the general population or specific population groups" (Codex Alimentarius 1994). This process usually takes place during food processing by the food industry at a central level so that it reaches the intended population en masse and does not require the active participation of end users. While there are some different definitions for enrichment, for the purposes of this review, we used enrichment and fortification interchangeably.
Results of a study in Vietnamese school children showed that iron‐fortified rice noodles are efficacious in reducing anaemia and improving haemoglobin and iron status indicators (Huong 2006). In places where rice is a staple food, iron fortification has been shown to reduce the prevalence of iron‐deficiency anaemia from 100% to 33% among preschool age children (Angeles‐Agdeppa 2008), particularly when there is strong political support and intensive social marketing activities as well as efforts to keep the cost affordable (Angeles‐Agdeppa 2011). Zinc fortification of cereals can boost total zinc consumed daily and absorbed zinc in infants, young children and adults (Brown 2007). Although less frequent, fortification of wheat and maize flours with vitamin A has the technological and biological potential to palliate this deficiency (Klemm 2010). Perhaps the most well known area of micronutrient fortification is that of folic acid, in both wheat and maize flours, and its effect on the prevention of birth defects (WHA 2010). Well conducted studies from several countries have documented decreases of 26% to 42% in the occurrence of neural tube defect (NTD)‐affected births after implementation of national regulations mandating wheat flour fortification with folic acid (WHO 2009b). Food fortification brings together the benefit of energy, fat and protein, and the complementary roles of vitamins and minerals to enhance the stability and bioavailability of vitamins and minerals used to fortify foods (Best 2011). In addition, this strategy has a dual advantage of reaching a wider and larger proportion of the population than supplementation without requiring radical changes in food consumption patterns (Howson 1998).
Food fortification practices vary nationally. The choice of nutrients (in this context also known as fortificants) varies according to their bioavailability. In the case of iron, for instance, many compounds such as ferrous sulphate, ferrous fumarate, ferric pyrophosphate and electrolytic iron powder can be used in food fortification (WHO/FAO 2006). However, many cereal foods are fortified with low‐cost iron powders with absorption of iron lower than 2% (Hurrell 2010). For vitamin A fortification, retinyl palmitate and acetate are frequently used while the synthetic form of folic acid is used to improve folate status.
A concern expressed by a few people about food fortification is related to the possible toxicity of excessive vitamins and minerals among all groups, particularly those that are not at risk of deficiencies (Garcia‐Casal 2019). This is especially so with iron excess (Gordeuk 1987), which may affect the risk of colonic adenomas and cancer (Muthunayagam 2009), and a potentially more pathogenic gut microbiota that is associated with higher gut inflammation (Zimmermann 2010). Excess and chronic vitamin A intake during pregnancy has been shown to increase the risk of teratogenicity (Rothman 1995), and hip fracture (Penniston 2003). A hypothetical association between the prolonged consumption of folic acid‐enriched cereals and the increase in the incidence of colorectal cancer in the USA and Canada (Mason 2007), has been challenged with other studies where such an association has not been demonstrated (EFSA 2009). Another concern may relate to the possibility of over‐consumption of rice given the potential benefits of additional vitamins and minerals. As a public health intervention, the use of a vehicle would imply not encouraging the population to consume greater amounts of the 'fortified' rice. Higher consumption of white rice is associated with a significantly increased risk of type 2 diabetes, especially in Asian (Chinese and Japanese) populations (Hu 2012).
Micronutrient deficiencies of public health significance are all widespread in most high rice‐consuming countries (Juliano 1993; MIcronutrient Initiative/UNICEF 2004), and rice fortification has the potential to fill an obvious gap in current nutrition programmes and help aid vulnerable populations that are currently out of reach. A fundamental requirement in the adoption of food fortification as a public health intervention is the selection of the most appropriate and suitable food that will serve as a vehicle for the extra nutrients. It needs to be eaten in large amounts by the target population and be affordable and available all year round (Dexter 1998; WHO/FAO 2006). Although almost all foods can be fortified, cereals are widely grown, produced and consumed in low‐ and middle‐income countries (Welch 1999), making them important vehicles for fortification. Improving the micronutrient content of cereals or their subproducts could provide a sustainable solution to the worldwide problem of micronutrient deficiencies, particularly in populations where there is a marked social characterisation of eating habits (Prättälä 2012), and where the fortified foods will be reaching those in need of the vitamins and minerals. Poor children and their mothers systematically lag behind the better‐off in terms of mortality, morbidity and undernutrition. Evaluations of the equity impact of health programmes and nutrition interventions are scarce. There are, however, some results suggesting that innovative approaches can effectively promote equity through, for example, employing appropriate delivery channels; removing financial barriers; and monitoring implementation, coverage and impact with an equity lens. Mandatory fortification of staple foods being consumed by the most vulnerable segments of the populations would potentially provide vitamins and minerals to those in a vulnerable situation (WHO 2010), although it is clear that tackling inequities requires the involvement of various programmes and stakeholders, both within and outside the health sector, that can help address social determinants (WHO 2010).
How the intervention might work
Rice is a globally produced, milled and traded staple food with an annual production and consumption worldwide of about 490 million tonnes. It is the dominant staple food crop of around three billion people worldwide, providing up to 50% to 60% of their daily energy and protein intake (IRRI 2010). Rice is cultivated in almost all parts of the world as it can grow in a wide range of soil and environmental conditions (Juliano 1993). It is estimated that 90% of the world's rice is produced in Asia (Juliano 1993; Muthayya 2014). China and India consume 50% of the world's rice and per capita consumption is highest in Asia (Muthayya 2014). High consumption has been reported in Latin America and Caribbean countries as well as in sub‐Saharan Africa (Muthayya 2014). With its popularity, reach and quantum of consumption, rice far exceeds the requirements for adoption as a vehicle for food fortification for the purposes of a population‐level intervention.
Globally, the main rice processing method is milling. The process is aimed at producing a maximum yield of unbroken milled rice compared to flour or meal in other cereals (Dexter 1998). The process involves cleaning the paddy or rough rice (un‐hulled rice grain) and de‐hulling (removing hull, germ and bran layers) to produce brown rice (Dexter 1998). Brown rice consists of an average weight of 6% to 7% bran, 90% endosperm and 2% to 3% embryo (Saunders 1979). Further milling to remove the bran layer yields white rice. On average, paddy rice produces 25% hulls, 10% bran, and 65% white rice (Chen 1998). In some countries the milled white rice is coated with talc and glucose to improve its appearance (Dexter 1998). The various forms of rice are presented in Table 1. Milled white rice is low in vitamins and minerals as these vitamins (B vitamins) and minerals (iron) are found predominately in the germ and bran layers (Dexter 1998). Parboiling is one of the ways by which nutrients in the rice grain can be partially preserved. The parboiling process of soaking the rough rice, applying heat, drying and milling results in the transfer of nutrients to the inner endosperm layer from the bran before milling (Dexter 1998). Parboiling is expensive and the end product, referred to as ‘golden colour rice’, may not be readily acceptable to consumers (Dexter 1998). The different types rice are depicted in Table 1.
| Forms of rice | Description of rice |
| Rough rice (paddy rice) | Rice kernels still enclosed in an inedible, protective hull |
| Brown rice | Rice with only the hull removed. Bran layers and rice germ remain, giving the rice a brown colour |
| Parboiled rice | Rice pressurised to gelatinise the starch within the rice kernel, resulting in a firmer, more separate grain that is more stable and less susceptible to overcooking than regular‐milled white rice |
| Regular‐milled white rice (milled rice) | Polished whole rice, or polished rice. Hull, bran layer and germ have all been removed |
| Precooked rice | Regular milled white rice, parboiled milled white rice, and brown rice can be precooked and dehydrated before packaging. Examples of precooked rice are quick‐cooking rice, instant rice, and boil‐in‐the‐bag rice |
| Individually quick frozen (IQF) rice | Cooked grains are individually frozen before packaging |
| Crisped/puffed/expanded rice | Kernels can be processed in a number of different ways and shapes to meet particular manufacturing need |
Adapted from Dexter 1998.
Previous attempts to fortify rice by simply adding a micronutrient powder to the rice that adheres to the grains by electrostatic forces (dusting) have proven unsuccessful (Leon Guerrero 2009), due to the typical washing and cooking methods employed in most developing countries, which results in the rinsing away of the enrichment. Three more sophisticated methods have been developed to overcome this problem (A2Z Project 2008). Coating involves spraying of the surface of ordinary rice grains in several layers with a vitamin and mineral mix to form a protective coating that will not easily rinse off the surface when washed (Kyritsia 2011). The grains (fortified premix) contain high concentrations of vitamin and mineral fortificants and must be blended with natural rice (that is commonly 1 part fortified premix to 199 parts untreated milled rice) to produce fortified rice. The extrusion technology is a totally different concept in rice fortification. In hot extrusion, a dough made of rice flour, vitamin and mineral mix and water is passed through a single or twin screw extruder and shaped into partially precooked grain‐like structures resembling rice grains; that is then blended with natural polished rice at a ratio of about 1:200 to produce fortified rice. This process involves relatively high temperatures (70 to 110 °C) obtained by preconditioning or heat transfer through steam‐heated barrel jackets, or both. The cold extrusion follows a similar process at low temperature (below 70 °C) that does not primarily utilise any additional heat and produces uncooked, opaque fortified premix grains with a slightly softer consistency. This is then blended with natural polished rice at a ratio of about 1:200 to produce fortified rice.
Rice is a highly culturally‐sensitive commodity (Hariyadi 2011). Growing, selecting and cooking of rice grains are subject to regional, national and even local preferences. It is estimated that a large proportion of key vitamins and minerals are lost during milling (DSM/Buhler 2010). Additionally, rinsing and washing are common cooking methods which can potentially dissolve added or restored nutrients. There are many different ways of cooking rice. These are 1) soaking, and boiling with excess water; 2) boiling in excess water; 3) boiling without excess water; 4) rinsing and boiling without excess water; and 5) frying and boiling without excess water. The use of these cooking preparations could have different retentions of micronutrients in fortified rice kernels as some vitamins are sensitive to heat and others are water‐soluble (WHO/FAO 2006). Cultural preferences for specific types of rice characteristics may represent a barrier to mass fortification in some settings. A technical challenge is to produce fortified rice that resembles natural rice and resists normal meal preparation and cooking processes.
A study conducted as far back as 1948 in the Philippines demonstrated the effects of rice fortification in the prevention of beriberi (Salcedo 1950). In Brazil, a bioavailability study with vitamin A‐fortified rice showed an improvement in children's retinol levels (Flores 1994). Another study among young children from 6 to 24 months of age in Brazil found that rice fortified with micronized iron pyrophosphate was more effective than iron drops in decreasing anaemia from 100% to 62%, and iron deficiency from 69% to 25%, and improving iron status (Beinner 2010). In a study in India, fortified rice in school‐age children attending school showed a reduction of iron‐deficiency anaemia from 78% at baseline to 25% in the iron group (Moretti 2006a). In another setting, the feeding of rice fortified with microencapsulated, micronized iron pyrophosphate to improve the iron status of women in Mexico showed significant increases in plasma ferritin concentrations and estimated body iron stores as well as a significant decrease in plasma transferrin receptor concentrations. Fortified rice reduced the prevalence of anaemia by 80% and iron deficiency by 29% in Mexican women working in a factory (Hotz 2008).
This review attempts to evaluate, based on existing research, the effectiveness of rice fortification as a public health intervention. The World Health Organization and Centers for Disease Control and Prevention (WHO/CDC) logic model for micronutrient interventions in public health depicts the programme theory and plausible relationships between inputs and expected improvements in Sustainable Development Goals and can be adapted to different contexts (WHO/CDC 2016). The effectiveness of rice fortification in public health depends on several factors related to policies and legislation regulations; production and supply of the fortified rice; the development of delivery systems for the fortified rice; the development and implementation of external and internal food quality control systems; and the development and implementation of strategies for information, education and communication for behaviour change among consumers. A generic logic model for micronutrient interventions that depicts these processes and outcomes is presented in Figure 1.

WHO/CDC logic model for micronutrients interventions in public health (with permission from WHO)
The high consumption of polished rice as a staple food in many settings has been associated with an increased risk of diabetes and other chronic diseases although the results of the studies have been conflicting. One systematic review and meta‐analysis has been published with respect to polished rice and diabetes studies (Hu 2012), and another has been published with respect to rice and the incidence of chronic diseases including diabetes (Saneei 2017). The earlier meta‐analysis included four prospective cohort studies and found that higher white rice consumption was associated with increased risk of developing type‐2 diabetes in comparison with lower intake levels (relative risk 1.27 (95% CI 1.04 to 1.54; Hu 2012). This association was stronger for Asian (Chinese and Japanese) populations, although the dose‐response relations indicated that even for Western populations with typically low intake levels, white rice consumption may still modestly increase risk of diabetes. A more recent meta‐analysis (Saneei 2017), did not show an increased risk of diabetes with higher rice consumption due to an additional study from Spain (Soriguer 2013), which showed that a negative association was found between white rice intake and the six‐year incidence of diabetes. No disaggregation of the estimates was done in Saneei 2017 for origin of population but both Hu 2012 and Saneei 2017 showed an increased risk of diabetes or chronic diseases among women who consumed more rice. Rice fortification policies may have to take into account the possible increased risk of diabetes and other diseases with rice consumption and identify fortification levels targeting existing rice consumption levels as has been done for salt iodisation and salt reduction policies (WHO 2014). Additionally, the fortification of this staple food may affect acceptability of the fortified rice and thus potentially change dietary patterns (Khanh 2014).
Why it is important to do this review
Vitamin and mineral deficiencies are important public health concerns worldwide. Among the options to address these deficiencies, mass fortification represents an appealing intervention as it takes advantage of the existing market and delivery systems, does not require the active participation of vulnerable populations to increase food intake or diversify the diet, and has few safety concerns. Rice represents a suitable vehicle for fortification as it is considered a staple food in most of the world, especially in regions where micronutrient deficiencies are most evident.
Wheat and maize flour fortification with iron alone, or in combination with folic acid and other micronutrients, has been implemented in more than 50 countries (CDC 2008; WHO 2009b) and is showing promising results in reducing anaemia and neural tube defects (Centeno Tablante 2019; Garcia‐Casal 2018). Based on this experience, an increasing number of countries across the world are rapidly adopting fortification of rice as a means to fight malnutrition. Mandatory fortification of rice has been adopted in some countries, such as the Philippines, Costa Rica, Papua New Guinea and Nicaragua (GAIN 2010). Fortified rice is sold in China using a multi‐micronutrient formula and in Japan enriched rice has been on the market since 1981. The USA has a mandatory food standard for 'enriched rice', prescribing levels of thiamin, niacin, riboflavin, folic acid and iron to be added to rice for enrichment. Although this requirement only applies in order for rice to be labelled as 'enriched' (FDA 2001), 70% of the rice eaten in the USA is enriched or fortified (American Rice Inc 2004; A2Z Project 2008). In India, Brazil and Colombia, fortified rice is currently being distributed through public safety net programmes (Tsang 2016).
Despite this interest, to date there has been no systematic assessment of the benefits and harms of this intervention to inform policymaking and assist countries in the design and implementation of appropriate food‐fortification programmes, except for one systematic review carried out on interventions among children between 6 to 59 months (Hijar 2015). Rice fortification was concluded to be effective for correcting and improving iron deficiency in children aged under five years of age.
Objectives
To determine the benefits and harms of rice fortification with vitamins and minerals (iron, vitamin A, zinc or folic acid) on micronutrient status and health‐related outcomes in the general population.
Methods
Criteria for considering studies for this review
Types of studies
We included randomised controlled trials (RCTs). Such studies provide information on whether fortified rice is effective and can actually achieve changes in health and vitamin and mineral status for those receiving the intervention.
Food fortification is, however, an intervention that aims at reaching the entire population of a country or large sections of the population and is frequently delivered through the food system. Therefore we have also included data from other study designs.
In summary, we aimed to include the following study designs.
-
RCTs, with randomisation at either the individual or cluster level
-
Quasi‐RCTs (where allocation of treatment has been made, for example, by alternate allocation, date of birth, or alphabetical order)
-
Non‐randomised controlled trials
-
Observational studies that are prospective and report a kind of control group:
-
cohort studies (prospective and retrospective);
-
controlled before‐and‐after studies with at least two control and two intervention sites;
-
interrupted time series with at least three measure points both before and after the intervention.
-
We analysed results from controlled non‐randomised and observational study designs separately from randomised and quasi‐randomised study designs.
We did not consider before‐and‐after studies without a control group for inclusion in this review. Results from these studies are presented in a table but are not included in a meta‐analysis and do not directly inform the conclusions of the review. Such studies provide information on the implementation, feasibility and other contextual factors relating to the interventions under review. We did not include cross‐over trials.
Types of participants
General population older than two years of age (including pregnant women) from any country. We excluded studies of interventions targeted toward participants with a critical illness or severe co‐morbidities.
Types of interventions
Interventions in the review were those in which rice had been fortified with at least one micronutrient or a combination of several micronutrients (iron, folic acid, zinc, vitamin A or other vitamins and minerals) irrespective of the method of fortification technology used. Fortified rice, for the purposes of this review, refers to the addition of a micronutrient premix to ordinary rice using any rice fortification technologies, such as hot extrusion, cold extrusion, coating or dusting (A2Z Project 2008). We included studies with co‐interventions, that is, fortified rice with education, if the comparison group also received the education component in addition to the unfortified rice.
Comparisons include the following.
-
Rice fortified with iron alone or in combination with other micronutrients versus unfortified rice (no micronutrients added)
-
Rice fortified with iron alone or in combination with other micronutrients versus no intervention
-
Rice fortified with vitamin A alone or in combination with other micronutrients versus unfortified rice (no micronutrients added)
-
Rice fortified with vitamin A alone or in combination with other micronutrients versus no intervention
-
Rice fortified with zinc alone or in combination with other micronutrients versus unfortified rice (no micronutrients added)
-
Rice fortified with zinc alone or in combination with other micronutrients versus no intervention
-
Rice fortified with folic acid alone or in combination with other micronutrients versus unfortified rice (no micronutrients added)
-
Rice fortified with folic acid alone or in combination with other micronutrients versus no intervention
If studies examined the effects of two or more nutrients along with iron, we included them in the first comparison only to avoid duplication. If the studies had micronutrients in their fortification arms without iron, we included them in the further comparisons.
We excluded studies comparing rice fortification with other forms of micronutrient interventions (i.e. supplementation or dietary diversification) or the fortification of other food vehicles. We also excluded in‐vitro studies and those examining the effect of bio‐fortified rice (nutrient‐dense staple crops of rice using conventional breeding practices and modern biotechnology).
Types of outcome measures
Primary outcomes
The primary outcomes across all populations in this review were the presence of anaemia, iron deficiency, haemoglobin concentrations and adverse effects.
-
Anaemia (defined as haemoglobin (Hb) below the WHO cut‐off, adjusted for altitude as appropriate (WHO 2011a), or as defined by the study authors)
-
Iron deficiency (as defined by study authors, based on a biomarker of iron status)
-
Haemoglobin concentration (g/L)
-
Vitamin A deficiency (as defined by study authors, by using a biomarker; only for vitamin A‐fortified rice as intervention)
-
Serum or plasma folate (nmol/L) (only for folic acid‐fortified rice as intervention)
-
Any adverse effects (as defined by study authors)
Additional primary outcomes of interest differed by participant group, as listed below.
Children (2 to 11.9 years of age)
-
Diarrhoea (as defined by study authors)
-
Respiratory infections (as defined by study authors)
-
All‐cause death
Pregnant women
-
Congenital anomalies (neural tube defect, cleft lip, cleft palate, congenital cardiovascular defects and others as defined by study authors; only for folic acid‐fortified rice as intervention)
-
Miscarriage
Secondary outcomes
Secondary outcomes included the following.
-
Serum or plasma retinol (µmol/L) (only for vitamin A‐fortified rice as intervention)
-
Serum or plasma zinc (µmol/L)
-
Anthropometric measures (height‐for‐age Z‐score and weight‐for‐height Z‐score for children, body mass index (BMI) for adults)
-
Risk of iron overload (defined by serum ferritin higher than 150 µg/L in women and higher than 200 µg/L in men)
-
Clinical malaria (as defined by study authors)
-
Severe malaria (as defined by study authors)
-
Night blindness (defined as the reported inability to see after dusk by people who typically report having normal vision during the day; only for vitamin A‐fortified rice as intervention)
For those studies that delivered the intervention at the first administrative level or higher (i.e. non‐randomised studies) we examined the same variables at an ecological level (for example prevalence of anaemia or congenital anomalies rates).
Search methods for identification of studies
Electronic searches
We searched the following international and regional sources.
International databases
-
Cochrane Central Register of Controlled Trials (CENTRAL; Issue 7 2012 to Issue 12 2018) via Cochrane Register of Studies Online (CRSO)
-
MEDLINE (OVID; 1948 to 10 December 2018)
-
Embase (OVID; 1980 to 10 December 2018)
-
CINAHL EBSCOhost (1937 to 10 December 2018)
-
Web of Science (ISI) SCI, SSCI, CPCI‐exp & CPCI‐SSH (until 10 December 2018)
-
POPLINE (www.popline.org/; 10 December 2018)
-
AGRICOLA (Ebsco; 10 December 2018)
-
ClinicalTrials.gov (searched 10 December 2018)
-
WHO International Clinical Trials Registry Platform (ICTRP; apps.who.int/trialsearch; searched 10 December 2018)
-
BIOSIS (ISI; 2012 to 10 December 2018)
Regional databases
-
IBECS (ibecs.isciii.es; searched 10 December 2018)
-
SciELO (Scientific Electronic Library Online; www.scielo.br; searched 10 December 2018)
-
African Index Medicus (AIM; www.globalhealthlibrary.net/php/index.php?lang=en; searched 10 December 2018)
-
Index Medicus for the Eastern Mediterranean Region (IMEMR; www.globalhealthlibrary.net/php/index.php?lang=en; searched 10 December 2018)
-
LILACS (Latin American and Caribbean Health Sciences Literature; lilacs.bvsalud.org/en; searched 10 December 2018)
-
PAHO (Pan American Health Library; www1.paho.org/english/DD/IKM/LI/library.htm; searched 10 December 2018)
-
WHOLIS (WHO Library; dosei.who.int/; searched 10 December 2018)
-
WPRIM (Western Pacific Region Index Medicus; www.wprim.org/; searched 10 December 2018)
-
Index Medicus for the South‐East Asia Region (IMSEAR; imsear.hellis.org; searched 10 December 2018)
-
IndMED, Indian medical journals; medind.nic.in/imvw/; searched to 10 December 2018)
-
Native Health Research Database; hslic‐nhd.health.unm.edu; searched to 10 December 2018)
For these sources, we searched WorldCat, Networked Digital Library of Theses and Dissertations, DART‐Europe E‐theses Portal, Australasian Digital Theses Program, Theses Canada Portal and ProQuest‐Desertations and Theses.
We handsearched the five journals with the highest number of included studies in the last 12 months to capture any article that may not have been indexed in the databases at the time of the search. As rice fortification technologies are relatively novel we limited the search, from 1960 to present, for all databases, although some had no time restrictions.
We contacted Cochrane Public Health's Information Specialist to search the Cochrane Public Health Group Specialised Register. The search used keyword and controlled vocabulary (when available), using the search terms set out in the Appendices and adapting them as appropriate for each database (see Appendix 1).
We did not apply any language restrictions. If we identified articles written in a language other than English, we commissioned their translation into English. If this was not possible, we sought advice from Cochrane Public Health. We stored these articles in the 'Awaiting assessment' section of the review until a translation is available.
Searching other resources
For assistance in identifying ongoing or unpublished studies, we contacted the Department of Nutrition for Health and Development and WHO regional offices, the nutrition section of the United Nations Children's Fund (UNICEF), the World Food Programme (WFP), the US Centers for Disease Control and Prevention (CDC), US Agency for International Development (USAID) micronutrient programme, Nutrition International, the Global Alliance for Improved Nutrition (GAIN), Hellen Keller International (HKI), Sight and Life Foundation, PATH, the Wright Group, premix producers DSM and BASF, Food Fortification Initiative (FFI) and the Rice Fortification Resource Group (March 2019).
Data collection and analysis
Selection of studies
Two review authors (JPP, PM) independently screened the titles and abstracts of articles retrieved by each search to assess initial eligibility. After the initial screening, we then retrieved full copies of all eligible papers and screened them for eligibility as determined by the inclusion and exclusion criteria listed above. When we were unable to reject a title or abstract with certainty, we obtained the full text of the article for further evaluation. If we could not obtain full articles, we attempted to contact the study authors to obtain further details of the study. Failing this, we classified studies as 'awaiting assessment' until further information is published or made available to us. We resolved disagreements at any stage of the eligibility assessment process through discussion and consultation with two other review authors (SN, LMR), where necessary.
Data extraction and management
Two review authors independently extracted data in duplicate using customised data extraction forms based on those from Cochrane Handbook (Higgins 2019), Cochrane Public Health (Cochrane PHG 2010), and Cochrane Effective Practice and Organisation of Care (EPOC 2017).
All review authors were involved in piloting the form using a subset of articles in order to enhance consistency amongst review authors; based on this, we modified the form as necessary. We collected information on study design, study setting, participants (number and characteristics) and provided a full description of the interventions examined. We extracted details of outcomes measured (including a description of how and when outcomes were measured) and results.
Two review authors (JPP, LMR) designed the form, so that we were able to record results for our prespecified outcomes as well as for other non‐specified outcomes, although we did not use such outcomes to underpin any of our conclusions. We also extracted additional items relating to study recruitment and the implementation of the intervention, including number of sites for an intervention, whether recruitment was similar at different sites, levels of compliance and use of rice in different sites within studies, resources required for implementation, and whether studies had conducted a process evaluation. We also recorded whether or not studies included specific strategies to address diversity or disadvantage. We used the PROGRESS (place of residence, race/ethnicity, occupation, gender, religion, education, socioeconomic status, capital) checklist to collect information on whether or not studies had reported data by sociodemographic characteristics known to be important from an equity perspective (Ueffing 2011).
Two review authors (JPP, JAS) entered data into Review Manager 5 software and checked for accuracy (Review Manager 2014).
Assessment of risk of bias in included studies
We used the EPOC 'RIsk of bias' tool for studies with a separate control group to assess the risk of bias of all studies at study level for primary outcomes (EPOC 2017). This tool includes five domains of bias: selection, performance, attrition, detection and reporting; as well as an 'other bias' category to capture other potential threats to validity.
Two review authors independently assessed risk of bias in duplicate (JPP, PM) for each study and resolved any disagreement by discussion or by involving an additional review author (SN).
Assessing risk of bias in randomised trials and quasi‐randomised trials
1. Sequence generation (checking for possible selection bias)
We assessed studies as:
-
low risk of bias if there is a random component in the sequence generation process (e.g. random number table; computer random number generator);
-
high risk of bias if a non‐random approach has been used (e.g. odd or even date of birth; hospital or clinic record number). Non‐randomised studies should be scored 'high';
-
unclear risk of bias if not specified in the paper.
2. Allocation concealment (checking for possible selection bias)
We assessed studies as:
-
low risk of bias if participants and investigators enrolling participants could not foresee assignment because an appropriate method was used to conceal allocation (e.g. telephone or central randomisation; consecutively numbered sealed opaque envelopes). We gave this rating to studies where the unit of allocation was by institution and allocation was performed on all units at the start of the study;
-
high risk of bias if participants of investigators enrolling participants could possibly foresee assignments and potentially introduce selection bias (e.g. open random allocation; unsealed or non‐opaque envelopes);
-
unclear.
3. Similarity of baseline outcome measurements (checking for confounding, a potential consequence of selection bias)
We assessed studies as:
-
low risk of bias if outcomes were measured prior to the intervention, and no important differences were present across intervention groups;
-
high risk of bias if important differences in outcomes between groups were present prior to intervention and were not adjusted for in the analysis;
-
unclear risk of bias if there was no baseline measure of outcome (note: if 'high' or 'unclear' but there is sufficient information to do an adjusted analysis, the assessment should be 'low').
4. Similarity of baseline characteristics (checking for confounding, a potential consequence of selection bias)
We assessed studies as:
-
low risk of bias if baseline characteristics are reported and similar across intervention groups;
-
high risk of bias if baseline characteristics are not reported or if there are differences across groups;
-
unclear risk of bias if it is not clear (e.g. characteristics mentioned in text but no data presented).
5. Incomplete outcome data (checking for possible attrition bias through withdrawals, dropouts and protocol deviations)
We assessed outcomes in each included study as:
-
low risk of bias due to incomplete outcome data, which could be either that there were no missing outcome data or the missing outcome data were unlikely to bias the results based on the following considerations: study authors provided transparent documentation of participant flow throughout the study, the proportion of missing data was similar in the intervention and control groups, the reasons for missing data were provided and balanced across the intervention and control groups, the reasons for missing data were not likely to bias the results (e.g. moving house).
-
high risk of bias if missing outcome data was likely to bias the results. Studies will also receive this rating if an 'as‐treated' (per protocol) analysis is performed with substantial differences between the intervention received and that assigned at randomisation, or if potentially inappropriate methods for imputation have been used;
-
unclear risk of bias.
6. Blinding (checking for possible performance and detection bias)
We assessed the risk of performance bias associated with blinding as:
-
low, high or unclear risk of bias for participants;
-
low, high or unclear risk of bias for personnel.
We assessed the risk of detection bias associated with blinding as:
-
low, high or unclear risk of bias for outcome assessors.
Whilst assessed separately, we combined the results in a single evaluation of risk of bias associated with blinding as follows:
-
low risk of bias if there was blinding of participants and key study personnel and it was unlikely to have been broken, or the outcomes are objective. This rating will also be given to studies where either participants and key study personnel were not blinded but outcome assessment was blinded and the non‐blinding of others was unlikely to introduce bias;
-
high risk of bias if there was no blinding or incomplete blinding or if there was blinding that was likely to have been broken and the outcome or outcome assessment was likely to be influenced by a lack of blinding;
-
unclear risk of bias.
7. Contamination (checking for possible performance bias)
We assessed studies as:
-
low risk of bias if allocation was by community, institution or practice and it is unlikely that the control group received the intervention;
-
high risk of bias if it is likely that the control group received the intervention;
-
unclear risk of bias if it is possible that contamination occurred but the risk of this happening is not clear.
8. Selective reporting bias
We assessed studies as:
-
low risk of bias if it is clear, either by availability of the study protocol or otherwise, that all prespecified outcomes that are of interest in the review have been reported;
-
high risk of bias if it is clear that not all of the study's prespecified outcomes have been reported, or reported outcomes were not prespecified (unless justification for reporting is provided), or outcomes of interest are reported incompletely and cannot be used, or where one or more of the primary outcomes is reported using measurements or analysis methods that were not prespecified, or finally if the study report fails to include an important outcome that would be expected to have been reported;
-
unclear risk of bias.
9. Other sources of bias
Other possible sources of bias were described for each included study and a rating of low, high or unclear risk of bias was given for this item.
In addition to the above criteria, we also assessed cluster‐RCTs with the following criteria:
1. Recruitment bias
We assessed studies as:
-
low risk of bias if individuals were recruited to the study before the clusters were randomised;
-
high risk of bias if individuals were recruited to the study after the clusters were randomised;
-
unclear risk of bias.
2. Baseline imbalance
We assessed studies as:
-
low risk of bias if baseline characteristics were reported and were similar across clusters or if study authors used stratified or pair‐matched randomisation of clusters;
-
high risk of bias if baseline characteristics were not reported or if there were differences across clusters;
-
Unclear risk of bias.
3. Loss of clusters
We assessed studies as:
-
low risk of bias if no complete clusters were lost or omitted from the analysis;
-
high risk of bias if complete clusters were lost or omitted from the analysis;
-
unclear risk of bias.
4. Incorrect analysis
We assessed studies as:
-
low risk of bias if study authors appropriately accounted for clusters in the analysis or provided enough information for review authors to account for clusters in the meta‐analysis;
-
High risk of bias if study authors did not appropriately account for clusters in the analysis or did not provide enough information for review authors to account for clusters in the meta‐analysis;
-
Unclear risk of bias.
5. Compatibility with individual RCTs
We assessed studies as:
-
low risk of bias if effects of the intervention were likely not altered by the unit of randomisation;
-
high risk of bias if effects of the intervention were likely altered by the unit of randomisation;
-
unclear risk of bias.
Overall risk of bias
For all included studies, we summarised the overall risk of bias by primary outcome within each study at the study level. Studies at high risk of bias were those with high or unclear risk of bias in the following domains: allocation concealment, similarity of baseline outcome measurements, and incomplete outcome data. We judged the overall risk of bias of each study as 'low' if we had assessed all three domains at low risk; and 'high' when we had assessed one or more of the domains at either high or unclear risk. Judgements took into account the likely magnitude and direction of bias and whether it was likely to impact on the findings of the study.
Measures of treatment effect
For dichotomous outcomes we have presented proportions, and for two‐group comparisons we have presented results as average risk ratio (RR) with 95% confidence interval (CI). We have reported results for continuous outcomes as the mean difference (MD) with 95% CI if studies measured outcomes in the same way. Where some studies reported endpoint data and others reported changes from baseline data (with errors), we combined these in the meta‐analysis if the outcomes had been reported using the same scale. We used standardised mean difference (SMD) with 95% CI to combine studies that measured the same outcome (for example haemoglobin) but used different methods.
For studies with multiple arms reporting a continuous variable as an outcome, we calculated the weighted average for single pair‐wise results in the meta analysis.
Unit of analysis issues
Cluster‐randomised trials
We combined results from both cluster‐randomised and individually randomised studies if there was little heterogeneity between the studies. We labelled cluster‐randomised trials with a 'C'. If the authors of cluster‐randomised trials had conducted their analyses at a different level to that of allocation, and they had not appropriately accounted for the cluster design in their analyses, we calculated studies' effective sample sizes to account for the effect of clustering in the data. We utilised the intra‐cluster correlation coefficient (ICC) derived from the study (if available) or from another source (for example using the ICCs derived from other, similar studies) (Adams 2004; Gulliford 1999), and then calculated the design effect with the formula provided in theCochrane Handbook for Systematic Reviews of Interventions (Higgins 2011). We reported this and undertook sensitivity analysis to investigate the effect of variations in ICC.
We made an adjustment in the number of participants for design effect for both the continuous outcome of haemoglobin concentrations and dichotomous outcomes of anaemia, iron deficiency and vitamin A deficiency in two studies (Parker 2015 (C); Perignon 2016 (C). We used the design effect calculated for anaemia for calculating the total number of participants in iron deficiency, vitamin A deficiency and haemoglobin concentration. We used the mean and standard deviations of haemoglobin concentration in the analysis without making any changes. The details of adjustments for design effect in each of the studies are provided in Characteristics of included studies.
Studies with more than two treatment groups
If we identified studies with more than two intervention groups (multi‐arm studies), where possible we combined groups to create a single pair‐wise comparison or used the methods set out in the Cochrane Handbook for Systematic Reviews of Interventions to avoid double counting study participants (Higgins 2011). If two or more study arms shared the control group, we divided the control group over the number of relevant subgroup categories to avoid double counting the participants (for dichotomous data, we divided the events and the total population while for continuous data we assumed the same mean and standard deviation but divided the total population). The details are described in the Characteristics of included studies tables.
Dealing with missing data
We noted missing outcome data and levels of attrition for included studies on the data extraction form. We explored the impact of including studies with high levels of missing data in the overall assessment of treatment effect by using sensitivity analysis. The denominator for each outcome in each study was the number randomised minus any participants whose outcomes we knew to be missing. For missing summary data, we contacted lead study authors for clarification or, if possible, we estimated missing summary data using other statistical information (for example confidence intervals, standard errors) provided in the primary paper and imputed the standard deviation either from other studies in the same systematic review or from studies in another systematic review.
Assessment of heterogeneity
We examined forest plots from a meta‐analysis to visually determine the level of heterogeneity (in terms of the size or direction of treatment effect) between studies. We used Tau², I² statistic (Higgins 2003) and Chi² statistic to quantify the level of heterogeneity among the studies in each analysis (Deeks 2017). We regarded substantial or considerable heterogeneity as Tau² greater than 0 and either I² statistic greater than 30% or a low P value (< 0.10) in the Chi² test. We noted this in the text and explored it using prespecified subgroup analyses mentioned below. Caution was taken in the interpretation of those results with high levels of unexplained heterogeneity.
Assessment of reporting biases
Where we suspected reporting bias (see 'Selective reporting bias' above) we attempted to contact study authors asking them to provide missing outcome data. Where this was not possible, and we thought that the missing data would introduce serious bias, we explored the impact of including such studies in the overall assessment of results by a sensitivity analysis.
We did not anticipate that there would be sufficient studies contributing data for any particular outcome for us to examine possible publication bias; if more than 10 studies reporting the same outcome of interest were available, we planned to generate funnel plots in Review Manager 2014 and visually examine them for asymmetry. Where we pooled studies in a meta‐analysis we ordered studies in terms of weight so that a visual examination of forest plots might allow us to assess whether the results from smaller and larger studies were similar or if there were any apparent differences according to study size.
Data synthesis
We carried out a meta‐analysis to provide an overall estimate of treatment effect when more than one study examined the same intervention, provided that studies used similar methods and measured the same outcome in similar ways in similar populations. We used a random‐effects model meta‐analysis for combining data as we anticipated that there might be natural heterogeneity between studies attributable to the difference. We used narrative synthesis, guided by the data extraction form in terms of the ways in which studies were grouped and summarised, to describe the outcomes, explore intervention processes, and describe the impact of interventions by sociodemographic characteristics known to be important from an equity perspective based on the PROGRESS framework, where this information was available.
We did not combine results from randomised and non‐randomised trials together in a meta‐analysis, and we have not presented pooled estimates for non‐randomised studies with different types of study design. We have reported the results of the controlled before‐and‐after studies in narrative form.
Assessing the certainty of evidence
For the assessment across studies, we used MECIR (Methodological Expectations of Cochrane Intervention Reviews) conduct standards (MECIR 2018), and we employed the GRADE approach to interpret findings (Langendam 2013). The GRADE profiler (GRADEpro GDT 2015) allowed us to import data from Review Manager 2014 to create 'Summary of findings' tables. For each of the outcomes, two review authors (JPP, MNGC) assessed the certainty of evidence of included studies independently, using the GRADE approach (Balshem 2011). We have listed the primary outcomes for each comparison with estimates of relative effects along with the number of participants and studies contributing data for those outcomes. These tables provide outcome‐specific information concerning the overall certainty of evidence from studies included in the comparison, the magnitude of effect of the interventions examined, and the sum of available data on the outcomes we considered. We included only primary outcomes in the 'Summary of findings' tables. We prepared 'Summary of findings' tables for the comparisons including rice fortified with iron alone versus unfortified rice, vitamin A alone or in combination with other micronutrients versus unfortified rice, zinc alone or in combination with other micronutrients versus unfortified rice, and folic acid alone or in combination with other micronutrients versus unfortified rice. The outcomes included in these were anaemia, iron deficiency, haemoglobin concentration, vitamin A deficiency, diarrhoea, respiratory infections, all‐cause death, and any adverse effects (see summary of findings Table for the main comparison; summary of findings Table 2).
For assessments of the overall certainty of evidence for each outcome that included pooled data from included studies from RCTs only, we downgraded the evidence from 'high certainty' by one level for serious (or by two for very serious) study limitations (risk of bias), indirectness of evidence (due to the use of different cut‐offs, for example), serious inconsistency, imprecision of effect estimates or potential publication bias. Data from observational studies started at low certainty. This assessment was limited only to the studies included in this review and as we did not consider there was a serious risk of publication bias, we did not downgrade in this domain.
Subgroup analysis and investigation of heterogeneity
Where possible we conducted subgroup analysis to explore heterogeneity according to the following subgroups.
-
Micronutrient content: single nutrient versus two or more nutrients
-
Rice fortification method: hot extrusion versus cold extrusion versus coating versus dusting
-
Cooking method most commonly used in study setting (as reported): soaking, and boiling with excess water versus boiling in excess water versus boiling without excess water versus rinsing and boiling without excess water versus frying and boiling without excess water versus unknown/unreported
-
Public health significance of anaemia at baseline in the target group: not a problem (lower than 5%) versus mild and moderate (5% to 39.9%) versus severe (40% and more) versus mixed/unknown/unreported
-
Malaria endemicity at the time that the study was conducted: some malaria risk setting versus malaria‐free area versus unknown/unreported malaria setting.
We examined differences between subgroups by visual inspection of the CIs; non‐overlapping CIs suggesting a statistically significant difference in treatment effect between the subgroups. We also used the approach of Borenstein 2008 to formally investigate differences between two or more subgroups. We conducted analyses in RevMan 5 (Review Manager 2014). We limited this analysis to those outcomes for which three or more studies contributed data.
Sensitivity analysis
We carried out sensitivity analysis to examine the effects of removing studies at high risk of bias (those with high or unclear risk of bias for allocation concealment, similarity of baseline outcome measurements, incomplete outcome data) from the meta‐analysis. For cluster‐randomised trials, we carried out sensitivity analysis using a range of ICC on overall effect estimate and have reported these effects.
Results
Description of studies
Results of the search
Our search strategy identified 28,730 references (22,147 references after removing duplicates) for possible inclusion. We screened a total of 58 full‐text articles for potential inclusion for the analyses. We included 17 studies (28 records). We excluded 22 studies (28 records) with reasons and identified two ongoing or unpublished studies (NCT02714075; NCT03056625). All 17 included studies were reported in English. We have summarised the study selection process in Figure 2. Of the 17 studies, 12 RCTs contributed to the meta‐analysis.
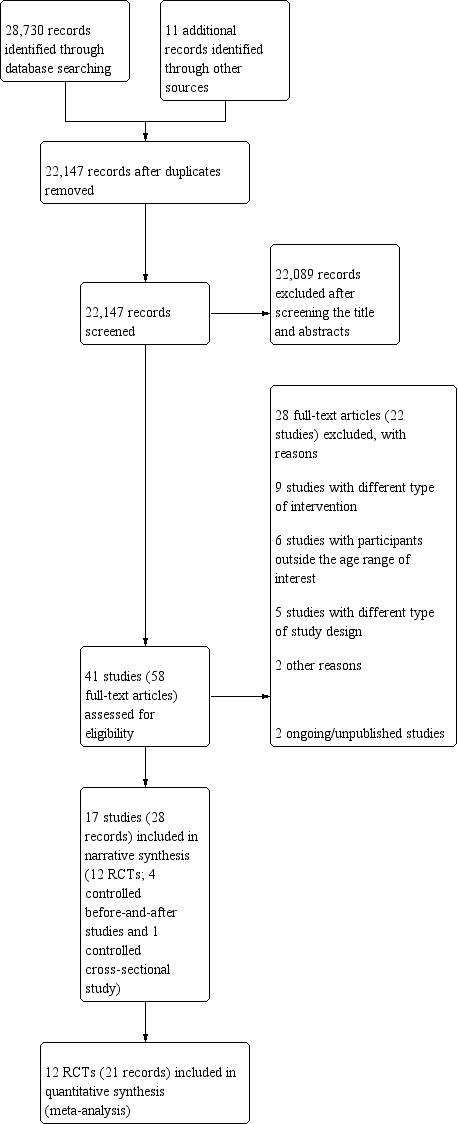
PRISMA study flow diagram
Included studies
We have presented the details of included studies, including participants, interventions, outcomes, source of funding, and results of contact with the study authors, in the Characteristics of included studies. We have given a summary of the general characteristics of the included studies in Table 2. Twelve studies were reported from Asian countries (Angeles‐Agdeppa 2008; Ara 2019; Gershoff 1977; Hardinsyah 2016; Hussain 2014; Moretti 2006b; Perignon 2016 (C); Pinkaew 2013; Pinkaew 2014; Radhika 2011; Salcedo 1950; Thankachan 2012), two from Brazil (Della Lucia 2016; Nogueira Arcanjo 2013), one from Mexico (Hotz 2008), one from the USA (Louisiana; Losso 2017) and one study from Burundi (Parker 2015 (C)). The PROGRESS‐Plus framework characteristics are given in Table 3. Each of the 17 included studies had different levels of micronutrient concentrations per 100 grams of uncooked rice, and we have given details of the micronutrient fortification profile in Table 4.
| Study and year (Country) | Participants | Type of rice fortification and dosage | Duration of intervention | Overall risk of bias |
| RCTs (individual randomisation) | ||||
| (Philippines) | 180 anaemic children aged 6‐9 years excluding severe anaemia (Hb < 70 g/L), history of blood disorders and other haemoglobinopathies |
| 6 months | High |
| (Indonesia) | 200 post‐menarchal adolescent girls 14‐18 years of age attending boarding school |
| 4 months | High |
| (Mexico) | 180 non‐pregnant, non‐lactating women 18‐49 years of age with moderate to low Hb concentrations from 6 factories |
| 6 months | High |
| (India) | 222 iron‐ and vitamin A‐depleted children 5‐8 years of age attending a subsidised lunch feeding programme |
| 6 months | High |
| (USA) | 17 menstruating women with iron‐deficiency anaemia |
| 2 weeks | High |
| (India) | 184 iron‐depleted children aged 6‐13 years from a primary school serving the Rock‐Colony neighbourhood |
| 7 months | Low |
| (Thailand) | The study was conducted in 8 primary schools with children aged 4‐12 years and they were mainly from low‐income families. |
| 5 months | High |
| (Thailand) | One primary school in the Muang district, of Thailand with children aged 8‐12 years, were the study participants |
| 2 months | High |
| (India) | 140 children aged between 5 and 11 years (with haemoglobin > 70 g/L) |
| 8 months | Low |
| (India) | Total of 258 anaemic (Hb concentrations 115 g/L for 6–11 years and 120 g/L for 12 years) children attending 4 primary schools aged 6‐12 years |
| 6 months | High |
| RCTs (cluster randomisation) | ||||
| (Burundi) | The study included 1071 children from 12 schools in Burundi aged between 7 and 11 years |
| 7 months | High |
| (Cambodia) | The study was a double‐blind cluster‐randomised, placebo‐controlled trial conducted among a total of 2440 school‐going children aged 6‐16 years. |
| 6 months | High |
| Non‐randomised studies (controlled before‐and‐after studies) | ||||
| (Bangladesh) | 870 women aged 15‐49 years excluding severe anaemia (435/group) at baseline and 800 (400/group) at end line |
| 12 months | High |
| (Brazil) | 131 non‐anaemic children between 2 and 6 years old, of both genders, participated in the study. |
| 4 months | High |
| (Thailand) | 2250 children aged 1.5‐9 years from 29 villages |
| 4 years | High |
| (Brazil) | 303 children 2‐5 years of age attending 2 public schools in City of Sobral‐Ceará, in the northeast of Brazil, between August and December 2010 |
| 18 weeks | High |
| Non‐randomised studies (controlled cross‐sectional study) | ||||
| (Philippines) | 574 children aged between 3 and 18 years 2188 Government employees with their families 1416 military personnel (clinical assessment limited to 350 in the experimental group and 116 in the control group) |
| 8 months | High |
| CBA: controlled before‐and‐after study; Hb: haemoglobin; RCT: randomised controlled trial | ||||
| Study | Place | Race/ethnicity | Occupation | Gender | Religion/ culture/education | Socio‐economic status | Social status | Others/ disability/ age/ sexual orientation | Overall PROGRESS‐Plus |
| Metro Manila, Division Pasig; Philippines | No specific mention, apart from the locality of the school in the capital city | School children | Male 99 + female 81 | No religion mentioned; children going to San Joaquin Elementary School (public) | Not mentioned | Not mentioned | Anaemic children; sexual orientation not mentioned | This study was carried out among 180 anaemic children going to a government elementary school. | |
| Vulnerable Group | Not mentioned specifically, however, they were the local resident women. | It included professional workers, | Non‐pregnant women aged 15‐49 years | No religion mentioned; nearly 25% without any education | No direct estimate provided; however, most of the study participants were from lower socioeconomic strata | Not mentioned | Women with severe anaemia were excluded. Sexual orientation is not mentioned | The study was carried out among 870 women of reproductive age and local residents of Bangladesh | |
| Brazil | Not specified | School‐going children | No religion mentioned, attending philanthropic schools | Not mentioned | Not mentioned | Children, 2‐6 years old | This study was carried out in 2 public schools among non‐anaemic children 2‐6 years of age during 4 consecutive months. | ||
| Chiang Mai villages in tile valley of the Ping River, Thailand | Thai children | Children in the community | Male 1121 + female 1109 | No religion mentioned. Children in the study villages | Not mentioned | Low/middle | Normal children; sexual orientation not mentioned | The study included 2230 children attending pre‐school and school from the low/middle social background | |
| Medan of North Sumatra Province, Indonesia | The majority of participants' ethnicity was Javanese and Bataknese | Teenage girls attending boarding school | Female | There is mention of the Ramadan fasting month during the second week of June | The family income ranges from 4.9 million to 5.5 million Rupiahs (Approximately 340 to 390 US Dollars) | Not mentioned | Age 14‐18 years of age | This study was carried out among post‐menarchal adolescent girls attending boarding school in Indonesia. The study lasted 4 months. | |
| Morelos State, Mexico | Mexican women | Factory workers | Women only | No religion mentioned; 18‐49 years | Low/middle school | Low/middle | Anaemic women; sexual orientation not mentioned | This study included women with altitude‐adjusted Hb concentrations between 105 | |
| India | Iron and vitamin A‐depleted 5‐8‐year‐old children attending a subsidised lunch feeding programme | Children attending a school‐based feeding programme | Not specified | Not reported | Not reported | Not mentioned, although programme is subsidised | 5‐8 years of age | This study included 222 children aged 5‐8 years attending a school where there was a subsidised lunch feeding programme in India receiving a 200‐250 g meal of cooked rice daily. | |
| Baton Rouge, USA | In the iron‐fortified group: 4 white, 3 black or African‐American, 1 Asian, 1 other; in the unfortified rice group: 3 white, 2 black or African American, 1 Asian | Women only | Not reported | Not mentioned | Not mentioned | 18‐50 years of age | This study included women with iron‐deficiency anaemia recruited through web and phone interviews and then in a clinic. | ||
| Franciscan primary school serving the | Indian | School‐going children | Not mentioned | 6‐13 years | Low | Low | Children with iron deficiency; sexual orientation not mentioned | Study included children having iron deficiency from an urban slum neighbourhood in India, belonging to low socioeconomic status and low social class | |
| Public schools in City of Sobral‐Ceará, in the northeast of Brazil | Not reported | School‐going children | Fortified rice group: 65 male: 73 female; unfortified rice group: 79 male: 86 female | 2‐5 years of age | Not reported. Family income 300 USD or less (it is unclear if this is weekly or monthly income ‐ not reported). 126/138 participants from iron‐fortified group versus 154/165 participants from unfortified group. | Not mentioned | Children 2‐5 years of age. Other information not reported | This before‐and‐after study included children 2‐5 years of age from 2 public schools in northeast Brazil receiving the school lunch programme and the fortified/unfortified intervention once a week. | |
| The study was carried out in Muyinga Province in Burundi catering to mainly agrarian population | Burundians | School‐going children | Female: 51.1% in intervention arm, 55.3% in control arm | Religion was not mentioned. 7‐11 years | Mean socioeconomic status score quintile = 3.03 (1.45) for intervention arm and 2.97 (1.37) for control arm | Not mentioned | Children with Hb level 70‐110 g/L and those who had not taken any nutritional supplements during the past 1 month since commencement of the study were included. Sexual orientation is not mentioned. | This cluster‐RCT included 904 children who were mild to moderately anaemic from the selected schools of Burundi and mainly with an agricultural background. | |
| The study was carried out in Kampung Speu Province of Cambodia | Cambodians | School‐going children | Male and female participants had equal representation (50% each) | 6‐16 years | Not mentioned | Not mentioned | Excluding severely anaemic children. All in the eligible age group were included in the study. Sexual orientation not mentioned | The cluster‐RCT included children from selected schools of Cambodia in KamPong Speu province with rice farming as a predominant occupation and income source. | |
| Satun province, west coast of southern Thailand | Thai Muslims | School children | Male, 98 + female 105 | Majority Muslim, age group of 7‐12 years | Low | Low/middle | Children with zinc deficiency; sexual orientation not mentioned | This study included school‐going children from low socioeconomic status and having zinc deficiency in Thailand. | |
| Muang District, Satun Province of southern Thailand | Thai Muslims | School Children | Males, 24 and females, 26 | Majority Muslims in the age group 8‐12 years | Low | Low/middle | Children who had consumed the triple‐fortified rice before or showed clinical symptoms of VAD (Bitots spot or ocular signs of xerophthalmia) or serum retinol values of < 0.7m mol/L were | This study included school‐going children from low socioeconomic status and having zinc deficiency in Thailand. | |
| Village of Keesara; Andhra Pradesh State in India | Indian | School children | Male 56 + female 90 | No mention of religion; age group of 5‐11 years | Low/middle | Low/middle | Anaemic children; sexual orientation not mentioned | The study included anaemic children from low‐middle socioeconomic background belonging to a rural area in India. | |
| Bataan, Philippines | Filipinos | Children and military personnel | Male and female, but proportions not reported | No mention of religion or education | Children lived in a welfare institution; military personnel were fully employed | Not mentioned | No exclusions were reported; sexual orientation was not mentioned | The study was conducted among children living in a welfare institution and among military personnel in the Philippines. | |
| Primary schools in | Indians | School children | Male 47%, female 53% | Hindu > Christians > Muslim; 6‐12 years | Low/middle school | Low | Anaemic children; sexual orientation not mentioned | This study included anaemic school going children from low socioeconomic background from an urban area India. | |
| Hb: haemoglobin; RCT: randomised controlled trial | |||||||||
| Study | Elemental iron (mg) | Vitamin Aa (mg) | Zinc (mg) | Folic acid (µg) | Vitamin B1 (thiamin) (mg) | Vitamin B2 (riboflavin) (mg) | Vitamin B3 (niacin) (mg) | Vitamin B6 (pyridoxine) (mg) | Vitamin B12 (cobalamin) (µg) |
| 6.25 | ‐ | ‐ | ‐ | ‐ | ‐ | ‐ | ‐ | ‐ | |
| Ara 2019 (CBA) | 6 | 0.15 | 4.00 | 130 | 0.40 | 1.0 | |||
| Della Lucia 2016 (CBA) | 8.4 | ‐ | 4.20 | 144 | 0.72 | ‐ | ‐ | ‐ | ‐ |
| Gershoff 1977 (CBA) | 0.2 | 0.81 | 0.087 | 0.04 | |||||
| 0.2 | 0.81 | 0.087 | 0.04 | ||||||
| 0.2 | 0.81 | 0.087 | 0.04 | ||||||
| 10.8 | 0.28 | 5.20 | 145 | ‐ | 3.2 | ||||
| 26.6 | ‐ | ‐ | ‐ | ‐ | ‐ | ‐ | ‐ | ‐ | |
| 4 | ‐ | ‐ | ‐ | ‐ | ‐ | ‐ | ‐ | ||
| ‐ | 1.20 (as beta‐carotene) | ‐ | ‐ | ‐ | ‐ | ‐ | ‐ | ‐ | |
| ‐ | 0.18 | ‐ | ‐ | ‐ | ‐ | ‐ | ‐ | ‐ | |
| 4 | 0.18 | ‐ | ‐ | ‐ | ‐ | ‐ | ‐ | ‐ | |
| 4 | 1.20 (as beta‐carotene) | ‐ | ‐ | ‐ | ‐ | ‐ | ‐ | ‐ | |
| 18 | ‐ | ‐ | ‐ | ‐ | ‐ | ‐ | ‐ | ‐ | |
| 20 | ‐ | ‐ | ‐ | ‐ | ‐ | ‐ | ‐ | ‐ | |
| Nogueira Arcanjo 2013 (CBA) | 112.8 | ‐ | ‐ | ‐ | ‐ | ‐ | ‐ | ‐ | ‐ |
| 11.9 | ‐ | 5.70 | 400 | 1.80 | ‐ | ‐ | ‐ | ‐ | |
| 10.67 | ‐ | 3.04 | 170 | 1.06 | ‐ | ‐ | ‐ | ‐ | |
| 7.55 | 0.64 | 2.02 | 280 | 1.43 | ‐ | 12.57 | ‐ | 3.8 | |
| 7.46 | 0.29 | 3.68 | 140 | 0.69 | ‐ | 7.98 | 0.92 | 1.26 | |
| 20 | 2.10 | 18 | ‐ | ‐ | ‐ | ‐ | ‐ | ‐ | |
| 20 | 2.10 | 18 | ‐ | ‐ | ‐ | ‐ | ‐ | ‐ | |
| 15 | ‐ | ‐ | ‐ | ‐ | ‐ | ‐ | ‐ | ‐ | |
| Salcedo 1950 (CBA) | 2.86 | ‐ | ‐ | ‐ | 0.44 | ‐ | 0.33 | ‐ | ‐ |
| 12.5 | 0.50 | 3 | 75 | 0.38 | ‐ | 5 | 0.38 | 0.75 | |
| 6.25 | 0.50 | 3 | 75 | 0.38 | ‐ | 5 | 0.38 | 0.75 | |
| C: cluster randomised; CBA: controlled before‐and‐after study | |||||||||
aOne international unit (IU) vitamin A is equivalent to 0.0003 mg of retinol, 0.0006 mg of beta‐carotene and 0.0012 mg of other pro‐vitamin A carotenoids.
Study designs
Out of the 17 included studies (28 records), twelve were RCTs (Angeles‐Agdeppa 2008; Hardinsyah 2016; Hotz 2008; Hussain 2014; Losso 2017; Moretti 2006b; Parker 2015 (C); Perignon 2016 (C); Pinkaew 2013; Pinkaew 2014; Radhika 2011; Thankachan 2012), two of which were cluster‐randomised trials (Parker 2015 (C); Perignon 2016 (C). For distinguishing them from individual randomised trials, their names are denoted with '(C)'. Five studies were controlled before‐and‐after studies (Ara 2019; Della Lucia 2016; Gershoff 1977; Nogueira Arcanjo 2013; Salcedo 1950).
Overall, eight RCTs had 2‐arms (Hardinsyah 2016; Hotz 2008; Losso 2017; Moretti 2006b; Parker 2015 (C); Pinkaew 2013; Pinkaew 2014; Radhika 2011), two studies had three arms (Angeles‐Agdeppa 2008; Thankachan 2012), and one study had five arms (including a placebo and traditional feeding intervention) as a part of the FORISCA‐UltraRice+NutriRice study (Perignon 2016 (C)). One RCT had six arms with five fortification groups in addition to control group (Hussain 2014). The studies had various types of randomisation procedures, sequence generation, allocation concealment, blinding as described in Characteristics of included studies.
One before‐and‐after study had five arms (Gershoff 1977) and four had two arms (Ara 2019; Della Lucia 2016; Nogueira Arcanjo 2013; Salcedo 1950).
Settings
Twelve studies were carried out in Asia, four in the Americas and one in Africa. The studies in Asia were carried out in Bangladesh (Ara 2019), Cambodia (Perignon 2016 (C)), India (Hussain 2014; Moretti 2006b; Radhika 2011; Thankachan 2012), Indonesia (Hardinsyah 2016), Philippines (Angeles‐Agdeppa 2008; Salcedo 1950) and Thailand (Gershoff 1977; Pinkaew 2013; Pinkaew 2014). The four studies in the Americas were conducted in Brazil (Della Lucia 2016; Nogueira Arcanjo 2013), Mexico (Hotz 2008) and in the USA (Losso 2017). The study in Africa was conducted in Burundi (Parker 2015 (C)). The Indian studies had school children in an urban area (Thankachan 2012), urban slum (Moretti 2006b), and rural school setting (Radhika 2011). The Mexican study (Hotz 2008), recruited women from six factories without any specific mention of ethnicity or race. The studies from the Philippines had urban school children in Manila (Angeles‐Agdeppa 2008), and children from a welfare institution and military personnel (Salcedo 1950). The study in Burundi was conducted among rural school age children from Muyinga Province (Parker 2015 (C)). The study in Cambodia was among rural school children in Kampung Speu (Perignon 2016 (C)), while the Indonesian study included teenage girls from a boarding school in the area of Medan (Hardinsyah 2016).
Malaria endemicity
One study reported that it was conducted in a malaria‐endemic area (Parker 2015 (C)). Four studies reported to be from non‐endemic areas for malaria (Angeles‐Agdeppa 2008; Moretti 2006b; Perignon 2016 (C); Thankachan 2012). Other studies did not report on endemicity for malaria (Ara 2019; Della Lucia 2016; Gershoff 1977; Hardinsyah 2016; Hotz 2008; Hussain 2014; Losso 2017; Nogueira Arcanjo 2013; Pinkaew 2013; Pinkaew 2014; Radhika 2011; Salcedo 1950).
Participants
The 17 included studies had a total of 10,483 participants. The controlled before‐and‐after studies were conducted in children aged two to six years of age (Della Lucia 2016; Nogueira Arcanjo 2013), 18 months to nine years of age (Gershoff 1977), and one was among women aged between 15 and 49 years (Ara 2019). One controlled before‐and‐after study was on infants to adults as it was prompted by clinical beriberi which cut across ages (Salcedo 1950). Among the RCTs, two were conducted among non‐pregnant, non‐lactating women 18 to 49 years of age (Hotz 2008; Losso 2017). All other included studies were carried out among preschool and school age children. RCTs involved children aged between 5 to 18 years of age (Angeles‐Agdeppa 2008; Hardinsyah 2016; Hussain 2014; Moretti 2006b; Parker 2015 (C); Perignon 2016 (C); Pinkaew 2013; Pinkaew 2014; Radhika 2011; Thankachan 2012). There were no studies reporting data exclusively on adolescents beyond the age of 12 years, adult men or pregnant women.
Anaemia prevalence
The baseline prevalence of anaemia ranged from 5% to 62% in the studies in children (Angeles‐Agdeppa 2008; Hussain 2014; Moretti 2006b; Nogueira Arcanjo 2013; Parker 2015 (C); Perignon 2016 (C); Pinkaew 2014; Radhika 2011; Thankachan 2012), and around 21% (intervention: 21.4 %; control: 20.4%) in one study among women (Hotz 2008), while the other study on women included women with iron deficiency as determined by serum ferritin or serum iron value, or both (Losso 2017). The study done on teenagers (Hardinsyah 2016), had a baseline anaemia level of 34%. Two studies from India had an anaemia prevalence of around 40% and above (Radhika 2011; Thankachan 2012). A third study from India reported iron‐deficiency anaemia of around 30% suggesting a much higher anaemia rate (Moretti 2006b). The two studies that included only anaemic children reported 38% (Parker 2015 (C)), and 45% (Angeles‐Agdeppa 2008), during screening. Three studies had an anaemia prevalence between 10% to 18% (Perignon 2016 (C); Pinkaew 2013; Pinkaew 2014). The controlled before‐and‐after study Ara 2019 had a baseline level of anaemia of 42%.
Stunting
In total, five studies reported on stunting at baseline ranging from 12% to 40% (Angeles‐Agdeppa 2008; Perignon 2016 (C); Pinkaew 2014; Radhika 2011; Thankachan 2012), one study reported less than 10% stunting in both intervention and control arms (Hussain 2014). Two studies reported the height‐for‐age Z‐score (Moretti 2006b; Pinkaew 2013) as −1.3 and −0.8 respectively. One study (Perignon 2016 (C)), reported both: 40% stunting; −1.75 Z‐score). None of the studies restricted inclusion of participants or analysed their data based on stunting status.
Occupation
Thirteen studies had preschool or school‐going children as participants (Angeles‐Agdeppa 2008; Della Lucia 2016; Gershoff 1977; Hardinsyah 2016; Hussain 2014; Moretti 2006b; Nogueira Arcanjo 2013; Parker 2015 (C); Perignon 2016 (C); Pinkaew 2013; Pinkaew 2014; Radhika 2011; Thankachan 2012). One study had women factory workers (Hotz 2008), and another did not mention the occupation of the participants (Losso 2017). The Ara 2019 study had mostly housewives (> 70% in each of the groups) followed by unskilled workers (˜7.82% to 11.26%).
Sex
Gender allocation was reported in all but three studies (Hussain 2014; Moretti 2006b; Salcedo 1950). All the three studies among adults included all women (Ara 2019; Hotz 2008; Losso 2017). There were no differences in gender between treatment groups at baseline in any study. Six studies had more female participants (Della Lucia 2016; Parker 2015 (C); Pinkaew 2013; Pinkaew 2014; Radhika 2011; Thankachan 2012). One study was carried out among teenage girls (Hardinsyah 2016). Two studies had more male participants (Angeles‐Agdeppa 2008; Perignon 2016 (C)). One before‐and‐after study had roughly equal numbers (Gershoff 1977), while one had more women (Nogueira Arcanjo 2013).
Religion/culture
No specific mention was made about the religion of the study population in 12 studies (Angeles‐Agdeppa 2008; Ara 2019; Della Lucia 2016; Gershoff 1977; Hotz 2008; Hussain 2014; Losso 2017; Moretti 2006b; Nogueira Arcanjo 2013; Perignon 2016 (C); Radhika 2011; Salcedo 1950). However one of these studies (Losso 2017), had mixed ethnic background participants. One study from India (Thankachan 2012), reported that the majority of the study participants were Hindus (74% in fortification groups and 65% in control groups). Two studies from Thailand had a predominantly Muslim population (Pinkaew 2013; Pinkaew 2014). The study from Indonesia had Javanese and Bataknese ethnic participants predominantly (Hardinsyah 2016).
Socioeconomic status
The studies were conducted mostly among those with low‐socioeconomic status. Three studies from India (Moretti 2006b; Radhika 2011; Thankachan 2012), and two studies from Thailand (Pinkaew 2013; Pinkaew 2014), were carried out among children from low socioeconomic backgrounds. One study from India was in an urban area (Thankachan 2012), urban slum (Moretti 2006b), and rural area (Radhika 2011). Other studies did not specify the socioeconomic status of their participants.
Education
Twelve studies (Angeles‐Agdeppa 2008; Della Lucia 2016; Hardinsyah 2016; Hussain 2014; Moretti 2006b; Nogueira Arcanjo 2013; Parker 2015 (C); Perignon 2016 (C); Pinkaew 2013; Pinkaew 2014; Radhika 2011; Thankachan 2012), reported studies on pre‐school and school‐going children. One community‐based study (Salcedo 1950), and two other studies (Hotz 2008; Losso 2017), were on women whose educational status was not reported. One study included pre‐school children attending a day‐care centre (Gershoff 1977). In Ara 2019, nearly 25% of the study population did not have any education, the remaining participants all had primary school education and above.
Social capital
The studies did not report issues related to inequity, access to food or any particular instances of preferences of certain social classes. However, the included studies were carried out in predominantly lower socioeconomic settings.
Interventions
Micronutrient content
All studies fortified rice with iron and some studies added various additional combinations of micronutrients. Seven studies (Hardinsyah 2016; Hussain 2014; Parker 2015 (C); Perignon 2016 (C); Pinkaew 2013; Pinkaew 2014; Thankachan 2012), and four controlled before‐and‐after studies fortified with multiple micronutrients (Ara 2019; Della Lucia 2016; Gershoff 1977; Salcedo 1950). Among them, six studies (Hardinsyah 2016; Parker 2015 (C); Perignon 2016 (C); Pinkaew 2013; Pinkaew 2014; Thankachan 2012), compared the effectiveness of multiple‐micronutrient‐fortified rice with that of unfortified rice. One RCT reported different micronutrients and their effects on each arm, compared with the control arm, which received unfortified rice (Hussain 2014), in which out of five intervention arms, one arm each received iron alone, beta carotene, retinyl palmitate, iron plus retinyl palmitate and iron plus beta carotene. Five studies (Angeles‐Agdeppa 2008; Hotz 2008; Losso 2017; Moretti 2006b; Radhika 2011), and one controlled before‐and‐after study (Nogueira Arcanjo 2013), included iron alone for rice fortification (with various quantities of iron and its compounds).
For the RCTs with multiple micronutrients, two studies (Pinkaew 2013; Pinkaew 2014), reported rice fortified with three micronutrients (iron, zinc and vitamin A); one study (Parker 2015 (C)), with four micronutrients (iron, zinc, thiamine and folic acid) and two (Hardinsyah 2016; Perignon 2016 (C)), with four or more micronutrients. All the multiple micronutrient studies had an arm with at least iron and zinc. One study (Gershoff 1977), reported the field effect of consumption of rice fortified with lysine, threonine, thiamin, riboflavin, vitamin A and iron. One study (Thankachan 2012), compared the effectiveness of high iron (12.5 mg/100 g natural rice) with that of low iron (6.25 mg/100 g of natural rice) fortification, along with vitamin A, thiamine, niacin, vitamin B6, vitamin B12, folate, iron and zinc and no fortification of rice. Another study (Angeles‐Agdeppa 2008) compared the effectiveness of ferrous sulphate‐fortified rice and micronized dispersible ferric pyrophosphate‐fortified rice with that of unfortified rice, wherein each of the three arms received in 160 g (1 cup) of cooked rice, ferrous sulphate (ExFeSO4), micronized ferric pyrophosphate (ExFeP80) or no added fortificant (control).
In all the included studies, the amount of elemental iron per 100 g of rice ranged from 0.2 mg to 112.8 mg. Vitamin A was a fortificant in three studies. The amount of vitamin A per 100 g of rice ranged from 0.15 mg (Ara 2019) to 2.1 mg (Pinkaew 2013; Pinkaew 2014). The amount of zinc per 100 g of rice ranged from 2 mg (Perignon 2016 (C)) to 18 mg (Pinkaew 2013; Pinkaew 2014). One study carried out among women had ferrous sulphate 18 mg/100 g of fortified rice for the intervention arm and unfortified rice for the control arm (Losso 2017). Fortification details per 100 g of uncooked rice are given in Table 4.
Rice fortification method
One study reported using extrusion as a fortification method without indicating the temperature (Angeles‐Agdeppa 2008). Seven studies used hot‐extrusion process only (Ara 2019; Hardinsyah 2016; Moretti 2006b; Parker 2015 (C); Pinkaew 2013; Pinkaew 2014; Thankachan 2012), and three studies reported a cold extrusion process only (Della Lucia 2016; Hotz 2008; Radhika 2011). One study included 2 arms with hot extrusion and one arm with cold extrusion (Perignon 2016 (C)). Three studies reported using coating in the fortification (Gershoff 1977; Losso 2017; Salcedo 1950), and two studies did not report the method (Hussain 2014; Nogueira Arcanjo 2013).
Iron compounds
The included studies used three types of iron compounds. The before‐and‐after study (Gershoff 1977) used ferric phosphate tetrahydrate. One study (Angeles‐Agdeppa 2008), used ferrous sulphate as one of two iron fortificants. Nine studies that were part of the meta‐analysis used ferric pyrophosphate. Micronized iron reduces the particle size to promote absorption. Two studies used a micronized ferric pyrophosphate, which had a particle size of 0.3 μm and was encapsulated (Angeles‐Agdeppa 2008; Hotz 2008). One study, which used cold extrusion, reported a particle size of 3.1 μm (Radhika 2011). Five studies described the iron used as micronized ground ferric pyrophosphate (Moretti 2006b; Perignon 2016 (C); Pinkaew 2013; Pinkaew 2014; Thankachan 2012), and three of these specified the particle size as 2.5 μm (Moretti 2006b; Pinkaew 2013; Pinkaew 2014). One study described the iron compound as ferric pyrophosphate without any reference to micronization or particle size (Parker 2015 (C)). Other studies had micronized ground ferric pyrophosphate with 4 mg iron (Hussain 2014), 10 mg iron (Pinkaew 2014), 11.8 mg per 100 g (Parker 2015 (C)); 10.6 mg per 11 g rice for cold‐extruded and 7.5 mg per 100 g rice for hot‐extruded (Perignon 2016 (C)), 20 mg iron (Moretti 2006b; Hotz 2008), 0.8% by weight (Gershoff 1977). One study on women reported ferrous sulphate as the iron compound used (Losso 2017). Two studies did not specify the iron compound (Ara 2019; Hardinsyah 2016).
Cooking methods
In three studies, rice was washed prior to cooking (Angeles‐Agdeppa 2008; Moretti 2006b; Radhika 2011). However, the manner of cooking was not described in sufficient detail to categorise based on the protocol for this review. In (Moretti 2006b), in addition to rice being washed in preparation for cooking, rice portions were cooked with seasoning ingredients in household pressure cookers for 8 min after reaching peak pressure, after which pressure was released. Test servings contained 35 g cooked rice.
One study used the absorption method of cooking rice (Perignon 2016 (C); author correspondence). Lunch menus were prepared in rotating order and usually consisted of rice together with chicken or fish and occasionally with vegetables. The schools also provided free milk (200 mL) daily to all children. Weekly iron supplementation, which had been given to the children by health officers or village health volunteers before the intervention, was not provided during the intervention. This was to improve the chance of showing an improvement in iron status even though it was not the primary outcome measure (Pinkaew 2014). In Burundi, parent committees performed all the cooking (Parker 2015 (C)). The other studies did not describe the manner of cooking rice.
All but one study (Parker 2015 (C)), described the accompanying dishes or menu. The study on female teenagers (Hardinsyah 2016), reported the cooking methods as pouring one sack of fortified rice into a plastic bucket to wash the rice, and steaming for about one hour until the rice was cooked well. One study (Losso 2017), was done as a pilot among women from the Baton Rouge area (Louisiana (LA), USA), wherein they tested the iron retention of fortified rice by several methods of cooking; however there was no description of the type cooking used for the clinical study. Similarly, Ara 2019 did not specify the method of cooking.
Comparisons
Rice fortified with iron alone or in combination with other micronutrients versus unfortified rice (no micronutrients added)
Twelve studies (2201 participants) made this comparison.
Rice fortified with iron alone or in combination with other micronutrients versus no intervention
No studies contributed data to this comparison.
Rice fortified with vitamin A alone or in combination with other micronutrients versus unfortified rice (no micronutrients added)
One study (74 participants) made this comparison, having a vitamin A‐only arm versus a control arm.
Rice fortified with vitamin A alone or in combination with other micronutrients versus no intervention
No studies contributed data to this comparison.
Rice fortified with zinc alone or in combination with other micronutrients versus unfortified rice (no micronutrients added)
No studies contributed data to this comparison.
Rice fortified with zinc alone or in combination with other micronutrients versus no intervention
No studies contributed data to this comparison.
Rice fortified with folic acid alone or in combination with other micronutrients versus unfortified rice (no micronutrients added)
No studies contributed data to this comparison.
Rice fortified with folic acid alone or in combination with other micronutrients versus no intervention
No studies contributed data to this comparison.
Outcome
Of the 12 RCTs included in the meta‐analysis, seven reported on anaemia (Angeles‐Agdeppa 2008; Hardinsyah 2016; Hotz 2008; Parker 2015 (C); Perignon 2016 (C); Radhika 2011; Thankachan 2012). Five out of the twelve RCTs used WHO thresholds to define anaemia based on serum haemoglobin concentrations (Hb) (Hardinsyah 2016; Moretti 2006b; Parker 2015 (C); Perignon 2016 (C); Radhika 2011), three used a cut‐off level but did not mention the cut‐off criteria (Angeles‐Agdeppa 2008, Pinkaew 2013Thankachan 2012), one RCT (Hotz 2008), used CDC 1989 criteria and three RCTs did not report the cut‐off used to define anaemia (Hussain 2014; Losso 2017; Pinkaew 2014). Among the included non‐randomised studies, three mentioned Hb cut‐off to define anaemia, but did not specify the criteria (Ara 2019; Della Lucia 2016; Gershoff 1977), one used WHO criteria (Nogueira Arcanjo 2013), and one study did not report a Hb cut‐off (Salcedo 1950). The details of the cut‐off used in each included study are given in Table 5. We used data from these studies in the meta‐analysis irrespective of the criteria used by them to define anaemia. Three studies reported iron‐deficiency anaemia (Moretti 2006b; Radhika 2011; Thankachan 2012); however we did not use these data in quantitative synthesis.
| Study | Haemoglobin threshold (g/L) | Criteria |
| Anaemia was defined as haemoglobin concentration in blood < 120 g/L | Not mentioned | |
| < 120 g/L in non‐pregnant and non‐lactating women | Not mentioned | |
| ≥ 110 g/L was used as a cut off for including children in the study. Anaemia was not defined | Not reported | |
| Haemoglobin levels were categorised as deficient < 100, low 100‐90 (g/L) | Not mentioned | |
| Severe anaemia: < 80 g/L; moderate anaemia: 80‐109 g/L; mild anaemia: 110‐119 g/L; non anaemia: ≥ 120 g/L | WHO (WHO 2011a) | |
| < 122 g/L, adjusted for average altitude of the study sites (1100 m) with the use of an equation | CDC (CDC 1989) | |
| < 110 g/L and severely anaemic (Hb < 75 g/L) were excluded | Not mentioned | |
| Not reported (iron‐deficiency anaemia was defined based on iron and ferritin levels in serum) | Not reported | |
| < 115 g/L in children aged 5–11 years | WHO (WHO 2001) | |
| < 110 g/L in children < 5 years of age | WHO (WHO 2001) | |
| For school‐aged children at 1500 m above sea level, mild anaemia was defined as Hb 115‐119 g/L, moderate anaemia Hb 85‐114 g/L, and severe anaemia Hb < 85 g/L | WHO (WHO 2011f) | |
| < 115 g/L for children aged 6‐11 years, < 120 g/L for children aged 12‐14 years and girls aged ≥ 15 years and < 130 g/L for boys aged ≥ 15 years | WHO (WHO 2001) | |
| < 120 g/L | Not mentioned | |
| Not reported | Not reported | |
| In children aged 5–11 years, anaemia (mild to moderate) was defined as Hb 70‐115 g/L. | WHO (WHO 2001) | |
| Not reported | Not reported | |
| < 115 g/L in children aged 6–11 years and < 120 g/L in participants aged ≥ 12 years | Not mentioned | |
| CDC: Centers for Disease Control and Prevention; Hb: haemoglobin; WHO: World Health Organization | ||
Nine studies reported iron deficiency (Angeles‐Agdeppa 2008; Hardinsyah 2016; Hotz 2008; Hussain 2014; Moretti 2006b; Perignon 2016 (C); Pinkaew 2013; Radhika 2011; Thankachan 2012); we included eight in the meta‐analysis. We did not include data from Hussain 2014 because the subgroup‐specific details were not available for further analysis.
To evaluate iron deficiency, seven studies used plasma ferritin concentrations (Angeles‐Agdeppa 2008; Hotz 2008; Hussain 2014; Losso 2017; Moretti 2006a; Radhika 2011; Thankachan 2012), four studies used serum transferrin receptor concentrations (Hotz 2008; Losso 2017; Moretti 2006bThankachan 2012), wherein two studies (Moretti 2006a; Thankachan 2012), used and reported both these parameters.
Eleven studies reported mean haemoglobin concentrations (Angeles‐Agdeppa 2008; Hardinsyah 2016; Hotz 2008; Hussain 2014; Losso 2017; Moretti 2006b; Parker 2015 (C); Perignon 2016 (C); Pinkaew 2013; Radhika 2011; Thankachan 2012), four studies evaluated vitamin A deficiency (Hardinsyah 2016; Perignon 2016 (C); Pinkaew 2014; Thankachan 2012), and one study reported plasma folate concentration (Hardinsyah 2016). One study reported the level of diarrhoea (Thankachan 2012). No studies compared the groups for respiratory infections (as measured by study authors) or all‐cause death in their outcomes. One study reported on hookworm infection (Perignon 2016 (C)). One study reported abdominal pain (Thankachan 2012). No studies reported congenital anomalies or miscarriage (no studies were carried out among pregnant women). Five studies reported serum retinol (Angeles‐Agdeppa 2008; Hardinsyah 2016; Pinkaew 2013; Pinkaew 2014; Thankachan 2012), three studies reported plasma zinc concentration (Hardinsyah 2016; Pinkaew 2014; Thankachan 2012).
One study (Moretti 2006b), reported anthropometric measurements (weight‐for‐age, height‐for‐age, weight‐for‐height in terms of Z‐score) whereas Angeles‐Agdeppa 2008 reported prevalence of wasting and stunting. No studies compared the risk of iron overload (defined by serum ferritin higher than 150 µg/L in women and higher than 200 µg/L in men), clinical and severe malaria, night blindness (defined as the inability to see after dusk by people who typically report having normal vision during the day; only for vitamin A fortified rice as an intervention), across the groups
The controlled before‐and‐after studies reported biochemical outcomes relevant to iron, vitamin A, zinc and folate in addition to clinical outcomes such as beriberi (Della Lucia 2016; Gershoff 1977; Nogueira Arcanjo 2013; Salcedo 1950). In Ara 2019, they included anaemia, mean haemoglobin (g/L), zinc deficiency (< 10.1 mmol/L), mean serum zinc (mmol/L), morbidity (last two weeks), diarrhoea, fever and inflammation (CRP >10.0 mg/L) as the outcomes. Gershoff 1977 study reported the effect of consumption of rice fortified with multiple vitamins, however they did not report the total number of outcomes in the entire study population, hence their report did not reach the stage of meta‐analysis.
Sources of funding
Most included studies were funded by one or more agencies from the government sector, private sector, academic organisations, or non‐government organisations. One study did not report the source of financial support (Losso 2017).
Angeles‐Agdeppa 2008 stated its source of funding was The International Life Sciences Institute Center for Health Promotion of Japan (ILSI CHP, Japan), and the ILSI CHP, Atlanta, USA. Taiyo Kagaku, Japan donated the necessary fortificant used in this study.
DSM Nutritional Products (India) provided fortified rice for Thankachan 2012. Another study, Gershoff 1977, reported that they were supported in part by the United States Agency for International Development and the Fund for Research and Teaching, Department of Nutrition, Harvard School of Public Health. Also, that Ajinomoto Company, Tokyo, Japan supplied the rice fortification grains.
Two RCTs (Pinkaew 2013; Pinkaew 2014), were supported by Medicor Foundation (Triesen, Liechtenstein), the Royal Thai Government Scholarship. Also, Pinkaew 2014 study was supported by the International Atomic Energy Agency (Vienna, Austria). The Micronutrient Initiative, Ottawa, Canada, along with the Swiss Federal Institute of Technology, Zurich, Switzerland, and St John’s Academy of Health Sciences, Bangalore, India supported Moretti 2006b and Dr. Paul Lohmann (GmbH, Emmerthal, Germany) provided the iron and zinc compounds, and DSM Nutritional Products Ltd. (Basel, Switzerland) provided the vitamin A compound for Moretti 2006b; Pinkaew 2013; and Pinkaew 2014. Radhika 2011 was funded by the Department of Biotechnology, New Delhi, India. The Program for Appropriate Technology in Health (PATH), Seattle, USA provided the Ultra Rice premix for them. United States Department of Agriculture (USDA) and the Open Road Alliance funded one study (Parker 2015 (C)). USDA, the World Food Programme‐DSM Consortium, and the Institut de Recherce pour le Development (IRD) supported Perignon 2016 (C).
A subcontract grant from PATH through an original grant from Bill & Melinda Gates Foundation provided the funding for Hotz 2008. The Food and Nutrition Society of Indonesia supported Hardinsyah 2016. Williams‐Waterman Fund Committee of the Research Corporation, New York City funded Salcedo 1950, and Hoffmann‐LaRoche, Inc., Nutley, New Jersey, USA donated the premix that they used. Della Lucia 2016 had financial support from O Programa Institucional de Bolsas de Iniciação Científica e Tecnológica da (PROBIC/FAPEMIG), PIBIC/CNPq and FAPEMIG and PATH donated the fortified rice. The United Nations World Food Programme (Grant # 1209) funded the study conducted in Bangladesh by Ara 2019
Excluded studies
We excluded 28 articles from 22 studies after assessing the full‐text articles. The details of excluded studies along with the reasons for exclusion are given in Characteristics of excluded studies.
See Figure 2 for reasons for excluding the articles. Nine studies were related to a different type of intervention or rice was not the medium of intervention (Arsenault 2010; Bagni 2009; Barboza 2011; Castro 2017; Finkelstein 2013; Graham 2007; Haskell 2005; Sridevi 2013; Vitolol 1998), six studies with participants outside the age range of interest (Beinner 2010; Ma 2016; Nogueira Arcanjo 2012; Pham 2012; Skau 2015; Walter 1993); five studies with different type of study design (Ando 2012; Angeles‐Agdeppa 2011; Florentino 1998; Huo 2014; Kagawa 2017), and two studies had insufficient information (Hyun 2015; Pham Van 2013).
We have provided details of two ongoing studies in Characteristics of ongoing studies table.
Risk of bias in included studies
We used standardised domains to assess the risk of bias of included studies (including individually and cluster‐randomised trials) (Higgins 2019). We assessed the primary outcomes for risk of bias at the study level. We considered additional domains for risk of bias among the cluster‐RCTs. We presented them in the 'Risk of bias' table in the Characteristics of included studies section, and give a summary of the ’Risk of bias’ analyses in Figure 3 and Figure 4. Among the 12 RCTs contributing to the meta‐analysis, two studies had a low overall risk of bias (Moretti 2006b; Radhika 2011), having low risk in allocation concealment, differences in baseline outcome measures, and incompleteness of outcome data. We assessed all other RCTS to be at high overall risk of bias. The five controlled before‐and‐after studies had high or unclear risk of bias for most domains (Ara 2019; Della Lucia 2016; Gershoff 1977; Nogueira Arcanjo 2013; Salcedo 1950). Two of these studies had a documented difference in baseline outcome measures (Della Lucia 2016; Nogueira Arcanjo 2013). Also, Ara 2019 had different baseline and end‐line populations.

'Risk of bias' summary: review authors' judgements about each 'Risk of bias' item for each included study
Four studies were controlled before‐and‐after studies (Ara 2019; Della Lucia 2016; Gershoff 1977; Nogueira Arcanjo 2013), and one was a controlled cross‐sectional study (Salcedo 1950)

'Risk of bias' graph: review authors' judgements about each 'Risk of bias' item presented as percentages across all included studies
Allocation
Sequence generation
We noted three studies adequately describing the sequence generation for the recruitment of study participants in their respective studies (Hotz 2008; Perignon 2016 (C); Thankachan 2012), and we graded them to be at low risk of bias. We assessed four studies at high risk of bias for not having random sequence generation (Ara 2019; Della Lucia 2016; Gershoff 1977; Salcedo 1950), and 10 studies to be at unclear risk (Angeles‐Agdeppa 2008; Hardinsyah 2016; Hussain 2014; Losso 2017; Moretti 2006b; Nogueira Arcanjo 2013; Parker 2015 (C); Pinkaew 2013; Pinkaew 2014; Radhika 2011); all four studies at high risk of bias for random sequence generation were before‐and‐after comparison studies.
Allocation concealment
Five studies reported allocation concealment completely in their methods (Della Lucia 2016; Hardinsyah 2016; Moretti 2006b; Perignon 2016 (C); Radhika 2011), and we assessed them to be at low risk of bias. Six studies did not effectively conceal allocation (Angeles‐Agdeppa 2008; Ara 2019; Gershoff 1977; Pinkaew 2013; Pinkaew 2014; Salcedo 1950), and we assessed them at high risk of bias, and six studies were at unclear risk (Hotz 2008; Hussain 2014; Losso 2017; Nogueira Arcanjo 2013; Parker 2015 (C); Thankachan 2012).
Similarity of baseline characteristics
We assessed 13 studies to be at low risk of bias for similarity of baseline characteristics (Angeles‐Agdeppa 2008; Ara 2019; Hardinsyah 2016; Hotz 2008; Hussain 2014; Losso 2017; Moretti 2006b; Nogueira Arcanjo 2013; Pinkaew 2013; Pinkaew 2014; Radhika 2011; Salcedo 1950; Thankachan 2012). Two studies were at high risk of bias (Gershoff 1977; Perignon 2016 (C)), and two studies were at unclear risk (Della Lucia 2016; Parker 2015 (C)).
Overall, seven studies were at high risk of selection bias (Angeles‐Agdeppa 2008; Ara 2019; Gershoff 1977; Perignon 2016 (C); Pinkaew 2013; Pinkaew 2014; Salcedo 1950) with high risk of bias in any one of the domains of selection bias.
For similarity of baseline outcome measurements, nine studies were at low risk of bias (Angeles‐Agdeppa 2008; Hotz 2008; Hussain 2014; Losso 2017; Moretti 2006b; Pinkaew 2013; Pinkaew 2014; Radhika 2011; Thankachan 2012), seven studies were at high risk of bias (Ara 2019; Della Lucia 2016; Gershoff 1977; Hardinsyah 2016; Nogueira Arcanjo 2013; Parker 2015 (C); Perignon 2016 (C)), and we assessed one study as unclear risk of bias (Salcedo 1950).
Blinding
Eight studies described the blinding process for the participants adequately and we graded them to be at low of bias in blinding the participants (Angeles‐Agdeppa 2008; Hardinsyah 2016; Losso 2017; Moretti 2006b; Nogueira Arcanjo 2013; Perignon 2016 (C); Radhika 2011; Thankachan 2012), five studies were at low risk of bias in blinding the outcome assessment (Angeles‐Agdeppa 2008; Moretti 2006b; Nogueira Arcanjo 2013; Radhika 2011; Thankachan 2012), and seven studies were at low risk in terms of contamination (Ara 2019; Hardinsyah 2016; Hussain 2014; Losso 2017; Nogueira Arcanjo 2013; Parker 2015 (C); Perignon 2016 (C)). Overall, four studies (Hardinsyah 2016; Losso 2017; Nogueira Arcanjo 2013; Perignon 2016 (C)), were at low risk of performance bias and five studies gave an account of blinding the outcome assessors which we assessed to be at low risk of detection bias (Angeles‐Agdeppa 2008; Moretti 2006b; Nogueira Arcanjo 2013; Radhika 2011; Thankachan 2012).
We assessed 13 studies at unclear risk of blinding. Two studies were at unclear risk of blinding the participants and personnel (Della Lucia 2016; Parker 2015 (C)), six studies for blinding of outcome assessment (Della Lucia 2016; Hardinsyah 2016; Hussain 2014; Perignon 2016 (C); Pinkaew 2013; Pinkaew 2014), and nine studies for contamination (Della Lucia 2016; Gershoff 1977; Hotz 2008; Moretti 2006b; Pinkaew 2013; Pinkaew 2014; Radhika 2011; Salcedo 1950; Thankachan 2012).
Ten studies were at high risk of blinding. Seven studies were at high risk of blinding of the participants (Ara 2019; Gershoff 1977; Hotz 2008; Hussain 2014; Pinkaew 2013; Pinkaew 2014; Salcedo 1950), six studies for blinding of outcome assessment (Ara 2019; Gershoff 1977; Hotz 2008; Losso 2017; Parker 2015 (C); Salcedo 1950), and one study was at high risk of contamination (Angeles‐Agdeppa 2008).
Incomplete outcome data
We assessed 11 studies to be at low risk of bias for completeness of outcome data (Angeles‐Agdeppa 2008; Hardinsyah 2016; Hussain 2014; Losso 2017; Moretti 2006b; Nogueira Arcanjo 2013; Perignon 2016 (C); Pinkaew 2013; Pinkaew 2014; Radhika 2011; Thankachan 2012), and they reported minimum loss to follow‐up rates among the study participants. Two studies were at high risk of bias (Hotz 2008; Salcedo 1950), because of high rates of dropout from the study, and we assessed four studies at unclear risk of bias due to inadequate description of attrition (Ara 2019; Della Lucia 2016; Gershoff 1977; Parker 2015 (C)).
Selective reporting
There was no indication of selective reporting by any of the studies from published records, however we did not have access to the study protocols. Ten studies reported all of their pre‐specified outcomes, including the insignificant ones, and we assessed them to be at low risk of bias (Angeles‐Agdeppa 2008; Ara 2019; Losso 2017; Moretti 2006b; Parker 2015 (C); Perignon 2016 (C); Pinkaew 2013; Pinkaew 2014; Radhika 2011; Thankachan 2012); one of these studies provided a study registration number for the protocol (Pinkaew 2014). We assessed one study at high risk of reporting bias because the study participants were given rewards for maintaining highest attendance in the schools in which the attendance rate was not steady (Hardinsyah 2016). We assessed six studies to be at unclear risk of bias (Della Lucia 2016; Gershoff 1977; Hotz 2008; Hussain 2014; Nogueira Arcanjo 2013; Salcedo 1950)
Other potential sources of bias
We could not identify other potential sources of bias in the included studies. For some studies, industry provided the fortificants or the rice fortification grains. We assessed three studies to be at low risk of bias (Angeles‐Agdeppa 2008; Parker 2015 (C); Perignon 2016 (C)), one study at high risk of bias (Hardinsyah 2016), and 13 studies at unclear risk of bias (Ara 2019; Della Lucia 2016; Gershoff 1977; Hotz 2008; Hussain 2014; Losso 2017; Moretti 2006b; Nogueira Arcanjo 2013; Pinkaew 2013; Pinkaew 2014; Radhika 2011; Salcedo 1950; Thankachan 2012).
We evaluated and determined additional criteria for risk of bias in cluster‐randomised studies (i.e. recruitment bias, baseline imbalance, loss of clusters, incorrect analysis, compatibility with individual RCTs) for two studies (Parker 2015 (C); Perignon 2016 (C)). Among these criteria, Perignon 2016 (C) was at unclear risk for baseline imbalance because they did not describe clusters and did not report any process of statistical adjustment for clustering. For all remaining criteria, we judged both the studies to be at low risk of bias.
Effects of interventions
See: Summary of findings for the main comparison Rice fortified with iron alone or in combination with other micronutrients compared to unfortified rice (no micronutrients added) for addressing micronutrient malnutrition among the included studies; Summary of findings 2 Rice fortified with vitamin A alone or in combination with other micronutrients compared to unfortified rice (no micronutrients added) for addressing micronutrient malnutrition
A summary of the effects of interventions is given in summary of findings Table for the main comparison and summary of findings Table 2.
We included 12 RCTs in the meta‐analysis. All 12 RCTs contained at least one arm with iron and compared with unfortified rice. No RCT had a 'no intervention' arm in their study. Of the 12 RCTs, six RCTs fortified with iron only, five RCTs fortified with iron and other micronutrients and one RCT had several fortified groups including iron only, vitamin A only and multiple micronutrients. Few of the pre‐specified outcome measures in this review were not reported by any of the included studies. We analysed the results using a random‐effects model, since all the included studies had significant heterogeneity. See Data and analyses for a detailed description of pre‐specified outcomes and their results.
We carried out sensitivity analyses for two cluster‐randomised trials (Parker 2015 (C); Perignon 2016 (C)), with different values of ICC and examined their effect on the effect estimates (RR) for two outcomes: anaemia and mean haemoglobin concentration. We observed that ICC did not change the direction of effects of interventions significantly for any outcome. We have presented the details of these sensitivity analyses in Table 6. We also carried out sensitivity analysis by excluding the single RCT (Parker 2015 (C)), with a high/unclear risk of bias in eight out of 15 domains (including the additional domains for cluster‐RCTs) for two outcomes, anaemia and mean haemoglobin.
| Outcome (all studies included in the analysis) | Study (ICC) | RR (95% CI) | Tau² | Chi² | P value | I² |
| Anaemia (Angeles‐Agdeppa 2008; Hardinsyah 2016; Hotz 2008; Parker 2015 (C); Perignon 2016 (C); Radhika 2011; Thankachan 2012) | Parker 2015 (C) (0) | 0.83 (0.64 to 1.08) | 0.06 | 16.06 | 0.01 | 63% |
| Parker 2015 (C) (0.001) | 0.83 (0.64 to 1.08) | 0.06 | 15.72 | 0.02 | 62% | |
| Parker 2015 (C) (0.002) | 0.83 (0.64 to 1.08) | 0.06 | 15.71 | 0.02 | 62% | |
| Parker 2015 (C) (0.005) | 0.83 (0.64 to 1.07) | 0.06 | 15.12 | 0.02 | 60% | |
| Parker 2015 (C) (0.01) | 0.83 (0.64 to 1.08) | 0.06 | 14.80 | 0.02 | 59% | |
| Parker 2015 (C) (0.02723) | 0.83 (0.64 to 1.07) | 0.05 | 13.08 | 0.04 | 54% | |
| Parker 2015 (C) (0.1) | 0.81 (0.64 to 1.03) | 0.04 | 10.03 | 0.12 | 40% | |
| 0.83 (0.67 to 1.03) | 0.04 | 13.17 | 0.04 | 54% | ||
| Perignon 2016 (C) (0.001) | 0.83 (0.67 to 1.04) | 0.04 | 13.15 | 0.04 | 54% | |
| Perignon 2016 (C) (0.002) | 0.83 (0.66 to 1.04) | 0.04 | 13.16 | 0.04 | 54% | |
| Perignon 2016 (C) (0.005) | 0.83 (0.66 to 1.05) | 0.04 | 13.12 | 0.04 | 54% | |
| Perignon 2016 (C) (0.01) | 0.83 (0.65 to 1.05) | 0.05 | 13.12 | 0.04 | 54% | |
| Perignon 2016 (C) (0.02723) | 0.83 (0.64 to 1.07) | 0.05 | 13.08 | 0.04 | 54% | |
| Perignon 2016 (C)( 0.1) | 0.83 (0.63 to 1.09) | 0.06 | 13.08 | 0.04 | 54% | |
| Outcome (all studies included in the analysis) | Study (ICC) | MD (95% CI) | Tau² | Chi² | P value | I² |
| Haemoglobin concentration (Angeles‐Agdeppa 2008; Hardinsyah 2016; Hotz 2008; Hussain 2014; Losso 2017; Moretti 2006b; Parker 2015 (C); Perignon 2016 (C); Pinkaew 2013; Radhika 2011; Thankachan 2012) | Parker 2015 (C) (0) | 1.69 (0.48 to 2.91) | 1.82 | 24.15 | 0.007 | 59% |
| Parker 2015 (C) (0.001) | 1.70 (0.48 to 2.92) | 1.81 | 23.90 | 0.008 | 58% | |
| Parker 2015 (C) (0.002) | 1.71 (0.49 to 2.93) | 1.81 | 23.69 | 0.008 | 58% | |
| Parker 2015 (C) (0.005) | 1.73 (0.51 to 2.96) | 1.80 | 23.18 | 0.01 | 57% | |
| Parker 2015 (C) (0.01) | 1.77 (0.54 to 3.00) | 1.79 | 22.62 | 0.01 | 56% | |
| Parker 2015 (C)) (0.02723) | 1.85 (0.61 to 3.10) | 1.77 | 21.73 | 0.02 | 54% | |
| Parker 2015 (C)) (0.1) | 1.98 (0.71 to 3.25) | 1.76 | 20.96 | 0.02 | 52% | |
| Perignon 2016 (C)) (0) | 1.85 (0.61 to 3.09) | 1.77 | 21.98 | 0.02 | 55% | |
| Perignon 2016 (C)) (0.001) | 1.85 (0.61 to 3.09) | 1.77 | 21.97 | 0.02 | 54% | |
| Perignon 2016 (C)) (0.002) | 1.85 (0.61 to 3.09) | 1.77 | 21.96 | 0.02 | 54% | |
| Perignon 2016 (C)) (0.005) | 1.85 (0.61 to 3.10) | 1.77 | 21.93 | 0.02 | 54% | |
| Perignon 2016 (C)) (0.01) | 1.85 (0.61 to 3.10) | 1.77 | 21.89 | 0.02 | 54% | |
| Perignon 2016 (C)) (0.02723) | 1.85 (0.61 to 3.10) | 1.77 | 21.73 | 0.02 | 54% | |
| Perignon 2016 (C)) (0.1) | 1.86 (0.61 to 3.11) | 1.78 | 21.15 | 0.02 | 53% | |
| C: cluster‐randomised trial; CI: confidence interval; ICC: intra‐cluster correlation coefficient; MD: mean difference; RR: risk ratio | ||||||
No studies looked at fortified rice versus no intervention, and we could not examine comparisons 2 and 4 to 8 because there were no studies looking at vitamin A, folic acid and zinc with other micronutrients that did not also include iron, and there were no studies with a 'no intervention' arm. However we undertook meta‐analysis for vitamin A versus unfortified rice since one study (Hussain 2014), reported an intervention arm with vitamin A only compared with unfortified rice. We included this in comparison 3.
Rice fortified with iron alone or in combination with other micronutrients versus unfortified rice
There were 12 studies (2201 participants) included in this comparison (Angeles‐Agdeppa 2008; Hardinsyah 2016; Hotz 2008; Hussain 2014; Losso 2017; Moretti 2006b; Parker 2015 (C); Perignon 2016 (C); Pinkaew 2013; Pinkaew 2014; Radhika 2011; Thankachan 2012). These studies comprise all the data included in the synthesis of this Review. We included five non‐randomised studies in this comparison (Ara 2019; Della Lucia 2016; Gershoff 1977; Nogueira Arcanjo 2013; Salcedo 1950) for qualitative assessment.
Primary outcomes
Anaemia (defined as haemoglobin (Hb) below the WHO cut‐off, adjusted for altitude as appropriate or as defined by the study authors)
We included seven studies in the analysis (Angeles‐Agdeppa 2008; Hardinsyah 2016; Hotz 2008; Parker 2015 (C); Perignon 2016 (C); Radhika 2011; Thankachan 2012). The studies had a duration of four months (Hardinsyah 2016), six months (Angeles‐Agdeppa 2008; Hotz 2008; Parker 2015 (C); Perignon 2016 (C); Thankachan 2012), and eight months (Radhika 2011). The detailed results are presented in Analysis 1.1. Overall, the children who consumed iron‐fortified rice had similar levels of anaemia to controls at the end of the follow‐up period (RR 0.72, 95% CI 0.54 to 0.97; 7 studies; 1634 participants; low‐certainty evidence). Heterogeneity was high (Tau² = 0.10; Chi² = 23.27, df = 6; P = 0.0007; I2 = 74%) and the results have to be interpreted with caution. One study (Angeles‐Agdeppa 2008), reported direction of benefit favouring fortification, whereas Hotz 2008; Parker 2015 (C); Perignon 2016 (C); Radhika 2011 and Thankachan 2012 showed ambiguous direction. Exclusion of two studies, which clearly favoured fortification (Angeles‐Agdeppa 2008; Hardinsyah 2016), changed the effect such that there was no effect on anaemia (RR 0.92, 95% CI 0.76 to 1.12; 1248 participants) and reduced heterogeneity among studies (Tau² = 0.01; Chi² = 5.08, df = 4; P = 0.28; I2 = 21%). Exclusion of Parker 2015 (C) revealed a slight reduction in anaemia with fortification of rice (RR 0.66, 95% CI 0.49 to 0.89; I2 = 61%; 1336 participants) and it reduced the heterogeneity slightly.
There was no clear evidence of differences between subgroups in terms of reduction of anaemia in any of the following subgroup analyses.
-
Micronutrient content: iron alone (RR 0.63 95% CI 0.36 to 1.09; I2 = 43%; 3 studies, 444 participants; Analysis 1.2); iron plus other nutrients (RR 0.95, 95% CI 0.82 to 1.11; I2 = 0%; 4 studies, 1190 participants; Analysis 1.2).
-
Rice fortification method: hot extrusion (RR 0.72, 95% CI 0.52 to 1.01; I2 = 80%; 5 studies, 1197 participants); cold extrusion (RR 0.75, 95% CI 0.41 to 1.38; I2 = 31%; 3 studies, 437 participants; Analysis 1.3).
-
By cooking method most commonly used in study setting (as reported): rinsing and boiling without excess water (RR 0.40, 95% CI 0.26 to 0.63; 1 study; 215 participants; Analysis 1.4); unknown/unreported (RR 0.81, 95% CI 0.63 to 1.05; I2 = 61%; 6 studies, 1419 participants; Analysis 1.4).
-
Public health significance of anaemia at baseline in the target group: mild and moderate, 5% to 39.9% (RR 0.69, 95% CI 0.44 to 1.06; I2 = 85%; 4 studies, 1129 participants; Analysis 1.5); severe, 40% and more (RR 0.87, 95% CI 0.67 to 1.12; I2 = 0%; 2 studies, 360 participants; Analysis 1.5); and mixed/unknown/unreported (RR 0.31, 95% CI 0.09 to 1.10; 1 study, 145 participants; Analysis 1.5).
-
Malaria endemicity at the time that the study was conducted: some malaria risk setting (RR 0.85, 95% CI 0.55 to 1.32; 1 study, 445 participants); malaria‐free area (RR 0.70, 95% CI 0.48 to 1.03; I2 = 71%; 2 studies, 403 participants; Analysis 1.6); and unknown/unreported malaria setting (RR 0.67, 95% CI 0.34 to 1.31; I2 = 84%; 4 studies, 786 participants; Analysis 1.6).
Iron deficiency
We included eight studies in the analysis (Angeles‐Agdeppa 2008; Hardinsyah 2016; Hotz 2008; Moretti 2006b; Perignon 2016 (C); Pinkaew 2013; Radhika 2011; Thankachan 2012). We did not include data from Hussain 2014 in the meta‐analysis because the subgroup details (for each arm) related to iron deficiency were not available, since the study authors reported data only for overall fortification versus unfortified rice. The intervention in the included studies lasted four months (Hardinsyah 2016), five months (Pinkaew 2013), six months (Angeles‐Agdeppa 2008; Hotz 2008; Perignon 2016 (C); Thankachan 2012), seven months (Moretti 2006b) and eight months (Radhika 2011). Details are presented in Analysis 1.7. Participants consuming rice fortified with iron or in combination with other micronutrients may have slightly lower levels of iron deficiency compared to those consuming unfortified rice (RR 0.66, 95% CI 0.51 to 0.84; 8 studies, 1733 participants; low‐certainty evidence). Heterogeneity was low (Tau² = 0.02; Chi² = 8.60, df = 7; P = 0.28; I2 = 19%). The pooled estimate favours fortification, in which direction of benefit was positive for fortification in Moretti 2006b and Radhika 2011. Also Hussain 2014 showed favourable effects towards fortification (48 out of 185 in the fortification arms together and 19 out of 37 in the control arm).
There were no significant differences in iron deficiency due to consumption of iron‐fortified rice across the subgroups.
-
Micronutrient content: fortification with a single micronutrient (iron) resulted in lower risk of iron deficiency (RR 0.56, 95% CI 0.40 to 0.80; I2 = 17%; 4 studies, 628 participants; Analysis 1.8), whereas fortification with multiple micronutrients showed no difference compared to the unfortified group (RR 0.78, 95% CI 0.57 to 1.06; I2 = 0%; 4 studies, 1105 participants; Analysis 1.8).
-
Rice fortification method: hot extrusion (RR 0.66, 95% CI 0.51 to 0.87; I2 = 4%; 6 studies, 1283 participants; Analysis 1.9), cold extrusion (RR 0.65, 95% CI 0.38 to 1.09; participants = 450; studies = 3; I2 = 40%; Analysis 1.9).
-
Cooking method most commonly used in study setting (as reported): rinsing and boiling without excess water (RR 0.79, 95% CI 0.51 to 1.21; 1 study, 215 participants; Analysis 1.10) and unknown/unreported (RR 0.63, 95% CI 0.46 to 0.84; I2 = 22%; 7 studies, 1518 participants; Analysis 1.10).
-
Public health significance of anaemia at baseline in the target group: mild and moderate, 5% to 39.9% (RR 0.77, 95% CI 0.55 to 1.07; I2 = 0%; 4 studies, 1046 participants; Analysis 1.11); severe, 40% and more (RR 0.57, 95% CI 0.26 to 1.27; I2 = 59%; 2 studies, 358 participants; Analysis 1.11) and mixed/unknown/unreported (RR 0.63, 95% CI 0.39 to 1.01; I2 = 47%; 2 studies, 329 participants; Analysis 1.11).
-
Malaria endemicity at the time that the study was conducted: some malaria risk setting (RR 0.86, 95% CI 0.48 to 1.53; 1 study, 485 participants; Analysis 1.12); malaria‐free area (RR 0.58, 95% CI 0.41 to 0.84; I2 = 0%; 3 studies, 585 participants; Analysis 1.12); and unknown/unreported malaria setting (RR 0.61, 95% CI 0.39 to 0.96; I2 = 46%; 4 studies, 663 participants; Analysis 1.12).
Haemoglobin concentration (g/L)
We included 11 studies in the analysis (Angeles‐Agdeppa 2008; Hardinsyah 2016; Hotz 2008; Hussain 2014; Losso 2017; Moretti 2006b; ; Parker 2015 (C); Perignon 2016 (C); Pinkaew 2013; Radhika 2011; Thankachan 2012). The duration of the intervention varied between two weeks (Losso 2017), and eight months (Radhika 2011). The other included studies provided the intervention for four months (Hardinsyah 2016), five months (Pinkaew 2013), six months (Angeles‐Agdeppa 2008; Hotz 2008; Hussain 2014; Perignon 2016 (C); Thankachan 2012) and seven months (Moretti 2006b; Parker 2015 (C)). Details are presented in Analysis 1.13. Consuming rice fortified with iron or in combination with other micronutrients may increase haemoglobin concentrations (g/L) in comparison to consuming unfortified rice (MD 1.83, 95% CI 0.66 to 3.00; 11 studies, 2163 participants; low‐certainty evidence). Heterogeneity was substantial (Tau² = 1.58; Chi² = 21.86, df = 10; P = 0.02; I² = 54%) and results should be interpreted with caution. The direction of benefit was towards fortification in three studies (Angeles‐Agdeppa 2008; Hardinsyah 2016; Perignon 2016 (C)). Exclusion of Parker 2015 (C) did not change the direction of the effect or the heterogeneity.
There were no clear differences between other subgroups, or any obvious asymmetry in the funnel plot (Figure 5).

Funnel plot of comparison 1. Rice fortified with iron alone or in combination with other micronutrients versus unfortified rice (no micronutrients added), outcome 1.13, haemoglobin concentration (g/L)
-
Micronutrient content: rice fortified with iron alone showed a significant increase in mean haemoglobin (MD 3.93, 95% CI 1.24 to 6.62; I2 = 57%; 6 studies, 698 participants; Analysis 1.14); whereas the studies giving iron in combination with other micronutrients did not increase mean haemoglobin (MD 1.06, 95% CI 0.15 to 1.98; I2 = 24%; 6 studies, 1465 participants; Analysis 1.14).
-
Rice fortification method: hot extrusion (MD 1.93, 95% CI 0.53 to 3.32; I2 = 68%; 7 studies, 1563 participants; Analysis 1.15); cold extrusion (MD 1.54, 95% CI 0.58 to 2.51; I2 = 11%; 3 studies, 437 participants; Analysis 1.15);coating (MD 8.20, 95% CI −12.14 to 28.54; 1 study, 15 participants; Analysis 1.15); and mixed/unknown/unreported (MD −4.00, 95% CI −11.72 to 3.72; 1 study, 148 participants; Analysis 1.15).
-
Cooking method most commonly used in study setting (as reported): rinsing and boiling without excess water (MD 3.80, 95% CI 0.86 to 6.74; 1 study, 215 participants; Analysis 1.16); and unknown/unreported (MD 1.62, 95% CI 0.43 to 2.81; I2 = 51%; 10 studies, 1948 participants; Analysis 1.16).
-
Public health significance of anaemia at baseline in the target group: mild and moderate, 5% to 39.9% (MD 1.67, 95% CI −0.10 to 3.44; I2 = 70%; 6 studies, 1459 participants; Analysis 1.17); severe, 40% and more (MD 1.07, 95% CI −0.84 to 2.98; I2 = 0%; 2 studies, 360 participant; Analysis 1.17); and mixed/unknown/unreported (MD 3.42, 95% CI 1.10 to 5.73; I2 = 0%; 3 studies, 344 participants; Analysis 1.17).
-
Malaria endemicity at the time that the study was conducted: some malaria risk setting (MD 0.90, 95% CI 0.65 to 1.15; 1 study, 445 participants; Analysis 1.18); malaria‐free area (MD 3.15, 95% CI 0.98 to 5.31; I2 = 53%; 3 studies, 587 participants; Analysis 1.18); and unknown/unreported malaria setting (MD 1.33, 95% CI −0.48 to 3.14; I2 = 34%; 7 studies, 1131 participants; Analysis 1.18).
Vitamin A deficiency (as defined by the study authors)
Four studies contributed data for vitamin A deficiency (Hardinsyah 2016; Perignon 2016 (C); Pinkaew 2014; Thankachan 2012). Details are provided in Analysis 1.19. Consumption of fortified rice may make little or no difference to vitamin A deficiency (RR 0.68, 95% CI 0.36 to 1.29; 927 participants; 4 studies, low‐certainty evidence). Heterogeneity was marginally high (Tau² = 0.16; Chi² = 4.77, df = 3; P = 0.19; I² = 37%) and results have to be interpreted with caution. We did not include data from Hussain 2014 in the meta‐analysis, since the study authors reported vitamin A deficiency for the fortified rice group overall versus unfortified rice (37 out of 185 in the fortified arm and 22 out of 37 in the control arm). However their overall estimates had significant decrease in vitamin A deficiency in the fortified arm compared to control arm at the end of the six‐month intervention period.
There are no significant differences in the risk ratio across the subgroups. The details of subgroup analyses are presented below.
-
Micronutrient content: all the studies contributing data to this analysis compared iron plus other micronutrients with unfortified rice (RR 0.68, 95% CI 0.36 to 1.29; I2 = 37%; 4 studies, 927 participants; Analysis 1.20).
-
Rice fortification method: hot extrusion (RR 0.70, 95% CI 0.35 to 1.39; I2 = 34%; 4 studies, 765 participants; Analysis 1.21); and cold extrusion (RR 0.61, 95% CI 0.24 to 1.54; 1 study, 162 participants; Analysis 1.21).
-
Cooking method most commonly used in study setting (as reported): rinsing and boiling without excess water (RR 1.10, 95% CI 0.47 to 2.60; 1 study, 215 participants; Analysis 1.22); and unknown/unreported (RR 0.55, 95% CI 0.25 to 1.22; I2 = 34%; 3 studies, 712 participants; Analysis 1.22).
-
Public health significance of anaemia at baseline in the target group: mild and moderate, 5% to 39.9% (RR 0.60, 95% CI 0.29 to 1.24; I2 = 47%; 3 studies, 695 participants; Analysis 1.23) and severe, 40% and more (RR 1.46, 95% CI 0.30 to 7.07; 1 study, 232 participants; Analysis 1.23).
-
Malaria endemicity at the time that the study was conducted: some malaria risk setting (RR 0.57, 95% CI 0.30 to 1.08; 1 study, 442 participants; Analysis 1.24); malaria‐free area (RR 1.46, 95% CI 0.30 to 7.07; 1 study, 232 participants; Analysis 1.24); and unknown/unreported malaria setting (RR 0.55, 95% CI 0.12 to 2.59; I2 = 72%; 2 studies, 253 participants; Analysis 1.24).
Serum or plasma folate (nmol/L)
One study reported the level or comparison of serum folate (Hardinsyah 2016). The direction of benefit in this study was slightly towards fortified rice (MD 4.30, 95% CI 2.00 to 6.60; 1 study, 215 participants; low‐certainty evidence). The details are given in Analysis 1.25.
Any adverse effects (hookworm infection risk)
One study (Perignon 2016 (C)), reported that children given fortified rice were more likely to have hookworm infection compared to those given unfortified rice (RR 1.78, 95% CI 1.18 to 2.70, 1 study, 785 participants; low‐certainty evidence; Analysis 1.26).
Any adverse effects (abdominal pain more than three days)
One study (Thankachan 2012), reported that children given fortified rice were just as likely to have abdominal pain compared to those given unfortified rice (average RR 0.77, 95% CI 0.42 to 1.42; Analysis 1.26).
Diarrhoea (as defined by study authors; for studies among children aged 2 to 11.9 years of age)
One study reported the comparison of diarrhoeal episodes across the fortified and unfortified groups (Thankachan 2012). There was no difference in the risk of diarrhoea (average RR 3.52, 95% CI 0.18 to 67.39; 1 study, 258 participants, very low‐certainty evidence; Analysis 1.27).
Respiratory infections (for studies among children aged 2 to 11.9 years of age)
The included studies mentioned the episodes of respiratory infections in intervention and control groups during the study period, however, none reported the differences across the groups following rice fortification.
All‐cause death (for studies among children aged 2 to 11.9 years of age)
None of the included studies reported deaths.
Congenital anomalies (for studies among pregnant women with folic acid‐fortified rice as intervention)
No studies involved pregnant women.
Miscarriage (for studies among pregnant women)
No studies involved pregnant women.
Secondary outcomes
Serum or plasma retinol (µmol/L)
Five studies reported the outcome of serum retinol (µmol/L) across the iron‐fortified and unfortified groups (Angeles‐Agdeppa 2008; Hardinsyah 2016; Hussain 2014; Pinkaew 2014; Thankachan 2012). Details are presented in Analysis 1.28. Participants consuming rice fortified with iron alone or other micronutrients had a marginally higher plasma retinol compared to those consuming unfortified rice (MD 0.04, 95% CI −0.13 to 0.21; 5 studies; 727 participants). Heterogeneity was high (Tau² = 0.03; Chi² = 60.39, df = 4 P < 0.00001; I2 = 93%). Two studies favoured fortification (Angeles‐Agdeppa 2008; Hussain 2014), and three had ambiguous results (Hardinsyah 2016; Pinkaew 2014; Thankachan 2012). Heterogeneity was explained by one study (Hardinsyah 2016), and its removal showed a higher mean difference favouring fortification (MD 0.20, 9% CI 0.18 to 0.22). This study had seven micronutrients.
Serum or plasma zinc (µmol/L)
Three studies reported the effectiveness of multiple micronutrient‐fortified rice on the level of serum or plasma zinc among children (Hardinsyah 2016; Pinkaew 2014; Thankachan 2012). See Analysis 1.29 for details (MD 0.38, 95% CI −0.08 to 0.83; I2 = 28%; 3 studies, 618 participants).
Anthropometric measures
One study (Moretti 2006b), contributed data to the outcome height‐for‐age Z‐score and weight‐for‐height Z‐score. The mean difference for height‐for‐age Z‐score was 0.02 (95% CI −0.32 to 0.36; 1 study, 184 participants; Analysis 1.30) and for weight‐for‐height Z‐score mean difference was 0.13 (95% CI −0.19 to 0.45; 1 study, 184 participants; Analysis 1.31). For both these outcomes, fortification may or may not make a difference.
Risk of iron overload (defined by serum ferritin higher than 150 µg/L in women and higher than 200 µg/L in men)
No studies reported the aspects of iron overload.
Clinical and severe malaria
None of the included studies had details on malaria across any of the study groups. Few studies had declared they were conducted in malaria non‐endemic areas.
Night blindness (defined as the inability to see after dusk by people who typically report having normal vision during the day; only for vitamin A‐fortified rice as an intervention)
No studies with vitamin A reported night blindness.
Rice fortified with iron alone or in combination with other micronutrients versus no intervention
No studies contributed data for this outcome.
Rice fortified with vitamin A alone or in combination with other micronutrients versus unfortified rice
We included one study in this comparison (Hussain 2014).
Primary outcomes
Anaemia (defined as haemoglobin (Hb) below the WHO cut‐off, adjusted for altitude as appropriate)
No studies contributed data for this outcome.
Iron deficiency
No studies contributed data for this outcome.
Haemoglobin concentration (g/L)
One study contributed data for this analysis (Hussain 2014). The study had five intervention arms; we included the retinyl palmitate arm with the fortification arm and the arm without fortification as the control arm for this comparison. The study authors reported a significant increase in the haemoglobin concentration in the vitamin A‐fortified arm compared to the unfortified control arm (MD 10.00, 95% CI 8.79 to 11.21; 1 study, 74 participants; low‐certainty evidence; Analysis 2.1).
Vitamin A deficiency (as defined by study authors, by using a biomarker)
We did not include any studies in this meta‐analysis. One study (Hussain 2014), reported vitamin A deficiency; however there were no data on vitamin A deficiency status in the arm fortified with vitamin A only. Their estimates are reported for the fortification arms in total. Details of their findings are in comparison 1.
Diarrhoea (as defined by study authors; for studies among children aged 2 to 11.9 years of age)
No studies contributed data for this outcome.
Respiratory infections (for studies among children aged 2 to 11.9 years of age)
No studies contributed data for this outcome.
All‐cause death (for studies among children aged 2 to 11.9 years of age)
No studies contributed data for this outcome.
Serum or plasma retinol (µmol/L)
One study contributed data to this analysis (Hussain 2014). Fortification of rice with vitamin A probably increases the serum retinol concentration compared to unfortified rice (MD 0.17, 95% CI 0.13 to 0.21; 1 study, 74 participants; low‐certainty evidence; Analysis 2.2).
Any adverse effects (hookworm infection risk)
No studies contributed data for this outcome.
Any adverse effects (abdominal pain more than 3 days)
No studies contributed data for this outcome.
Rice fortified with vitamin A alone or in combination with other micronutrients versus no intervention
No studies contributed data to this comparison.
Rice fortified with zinc alone or in combination with other micronutrients versus unfortified rice (no micronutrients added)
No studies contributed data to this comparison.
Rice fortified with zinc alone or in combination with other micronutrients versus no intervention
No studies contributed data to this comparison.
Rice fortified with folic acid alone or in combination with other micronutrients versus unfortified rice (no micronutrients added)
No studies contributed data to this comparison.
Rice fortified with folic acid alone or in combination with other micronutrients versus no intervention
No studies contributed data to this comparison.
Summary of non‐randomised studies
The value of the controlled before‐and‐after studies was mixed. Salcedo 1950 documented a reduction in clinical beriberi. Gershoff 1977 reported on the changes in amino acid intake and weight and length but did not make any formal estimates of change. One of the more recent studies, Nogueira Arcanjo 2013, comparing iron‐fortified rice versus unfortified rice showed no change in mean haemoglobin but with an increase in anaemia in the unfortified group. The study comparing multiple micronutrient‐fortified rice with unfortified rice compared outcomes relative to baseline values within the fortified group and the unfortified group (Della Lucia 2016). In the fortified group, there was an improvement in folic acid, thiamine and serum zinc, but not for haemoglobin or ferritin. In the unfortified group, there was an improvement in thiamine and ferritin concentrations. The groups were unbalanced with respect to ferritin levels, being significantly higher in the fortified group at baseline.
In Nogueira Arcanjo 2013, the groups were different in the prevalence of anaemia at baseline: 8.9% (11/120 were anaemic) in the group receiving iron‐fortified rice, and 20.8% (30/144 were anaemic) in the group receiving unfortified rice (P = 0.009). At the end of the study, the groups remained different, 10.5% (13/120) among the participants receiving iron‐fortified rice, and 37.5% (54/144) among those receiving unfortified rice (P < 0.001). There was a statistically significant increase in anaemia prevalence in the control group receiving standard unfortified rice; however, the iron‐fortified rice group did not present a statistically significant change in the number of anaemic children after the intervention. Also, the groups were similar for haemoglobin concentration: 120.6 ± 10.1 g/L in the fortified rice group versus 124.0 ± 41.4 g/L in the unfortified rice group, P = 0.38; but after intervention, there was no significant difference between the groups, P = 0.56. The after intervention period haemoglobin concentrations were 121.4 ± 10.6 g/L in the fortified rice group and 122.9 ± 24.8 g/L. Among only anaemic participants, in the group receiving iron‐fortified rice before intervention, mean haemoglobin value was 101.2 ± 8.5 g/L (n = 11) and 115.6 ± 8.6 after intervention, P = 0.0003; in the control group receiving unfortified rice (n = 30), mean haemoglobin concentrations changed from 108.3 ± 11.1 g/L at baseline to 109.4 ± 11.8 g/L after intervention, P = 0.18. For the standard rice school: baseline mean haemoglobin was 124.0 ± 41.4 g/L, and after intervention 122.9 ± 24.8, P = 0.78. Considering only anaemic participants, there was a significant increase in haemoglobin means before and after intervention, P = 0.003 in the fortified rice school.
In the other controlled before‐and‐after study (Gershoff 1977), the average haemoglobin concentration among those children consuming less than 10% or no fortified rice for all ages (5 to 9 years of age) was 114.6 g/L ± 6.6 (n = 135) in 1971 and changed to 119.8 g/L ± 12.6 (n = 135) in 1975. On the other hand, the average haemoglobin concentration among those children consuming more than 66% of fortified rice for all ages (5 to 9 years) was 117.7 g/L ± 8.8 (n = 61) in 1971 and 122.5 g/L ± 11.8 (n = 61) in 1975. These changes were not significant.
Discussion
Summary of main results
We have summarised the findings here and in summary of findings Table for the main comparison and summary of findings Table 2. We included 17 studies in this review, 12 of which were RCTs. Two of the RCTs were cluster‐randomised trials. Five studies had a before‐and‐after study design that compared micronutrient‐fortified rice with unfortified rice. All the included studies had unfortified rice in the control arm. There were no studies comparing fortified rice with no intervention arm.
We considered 12 RCTs for the meta‐analysis. Ten RCTs were conducted in children and two were among non‐pregnant and non‐lactating women. All studies included in this review had unfortified rice as the control. All the studies included iron in their intervention arms (one study by Hussain 2014 with multiple arms had one fortification group with vitamin A only). Five studies included rice fortified with iron alone and one study had one arm with iron alone as the intervention. Seven studies used multiple micronutrients (six in children; one in women). Vitamin A, zinc, folate and vitamin B were the additional micronutrients. Four studies fortified with vitamin A, five studies fortified with zinc and three studies fortified with folic acid. The fortification profile of the included studies is shown in Table 4.
Participants consuming rice fortified with iron alone or in combination with other micronutrients were just as likely to be anaemic as those taking unfortified rice (7 RCTs, low‐certainty evidence); however, fortification of rice may reduce the risk of iron deficiency (8 RCTs, low‐certainty evidence). Considering the low level of certainty, rice fortification may make an improvement in the mean haemoglobin levels (g/L; 11 RCTs). Consumption of fortified rice may make little or no difference to vitamin A deficiency (4 RCTs, low‐certainty evidence), it may improve serum or plasma folate (1 RCT). Two studies reported on three adverse effects of diarrhoea, hookworm infection risk and abdominal pain of more than three days' duration. We are uncertain about the risk of diarrhoea (1 RCT, very low‐certainty evidence). Children given fortified rice may have a higher risk of hookworm infection compared to those given unfortified rice (1 RCT, low‐certainty evidence) and there may not be any difference in terms of abdominal pain of more than three days.
We noted a slight improvement in serum or plasma retinol (µmol/L) concentration among the participants consuming fortified rice (5 RCTs). There is no difference in serum zinc concentration (µmol/L; 3 RCTs), height‐for‐age Z‐score (1 RCT) and weight‐for‐height Z‐score (1 RCT) with fortification.
We included one RCT under the comparison of vitamin A alone or in combination with other micronutrients versus unfortified rice, since all other RCTs that included vitamin A in their fortification arm, also had iron. So they were only included in the first comparison, to avoid duplication.
Participants consuming rice fortified with vitamin A alone tend to have higher mean haemoglobin levels (1 RCT) and serum retinol levels (1 RCT).
The controlled before‐and‐after studies were significant in showing the first evidence of a clinical outcome attributable most likely to rice fortification (Salcedo 1950), and the extent by which dietary content is improved (Gershoff 1977). The limitations of unbalanced groups, most likely due to the absence of random allocation into treatment groups, limits our interpretation of the two studies in Brazil (Della Lucia 2016; Nogueira Arcanjo 2013), however both provide a foundation for planning studies on zinc and folate, both of which have very few studies.
Overall completeness and applicability of evidence
The review includes studies on preschool and school‐age children, and non‐pregnant, non‐lactating women. We found no studies for adolescents only (except one study that included adolescent girls), pregnant or lactating women or adult males. All but one study were from low‐ and middle‐income countries, where anaemia prevalence among children aged 6 to 59 months of age ranged between 26% to 59% (WHO 2015a). The studies with serum retinol as outcomes were conducted in countries where the prevalence of vitamin A deficiency among preschoolers ranged from 16% to 62% (WHO 2009a).
Almost all randomised clinical trials used micronized ferric pyrophosphate and the hot extrusion method, with three studies including either a cold or warm extrusion arm. Of the four vitamins and minerals identified for review, studies were found to have investigated four (iron, vitamin A, folate and zinc). All but one study had haemoglobin data but not all studies reported the mean haemoglobin or anaemia rates. Although three studies included folic acid as one of the fortificants, folate status was reported in only one. Also, most of the included RCTs were conducted in school settings. The certainty of evidence for anaemia and iron deficiency was low. For haemoglobin concentration, it was very low‐certainty evidence. This being a closed and controlled set up, generalising the findings of such studies becomes a challenge for the present systematic review. There could also be an interplay of co‐interventions like other added micronutrients to the same fortified rice, dosage and absorption of iron and consumption of other nutritive items, which would alter the overall estimate of effect.
Another potential aspect of the rice fortification and its effect on malnutrition is the duration of intervention. The included studies had a duration of follow‐up from two weeks to four years. However in the included RCTs, one study had a follow‐up of two weeks, other studies ranged from four months to eight months. Thus there could be a role played by the duration of intervention and follow‐up.
Quality of the evidence
Among the RCTs that contributed to the meta‐analysis, we assessed two studies as having overall low risk of bias and one study as having a high or unclear risk of bias in most of the domains. Excluding this study favoured fortification and altered the conclusion for anaemia (from no effect to a reduction of anaemia) and the conclusion for the multiple micronutrient subgroup in comparison 1 for mean haemoglobin (from no effect to an increased mean difference). Most of these studies inadequately described their randomisation sequence generation. Close to half had an unclear description of allocation concealment and blinding of outcomes. Most of the studies had low attrition rate.
The GRADE assessment of the certainty of evidence was low for anaemia (no effect), iron deficiency (favours fortification), vitamin A deficiency (no effect), serum or plasma folate (one included study favouring fortification), and adverse events (one study reported hookworm infection risk higher with fortification) in the comparison of iron alone or in combination with other micronutrients versus no fortification. The certainty of the evidence was also low for mean haemoglobin (may favour). We rated the outcome diarrhoea (no effect) as very low‐certainty evidence. We mainly downgraded studies due to inconsistency and imprecision in the estimates. In the comparison of vitamin A alone versus no fortification, one RCT contributed data and we graded the certainty of evidence for haemoglobin concentration and serum retinol concentration as low.
Further research is very likely to have an important impact on our confidence in the estimates of effect and is likely to change the results.
Potential biases in the review process
Two review authors independently carried out the review process, with the same data extraction sheet and tools to assess risk of bias in the included studies. Many studies had minimum information regarding the randomisation procedure, allocation concealment and blinding. In the absence of precise details, we considered mutual discussion among review authors as final in this review, since these included subjective components. We also extensively searched grey literature and trials registries, along with contacting agencies involved in carrying out RCTs and subject experts; thus minimising publication bias in this review. Also there was no language limit set in this systematic review for searches as well as obtaining abstracts/full‐text articles. We sought the help of translators to convert non‐English‐language articles to English. This would minimise the language bias in this review.
Agreements and disagreements with other studies or reviews
Our review is the first systematic review and meta‐analysis specific to rice as a vehicle to fortification as a public health intervention. There are systematic reviews and meta‐analyses of micronutrient fortification of staples, condiments and processed foods including all age groups, but these do not include a subgroup analysis specifically for rice (Das 2013; Gera 2012). Only two of the 12 studies included in our review were included in Das 2013 and our review did not include infants and young children under two years of age. In Das 2013, staple foods fortified with iron were found to improve mean haemoglobin and serum ferritin concentrations, and reduce the risk of anaemia. Staple foods fortified with vitamin A improved mean haemoglobin and serum retinol concentrations. Cereals fortified with zinc improved zinc serum levels. Staple foods fortified with iron had no impact on iron indicators among women. The two reviews agreed that fortification with iron improved mean haemoglobin concentrations. Our review showed a reduction of iron deficiency, while Das 2013 showed an improvement in serum ferritin concentrations. There was no agreement between Das 2013 and this review on the impact on anaemia, vitamin A and zinc concentrations or deficiency. The systematic review by Gera 2012 included only apparently healthy individuals and examined the effect of fortified food items on haematological outcomes. They concluded that food items fortified with iron led to improvement in haemoglobin, serum ferritin and iron status and there by reduced the risk of anaemia.
Another systematic review and meta‐analysis evaluated the effect of fortification of staples with zinc on serum zinc levels and zinc deficiency (Shah 2016). Zinc‐fortified staples were compared with food without zinc. None of the studies included in our review were included in Shah 2016. Shah 2016 showed that fortification of foods with zinc alone, but not in combination with other micronutrients, improved serum zinc levels. Our review did not have a comparison of rice fortified with zinc alone with unfortified rice, but rice fortified with zinc and other micronutrients did not improve zinc levels. In both reviews, the certainty of evidence was low for zinc.
A systematic review of rice fortification included seven studies among children aged 6 to 59 months (Hijar 2015). They did not carry out a meta‐analysis and the search strategy was more limited than that used in our review. The population also included children less than two years, who we excluded from our review. None of the studies in our review were included in the review by Hijar 2015. They reported that rice fortification was effective in correcting iron deficiency among children aged less than five years. The improvement was not significant for vitamin A‐fortified rice.
Another systematic review of rice fortification with no age restrictions included 12 studies that fortified rice with iron, four studies that fortified with vitamin A and two that included other micronutrients (De Pee 2017). They gave a description of the direction of the effects, but did not perform a meta‐analysis. The review by De Pee 2017 concluded that with the available evidence of efficacy, stability and needs, rice should be fortified with multiple micronutrients including iron, zinc, and vitamins A, B1 (thiamin), B3 (niacin) B6 (pyridoxine), B9 (folic acid) and B12 (cobalamin). The meta‐analysis in our review shows evidence of an effect of iron on mean haemoglobin and iron deficiency; of vitamin A fortification on vitamin A deficiency; and of folate fortification on folate deficiency. Another review on issues related to rice fortification in correcting micronutrient deficiency compiled the evidence from available primary studies to conclude that rice fortification is an effective strategy (Piccoli 2012).
WHO/CDC logic model for micronutrients interventions in public health (with permission from WHO)
'Risk of bias' summary: review authors' judgements about each 'Risk of bias' item for each included study
Four studies were controlled before‐and‐after studies (Ara 2019; Della Lucia 2016; Gershoff 1977; Nogueira Arcanjo 2013), and one was a controlled cross‐sectional study (Salcedo 1950)
'Risk of bias' graph: review authors' judgements about each 'Risk of bias' item presented as percentages across all included studies
Funnel plot of comparison 1. Rice fortified with iron alone or in combination with other micronutrients versus unfortified rice (no micronutrients added), outcome 1.13, haemoglobin concentration (g/L)

Comparison 1 Rice fortified with iron alone or in combination with other micronutrients versus unfortified rice (no micronutrients added)., Outcome 1 Anaemia (defined as haemoglobin (Hb) below the WHO cut‐off, adjusted for altitude as appropriate).

Comparison 1 Rice fortified with iron alone or in combination with other micronutrients versus unfortified rice (no micronutrients added)., Outcome 2 Anaemia (subgroup: by micronutrient content).

Comparison 1 Rice fortified with iron alone or in combination with other micronutrients versus unfortified rice (no micronutrients added)., Outcome 3 Anaemia (subgroup: by rice fortification method).

Comparison 1 Rice fortified with iron alone or in combination with other micronutrients versus unfortified rice (no micronutrients added)., Outcome 4 Anaemia (subgroup: by cooking method most commonly used in trial setting).

Comparison 1 Rice fortified with iron alone or in combination with other micronutrients versus unfortified rice (no micronutrients added)., Outcome 5 Anaemia (subgroup: by public health significance of anaemia at baseline ).

Comparison 1 Rice fortified with iron alone or in combination with other micronutrients versus unfortified rice (no micronutrients added)., Outcome 6 Anaemia (subgroup: by malaria endemicity).

Comparison 1 Rice fortified with iron alone or in combination with other micronutrients versus unfortified rice (no micronutrients added)., Outcome 7 Iron deficiency (as defined by study authors, based on a biomarker of iron status).

Comparison 1 Rice fortified with iron alone or in combination with other micronutrients versus unfortified rice (no micronutrients added)., Outcome 8 Iron deficiency (subgroup: by micronutrient content).

Comparison 1 Rice fortified with iron alone or in combination with other micronutrients versus unfortified rice (no micronutrients added)., Outcome 9 Iron deficiency (subgroup: by rice fortification method).

Comparison 1 Rice fortified with iron alone or in combination with other micronutrients versus unfortified rice (no micronutrients added)., Outcome 10 Iron deficiency (subgroup: by cooking method most commonly used in trial setting).

Comparison 1 Rice fortified with iron alone or in combination with other micronutrients versus unfortified rice (no micronutrients added)., Outcome 11 Iron deficiency (subgroup: by public health significance of anaemia at baseline ).

Comparison 1 Rice fortified with iron alone or in combination with other micronutrients versus unfortified rice (no micronutrients added)., Outcome 12 Iron deficiency (subgroup: by malaria endemicity).

Comparison 1 Rice fortified with iron alone or in combination with other micronutrients versus unfortified rice (no micronutrients added)., Outcome 13 Haemoglobin concentration (g/L).

Comparison 1 Rice fortified with iron alone or in combination with other micronutrients versus unfortified rice (no micronutrients added)., Outcome 14 Haemoglobin concentration (subgroup: by micronutrient content).

Comparison 1 Rice fortified with iron alone or in combination with other micronutrients versus unfortified rice (no micronutrients added)., Outcome 15 Haemoglobin concentration (subgroup: by rice fortification method).

Comparison 1 Rice fortified with iron alone or in combination with other micronutrients versus unfortified rice (no micronutrients added)., Outcome 16 Haemoglobin concentration (subgroup: by cooking method most commonly used in trial setting).

Comparison 1 Rice fortified with iron alone or in combination with other micronutrients versus unfortified rice (no micronutrients added)., Outcome 17 Haemoglobin concentration (subgroup: by public health significance of anaemia at baseline).

Comparison 1 Rice fortified with iron alone or in combination with other micronutrients versus unfortified rice (no micronutrients added)., Outcome 18 Haemoglobin concentration (subgroup: by malaria endemicity).

Comparison 1 Rice fortified with iron alone or in combination with other micronutrients versus unfortified rice (no micronutrients added)., Outcome 19 Vitamin A deficiency (as defined by study authors, by using a biomarker of vitamin A).

Comparison 1 Rice fortified with iron alone or in combination with other micronutrients versus unfortified rice (no micronutrients added)., Outcome 20 Vitamin A deficiency (subgroup: by micronutrient content).

Comparison 1 Rice fortified with iron alone or in combination with other micronutrients versus unfortified rice (no micronutrients added)., Outcome 21 Vitamin A deficiency (subgroup: by rice fortification method).

Comparison 1 Rice fortified with iron alone or in combination with other micronutrients versus unfortified rice (no micronutrients added)., Outcome 22 Vitamin A deficiency (subgroup: by cooking method most commonly used in trial setting).

Comparison 1 Rice fortified with iron alone or in combination with other micronutrients versus unfortified rice (no micronutrients added)., Outcome 23 Vitamin A deficiency (subgroup: by public health significance of anaemia at baseline ).

Comparison 1 Rice fortified with iron alone or in combination with other micronutrients versus unfortified rice (no micronutrients added)., Outcome 24 Vitamin A deficiency (subgroup: by malaria endemicity).

Comparison 1 Rice fortified with iron alone or in combination with other micronutrients versus unfortified rice (no micronutrients added)., Outcome 25 Serum or plasma folate (nmol/L).

Comparison 1 Rice fortified with iron alone or in combination with other micronutrients versus unfortified rice (no micronutrients added)., Outcome 26 Any adverse effects.

Comparison 1 Rice fortified with iron alone or in combination with other micronutrients versus unfortified rice (no micronutrients added)., Outcome 27 Diarrhoea (as defined by study authors).

Comparison 1 Rice fortified with iron alone or in combination with other micronutrients versus unfortified rice (no micronutrients added)., Outcome 28 Serum or plasma retinol (µmol/L).

Comparison 1 Rice fortified with iron alone or in combination with other micronutrients versus unfortified rice (no micronutrients added)., Outcome 29 Serum or plasma zinc (µmol/L).

Comparison 1 Rice fortified with iron alone or in combination with other micronutrients versus unfortified rice (no micronutrients added)., Outcome 30 Height‐for‐age Z‐score.

Comparison 1 Rice fortified with iron alone or in combination with other micronutrients versus unfortified rice (no micronutrients added)., Outcome 31 Weight‐for‐height Z‐score.

Comparison 2 Rice fortified with vitamin A alone or in combination with other micronutrients versus unfortified rice (no micronutrients added), Outcome 1 Haemoglobin concentration (g/L).

Comparison 2 Rice fortified with vitamin A alone or in combination with other micronutrients versus unfortified rice (no micronutrients added), Outcome 2 Serum or plasma retinol (µmol/L).
| Rice fortified with iron alone or in combination with other micronutrients compared to unfortified rice (no micronutrients added) for addressing micronutrient malnutrition | ||||||
| Patient or population: general population older than 2 years of age (including pregnant women) from any country | ||||||
| Outcomes | Anticipated absolute effects* (95% CI) | Relative effect | № of participants | Certainty of the evidence | Comments | |
| Risk with unfortified rice (no micronutrients added) | Risk with rice fortified with iron alone or in combination with other micronutrients | |||||
| Anaemia (defined as haemoglobin below the WHO cut‐off, adjusted for altitude as appropriate) | Study population | RR 0.72 (0.54 to 0.97) | 1634 (7 RCTs) | ⊕⊕⊝⊝ Low1 | Included studies: Angeles‐Agdeppa 2008; Hardinsyah 2016; Hotz 2008; Parker 2015 (C); Perignon 2016 (C); Radhika 2011; Thankachan 2012 | |
| 388 per 1000 | 279 per 1000 | |||||
| Iron deficiency (as defined by study authors, based on a biomarker of iron status) | Study population | RR 0.66 (0.51 to 0.84) | 1733 | ⊕⊕⊝⊝ | Included studies: Angeles‐Agdeppa 2008; Hardinsyah 2016; Hotz 2008; Moretti 2006b; Perignon 2016 (C); Pinkaew 2013; Radhika 2011; Thankachan 2012 | |
| 228 per 1000 | 150 per 1000 | |||||
| Haemoglobin concentration (in g/L) | The mean haemoglobin concentration (g/L) in the intervention groups was 1.83 higher (0.66 to 3.00 higher) | ‐ | 2163 | ⊕⊕⊝⊝ | Included studies: Angeles‐Agdeppa 2008; Hardinsyah 2016; Hotz 2008; Hussain 2014; Losso 2017; Moretti 2006b; Parker 2015 (C); Perignon 2016 (C); Pinkaew 2013; Radhika 2011; Thankachan 2012 | |
| Vitamin A deficiency (as defined by the study authors) | Study population | RR 0.68 (0.36 to 1.29) | 927 (4 RCTs) | ⊕⊕⊝⊝ | Included studies: Hardinsyah 2016; Perignon 2016 (C); Pinkaew 2014; Thankachan 2012 | |
| 105 per 1000 | 71 per 1000 (38 to 135) | |||||
| Serum or plasma folate (nmol/L) | The mean serum or plasma folate (nmol/L) in the intervention group was 4.30 higher (2.00 to 6.60 higher) | ‐ | 215 (1 RCT) | ⊕⊕⊝⊝ | Included study: Hardinsyah 2016 | |
| Any adverse effects (hookworm infection risk) | Study population | RR 1.78 | 785 | ⊕⊕⊝⊝ | Included study: Perignon 2016 (C) | |
| 119 per 1000 | 211 per 1000 | |||||
| Diarrhoea (as defined by study authors) | Study population | RR 3.52 | 258 | ⊕⊝⊝⊝ | Included study: Thankachan 2012 | |
| 0 per 1000 | 0 per 1000 | |||||
| *The risk in the intervention group (and its 95% confidence interval) is based on the assumed risk in the comparison group and the relative effect of the intervention (and its 95% CI). | ||||||
| GRADE Working Group grades of evidence | ||||||
| 1Downgraded 2 levels: one for serious limitations in study design or execution (risk of bias) and one for indirectness. The baseline characteristics were not similar in all groups and the method of randomisation was unclear in half of the studies. Also studies used different cut‐off levels of haemoglobin to define anaemia. Hardinsyah 2016; Parker 2015 (C); Perignon 2016 (C); Radhika 2011 used WHO cut‐off levels, Hotz 2008 used CDC criteria and Angeles‐Agdeppa 2008 and Thankachan 2012 did not name the criteria they used. | ||||||
| Rice fortified with vitamin A alone or in combination with other micronutrients compared to unfortified rice (no micronutrients added) for addressing micronutrient malnutrition | |||||
| Patient or population: general population older than 2 years of age (including pregnant women) from any country | |||||
| Outcomes | Anticipated absolute effects* (95% CI) | Relative effect | № of participants | Certainty of the evidence | Comments |
| Risk with rice fortified with vitamin A alone or in combination with other micronutrients | |||||
| Haemoglobin concentration (g/L) | MD 10 higher | ‐ | 74 | ⊕⊕⊕⊝ | Included study: Hussain 2014 |
| Serum or plasma retinol (µmol/L) | MD 0.17 higher | ‐ | 74 | ⊕⊕⊕⊝ | Included study: Hussain 2014 |
| *The risk in the intervention group (and its 95% confidence interval) is based on the assumed risk in the comparison group and the relative effect of the intervention (and its 95% CI). | |||||
| GRADE Working Group grades of evidence | |||||
| 1Downgraded by 2 levels: one level for risk of bias and one level for indirectness. The only study was carried out in India with a small sample size (250 children aged 5‐8 years) attending a school with a subsidised lunch feeding programme (Hussain 2014). | |||||
| Forms of rice | Description of rice |
| Rough rice (paddy rice) | Rice kernels still enclosed in an inedible, protective hull |
| Brown rice | Rice with only the hull removed. Bran layers and rice germ remain, giving the rice a brown colour |
| Parboiled rice | Rice pressurised to gelatinise the starch within the rice kernel, resulting in a firmer, more separate grain that is more stable and less susceptible to overcooking than regular‐milled white rice |
| Regular‐milled white rice (milled rice) | Polished whole rice, or polished rice. Hull, bran layer and germ have all been removed |
| Precooked rice | Regular milled white rice, parboiled milled white rice, and brown rice can be precooked and dehydrated before packaging. Examples of precooked rice are quick‐cooking rice, instant rice, and boil‐in‐the‐bag rice |
| Individually quick frozen (IQF) rice | Cooked grains are individually frozen before packaging |
| Crisped/puffed/expanded rice | Kernels can be processed in a number of different ways and shapes to meet particular manufacturing need |
| Adapted from Dexter 1998. | |
| Study and year (Country) | Participants | Type of rice fortification and dosage | Duration of intervention | Overall risk of bias |
| RCTs (individual randomisation) | ||||
| (Philippines) | 180 anaemic children aged 6‐9 years excluding severe anaemia (Hb < 70 g/L), history of blood disorders and other haemoglobinopathies |
| 6 months | High |
| (Indonesia) | 200 post‐menarchal adolescent girls 14‐18 years of age attending boarding school |
| 4 months | High |
| (Mexico) | 180 non‐pregnant, non‐lactating women 18‐49 years of age with moderate to low Hb concentrations from 6 factories |
| 6 months | High |
| (India) | 222 iron‐ and vitamin A‐depleted children 5‐8 years of age attending a subsidised lunch feeding programme |
| 6 months | High |
| (USA) | 17 menstruating women with iron‐deficiency anaemia |
| 2 weeks | High |
| (India) | 184 iron‐depleted children aged 6‐13 years from a primary school serving the Rock‐Colony neighbourhood |
| 7 months | Low |
| (Thailand) | The study was conducted in 8 primary schools with children aged 4‐12 years and they were mainly from low‐income families. |
| 5 months | High |
| (Thailand) | One primary school in the Muang district, of Thailand with children aged 8‐12 years, were the study participants |
| 2 months | High |
| (India) | 140 children aged between 5 and 11 years (with haemoglobin > 70 g/L) |
| 8 months | Low |
| (India) | Total of 258 anaemic (Hb concentrations 115 g/L for 6–11 years and 120 g/L for 12 years) children attending 4 primary schools aged 6‐12 years |
| 6 months | High |
| RCTs (cluster randomisation) | ||||
| (Burundi) | The study included 1071 children from 12 schools in Burundi aged between 7 and 11 years |
| 7 months | High |
| (Cambodia) | The study was a double‐blind cluster‐randomised, placebo‐controlled trial conducted among a total of 2440 school‐going children aged 6‐16 years. |
| 6 months | High |
| Non‐randomised studies (controlled before‐and‐after studies) | ||||
| (Bangladesh) | 870 women aged 15‐49 years excluding severe anaemia (435/group) at baseline and 800 (400/group) at end line |
| 12 months | High |
| (Brazil) | 131 non‐anaemic children between 2 and 6 years old, of both genders, participated in the study. |
| 4 months | High |
| (Thailand) | 2250 children aged 1.5‐9 years from 29 villages |
| 4 years | High |
| (Brazil) | 303 children 2‐5 years of age attending 2 public schools in City of Sobral‐Ceará, in the northeast of Brazil, between August and December 2010 |
| 18 weeks | High |
| Non‐randomised studies (controlled cross‐sectional study) | ||||
| (Philippines) | 574 children aged between 3 and 18 years 2188 Government employees with their families 1416 military personnel (clinical assessment limited to 350 in the experimental group and 116 in the control group) |
| 8 months | High |
| CBA: controlled before‐and‐after study; Hb: haemoglobin; RCT: randomised controlled trial | ||||
| Study | Place | Race/ethnicity | Occupation | Gender | Religion/ culture/education | Socio‐economic status | Social status | Others/ disability/ age/ sexual orientation | Overall PROGRESS‐Plus |
| Metro Manila, Division Pasig; Philippines | No specific mention, apart from the locality of the school in the capital city | School children | Male 99 + female 81 | No religion mentioned; children going to San Joaquin Elementary School (public) | Not mentioned | Not mentioned | Anaemic children; sexual orientation not mentioned | This study was carried out among 180 anaemic children going to a government elementary school. | |
| Vulnerable Group | Not mentioned specifically, however, they were the local resident women. | It included professional workers, | Non‐pregnant women aged 15‐49 years | No religion mentioned; nearly 25% without any education | No direct estimate provided; however, most of the study participants were from lower socioeconomic strata | Not mentioned | Women with severe anaemia were excluded. Sexual orientation is not mentioned | The study was carried out among 870 women of reproductive age and local residents of Bangladesh | |
| Brazil | Not specified | School‐going children | No religion mentioned, attending philanthropic schools | Not mentioned | Not mentioned | Children, 2‐6 years old | This study was carried out in 2 public schools among non‐anaemic children 2‐6 years of age during 4 consecutive months. | ||
| Chiang Mai villages in tile valley of the Ping River, Thailand | Thai children | Children in the community | Male 1121 + female 1109 | No religion mentioned. Children in the study villages | Not mentioned | Low/middle | Normal children; sexual orientation not mentioned | The study included 2230 children attending pre‐school and school from the low/middle social background | |
| Medan of North Sumatra Province, Indonesia | The majority of participants' ethnicity was Javanese and Bataknese | Teenage girls attending boarding school | Female | There is mention of the Ramadan fasting month during the second week of June | The family income ranges from 4.9 million to 5.5 million Rupiahs (Approximately 340 to 390 US Dollars) | Not mentioned | Age 14‐18 years of age | This study was carried out among post‐menarchal adolescent girls attending boarding school in Indonesia. The study lasted 4 months. | |
| Morelos State, Mexico | Mexican women | Factory workers | Women only | No religion mentioned; 18‐49 years | Low/middle school | Low/middle | Anaemic women; sexual orientation not mentioned | This study included women with altitude‐adjusted Hb concentrations between 105 | |
| India | Iron and vitamin A‐depleted 5‐8‐year‐old children attending a subsidised lunch feeding programme | Children attending a school‐based feeding programme | Not specified | Not reported | Not reported | Not mentioned, although programme is subsidised | 5‐8 years of age | This study included 222 children aged 5‐8 years attending a school where there was a subsidised lunch feeding programme in India receiving a 200‐250 g meal of cooked rice daily. | |
| Baton Rouge, USA | In the iron‐fortified group: 4 white, 3 black or African‐American, 1 Asian, 1 other; in the unfortified rice group: 3 white, 2 black or African American, 1 Asian | Women only | Not reported | Not mentioned | Not mentioned | 18‐50 years of age | This study included women with iron‐deficiency anaemia recruited through web and phone interviews and then in a clinic. | ||
| Franciscan primary school serving the | Indian | School‐going children | Not mentioned | 6‐13 years | Low | Low | Children with iron deficiency; sexual orientation not mentioned | Study included children having iron deficiency from an urban slum neighbourhood in India, belonging to low socioeconomic status and low social class | |
| Public schools in City of Sobral‐Ceará, in the northeast of Brazil | Not reported | School‐going children | Fortified rice group: 65 male: 73 female; unfortified rice group: 79 male: 86 female | 2‐5 years of age | Not reported. Family income 300 USD or less (it is unclear if this is weekly or monthly income ‐ not reported). 126/138 participants from iron‐fortified group versus 154/165 participants from unfortified group. | Not mentioned | Children 2‐5 years of age. Other information not reported | This before‐and‐after study included children 2‐5 years of age from 2 public schools in northeast Brazil receiving the school lunch programme and the fortified/unfortified intervention once a week. | |
| The study was carried out in Muyinga Province in Burundi catering to mainly agrarian population | Burundians | School‐going children | Female: 51.1% in intervention arm, 55.3% in control arm | Religion was not mentioned. 7‐11 years | Mean socioeconomic status score quintile = 3.03 (1.45) for intervention arm and 2.97 (1.37) for control arm | Not mentioned | Children with Hb level 70‐110 g/L and those who had not taken any nutritional supplements during the past 1 month since commencement of the study were included. Sexual orientation is not mentioned. | This cluster‐RCT included 904 children who were mild to moderately anaemic from the selected schools of Burundi and mainly with an agricultural background. | |
| The study was carried out in Kampung Speu Province of Cambodia | Cambodians | School‐going children | Male and female participants had equal representation (50% each) | 6‐16 years | Not mentioned | Not mentioned | Excluding severely anaemic children. All in the eligible age group were included in the study. Sexual orientation not mentioned | The cluster‐RCT included children from selected schools of Cambodia in KamPong Speu province with rice farming as a predominant occupation and income source. | |
| Satun province, west coast of southern Thailand | Thai Muslims | School children | Male, 98 + female 105 | Majority Muslim, age group of 7‐12 years | Low | Low/middle | Children with zinc deficiency; sexual orientation not mentioned | This study included school‐going children from low socioeconomic status and having zinc deficiency in Thailand. | |
| Muang District, Satun Province of southern Thailand | Thai Muslims | School Children | Males, 24 and females, 26 | Majority Muslims in the age group 8‐12 years | Low | Low/middle | Children who had consumed the triple‐fortified rice before or showed clinical symptoms of VAD (Bitots spot or ocular signs of xerophthalmia) or serum retinol values of < 0.7m mol/L were | This study included school‐going children from low socioeconomic status and having zinc deficiency in Thailand. | |
| Village of Keesara; Andhra Pradesh State in India | Indian | School children | Male 56 + female 90 | No mention of religion; age group of 5‐11 years | Low/middle | Low/middle | Anaemic children; sexual orientation not mentioned | The study included anaemic children from low‐middle socioeconomic background belonging to a rural area in India. | |
| Bataan, Philippines | Filipinos | Children and military personnel | Male and female, but proportions not reported | No mention of religion or education | Children lived in a welfare institution; military personnel were fully employed | Not mentioned | No exclusions were reported; sexual orientation was not mentioned | The study was conducted among children living in a welfare institution and among military personnel in the Philippines. | |
| Primary schools in | Indians | School children | Male 47%, female 53% | Hindu > Christians > Muslim; 6‐12 years | Low/middle school | Low | Anaemic children; sexual orientation not mentioned | This study included anaemic school going children from low socioeconomic background from an urban area India. | |
| Hb: haemoglobin; RCT: randomised controlled trial | |||||||||
| Study | Elemental iron (mg) | Vitamin Aa (mg) | Zinc (mg) | Folic acid (µg) | Vitamin B1 (thiamin) (mg) | Vitamin B2 (riboflavin) (mg) | Vitamin B3 (niacin) (mg) | Vitamin B6 (pyridoxine) (mg) | Vitamin B12 (cobalamin) (µg) |
| 6.25 | ‐ | ‐ | ‐ | ‐ | ‐ | ‐ | ‐ | ‐ | |
| Ara 2019 (CBA) | 6 | 0.15 | 4.00 | 130 | 0.40 | 1.0 | |||
| Della Lucia 2016 (CBA) | 8.4 | ‐ | 4.20 | 144 | 0.72 | ‐ | ‐ | ‐ | ‐ |
| Gershoff 1977 (CBA) | 0.2 | 0.81 | 0.087 | 0.04 | |||||
| 0.2 | 0.81 | 0.087 | 0.04 | ||||||
| 0.2 | 0.81 | 0.087 | 0.04 | ||||||
| 10.8 | 0.28 | 5.20 | 145 | ‐ | 3.2 | ||||
| 26.6 | ‐ | ‐ | ‐ | ‐ | ‐ | ‐ | ‐ | ‐ | |
| 4 | ‐ | ‐ | ‐ | ‐ | ‐ | ‐ | ‐ | ||
| ‐ | 1.20 (as beta‐carotene) | ‐ | ‐ | ‐ | ‐ | ‐ | ‐ | ‐ | |
| ‐ | 0.18 | ‐ | ‐ | ‐ | ‐ | ‐ | ‐ | ‐ | |
| 4 | 0.18 | ‐ | ‐ | ‐ | ‐ | ‐ | ‐ | ‐ | |
| 4 | 1.20 (as beta‐carotene) | ‐ | ‐ | ‐ | ‐ | ‐ | ‐ | ‐ | |
| 18 | ‐ | ‐ | ‐ | ‐ | ‐ | ‐ | ‐ | ‐ | |
| 20 | ‐ | ‐ | ‐ | ‐ | ‐ | ‐ | ‐ | ‐ | |
| Nogueira Arcanjo 2013 (CBA) | 112.8 | ‐ | ‐ | ‐ | ‐ | ‐ | ‐ | ‐ | ‐ |
| 11.9 | ‐ | 5.70 | 400 | 1.80 | ‐ | ‐ | ‐ | ‐ | |
| 10.67 | ‐ | 3.04 | 170 | 1.06 | ‐ | ‐ | ‐ | ‐ | |
| 7.55 | 0.64 | 2.02 | 280 | 1.43 | ‐ | 12.57 | ‐ | 3.8 | |
| 7.46 | 0.29 | 3.68 | 140 | 0.69 | ‐ | 7.98 | 0.92 | 1.26 | |
| 20 | 2.10 | 18 | ‐ | ‐ | ‐ | ‐ | ‐ | ‐ | |
| 20 | 2.10 | 18 | ‐ | ‐ | ‐ | ‐ | ‐ | ‐ | |
| 15 | ‐ | ‐ | ‐ | ‐ | ‐ | ‐ | ‐ | ‐ | |
| Salcedo 1950 (CBA) | 2.86 | ‐ | ‐ | ‐ | 0.44 | ‐ | 0.33 | ‐ | ‐ |
| 12.5 | 0.50 | 3 | 75 | 0.38 | ‐ | 5 | 0.38 | 0.75 | |
| 6.25 | 0.50 | 3 | 75 | 0.38 | ‐ | 5 | 0.38 | 0.75 | |
| C: cluster randomised; CBA: controlled before‐and‐after study | |||||||||
| aOne international unit (IU) vitamin A is equivalent to 0.0003 mg of retinol, 0.0006 mg of beta‐carotene and 0.0012 mg of other pro‐vitamin A carotenoids. | |||||||||
| Study | Haemoglobin threshold (g/L) | Criteria |
| Anaemia was defined as haemoglobin concentration in blood < 120 g/L | Not mentioned | |
| < 120 g/L in non‐pregnant and non‐lactating women | Not mentioned | |
| ≥ 110 g/L was used as a cut off for including children in the study. Anaemia was not defined | Not reported | |
| Haemoglobin levels were categorised as deficient < 100, low 100‐90 (g/L) | Not mentioned | |
| Severe anaemia: < 80 g/L; moderate anaemia: 80‐109 g/L; mild anaemia: 110‐119 g/L; non anaemia: ≥ 120 g/L | WHO (WHO 2011a) | |
| < 122 g/L, adjusted for average altitude of the study sites (1100 m) with the use of an equation | CDC (CDC 1989) | |
| < 110 g/L and severely anaemic (Hb < 75 g/L) were excluded | Not mentioned | |
| Not reported (iron‐deficiency anaemia was defined based on iron and ferritin levels in serum) | Not reported | |
| < 115 g/L in children aged 5–11 years | WHO (WHO 2001) | |
| < 110 g/L in children < 5 years of age | WHO (WHO 2001) | |
| For school‐aged children at 1500 m above sea level, mild anaemia was defined as Hb 115‐119 g/L, moderate anaemia Hb 85‐114 g/L, and severe anaemia Hb < 85 g/L | WHO (WHO 2011f) | |
| < 115 g/L for children aged 6‐11 years, < 120 g/L for children aged 12‐14 years and girls aged ≥ 15 years and < 130 g/L for boys aged ≥ 15 years | WHO (WHO 2001) | |
| < 120 g/L | Not mentioned | |
| Not reported | Not reported | |
| In children aged 5–11 years, anaemia (mild to moderate) was defined as Hb 70‐115 g/L. | WHO (WHO 2001) | |
| Not reported | Not reported | |
| < 115 g/L in children aged 6–11 years and < 120 g/L in participants aged ≥ 12 years | Not mentioned | |
| CDC: Centers for Disease Control and Prevention; Hb: haemoglobin; WHO: World Health Organization | ||
| Outcome (all studies included in the analysis) | Study (ICC) | RR (95% CI) | Tau² | Chi² | P value | I² |
| Anaemia (Angeles‐Agdeppa 2008; Hardinsyah 2016; Hotz 2008; Parker 2015 (C); Perignon 2016 (C); Radhika 2011; Thankachan 2012) | Parker 2015 (C) (0) | 0.83 (0.64 to 1.08) | 0.06 | 16.06 | 0.01 | 63% |
| Parker 2015 (C) (0.001) | 0.83 (0.64 to 1.08) | 0.06 | 15.72 | 0.02 | 62% | |
| Parker 2015 (C) (0.002) | 0.83 (0.64 to 1.08) | 0.06 | 15.71 | 0.02 | 62% | |
| Parker 2015 (C) (0.005) | 0.83 (0.64 to 1.07) | 0.06 | 15.12 | 0.02 | 60% | |
| Parker 2015 (C) (0.01) | 0.83 (0.64 to 1.08) | 0.06 | 14.80 | 0.02 | 59% | |
| Parker 2015 (C) (0.02723) | 0.83 (0.64 to 1.07) | 0.05 | 13.08 | 0.04 | 54% | |
| Parker 2015 (C) (0.1) | 0.81 (0.64 to 1.03) | 0.04 | 10.03 | 0.12 | 40% | |
| 0.83 (0.67 to 1.03) | 0.04 | 13.17 | 0.04 | 54% | ||
| Perignon 2016 (C) (0.001) | 0.83 (0.67 to 1.04) | 0.04 | 13.15 | 0.04 | 54% | |
| Perignon 2016 (C) (0.002) | 0.83 (0.66 to 1.04) | 0.04 | 13.16 | 0.04 | 54% | |
| Perignon 2016 (C) (0.005) | 0.83 (0.66 to 1.05) | 0.04 | 13.12 | 0.04 | 54% | |
| Perignon 2016 (C) (0.01) | 0.83 (0.65 to 1.05) | 0.05 | 13.12 | 0.04 | 54% | |
| Perignon 2016 (C) (0.02723) | 0.83 (0.64 to 1.07) | 0.05 | 13.08 | 0.04 | 54% | |
| Perignon 2016 (C)( 0.1) | 0.83 (0.63 to 1.09) | 0.06 | 13.08 | 0.04 | 54% | |
| Outcome (all studies included in the analysis) | Study (ICC) | MD (95% CI) | Tau² | Chi² | P value | I² |
| Haemoglobin concentration (Angeles‐Agdeppa 2008; Hardinsyah 2016; Hotz 2008; Hussain 2014; Losso 2017; Moretti 2006b; Parker 2015 (C); Perignon 2016 (C); Pinkaew 2013; Radhika 2011; Thankachan 2012) | Parker 2015 (C) (0) | 1.69 (0.48 to 2.91) | 1.82 | 24.15 | 0.007 | 59% |
| Parker 2015 (C) (0.001) | 1.70 (0.48 to 2.92) | 1.81 | 23.90 | 0.008 | 58% | |
| Parker 2015 (C) (0.002) | 1.71 (0.49 to 2.93) | 1.81 | 23.69 | 0.008 | 58% | |
| Parker 2015 (C) (0.005) | 1.73 (0.51 to 2.96) | 1.80 | 23.18 | 0.01 | 57% | |
| Parker 2015 (C) (0.01) | 1.77 (0.54 to 3.00) | 1.79 | 22.62 | 0.01 | 56% | |
| Parker 2015 (C)) (0.02723) | 1.85 (0.61 to 3.10) | 1.77 | 21.73 | 0.02 | 54% | |
| Parker 2015 (C)) (0.1) | 1.98 (0.71 to 3.25) | 1.76 | 20.96 | 0.02 | 52% | |
| Perignon 2016 (C)) (0) | 1.85 (0.61 to 3.09) | 1.77 | 21.98 | 0.02 | 55% | |
| Perignon 2016 (C)) (0.001) | 1.85 (0.61 to 3.09) | 1.77 | 21.97 | 0.02 | 54% | |
| Perignon 2016 (C)) (0.002) | 1.85 (0.61 to 3.09) | 1.77 | 21.96 | 0.02 | 54% | |
| Perignon 2016 (C)) (0.005) | 1.85 (0.61 to 3.10) | 1.77 | 21.93 | 0.02 | 54% | |
| Perignon 2016 (C)) (0.01) | 1.85 (0.61 to 3.10) | 1.77 | 21.89 | 0.02 | 54% | |
| Perignon 2016 (C)) (0.02723) | 1.85 (0.61 to 3.10) | 1.77 | 21.73 | 0.02 | 54% | |
| Perignon 2016 (C)) (0.1) | 1.86 (0.61 to 3.11) | 1.78 | 21.15 | 0.02 | 53% | |
| C: cluster‐randomised trial; CI: confidence interval; ICC: intra‐cluster correlation coefficient; MD: mean difference; RR: risk ratio | ||||||
| Outcome or subgroup title | No. of studies | No. of participants | Statistical method | Effect size |
| 1 Anaemia (defined as haemoglobin (Hb) below the WHO cut‐off, adjusted for altitude as appropriate) Show forest plot | 7 | 1634 | Risk Ratio (M‐H, Random, 95% CI) | 0.72 [0.54, 0.97] |
| 2 Anaemia (subgroup: by micronutrient content) Show forest plot | 7 | 1634 | Risk Ratio (M‐H, Random, 95% CI) | 0.83 [0.66, 1.04] |
| 2.1 Iron alone | 3 | 444 | Risk Ratio (M‐H, Random, 95% CI) | 0.63 [0.36, 1.09] |
| 2.2 Iron + other micronutrients | 4 | 1190 | Risk Ratio (M‐H, Random, 95% CI) | 0.95 [0.82, 1.11] |
| 3 Anaemia (subgroup: by rice fortification method) Show forest plot | 7 | 1634 | Risk Ratio (M‐H, Random, 95% CI) | 0.73 [0.55, 0.97] |
| 3.1 Hot extrusion | 5 | 1197 | Risk Ratio (M‐H, Random, 95% CI) | 0.72 [0.52, 1.01] |
| 3.2 Cold extrusion | 3 | 437 | Risk Ratio (M‐H, Random, 95% CI) | 0.75 [0.41, 1.38] |
| 3.3 Coating | 0 | 0 | Risk Ratio (M‐H, Random, 95% CI) | 0.0 [0.0, 0.0] |
| 3.4 Dusting | 0 | 0 | Risk Ratio (M‐H, Random, 95% CI) | 0.0 [0.0, 0.0] |
| 3.5 Mixed/unknown/unreported | 0 | 0 | Risk Ratio (M‐H, Random, 95% CI) | 0.0 [0.0, 0.0] |
| 4 Anaemia (subgroup: by cooking method most commonly used in trial setting) Show forest plot | 7 | 1634 | Risk Ratio (M‐H, Random, 95% CI) | 0.72 [0.54, 0.97] |
| 4.1 Soaking, and boiling with excess water | 0 | 0 | Risk Ratio (M‐H, Random, 95% CI) | 0.0 [0.0, 0.0] |
| 4.2 Boiling without excess water | 0 | 0 | Risk Ratio (M‐H, Random, 95% CI) | 0.0 [0.0, 0.0] |
| 4.3 Rinsing and boiling without excess water | 1 | 215 | Risk Ratio (M‐H, Random, 95% CI) | 0.40 [0.26, 0.63] |
| 4.4 Frying and boiling without excess water | 0 | 0 | Risk Ratio (M‐H, Random, 95% CI) | 0.0 [0.0, 0.0] |
| 4.5 Unknown/unreported | 6 | 1419 | Risk Ratio (M‐H, Random, 95% CI) | 0.81 [0.63, 1.05] |
| 5 Anaemia (subgroup: by public health significance of anaemia at baseline ) Show forest plot | 7 | 1634 | Risk Ratio (M‐H, Random, 95% CI) | 0.72 [0.54, 0.97] |
| 5.1 Not a problem (lower than 5%) | 0 | 0 | Risk Ratio (M‐H, Random, 95% CI) | 0.0 [0.0, 0.0] |
| 5.2 Mild and moderate (5% to 39.9%) | 4 | 1129 | Risk Ratio (M‐H, Random, 95% CI) | 0.69 [0.44, 1.06] |
| 5.3 Severe (40% and more) | 2 | 360 | Risk Ratio (M‐H, Random, 95% CI) | 0.87 [0.67, 1.12] |
| 5.4 Mixed/unknown/unreported | 1 | 145 | Risk Ratio (M‐H, Random, 95% CI) | 0.31 [0.09, 1.10] |
| 6 Anaemia (subgroup: by malaria endemicity) Show forest plot | 7 | 1634 | Risk Ratio (M‐H, Random, 95% CI) | 0.72 [0.54, 0.97] |
| 6.1 Some malaria risk setting | 1 | 445 | Risk Ratio (M‐H, Random, 95% CI) | 0.85 [0.55, 1.32] |
| 6.2 Malaria‐free area | 2 | 403 | Risk Ratio (M‐H, Random, 95% CI) | 0.70 [0.48, 1.03] |
| 6.3 Unknown/unreported | 4 | 786 | Risk Ratio (M‐H, Random, 95% CI) | 0.67 [0.34, 1.31] |
| 7 Iron deficiency (as defined by study authors, based on a biomarker of iron status) Show forest plot | 8 | 1733 | Risk Ratio (M‐H, Random, 95% CI) | 0.66 [0.51, 0.84] |
| 8 Iron deficiency (subgroup: by micronutrient content) Show forest plot | 8 | 1733 | Risk Ratio (M‐H, Random, 95% CI) | 0.66 [0.51, 0.84] |
| 8.1 Iron alone | 4 | 628 | Risk Ratio (M‐H, Random, 95% CI) | 0.56 [0.40, 0.80] |
| 8.2 Iron + other micronutrients | 4 | 1105 | Risk Ratio (M‐H, Random, 95% CI) | 0.78 [0.57, 1.06] |
| 9 Iron deficiency (subgroup: by rice fortification method) Show forest plot | 8 | 1733 | Risk Ratio (M‐H, Random, 95% CI) | 0.66 [0.52, 0.83] |
| 9.1 Hot extrusion | 6 | 1283 | Risk Ratio (M‐H, Random, 95% CI) | 0.66 [0.51, 0.87] |
| 9.2 Cold extrusion | 3 | 450 | Risk Ratio (M‐H, Random, 95% CI) | 0.65 [0.38, 1.09] |
| 9.3 Coating | 0 | 0 | Risk Ratio (M‐H, Random, 95% CI) | 0.0 [0.0, 0.0] |
| 9.4 Dusting | 0 | 0 | Risk Ratio (M‐H, Random, 95% CI) | 0.0 [0.0, 0.0] |
| 9.5 Mixed/unknown/unreported | 0 | 0 | Risk Ratio (M‐H, Random, 95% CI) | 0.0 [0.0, 0.0] |
| 10 Iron deficiency (subgroup: by cooking method most commonly used in trial setting) Show forest plot | 8 | 1733 | Risk Ratio (M‐H, Random, 95% CI) | 0.66 [0.51, 0.84] |
| 10.1 Soaking, and boiling with excess water | 0 | 0 | Risk Ratio (M‐H, Random, 95% CI) | 0.0 [0.0, 0.0] |
| 10.2 Boiling without excess water | 0 | 0 | Risk Ratio (M‐H, Random, 95% CI) | 0.0 [0.0, 0.0] |
| 10.3 Rinsing and boiling without excess water | 1 | 215 | Risk Ratio (M‐H, Random, 95% CI) | 0.79 [0.51, 1.21] |
| 10.4 Frying and boiling without excess water | 0 | 0 | Risk Ratio (M‐H, Random, 95% CI) | 0.0 [0.0, 0.0] |
| 10.5 Unknown/unreported | 7 | 1518 | Risk Ratio (M‐H, Random, 95% CI) | 0.63 [0.46, 0.84] |
| 11 Iron deficiency (subgroup: by public health significance of anaemia at baseline ) Show forest plot | 8 | 1733 | Risk Ratio (M‐H, Random, 95% CI) | 0.66 [0.51, 0.84] |
| 11.1 Not a problem (lower than 5%) | 0 | 0 | Risk Ratio (M‐H, Random, 95% CI) | 0.0 [0.0, 0.0] |
| 11.2 Mild and moderate (5% to 39.9%) | 4 | 1046 | Risk Ratio (M‐H, Random, 95% CI) | 0.77 [0.55, 1.07] |
| 11.3 Severe (40% and more) | 2 | 358 | Risk Ratio (M‐H, Random, 95% CI) | 0.57 [0.26, 1.27] |
| 11.4 Mixed/unknown/unreported | 2 | 329 | Risk Ratio (M‐H, Random, 95% CI) | 0.63 [0.39, 1.01] |
| 12 Iron deficiency (subgroup: by malaria endemicity) Show forest plot | 8 | 1733 | Risk Ratio (M‐H, Random, 95% CI) | 0.66 [0.51, 0.84] |
| 12.1 Some malaria risk setting | 1 | 485 | Risk Ratio (M‐H, Random, 95% CI) | 0.86 [0.48, 1.53] |
| 12.2 Malaria‐free area | 3 | 585 | Risk Ratio (M‐H, Random, 95% CI) | 0.58 [0.41, 0.84] |
| 12.3 Mixed/unknown/unreported | 4 | 663 | Risk Ratio (M‐H, Random, 95% CI) | 0.61 [0.39, 0.96] |
| 13 Haemoglobin concentration (g/L) Show forest plot | 11 | 2163 | Mean Difference (IV, Random, 95% CI) | 1.83 [0.66, 3.00] |
| 14 Haemoglobin concentration (subgroup: by micronutrient content) Show forest plot | 11 | 2163 | Mean Difference (IV, Random, 95% CI) | 2.09 [0.75, 3.44] |
| 14.1 Iron alone | 6 | 698 | Mean Difference (IV, Random, 95% CI) | 3.93 [1.24, 6.62] |
| 14.2 Iron + other micronutrients | 6 | 1465 | Mean Difference (IV, Random, 95% CI) | 1.06 [0.15, 1.98] |
| 15 Haemoglobin concentration (subgroup: by rice fortification method) Show forest plot | 11 | 2163 | Mean Difference (IV, Random, 95% CI) | 1.60 [0.81, 2.38] |
| 15.1 Hot extrusion | 7 | 1563 | Mean Difference (IV, Random, 95% CI) | 1.93 [0.53, 3.32] |
| 15.2 Cold extrusion | 3 | 437 | Mean Difference (IV, Random, 95% CI) | 1.54 [0.58, 2.51] |
| 15.3 Coating | 1 | 15 | Mean Difference (IV, Random, 95% CI) | 8.20 [‐12.14, 28.54] |
| 15.4 Dusting | 0 | 0 | Mean Difference (IV, Random, 95% CI) | 0.0 [0.0, 0.0] |
| 15.5 Mixed/unknown/unreported | 1 | 148 | Mean Difference (IV, Random, 95% CI) | ‐4.0 [‐11.72, 3.72] |
| 16 Haemoglobin concentration (subgroup: by cooking method most commonly used in trial setting) Show forest plot | 11 | 2163 | Mean Difference (IV, Random, 95% CI) | 1.83 [0.66, 3.00] |
| 16.1 Soaking, and boiling with excess water | 0 | 0 | Mean Difference (IV, Random, 95% CI) | 0.0 [0.0, 0.0] |
| 16.2 Boiling without excess water | 0 | 0 | Mean Difference (IV, Random, 95% CI) | 0.0 [0.0, 0.0] |
| 16.3 Rinsing and boiling without excess water | 1 | 215 | Mean Difference (IV, Random, 95% CI) | 3.80 [0.86, 6.74] |
| 16.4 Unknown/unreported | 10 | 1948 | Mean Difference (IV, Random, 95% CI) | 1.62 [0.43, 2.81] |
| 17 Haemoglobin concentration (subgroup: by public health significance of anaemia at baseline) Show forest plot | 11 | 2163 | Mean Difference (IV, Random, 95% CI) | 1.83 [0.66, 3.00] |
| 17.1 Not a problem (lower than 5%) | 0 | 0 | Mean Difference (IV, Random, 95% CI) | 0.0 [0.0, 0.0] |
| 17.2 Mild and moderate (5% to 39.9%) | 6 | 1459 | Mean Difference (IV, Random, 95% CI) | 1.67 [‐0.10, 3.44] |
| 17.3 Severe (40% and more) | 2 | 360 | Mean Difference (IV, Random, 95% CI) | 1.07 [‐0.84, 2.98] |
| 17.4 Mixed/unknown/unreported | 3 | 344 | Mean Difference (IV, Random, 95% CI) | 3.42 [1.10, 5.73] |
| 18 Haemoglobin concentration (subgroup: by malaria endemicity) Show forest plot | 11 | 2163 | Mean Difference (IV, Random, 95% CI) | 1.83 [0.66, 3.00] |
| 18.1 Some malaria risk setting | 1 | 445 | Mean Difference (IV, Random, 95% CI) | 0.90 [0.65, 1.15] |
| 18.2 Malaria‐free area | 3 | 587 | Mean Difference (IV, Random, 95% CI) | 3.15 [0.98, 5.31] |
| 18.3 Mixed/unknown/unreported | 7 | 1131 | Mean Difference (IV, Random, 95% CI) | 1.33 [‐0.48, 3.14] |
| 19 Vitamin A deficiency (as defined by study authors, by using a biomarker of vitamin A) Show forest plot | 4 | 927 | Risk Ratio (M‐H, Random, 95% CI) | 0.68 [0.36, 1.29] |
| 20 Vitamin A deficiency (subgroup: by micronutrient content) Show forest plot | 4 | 927 | Risk Ratio (M‐H, Random, 95% CI) | 0.68 [0.36, 1.29] |
| 20.1 Iron alone | 0 | 0 | Risk Ratio (M‐H, Random, 95% CI) | 0.0 [0.0, 0.0] |
| 20.2 Iron + other micronutrients | 4 | 927 | Risk Ratio (M‐H, Random, 95% CI) | 0.68 [0.36, 1.29] |
| 21 Vitamin A deficiency (subgroup: by rice fortification method) Show forest plot | 4 | 927 | Risk Ratio (M‐H, Random, 95% CI) | 0.68 [0.41, 1.14] |
| 21.1 Hot extrusion | 4 | 765 | Risk Ratio (M‐H, Random, 95% CI) | 0.70 [0.35, 1.39] |
| 21.2 Cold extrusion | 1 | 162 | Risk Ratio (M‐H, Random, 95% CI) | 0.61 [0.24, 1.54] |
| 21.3 Coating | 0 | 0 | Risk Ratio (M‐H, Random, 95% CI) | 0.0 [0.0, 0.0] |
| 21.4 Dusting | 0 | 0 | Risk Ratio (M‐H, Random, 95% CI) | 0.0 [0.0, 0.0] |
| 21.5 Mixed/unknown/unreported | 0 | 0 | Risk Ratio (M‐H, Random, 95% CI) | 0.0 [0.0, 0.0] |
| 22 Vitamin A deficiency (subgroup: by cooking method most commonly used in trial setting) Show forest plot | 4 | 927 | Risk Ratio (M‐H, Random, 95% CI) | 0.68 [0.36, 1.29] |
| 22.1 Soaking, and boiling with excess water | 0 | 0 | Risk Ratio (M‐H, Random, 95% CI) | 0.0 [0.0, 0.0] |
| 22.2 Boiling without excess water | 0 | 0 | Risk Ratio (M‐H, Random, 95% CI) | 0.0 [0.0, 0.0] |
| 22.3 Rinsing and boiling without excess water | 1 | 215 | Risk Ratio (M‐H, Random, 95% CI) | 1.10 [0.47, 2.60] |
| 22.4 Frying and boiling without excess water | 0 | 0 | Risk Ratio (M‐H, Random, 95% CI) | 0.0 [0.0, 0.0] |
| 22.5 Unknown/unreported | 3 | 712 | Risk Ratio (M‐H, Random, 95% CI) | 0.55 [0.25, 1.22] |
| 23 Vitamin A deficiency (subgroup: by public health significance of anaemia at baseline ) Show forest plot | 4 | 927 | Risk Ratio (M‐H, Random, 95% CI) | 0.68 [0.36, 1.29] |
| 23.1 Not a problem (lower than 5%) | 0 | 0 | Risk Ratio (M‐H, Random, 95% CI) | 0.0 [0.0, 0.0] |
| 23.2 Mild and moderate (5% to 39.9%) | 3 | 695 | Risk Ratio (M‐H, Random, 95% CI) | 0.60 [0.29, 1.24] |
| 23.3 Severe (40% and more) | 1 | 232 | Risk Ratio (M‐H, Random, 95% CI) | 1.46 [0.30, 7.07] |
| 23.4 Mixed/unknown/unreported | 0 | 0 | Risk Ratio (M‐H, Random, 95% CI) | 0.0 [0.0, 0.0] |
| 24 Vitamin A deficiency (subgroup: by malaria endemicity) Show forest plot | 4 | 927 | Risk Ratio (M‐H, Random, 95% CI) | 0.68 [0.36, 1.29] |
| 24.1 Some malaria risk setting | 1 | 442 | Risk Ratio (M‐H, Random, 95% CI) | 0.57 [0.30, 1.08] |
| 24.2 Malaria‐free area | 1 | 232 | Risk Ratio (M‐H, Random, 95% CI) | 1.46 [0.30, 7.07] |
| 24.3 Unknown/unreported | 2 | 253 | Risk Ratio (M‐H, Random, 95% CI) | 0.55 [0.12, 2.59] |
| 25 Serum or plasma folate (nmol/L) Show forest plot | 1 | Mean Difference (IV, Random, 95% CI) | Totals not selected | |
| 26 Any adverse effects Show forest plot | 2 | 1019 | Risk Ratio (M‐H, Random, 95% CI) | 1.21 [0.53, 2.76] |
| 26.1 Hookworm infection risk | 1 | 785 | Risk Ratio (M‐H, Random, 95% CI) | 1.78 [1.18, 2.70] |
| 26.2 Abdominal pain more than 3 days | 1 | 234 | Risk Ratio (M‐H, Random, 95% CI) | 0.77 [0.42, 1.42] |
| 27 Diarrhoea (as defined by study authors) Show forest plot | 1 | Risk Ratio (M‐H, Random, 95% CI) | Totals not selected | |
| 28 Serum or plasma retinol (µmol/L) Show forest plot | 5 | 727 | Mean Difference (IV, Random, 95% CI) | 0.04 [‐0.13, 0.21] |
| 29 Serum or plasma zinc (µmol/L) Show forest plot | 3 | 618 | Mean Difference (IV, Random, 95% CI) | 0.38 [‐0.08, 0.83] |
| 30 Height‐for‐age Z‐score Show forest plot | 1 | Mean Difference (IV, Random, 95% CI) | Totals not selected | |
| 31 Weight‐for‐height Z‐score Show forest plot | 1 | Mean Difference (IV, Random, 95% CI) | Totals not selected | |
| Outcome or subgroup title | No. of studies | No. of participants | Statistical method | Effect size |
| 1 Haemoglobin concentration (g/L) Show forest plot | 1 | Mean Difference (IV, Random, 95% CI) | Totals not selected | |
| 2 Serum or plasma retinol (µmol/L) Show forest plot | 1 | Mean Difference (IV, Random, 95% CI) | Totals not selected | |