Intervenciones para la prevención del acoso laboral
Información
- DOI:
- https://doi.org/10.1002/14651858.CD009778.pub2Copiar DOI

- Base de datos:
-
- Cochrane Database of Systematic Reviews
- Versión publicada:
-
- 30 enero 2017see what's new
- Tipo:
-
- Intervention
- Etapa:
-
- Review
- Grupo Editorial Cochrane:
-
Grupo Cochrane de Salud laboral
- Copyright:
-
- Copyright © 2017 The Cochrane Collaboration. Published by John Wiley & Sons, Ltd.
Cifras del artículo
Altmetric:
Citado por:
Autores
Contributions of authors
Patricia Gillen led the writing of the protocol and the review with contributions from Marlene Sinclair, George Kernohan, Cecily Begley, and Ans Luyben. All authors screened references for studies to include, and extracted data. George Kernohan led on the analysis and all authors contributed to the final drafting of the review.
Sources of support
Internal sources
-
Institute of Nursing and Health Research, Ulster University, UK.
Awarded Patricia Gillen a Research Fellowship to undertake this review.
-
Bern University of Applied Sciences, Switzerland.
Supported Ans Luyben in the preliminary stages of this review.
External sources
-
No sources of support supplied
Declarations of interest
Patricia Gillen: I was awarded the Royal College of Midwifery Ruth Davies Research Bursary in 2004 for PhD study into the nature and manifestations of bullying in midwifery. However, the RCM did not influence the study or findings reported. The definition used at the beginning of my PhD study was one used by the RCM in their research in 1996.
Marlene Sinclair: None known.
George Kernohan: None known.
Cecily Begley: None known.
Ans Luyben: None known.
Acknowledgements
We would like to acknowledge the following people who have contributed at different stages to the development of this review, and also for their constructive criticism and feedback:
From the Cochrane Work Group:
Mr Jani Ruotsalainen, Managing Editor;
Dr Jos Verbeek, Co‐ordinating Editor;
Dr Consol Serra, Editor;
Mr Wim van Veelen, Reviewer;
Ms Leena Isotalo, Information Specialist;
Mrs Kaisa Neuvonen, Information Specialist;
Dr Anneli Ojajärvi, Statistician;
Vicky Pennick, Copy Editor.
We would also like to thank:
Jenny Bellorini from the Ear, Nose and Throat Disorders Group for copy editing the protocol text;
Dr Deirdre FitzGerald, Occupational Physician, Cork, for her help and support with the updated search strategies;
Dr Paul Slater for statistical advice.
Version history
| Published | Title | Stage | Authors | Version |
| 2017 Jan 30 | Interventions for prevention of bullying in the workplace | Review | Patricia A Gillen, Marlene Sinclair, W George Kernohan, Cecily M Begley, Ans G Luyben | |
| 2012 Apr 18 | Interventions for prevention of bullying in the workplace | Protocol | Patricia A Gillen, Marlene Sinclair, W George Kernohan, Cecily M Begley, Ans G Luyben | |
Differences between protocol and review
1. British Nursing Index (BNI) has now been amalgamated into CINAHL (which is now known as CINAHL Plus), so we did not search BNI separately.
2. ABI Global replaced the Emerald database search.
3. An initial search of the databases 'Index to Theses' and 'Health Management Information Consortium' (HMIC) did not retrieve any studies to include so we excluded these from further searches.
4. In Types of interventions, we broadened the inclusion criterion from "enhancements to reporting mechanisms that make it easier for individuals to report bullying".to "enhancements to reporting mechanisms that make it easier for individuals to report problematic behaviour" , in order to include all such prevention interventions.
5. We expanded the primary outcomes to include self‐report measurement. In the protocol we had assumed that we would have data from employers, but this was not always available.
Keywords
MeSH
Medical Subject Headings (MeSH) Keywords
Medical Subject Headings Check Words
Humans;
PICO
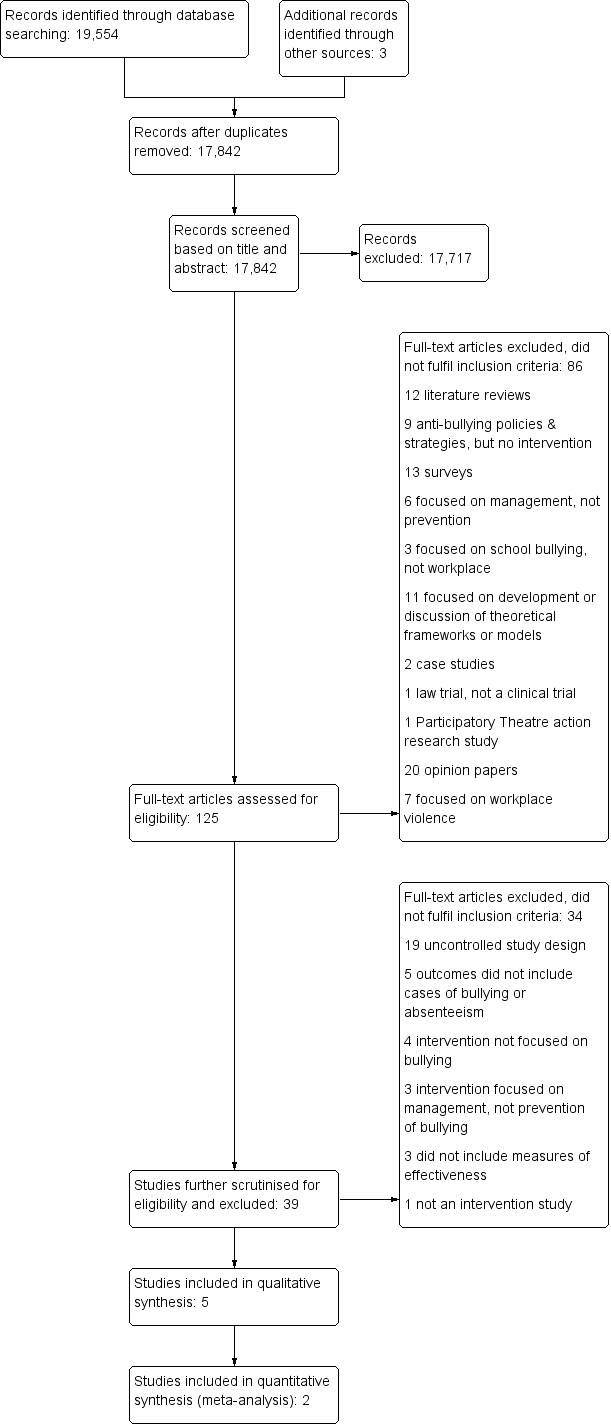
PRISMA Study flow diagram.

Risk of bias graph: review authors' judgements about each risk of bias item presented as percentages across all included studies using the Downs 1998 checklist.

Risk of bias summary: review authors' judgements about each risk of bias item for included studies.

Comparison 1 CREW intervention vs no intervention, Outcome 1 Self‐reported civility.
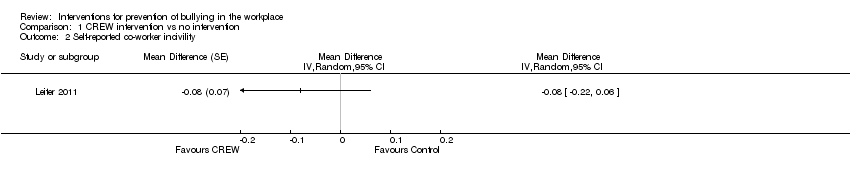
Comparison 1 CREW intervention vs no intervention, Outcome 2 Self‐reported co‐worker incivility.

Comparison 1 CREW intervention vs no intervention, Outcome 3 Self‐reported supervisor incivility.

Comparison 1 CREW intervention vs no intervention, Outcome 4 Self‐reported frequency of incivility perpetration.

Comparison 1 CREW intervention vs no intervention, Outcome 5 Self‐reported absenteeism in previous month.

Comparison 2 Expressive writing vs. control writing, Outcome 1 Incivility victimisation (25th percentile pre‐test).
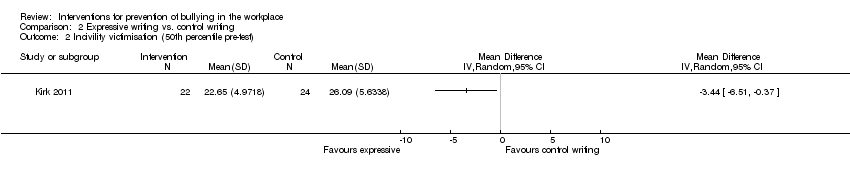
Comparison 2 Expressive writing vs. control writing, Outcome 2 Incivility victimisation (50th percentile pre‐test).

Comparison 2 Expressive writing vs. control writing, Outcome 3 Incivility victimisation (75th percentile pre‐test).

Comparison 2 Expressive writing vs. control writing, Outcome 4 Incivility victimisation (pooled).

Comparison 2 Expressive writing vs. control writing, Outcome 5 Incivility perpetration.
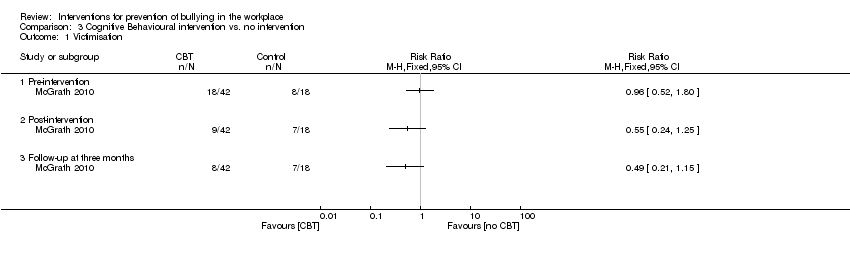
Comparison 3 Cognitive Behavioural intervention vs. no intervention, Outcome 1 Victimisation.
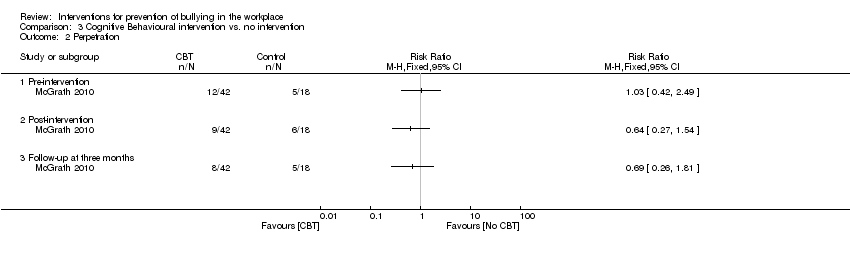
Comparison 3 Cognitive Behavioural intervention vs. no intervention, Outcome 2 Perpetration.
| Controlled before and after study | |||||
| Patient or population: Employees | |||||
| Outcomes | Absolute effects* | № of participants | Quality of the evidence | Comments | |
| Risk with no intervention | Risk with CREW (95% CI) | ||||
| Self‐reported workplace civility, on a scale of 1 to 5; higher score more civility | Mean civility score was 3.58 points | Mean civility score was 0.17 higher (0.07 higher to 0.28 higher) | 2969 | ⊕⊝⊝⊝1 | |
| Self‐reported co‐worker incivility, on a scale of 0 to 6; higher score more frequent incivility Follow‐up: 6 months | Mean coworker incivility score was 0.76 points | Mean co‐worker incivility score was 0.08 lower (0.22 lower to 0.06 higher) | 907 | ⊕⊝⊝⊝1 | |
| Self‐reported supervisor incivility, on a scale of 0 to 6; higher score more frequent incivility Follow‐up: 6 months | Mean supervisor incivility score was 0.57 points | Mean supervisor incivility score was 0.17 lower (0.33 lower to 0.01 lower) | 907 | ⊕⊝⊝⊝1 | |
| Self‐reported frequency of incivility instigation, on a scale of 0 (never) ‐ 6 (daily) **; higher score more frequent incivility Follow‐up: 6 months | Mean incivility instigation score was 0.50 | Mean incivility instigation score was 0.05 lower (0.15 lower to 0.05 higher) | 907 | ⊕⊝⊝⊝1 | |
| Self‐reported days of absenteeism in previous month. Follow‐up: 6 months | Mean absenteeism in previous month was 0.83 days | Mean absenteeism in previous month was 0.63 days lower (0.92 lower to 0.34 lower) | 907 | ⊕⊝⊝⊝1 | |
| *The risk in the intervention group (and its 95% confidence interval) is based on the assumed risk in the comparison group and the relative effect of the intervention (and its 95% CI) | |||||
| GRADE Working Group grades of evidence | |||||
| 1 We would have downgraded the quality of evidence twice due to high risk of bias caused by study limitations (lack of randomisation and blinding, and use of self‐reporting instrument) and once due to imprecision (limited sample available for outcome measurement, limited matching pre‐ and post intervention). However, once was enough to reach very low quality evidence as we started at low quality evidence because the included studies used a controlled before‐after design. We found no reason to upgrade the quality of the evidence. | |||||
| Five‐arm cluster randomised trial | |||
| Patient or population: employees | |||
| Outcomes | Effect of the intervention | № of participants | Quality of the evidence |
| Bullying | Insufficient data reported for analysis | 1041 (1 study) | ⊕⊝⊝⊝ |
| Absenteeism | Insufficient data reported for analysis | 1041 (1 study) | ⊕⊝⊝⊝ |
| *The risk in the intervention group (and its 95% confidence interval) is based on the assumed risk in the comparison group and the relative effect of the intervention (and its 95% CI). | |||
| GRADE Working Group grades of evidence | |||
| 1 We would have downgraded the quality of evidence once due to high risk of bias caused by study limitations (lack of blinding and use of self‐reporting instrument) and twice due to imprecision (study conducted in mixed settings and with unclear number of participants). However, once was enough to reach very low quality evidence as we started at low quality evidence because the included studies used a controlled before‐after design. We found no reason to upgrade the quality of the evidence. | |||
| Controlled before and after study | |||||
| Patient or population: employees | |||||
| Outcomes | Absolute effects* (95% CI) | № of participants | Quality of the evidence | Comments | |
| Risk with Control writing | Risk with Expressive‐Writing | ||||
| Self‐reported frequency of incivility victimisation. | Mean number of incivility victimisations was 26 | Mean incivility victimisation in the intervention group was 3.3 fewer occurrences (5.4 fewer to 1.2 fewer) | 46 | ⊕⊝⊝⊝1 | |
| Self‐reported frequency of incivility perpetration. | Mean number of incivility perpetrations was 23 | Mean incivility perpetration in the intervention group was 3.5 fewer occurrences (6.2 fewer to 0.8 fewer) | 46 | ⊕⊝⊝⊝1 | |
| *The risk in the intervention group (and its 95% confidence interval) is based on the assumed risk in the comparison group and the relative effect of the intervention (and its 95% CI). | |||||
| GRADE Working Group grades of evidence | |||||
| 1. We would have downgraded the quality of evidence twice due to high risk of bias caused by study limitations (lack of randomisation and blinding, and use of self‐reporting instrument) and once due to imprecision (small sample size). However once was enough to reach very low quality evidence as we started at low quality evidence because the included studies used a controlled before‐after design. We found no reason to upgrade the quality of the evidence. | |||||
| Controlled before and after study | ||||||
| Patient or population: Adult workers with a learning disability | ||||||
| Outcomes | Absolute effects* (95% CI) | Relative effect | No of participants | Quality of the evidence | Comments | |
| Risk with no intervention (Waiting‐list control) | Risk with cognitive behavioural intervention | |||||
| Self‐reported victimisation. | 39 per 100 (18 to 64) | 21 per 100 (11 to 37) | RR 0.55 (0.24 to 1.25) | 60 | ⊕⊝⊝⊝1 | |
| Self‐reported victimisation. | 39 per 100 (18 to 64) | 19 per 100 (9.1 to 35) | RR 0.49 (0.21 to 1.15) | 60 | ⊕⊝⊝⊝1 | |
| Self‐reported perpetration. Post intervention. | 33 per 100 (14 to 59) | 21 per 100 (11 to 37) | RR 0.64 (0.27 to 1.54) | 60 | ⊕⊝⊝⊝1 | |
| Self‐reported perpetration. Three‐month follow‐up. | 28 per 100 (11 to 54) | 17 per 100 (7.5 to 32) | RR 0.69 (0.26 to 1.81) | 60 | ⊕⊝⊝⊝1 | |
| *The risk in the intervention group (and its 95% confidence interval) is based on the assumed risk in the comparison group and the relative effect of the intervention (and its 95% CI). | ||||||
| GRADE Working Group Grades of Evidence | ||||||
| 1. We would have downgraded the quality of evidence twice due to high risk of bias caused by study limitations (lack of randomisation and blinding, and use of self‐reporting instrument) and once due to imprecision (small sample size). However, once was enough to reach very low quality evidence as we started at low quality evidence because the included studies used a controlled before‐after design. We found no reason to upgrade the quality of the evidence. | ||||||
| Outcome or subgroup title | No. of studies | No. of participants | Statistical method | Effect size |
| 1 Self‐reported civility Show forest plot | 2 | Mean Difference (Random, 95% CI) | 0.17 [0.07, 0.28] | |
| 2 Self‐reported co‐worker incivility Show forest plot | 1 | Mean Difference (Random, 95% CI) | Totals not selected | |
| 3 Self‐reported supervisor incivility Show forest plot | 1 | Mean Difference (Random, 95% CI) | Totals not selected | |
| 4 Self‐reported frequency of incivility perpetration Show forest plot | 1 | Mean Difference (Random, 95% CI) | Totals not selected | |
| 5 Self‐reported absenteeism in previous month Show forest plot | 1 | Mean Difference (Random, 95% CI) | Totals not selected | |
| Outcome or subgroup title | No. of studies | No. of participants | Statistical method | Effect size |
| 1 Incivility victimisation (25th percentile pre‐test) Show forest plot | 1 | Mean Difference (IV, Fixed, 95% CI) | Totals not selected | |
| 2 Incivility victimisation (50th percentile pre‐test) Show forest plot | 1 | Mean Difference (IV, Random, 95% CI) | Totals not selected | |
| 3 Incivility victimisation (75th percentile pre‐test) Show forest plot | 1 | Mean Difference (IV, Random, 95% CI) | Totals not selected | |
| 4 Incivility victimisation (pooled) Show forest plot | 1 | Mean Difference (IV, Random, 95% CI) | Totals not selected | |
| 5 Incivility perpetration Show forest plot | 1 | Mean Difference (IV, Random, 95% CI) | Totals not selected | |
| Outcome or subgroup title | No. of studies | No. of participants | Statistical method | Effect size |
| 1 Victimisation Show forest plot | 1 | Risk Ratio (M‐H, Fixed, 95% CI) | Totals not selected | |
| 1.1 Pre‐intervention | 1 | Risk Ratio (M‐H, Fixed, 95% CI) | 0.0 [0.0, 0.0] | |
| 1.2 Post‐intervention | 1 | Risk Ratio (M‐H, Fixed, 95% CI) | 0.0 [0.0, 0.0] | |
| 1.3 Follow‐up at three months | 1 | Risk Ratio (M‐H, Fixed, 95% CI) | 0.0 [0.0, 0.0] | |
| 2 Perpetration Show forest plot | 1 | Risk Ratio (M‐H, Fixed, 95% CI) | Totals not selected | |
| 2.1 Pre‐intervention | 1 | Risk Ratio (M‐H, Fixed, 95% CI) | 0.0 [0.0, 0.0] | |
| 2.2 Post‐intervention | 1 | Risk Ratio (M‐H, Fixed, 95% CI) | 0.0 [0.0, 0.0] | |
| 2.3 Follow‐up at three months | 1 | Risk Ratio (M‐H, Fixed, 95% CI) | 0.0 [0.0, 0.0] | |