Leucorreducción para la prevención de las reacciones adversas de la transfusión de sangre alogénica
Información
- DOI:
- https://doi.org/10.1002/14651858.CD009745.pub2Copiar DOI

- Base de datos:
-
- Cochrane Database of Systematic Reviews
- Versión publicada:
-
- 03 diciembre 2015see what's new
- Tipo:
-
- Intervention
- Etapa:
-
- Review
- Grupo Editorial Cochrane:
-
Grupo Cochrane de Lesiones
- Copyright:
-
- Copyright © 2015 The Cochrane Collaboration. Published by John Wiley & Sons, Ltd.
Cifras del artículo
Altmetric:
Citado por:
Autores
Contributions of authors
All review authors contributed to the conception and design of this Cochrane review. Doctors Simancas‐Racines, Arevalo‐Rodriguez and Osorio contributed to the analysis and interpretation of data, and drafted the manuscript. All review authors contributed by commenting on the review critically for intellectual content and gave final approval of the document to be published.
Sources of support
Internal sources
-
Universidad Tecnológica Equinoccial, Ecuador.
Academic
-
Fundación Universitaria de Ciencias de la Salud, Bogotá D.C., Colombia.
External sources
-
Iberoamerican Cochrane Center, Spain.
Academic
Declarations of interest
IA‐R: None known.
AM‐C: None known.
DO: None known.
DS‐R: None known.
Acknowledgements
Daniel Simancas‐Racines is a Ph.D. candidate at the Department of Pediatrics, Gynecology and Obstetrics, and Preventive Medicine, Universitat Autònoma de Barcelona, Spain.
We thank Ms. Marta Roqué i Figuls, Iberoamerican Cochrane Centre, for her advice on statistical analysis; Dr. Christian Gluud, Centre for Clinical Intervention Research, Denmark, for his advice on interpreting the trial sequential analyses; and Ms. Maria Victoria Leo Rosas for revising and improving the grammar and style of the review.
This project was supported by the UK National Institute for Health Research, through Cochrane Infrastructure funding to the Cochrane Injuries Group. The views and opinions expressed are those of the authors and do not necessarily reflect those of the Systematic Reviews Programme, NIHR, NHS or the Department of Health.
Version history
| Published | Title | Stage | Authors | Version |
| 2015 Dec 03 | Leukoreduction for the prevention of adverse reactions from allogeneic blood transfusion | Review | Daniel Simancas‐Racines, Dimelza Osorio, Arturo J Martí‐Carvajal, Ingrid Arevalo‐Rodriguez | |
| 2012 Mar 14 | Leukoreduction for the prevention of adverse reactions from allogeneic blood transfusion | Protocol | Daniel Simancas‐Racines, Arturo J Martí‐Carvajal, Ricardo Hidalgo, Shrikant Bangdiwala | |
Differences between protocol and review
In order to improve the quality of this Cochrane review, we made the following changes from the original protocol (Simancas‐Racines 2012):
-
Data synthesis included a second meta‐analysis: 'only transfused patients' as a sensitivity analysis. We performed this analysis due to the important number of patients not transfused as reported in most of the included studies. This analysis complements the main analysis planned in the review protocol: events reported among the total number of randomised patients.
-
We carried out a sensitivity analysis "excluding post‐storage leukoreduction studies" to explore the effect of this variable on the effect estimate.
-
We conducted a TSA to assess the risk of random errors in the cumulative meta‐analyses.
-
We changed our criteria for assessing the statistical heterogeneity in the meta‐analyses. In the protocol it was classified an I² statistic value of 40 to 60% as moderate, and 75% and above as high. In the review, we have now defined moderate heterogeneity as an I² statistic of 50 to 74%, and high as 75% or above.
Notes
In future versions of this review we will also include, for all outcomes:
-
a subgroup analysis by medical condition
-
a subgroup analysis by type of filter
-
a sensitivity analysis by buffy coat
Keywords
MeSH
Medical Subject Headings (MeSH) Keywords
Medical Subject Headings Check Words
Adolescent; Adult; Female; Humans; Male;
PICO

Study flow diagram.

'Risk of bias' graph: review authors' judgements about each 'Risk of bias' item presented as percentages across all included studies.
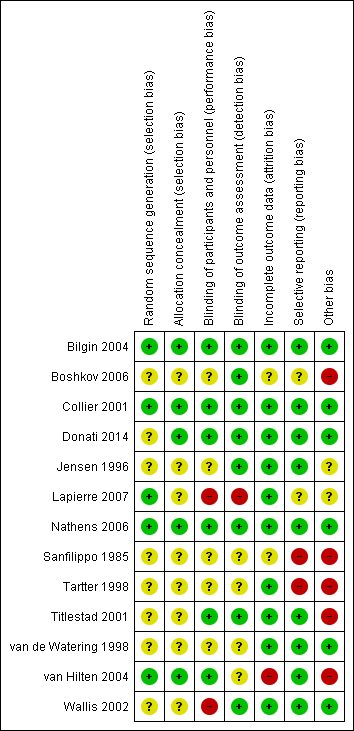
'Risk of bias' summary: review authors' judgements about each 'Risk of bias' item for each included study.
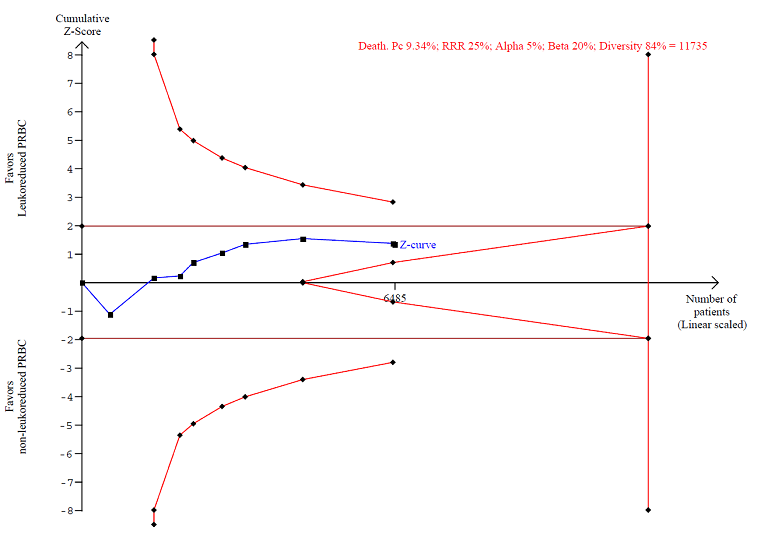
TSA calculated to reliably detect a 25% relative change in the incidence of death from any cause, assuming a control group event rate of 9.34% with a power of 80% at an alpha of 5%

Funnel plot of comparison: 1 Leukoreduced PRBC versus non‐leukoreduced PRBC. Main Analysis (Randomised patients), outcome: 1.3 Infection. Number of events of the total of randomised patients reported.

TSA calculated to reliably detect a 25% relative change in the incidence of infection from any cause, assuming a control group event rate of 20.4% with a power of 80% at an alpha of 5%.

TSA calculated to reliably detect a 25% relative change in the incidence of fever, assuming a control group event rate of 38.7% with a power of 80% at an alpha of 5%.

Comparison 1 Leukoreduced PRBC versus non‐leukoreduced PRBC. Main analysis (randomised patients), Outcome 1 TRALI. Number of events of the total of randomised patients reported.

Comparison 1 Leukoreduced PRBC versus non‐leukoreduced PRBC. Main analysis (randomised patients), Outcome 2 Death. Number of events of the total of randomised patients reported.

Comparison 1 Leukoreduced PRBC versus non‐leukoreduced PRBC. Main analysis (randomised patients), Outcome 3 Infection. Number of events of the total of randomised patients reported.
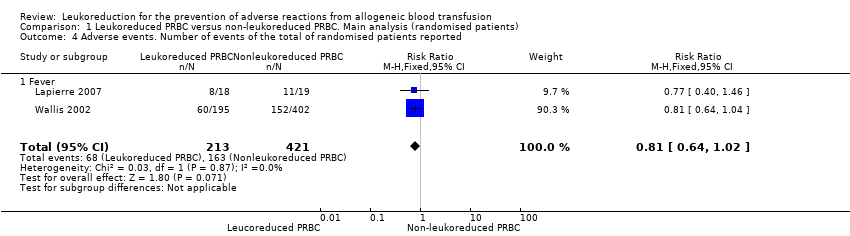
Comparison 1 Leukoreduced PRBC versus non‐leukoreduced PRBC. Main analysis (randomised patients), Outcome 4 Adverse events. Number of events of the total of randomised patients reported.
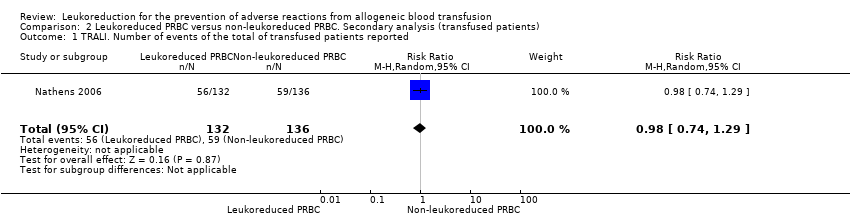
Comparison 2 Leukoreduced PRBC versus non‐leukoreduced PRBC. Secondary analysis (transfused patients), Outcome 1 TRALI. Number of events of the total of transfused patients reported.
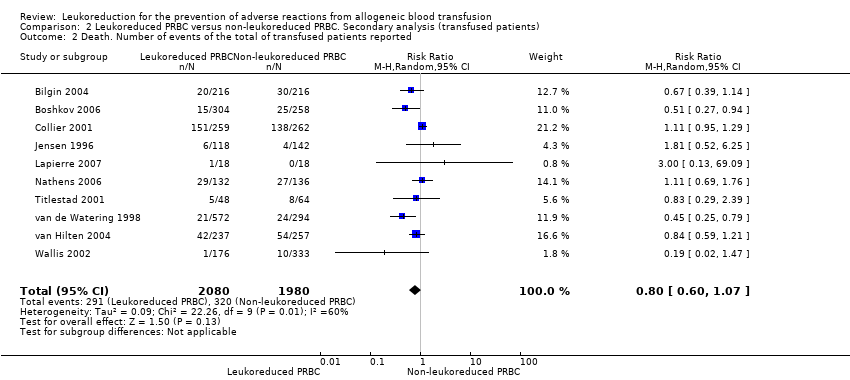
Comparison 2 Leukoreduced PRBC versus non‐leukoreduced PRBC. Secondary analysis (transfused patients), Outcome 2 Death. Number of events of the total of transfused patients reported.

Comparison 2 Leukoreduced PRBC versus non‐leukoreduced PRBC. Secondary analysis (transfused patients), Outcome 3 Infection. Number of events of the total of transfused patients reported.

Comparison 2 Leukoreduced PRBC versus non‐leukoreduced PRBC. Secondary analysis (transfused patients), Outcome 4 Adverse events. Number of events of the total of transfused patients reported.
| Leukoreduced PRBCs versus non‐leukoreduced PRBCs for preventing adverse reaction from allogeneic blood transfusion | ||||||
| Patient or population: Patients receiving RBC transfusion | ||||||
| Outcomes | Illustrative comparative risks* (95% CI) | Relative effect | Number of participants | Quality of the evidence | Comments | |
| Assumed risk | Corresponding risk | |||||
| Non‐leukoreduced packed RBCs | Leukoreduced packed RBCs | |||||
| TRALI | Study population | RR 0.96 | 1864 | ⊕⊕⊝⊝ | TSA yielded an inconclusive result. | |
| 63 per 1000 | 61 per 1000 | |||||
| Death due to any cause | Study population | RR 0.81 | 6485 | ⊕⊝⊝⊝ | TSA yielded an inconclusive | |
| 93 per 1000 | 76 per 1000 | |||||
| Infection from any cause | Study population | RR 0.80 | 6709 | ⊕⊝⊝⊝ | TSA yielded an inconclusive | |
| 204 per 1000 | 163 per 1000 | |||||
| Adverse events | Study population | RR 0.81 | 634 | ⊕⊕⊝⊝ | TSA yielded an inconclusive | |
| 387 per 1000 | 314 per 1000 | |||||
| Non‐infectious complication | Study population | Not estimable | — | — | No trial assessed this outcome. | |
| Not estimable | Not estimable | |||||
| *The basis for the assumed risk was the median control group risk across studies. The corresponding risk (and its 95% CI) is based on the assumed risk in the comparison group and the relative effect of the intervention (and its 95% CI). | ||||||
| GRADE Working Group grades of evidence | ||||||
| 1Downgraded by two due to imprecision: small sample size as compared with the calculated DARIS and the wide CI overlapping zones of no effect, as well as potential harm or benefit, or both. Few events reported. 3Downgraded due to: high risk of bias (Seven of 10 included studies were at high or unclear risk of bias, ‐1); important heterogeneity (I² statistic: 84%, ‐2); and imprecision due to the CI crossing the threshold of meaningful effect and an insufficient sample size as compared with the DARIS (‐1) 4Downgraded due to: high risk of bias (All included studies evaluated were at high risk of bias, ‐1) and imprecision due to the CI crossing the threshold of meaningful effect and an insufficient sample size as compared with the DARIS (‐1). | ||||||
| Outcome or subgroup title | No. of studies | No. of participants | Statistical method | Effect size |
| 1 TRALI. Number of events of the total of randomised patients reported Show forest plot | 1 | 1864 | Risk Ratio (M‐H, Random, 95% CI) | 0.96 [0.67, 1.36] |
| 2 Death. Number of events of the total of randomised patients reported Show forest plot | 9 | 6485 | Risk Ratio (M‐H, Random, 95% CI) | 0.81 [0.58, 1.12] |
| 3 Infection. Number of events of the total of randomised patients reported Show forest plot | 10 | 6709 | Risk Ratio (M‐H, Random, 95% CI) | 0.80 [0.62, 1.03] |
| 4 Adverse events. Number of events of the total of randomised patients reported Show forest plot | 2 | 634 | Risk Ratio (M‐H, Fixed, 95% CI) | 0.81 [0.64, 1.02] |
| 4.1 Fever | 2 | 634 | Risk Ratio (M‐H, Fixed, 95% CI) | 0.81 [0.64, 1.02] |
| Outcome or subgroup title | No. of studies | No. of participants | Statistical method | Effect size |
| 1 TRALI. Number of events of the total of transfused patients reported Show forest plot | 1 | 268 | Risk Ratio (M‐H, Random, 95% CI) | 0.98 [0.74, 1.29] |
| 2 Death. Number of events of the total of transfused patients reported Show forest plot | 10 | 4060 | Risk Ratio (M‐H, Random, 95% CI) | 0.80 [0.60, 1.07] |
| 3 Infection. Number of events of the total of transfused patients reported Show forest plot | 10 | 3557 | Risk Ratio (M‐H, Random, 95% CI) | 0.76 [0.58, 1.00] |
| 4 Adverse events. Number of events of the total of transfused patients reported Show forest plot | 2 | 544 | Risk Ratio (M‐H, Fixed, 95% CI) | 0.75 [0.60, 0.94] |
| 4.1 Fever | 2 | 544 | Risk Ratio (M‐H, Fixed, 95% CI) | 0.75 [0.60, 0.94] |