化学療法に伴う貧血管理のために赤血球造血刺激因子製剤を投与されているがん患者に対する鉄の役割について
Abstract
Background
Erythropoiesis‐stimulating agents (ESAs) are commonly used to treat chemotherapy‐induced anemia (CIA). However, about half of patients do not benefit.
Objectives
To evaluate the benefits and harms related to the use of iron as a supplement to ESA and iron alone compared with ESA alone in the management of CIA.
Search methods
We searched for relevant trials from the Cochrane Central Register of Controlled Trials (CENTRAL) (issue 1 January 2016), MEDLINE (1950 to February 2016), and www.clinicaltrials.gov without using any language limits.
Selection criteria
All randomized controlled trials (RCTs) comparing 'iron plus ESA' or 'iron alone' versus 'ESA alone' in people with CIA were eligible for inclusion.
Data collection and analysis
We used standard methodological procedures expected by Cochrane.
Main results
We included eight RCTs (12 comparisons) comparing ESA plus iron versus ESA alone enrolling 2087 participants. We did not find any trial comparing iron alone versus ESAs alone in people with CIA. None of the included RCTs reported overall survival. There was a beneficial effect of iron supplementation to ESAs compared with ESAs alone on hematopoietic response (risk ratio (RR) 1.17, 95% confidence interval (CI) 1.09 to 1.26; P < 0.0001; 1712 participants; 11 comparisons; high‐quality evidence). Assuming a baseline risk of 35% to 80% for hematopoietic response without iron supplementation, between seven and 16 patients should be treated to achieve hematopoietic response in one patient. In subgroup analyses, RCTs that used intravenous (IV) iron favored ESAs and iron (RR 1.20 (95% CI 1.10 to 1.31); P < 0.00001; 1321 participants; eight comparisons), whereas we found no evidence for a difference in hematopoietic response in RCTs using oral iron (RR 1.04 (95% CI 0.87 to 1.24); P = 0.68; 391 participants; three comparisons). There was no evidence for a difference between the subgroups of IV and oral iron (P = 0.16). There was no evidence for a difference between the subgroups of types of iron (P = 0.31) and types of ESAs (P = 0.16) for hematopoietic response.
The iron supplementation to ESAs might be beneficial as fewer participants treated with iron supplementation required red blood cell (RBC) transfusions compared to the number of participants treated with ESAs alone (RR 0.74 (95% CI 0.60 to 0.92); P = 0.007; 1719 participants; 11 comparisons; moderate‐quality evidence). Assuming a baseline risk of 7% to 40% for RBC transfusion without iron supplementation, between 10 and 57 patients should be treated to avoid RBC transfusion in one patient.
We found no evidence for a difference in the median time to hematopoietic response with addition of iron to ESAs (hazard ratio (HR) 0.93 (95% CI 0.67 to 1.28); P = 0.65; 1042 participants; seven comparisons; low‐quality evidence). In subgroup analyses, RCTs in which dextran (HR 0.95 (95% CI 0.36 to 2.52); P = 0.92; 340 participants; three comparisons), sucrose iron (HR 1.15 (95% CI 0.60 to 2.21); P = 0.67; 102 participants; one comparison) and sulfate iron (HR 1.24 (95% CI 0.99 to 1.56); P = 0.06; 55 participants; one comparison) were used showed no evidence for difference between iron supplementation versus ESAs alone compared with RCTs in which gluconate (HR 0.78 (95% CI 0.65 to 0.94); P = 0.01; 464 participants; two comparisons) was used for median time to hematopoietic response (P = 0.02). There was no evidence for a difference between the subgroups of route of iron administration (P = 0.13) and types of ESAs (P = 0.46) for median time to hematopoietic response.
Our results indicated that there could be improvement in the hemoglobin (Hb) levels with addition of iron to ESAs (mean difference (MD) 0.48 (95% CI 0.10 to 0.86); P = 0.01; 827 participants; seven comparisons; low‐quality evidence). In RCTs in which IV iron was used there was evidence for a difference (MD 0.84 (95% CI 0.21 to 1.46); P = 0.009; 436 participants; four comparisons) compared with oral iron (MD 0.07 (95% CI ‐0.19 to 0.34); P = 0.59; 391 participants; three comparisons) for mean change in Hb level (P = 0.03). RCTs in which dextran (MD 1.55 (95% CI 0.62 to 2.47); P = 0.001; 102 participants; two comparisons) was used showed evidence for a difference with iron supplementation versus ESAs alone compared with RCTs in which gluconate (MD 0.54 (95% CI ‐0.15 to 1.22); P = 0.12; 334 participants; two comparisons) and sulfate iron (MD 0.07 (95% CI ‐0.19 to 0.34); P = 0.59; 391 participants; three comparisons) were used for mean change in Hb level (P = 0.007). RCTs in which epoetin was used showed evidence for a difference with iron supplementation versus ESAs alone (MD 0.77 (95% CI 0.25 to 1.29); P = 0.004; 337 participants; five comparisons) compared with darbepoetin use (MD 0.10 (95% CI ‐0.13 to 0.33); P = 0.38; 490 participants; two comparisons) for mean change in Hb level (P = 0.02).
We found no evidence for a difference in quality of life with addition of iron to ESAs (standardized mean difference 0.01 (95% CI ‐0.10 to 0.12); P = 0.88; 1124 participants; three RCTs; high‐quality evidence).
We found no evidence for a difference in risk of grade III‐IV thromboembolic events (RR 0.95 (95% CI 0.54 to 1.65); P = 0.85; 783 participants; three RCTs; moderate‐quality evidence). The incidence of treatment‐related mortality (TRM) was 0% (997 participants; four comparisons; high‐quality evidence).
Other common adverse events included vomiting, asthenia, and leukopenia, and were similar in both arms.
Overall the risk of bias across outcomes was high to low. Since the included RCTs had shorter follow‐up duration (up to 20 weeks), the long‐term effects of iron supplementation are unknown. Our main reasons for downgrading the quality of evidence were inconsistency across the included studies and imprecision of results.
Authors' conclusions
Our systematic review shows that addition of iron to ESAs offers superior hematopoietic response, reduces the risk of RBC transfusions, and improves Hb levels, and appears to be well tolerated. None of the included RCTs reported overall survival. We found no evidence for a difference in quality of life with iron supplementation.
PICO
一般語訳
化学療法に伴う貧血管理のために赤血球造血刺激因子製剤を投与されているがん患者に対する鉄の役割について
レビューの論点: 化学療法に伴う貧血と診断された患者の貧血管理には、鉄補充のみ、または赤血球造血刺激因子製剤(ESA)に鉄を追加したほうがESAのみによる治療よりも優れているのか。
背景: 現在、化学療法に伴う貧血の治療には、赤血球の産生(赤血球造血)を促すESAか、場合によってはESAと鉄の両方が用いられている。または、治療をしないという選択や患者の状態を臨床的監視(人による監視)によって経過観察しつつ赤血球輸血を行うことが安全で適切な選択肢となる場合もある。そこで、化学療法に伴う貧血の管理での鉄補充の有益性と有害性を評価することを目的として系統的レビューを実施した。
検索期間: これは2016年2月現在のエビデンスである。
試験の特性: ESA+鉄とESAのみを比較したランダム化比較試験8件を対象とした。いずれも企業が資金提供しており、登録患者数は2,087例であった。鉄のみとESAのみを比較した試験はみつからなかった。
試験の資金提供元: 対象とした試験はいずれも企業が資金提供したものであった。
主要な結果: ESAに鉄を追加することによって、化学療法に伴う貧血が認められる患者の造血反応が改善する。ESAに鉄を補充すると輸血の回数が減少し、ヘモグロビン値が改善する可能性がある。鉄補充によりQOL(生活の質)が改善したというエビデンスはなかった。造血反応までの時間および静脈血栓(血液の塊)ができるリスクに関して、化学療法に伴う貧血のためにESA+鉄の治療を受けた患者とESAのみの治療を受けた患者の間に差があったことを示すエビデンスはみつからなかった。治療関連死について4件の試験が報告していたが、参加した997例のうち、死亡例はなかった。その他の有害事象には便秘、嘔吐、下痢が含まれ、各発生頻度はESA+鉄とESAのみとで同等であった。生存期間を報告した試験はなかった。
エビデンスの質: 造血反応に関するエビデンスの質は高かった。赤血球輸血に関するエビデンスの質は、(各推定を統合した)統合推定値のばらつきが大きかったため、中等度であった。ヘモグロビン値の変化や造血反応までの時間に関しては、統合推定値のばらつきが大きく、試験によって結果に差があったため、エビデンスの質は低かった。QOL(生活の質)に関するエビデンスの質は高かった。静脈に血栓ができるリスクに関するエビデンスの質は、統合推定値のばらつきが大きかったため、中等度であった。対象となったランダム化比較試験の追跡期間が短かったため(20週間以下)、鉄補充による長期的効果は不明であった。
Authors' conclusions
Summary of findings
| Benefits and harms of iron supplementation for chemotherapy‐induced anemia | |||||
| Patient or population: people diagnosed with chemotherapy‐induced anemia Comparison: erythropoiesis‐stimulating agents alone | |||||
| Outcomes | Illustrative comparative risks* (95% CI) | Relative effect | No of Participants | Quality of the evidence | |
| Assumed risk | Corresponding risk | ||||
| Control | Benefits and harms of iron supplementation | ||||
| Overall survival | None of the included studies reported data on overall survival | ||||
| Hematopoietic response | Study population | RR 1.17 | 1712 (7 studies, 11 comparisons) | ⊕⊕⊕⊕ | |
| 632 per 1000 | 740 per 1000 | ||||
| Moderate## | |||||
| 574 per 1000 | 672 per 1000 | ||||
| Red blood cell transfusion | Study population | RR 0.74 | 1719 (7 studies, 11 comparisons) | ⊕⊕⊕⊝ | |
| 195 per 1000 | 144 per 1000 | ||||
| Moderate## | |||||
| 167 per 1000 | 124 per 1000 | ||||
| Median time to hematopoietic response | Not applicable# | HR 0.93 (0.67 to 1.28) | 1042 (5 studies, 7 comparisons) | ⊕⊕⊝⊝ low1,2 | |
| Mean change in hemoglobin (better indicated by higher values) | The mean change in hemoglobin in the intervention groups was 0.48 higher | MD 0.48 (0.10 to 0.86) | 827 (3 studies, 7 comparisons) | ⊕⊕⊝⊝ | |
| Quality of life (better indicated by higher values) | The mean quality of life in the intervention groups was | SMD 0.01 (‐0.10 to 0.12) | 1124 (3 studies, 4 comparisons) | ⊕⊕⊕⊕ | |
| Thromboembolic events | Study population | RR 0.95 | 783 (3 studies) | ⊕⊕⊕⊝ | |
| 62 per 1000 | 58 per 1000 | ||||
| Moderate## | |||||
| 62 per 1000 | 59 per 1000 | ||||
| Treatment‐related mortality | Not applicable** | Zero events** | 997 (4 studies, 6 comparisons) | ⊕⊕⊕⊕ | |
| *The basis for the assumed risk (e.g. the median control group risk across studies) is provided in footnotes. The corresponding risk (and its 95% confidence interval) is based on the assumed risk in the comparison group and the relative effect of the intervention (and its 95% CI). | |||||
| GRADE Working Group grades of evidence | |||||
| 1Downgraded the quality of evidence by one level due to imprecision (the pooled estimate had wider confidence intervals). **Due to zero events we were not able to conduct meta‐analysis of these data. #Data were available as median and range, and hence were converted to log hazard ratio using the cumulative hazard log‐log transform method. ##The moderate control risk was calculated via GRADEpro software based on clinical experience of the review authors working in the field of hematological disorders. | |||||
Background
The majority of cancer patients undergoing chemotherapy develop chemotherapy‐induced anemia (CIA) (Kitano 2007; Knight 2004; Leonard 2005; Ludwig 2004; Pujade‐Lauraine). Approximately 83% of people receiving chemotherapy develop CIA (Barrett‐Lee 2006). In people undergoing myelosuppressive chemotherapy or radiation therapy, or both, the incidence is as high as 70% to 90%, and it is about 60% in people with solid tumors and lymphomas (Schwartz 2007). The majority of people with CIA suffer from fatigue, weakness, and dyspnea, leading to decreased quality of life and performance status (Littlewood 2001; Mancuso 2006; Stasi 2003). The overall goal of treatment in people with CIA is reduction in transfusion requirements and maximization of quality of life (Rizzo 2008; Rizzo 2010). The National Comprehensive Cancer Network (NCCN) guidelines, NCCN 2009, and the European Organisation of Research and Treatment of Cancer (EORTC) guidelines, Aapro 2008, recommend red blood cell (RBC) transfusion as an effective strategy to manage CIA because it leads to replacement of depleted hemoglobin (Hb). However, research has shown the effect of RBC transfusion to be temporary and possibly associated with serious thromboembolic events and increased mortality (Khorana 2008; Mercadante 2009). An alternative to RBC transfusion in treating CIA in cancer patients involves the use of erythropoiesis‐stimulating agents (ESAs).
ESAs are man‐made proteins that stimulate the production of RBCs in bone marrow when the oxygen level in the blood goes down. ESAs increase Hb levels, reduce transfusion requirements, and improve quality of life (Demetri 1998; Glaspy 1997; Littlewood 2001; Rizzo 2002). However, a recent meta‐analysis employing published and unpublished/unreported data from randomized controlled trials (RCTs) showed found no evidence for a clinically relevant improvement of fatigue‐related symptoms and only small benefits for anemia‐related symptoms in cancer patients receiving ESAs compared to controls (Bohlius 2014). Moreover, evidence from several studies indicates that ESA therapy is also associated with increased risk of thromboembolic events (Glaspy 2010; Rizzo 2008). A systematic review of 51 phase III RCTs examining the use of ESAs in the treatment of CIA showed a relative increase of 57% in the risk of blood clots (venous thromboembolism) and a relative increase of 10% in the risk of mortality among participants (Bennett 2008). An individual participant data meta‐analysis (53 RCTs, 13,933 participants) examining the effects of two types of ESAs (epoetin and darbepoetin) on the survival of cancer patients showed that ESAs increased overall mortality by 17% in all participants compared to control groups, and by 10% in participants undergoing chemotherapy compared to control groups (Bohlius 2009). For patients undergoing chemotherapy who have a Hb less than 10 g/dL, American Society of Hematology (ASH)/American Society of Clinical Oncology (ASCO) recommend that clinicians should discuss the potential harms (for example increased incidence of thromboembolic events and reduced survival) and benefits (for example decreased RBC transfusions) of ESAs with patients (Bohlius 2009; Bohlius 2014; Tonia 2012), so that patients' preferences for demonstrated risk guide decisions on CIA treatment (Rizzo 2010). In fact, NCCN discourages the use of ESAs with a curative intent for people undergoing chemotherapy (NCCN 2010).
Due to the potential harms associated with ESA treatment, iron has been proposed as an adjunct to ESAs in the management of CIA. Cancer patients suffering from CIA who are treated with ESAs alone are likely to experience increased erythron iron requirements exceeding the available supply (that is functional iron deficiency (FID)) and production of iron‐poor erythrocytes in the bone marrow (Eschbach 2005). Co‐administration of iron prevents FID and may require a reduced dose of ESAs to attain target Hb levels (Auerbach 2008a). However, iron therapy is not without risks. For example, oral iron can cause diarrhea, constipation, stomach upsets, and allergic reactions such as rash, itching, and swelling of face/tongue/throat. High‐molecular weight iron dextran is associated with a much higher adverse event rate than the low‐molecular weight iron dextran (Fletes 2001; Mamula 2002). However, newer preparations of intravenous (IV) iron including low‐molecular weight iron dextran, iron sucrose, and ferric gluconate are associated with few adverse events (Chertow 2004; Chertow 2006).
A number of RCTs have been conducted to assess the efficacy of iron supplementation to ESAs versus ESAs alone for the management of CIA. However, evidence related to efficacy of iron in combination with ESAs compared with ESAs alone in people with CIA is conflicting. Whereas some trials have shown that the use of iron as adjunct to ESAs compared with ESAs alone is associated with improved response to ESAs, increased Hb levels, greater hematopoietic response, and improved health‐related quality of life in cancer patients (Bastit 2008; Bellet 2007; Hedenus 2007; Pedrazzoli 2008), others have shown that IV iron had no differential impact on Hb levels, blood transfusions, ESA usage, or patient quality of life compared with oral supplementation or placebo (Steensma 2011a). Additionally, studies supporting use of iron supplementation have not definitively addressed the optimal dosage or type and route of administration of iron. The lack of definitive evidence regarding benefits and harms of iron supplementation to ESAs in people with CIA calls for a comprehensive systematic assessment of the effects of iron supplementation to ESAs.
Description of the condition
Anemia refers to a reduction in the number of RBC counts or hemoglobin (a protein inside the RBCs that contains iron and transports oxygen to different body systems), resulting in a decreased ability of the blood to carry oxygen to body tissues. According to the World Health Organization (WHO), a man with Hb level less than 13 g/dL or a woman with Hb level less than 12 g/dL is considered anemic. People with cancer, especially those undergoing chemotherapy, are susceptible to anemia because they have low erythropoietin levels. CIA occurs when chemotherapy agents attack rapidly diving cells including RBCs, thus preventing them from dividing. Besides disrupting erythropoiesis (the production of red blood cells), chemotherapy may cause mouth sores, taste changes, and nausea, thus reducing intake of nutrients necessary for RBC production. CIA is associated with a reduction in the production of RBCs in the bone marrow, a decrease in erythropoietin, and inadequate iron release. One of the most severe clinical manifestations of CIA is fatigue, experienced by 63% of anemic cancer patients following chemotherapy (Gabrilove 2007). Other symptoms may include insomnia, anorexia, and depression (van Weert 2006); peripheral edema, sustained tachycardia, tachypnea, chest pain, dyspnea on exertion, and orthostatic lightheadedness (NCCN 2009).
Description of the intervention
A number of RCTs have shown that the use of iron as an adjunct to ESAs may increase the rate at which patients respond to ESA therapy and shorten the length of ESA administration (Auerbach 2004a; Bellet 2007; Hedenus 2007; Henry 2007a). Iron may be administered either orally or intravenously (IV). People with CIA who are treated with IV iron as opposed to oral iron have experienced a significantly greater Hb response, in Auerbach 2004a and Henry 2007a, and significant reduction in RBC transfusion and lag time to response (Bastit 2008). However, IV iron is more expensive (Shord 2008). Adverse events including allergic and anaphylactoid reactions are associated with iron dextran treatment (Bailie 2005; Shander 2010). Examples of oral iron salts currently approved by the US Food and Drug Administration for use in management of CIA include ferrous sulfate, ferrous gluconate, and ferrous fumarate, whereas IV formulations include iron dextran (approved in 1991), iron ferric gluconate (approved in 1999), iron sucrose (approved in 2000), and ferumoxytol (approved in 2009) (Shander 2010). Doses of iron used in recent RCTs include iron dextran total dose infusion or 100 mg bolus injections (Auerbach 2004a), ferric gluconate 125 mg once a week for eight weeks (Henry 2007a), iron sucrose 100 mg once a week for week one to six and 100 mg every two weeks for week eight to 14 (Hedenus 2007), ferric gluconate or iron sucrose 200 mg every three weeks (Bastit 2008), ferric gluconate 125 mg for six weeks (Pedrazzoli 2008), and iron dextran 400 mg every three weeks (Auerbach 2008a).
How the intervention might work
Erythropoietin is the hormone that facilitates the production of erythrocytes in the bone marrow. Inadequate quantities of iron or erythropoietin, or both result in anemia. Although ESAs have been used to treat CIA in cancer patients, without iron supplementation these patients are likely to experience FID and production of iron‐poor erythrocytes in the bone marrow (Eschbach 2005). However, co‐administration of iron prevents FID and may require a reduced dose of ESAs to attain target Hb levels (Auerbach 2008a).
Why it is important to do this review
Currently, ESAs are often used to manage CIA. However, about half of patients fail to show an increase in baseline Hb, a reduction in transfusions, or an improvement in function following treatment with ESAs (Birgegard 2006; Henry 1995; Razzouk 2006). Moreover, the use of ESAs is further restricted due to the associated adverse thromboembolic events. Hence, the use of iron as an adjunct to ESAs has been suggested as a way of circumventing issues related to the use of ESAs alone. However, the findings from RCTs addressing benefits and harms of iron in the management of CIA are conflicting.
The findings will provide answers regarding the impact of iron supplementation to ESAs on various outcomes such as hematopoietic response, time to hematopoietic response, and mean change in Hb in people with CIA. The results will also improve our understanding of optimal dose, length of therapy, and route of administration of iron in the management of CIA. This review may not help physicians to make decisions about using iron to manage patients with CIA. It will assist them in decision making regarding use of iron in patients with CIA receiving ESAs.
Objectives
To evaluate the benefits and harms related to the use of iron as a supplement to ESAs and iron alone compared with ESAs alone in the management of CIA.
Methods
Criteria for considering studies for this review
Types of studies
All RCTs comparing 'iron + ESAs' or 'iron alone' versus 'ESAs alone' were eligible for inclusion. We included all published and unpublished studies regardless of publication type (abstracts, full paper, grey literature, etc.). We excluded any observational studies employing non‐randomized and quasi‐randomized designs. We did not use any language restrictions.
Types of participants
We included all participants diagnosed with CIA, regardless of cancer type or severity and age, enrolled in RCTs assessing the role of iron supplementation to ESAs or iron alone compared with ESAs alone in the management of CIA. We did not consider RCTs that included participants with anemia attributable to factors other than cancer or chemotherapy (for example folate deficiency, hemolysis, gastrointestinal bleeding, or myelodysplastic syndromes) for the review.
Types of interventions
We considered the following interventions:
-
Experimental intervention: iron supplementation to ESAs (i.e. iron and ESAs) or iron alone
-
Control intervention: treatment with ESAs alone
Types of outcome measures
This systematic review is based on the published protocol (Mhaskar 2012).
Primary outcomes
Overall survival, defined as the time to death from any cause or varying definitions as used by the authors of the original study.
Secondary outcomes
We considered the following secondary outcomes:
-
Hematopoietic response (dichotomous outcome); defined as increasing Hb by ≥ 2 g/dL from baseline or increase to Hb 12 g/dL without transfusion
-
RBC transfusions (dichotomous outcome)
-
Time to hematopoietic response (time‐to‐event outcome)
-
Mean change in Hb level from baseline (continuous outcome)
-
Changes in quality of life (continuous outcome)
-
Adverse events (dichotomous outcome)
-
Treatment‐related mortality (dichotomous outcome)
We added data regarding serum ferritin and transferrin saturation (TSAT) levels subsequently to the results after submission of the protocol (Mhaskar 2012).
Search methods for identification of studies
We conducted a comprehensive search of electronic databases without any language limits for all years until the search date (February 2016). We manually scanned all references of obtained articles to identify additional studies missed in the search.
Electronic searches
We searched for relevant trials from electronic databases as follows:
-
MEDLINE (1950 to February 2016) (see Appendix 1)
-
Cochrane Central Register of Controlled Trials (CENTRAL) (Cochrane Library Issue 1 January 2016) (see Appendix 2)
-
Clinicaltrials.gov (see Appendix 3)
Searching other resources
-
Manual scanning of references: We checked references of all relevant review articles and current treatment guidelines for potential articles.
-
Contacting authors: Where a study contained unclear information, we contacted the authors to ensure accuracy. This occurred in one instance (study was published only as an abstract and hence we were seeking information about the study), but we did not receive a response from the author.
-
Expert contacts: We contacted experts in the fields of oncology and hematology to identify potentially eligible but unpublished studies or ongoing studies.
Data collection and analysis
Selection of studies
Two review authors (HW and RM) independently scanned the retrieved titles and abstracts of all studies for eligibility for inclusion in the review. Disagreements in the selection of studies were resolved by consensus (Higgins 2011a). At every stage of searching and screening, we documented the overall number of studies identified, excluded, and included with reasons according to the Preferred Reporting Items for Systematic Reviews and Meta‐Analyses (PRISMA) guidelines. We used the PRISMA guidelines to create a flow diagram (Moher 2009).
Data extraction and management
Data extraction
Two review authors independently extracted data using a standardized data extraction form. From each relevant trial, we extracted data on the following domains:
-
General information on the study: Authors, date of publication, title, publication type (full text, abstract, unpublished), country, number of centers involved, and funding source.
-
Study characteristics: Trial design (e.g. parallel, cross‐over, or factorial), study setting (single institution, multicenter national, multicenter international), inclusion/exclusion criteria, methodological quality, length of follow‐up.
-
Participant characteristics: Age (mean/median, range), gender, number of participants recruited/allocated/evaluated, participants lost to follow‐up, cancer type, cancer stage, pre‐study Hb level, serum iron level, TSAT, serum erythropoietin level, and Eastern Cooperative Oncology Group (ECOG) performance status.
-
Intervention: Detailed description of both the intervention and the standard treatment in terms of:
-
Type of iron (e.g. ferrous sulfate, dextran, sucrose, ferric gluconate), dosage, route of administration, duration.
-
Type of ESA (e.g. epoetin alfa, darbepoetin alfa, epoetin beta), dosage, route of administration, duration.
-
-
Outcomes
-
Primary:
-
Overall survival. We planned to extract data on hazard ratio (HR) and confidence intervals (CI) from each included study. However, in cases in which these estimates were not available in direct extractable format, we obtained the summary estimates (HR and CI) using the methods suggested by Tierney et al (Tierney 2007). These methods allow calculation of the HR and associated statistics using indirect calculation of the variance (V) and the number of observed minus expected events (O ‐ E) based on parameters reported in the papers (e.g. P value, log‐rank statistics, and/or survival curves).
-
-
Secondary:
-
Hematopoietic response, defined in the included studies as increasing Hb by ≥ 2 g/dL from baseline or increase to Hb 12 g/dL without transfusion. (We extracted number of participants showing hematopoietic response versus number of participants randomized to intervention/control arm.)
-
Mean change in Hb level. (Extracted as mean and standard deviation. We extracted the definition of mean change in Hb level from the individual studies.) We also noted whether the study reported mean and standard deviation of the change from baseline versus only the end of study (final) values for mean and standard deviation. We combined final values and change scores in the same analysis as per Chapter 9 recommendation in the Cochrane Handbook for Systematic Reviews of Interventions (Deeks 2011). For clarity, we indicated the studies reporting the change scores in the forest plots.
-
Time to hematopoietic response. (If only available as median and range, it was converted to log HR using the cumulative hazard log‐log transform method.)
-
RBC transfusions. (We extracted number of participants receiving transfusion versus number of participants randomized to the intervention/control arms.)
-
Quality of life. (We extracted mean and standard deviation based on quality of life instrument used in individual studies and then converted it into standardized mean difference for intervention and control arm.)
-
Adverse events. (We extracted number of participants experiencing an adverse event versus number of participants randomized to the intervention and control arm.)
-
Treatment‐related mortality. (We extracted number of participants experiencing treatment‐related mortality versus number of participants randomized to the intervention and control arm.)
-
Mean change in serum ferritin level. (Extracted as mean and standard deviation. We extracted the definition of mean change in ferritin level from the individual studies.)
-
Mean change in TSAT level. (Extracted as mean and standard deviation. We extracted the definition of mean change in TSAT level from the individual studies.)
-
-
Data management
Two review authors (HW and RM) manually extracted data from publications using a standardized data extraction form and entered it into Review Manager (RevMan) (RevMan 5.3). A third review author (AK) re‐checked the extracted data. Senior review authors (BD and AK) randomly selected 15% of the RCTs and checked the data for accuracy.
Assessment of risk of bias in included studies
Two review authors (HW and RM) independently assessed all eligible studies for their risk of bias (assessment of methodological quality) using methods suggested in Chapter 8 of the Cochrane Handbook for Systematic Reviews of Interventions (Higgins 2011b). The review authors judged each quality domain based on the following three‐point scale:
-
-
'Yes' (low risk of bias: plausible bias unlikely to seriously alter the results if all criteria were met)
-
'No' (high risk of bias: plausible bias that seriously weakens confidence in the results if one or more criteria were not met)
-
'Unclear' (uncertain risk of bias: plausible bias that raises some doubt about the results if one or more criteria were assessed as unclear)
-
We included the following items in the 'Risk of bias' assessment for randomized trials:
-
Sequence generation (whether allocation sequence was adequately generated)
-
Allocation concealment (whether allocation was adequately concealed)
-
Masking/blinding (whether knowledge of the allocated intervention was adequately prevented during the study. We extracted data regarding who, i.e. participants, personnel, outcome assessors, and/or data analysts, were blinded.)
-
Incomplete outcome data (whether incomplete outcome data was adequately addressed)
-
Selective outcome reporting (whether reports of the study were free of selective outcome reporting)
-
Other sources of bias (whether reports of the study included pre‐specification of expected difference in the primary outcome (delta), alpha error, beta error and sample size calculation)
-
Intention‐to‐treat (ITT) analysis (whether ITT analysis was undertaken in the study)
We extracted these data for each outcome of interest separately. In addition, we assessed if domains related to random error and sample size were specified a priori in each trial.
Measures of treatment effect
-
For dichotomous outcomes (e.g. hematopoietic response, RBC transfusions, treatment‐related harms), we summarized data as risk ratios with 95% confidence intervals for each trial.
-
For continuous outcomes (e.g. mean change in Hb, serum ferritin, and TSAT levels), we summarized data as (unstandardized) mean differences and standard error.
-
For time to hematopoietic response, we summarized data as hazard ratio and 95% confidence intervals.
Unit of analysis issues
We extracted data from each included study (unit of analysis) as follows. For dichotomous variables, we used the number of participants in the 'iron + ESAs' arm (intervention group) and the number of participants in the 'ESAs alone' arm (control group). For continuous variables, we used the mean, standard deviation, and the number of participants in the intervention and control groups. For studies with multiple intervention groups, we included each pair‐wise comparison separately. Moreover, for dichotomous outcomes, we divided both the number of events and the total number of participants. For continuous and time‐to‐event outcomes, we did not changed the means and standard deviations and log hazard ratio and standard errors respectively, and we divided only the total number of participants (Higgins 2011c).
Dealing with missing data
We requested missing data or complementary information from the first or corresponding authors of studies in which necessary outcome data were not available from the primary literature. We also performed meta‐analysis using a STATA command metamiss2 (White 2009), which allows for imputation of missing values based on informative missingness in the absence of data for binary outcomes (Deeks 2011). We made explicit assumptions of any methods used, for example that the data were assumed missing at random, not missing at random, or that missing values were assumed to have a particular value (such as imputing the mean).
Assessment of heterogeneity
We assessed heterogeneity among trials and between subgroups using a Chi² test with a significance level at P < 0.10. We also assessed the degree of heterogeneity among trials and between subgroups using the I² statistic. We used the following guide to interpret the I² statistic: I² = 0% to 40% (heterogeneity that might not be important), I² = 30% to 60% (moderate heterogeneity), I² = 50% to 90% (substantial heterogeneity), I² = 75% to 100% (considerable heterogeneity) (Deeks 2011).
Assessment of reporting biases
We did not assess the publication bias, as we included only eight RCTs in this review. If we include more than 10 RCTs in future updates of the review, we will assess the publication bias for each outcome and will include a funnel plot as per Cochrane guidelines.
Data synthesis
We pooled the data using the random‐effects model (DerSimonian and Laird method) according to Chapter 9 of the Cochrane Handbook for Systematic Reviews of Interventions (Deeks 2011). We reported dichotomous outcomes data (for example number of participants achieving hematopoietic response) as risk ratios and reported continuous data (for example change in Hb level) as mean difference. In case different studies reported either change‐from‐baseline outcomes or final value scores, we did not standardize the mean differences. However, since the included studies used different instruments for assessment of quality of life, we calculated the standardized mean difference for each study as suggested in Chapter 9 of the Cochrane Handbook for Systematic Reviews of Interventions (Deeks 2011). We pooled the two types of outcomes (change‐from‐baseline and final value). For all analyses, we calculated corresponding 95% confidence intervals. If appropriate, we calculated the number needed to treat to benefit and number needed to treat to harm for ease of interpretation from summary estimates for different risk levels. For statistical analysis, we entered data into RevMan (RevMan 5.3). We conducted the additional analyses that were not possible in RevMan using STATA version 11.0 (Stata 11 2009). We created a 'Summary of findings' table using the GRADE software (Balshem 2011; GRADEpro 2008; Guyatt 2011; Guyatt 2011a; Guyatt 2011b; Guyatt 2011c; Guyatt 2011d; Guyatt 2011e).
Subgroup analysis and investigation of heterogeneity
We performed subgroup analysis on the following:
-
type of iron (iron dextran, ferrous gluconate, ferrous sulfate, etc.);
-
route of iron administration (IV versus oral);
-
type of ESA (epoetin versus darbepoetin).
We were not able to perform the following prespecified subgroup analyses due to non‐availability of relevant data. Please see the subgroup analyses in the results section below for details.
-
cancer type;
-
cancer stage;
-
duration of follow‐up;
-
type of chemotherapy;
-
single‐ versus multicenter study.
We assessed the differences between subgroups using the test of heterogeneity between subgroups in RevMan (RevMan 5.3).
We also investigated statistically significant heterogeneity by conducting meta‐regression. That is, for treatments administered at different doses, we tested for trend between iron intake (dose) and the relative risk of achieving hematopoietic response. We performed these analyses either by using metareg STATA command for trend estimation across different levels of exposure between studies or glst STATA command for trend estimation across different levels of exposure within studies (Orsini 2006; Sterne 2011). We also investigated whether the baseline TSAT, serum ferritin, and Hb values were associated with the increase in hematopoietic response (on the log scale) for oral and IV iron combined and IV iron alone by conducting meta‐regression.
Sensitivity analysis
We assessed the robustness of our results by conducting sensitivity analysis with respect to methodological quality of the RCTs. We also conducted sensitivity analysis by definition(s) of hematopoietic response.
Results
Description of studies
See Characteristics of included studies and Characteristics of excluded studies for details.
Results of the search
Our search identified 904 relevant studies excluding duplicates. After screening the titles and abstracts of these records, we found 880 to be non‐relevant and excluded them. The PRISMA flow chart depicts the inclusion and exclusion of studies (Figure 1). One study was published only as an abstract, and hence we contacted the author for more information, but received no response.
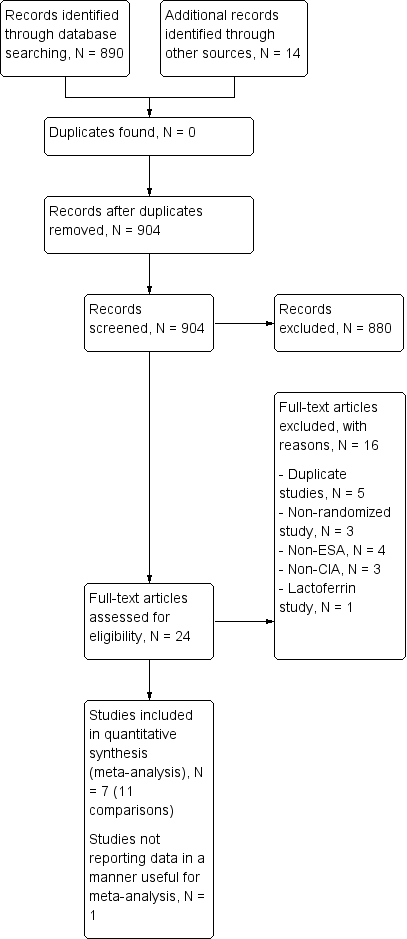
Study flow diagram.
Included studies
The present review includes eight multicenter national trials with 12 comparisons. We did not identify any study comparing iron alone versus ESAs alone addressing the management of people diagnosed with CIA.
Design
The study by Auerbach et al is an open‐label RCT with four arms and three references relating to this study (Auerbach 2004a; Auerbach 2004b; Auerbach 2004c). The study by Auerbach et al was a phase II, double‐blind, multicenter, and 2 × 2 factorial study (Auerbach 2010). The two study factors were dose of darbepoetin alfa (500 µg every three weeks versus 300 µg every three weeks) and IV iron usage (IV iron versus no IV iron). The study was blinded to the dose of darbepoetin alfa administered and open label for IV iron administration. Randomization was stratified by planned chemotherapy (platinum versus non‐platinum) and geographic region (North America versus Europe) (Auerbach 2010). The study by Bastit et al was a multicenter, randomized, open‐label, phase III study. Randomization was stratified by tumor type (lung/gynecologic versus other types) and baseline Hb category (< 10 g/dL versus ≥ 10 g/dL). Most participants (67% in the IV iron group, 76% in the control group) completed this study. Nonetheless importantly, the reasons for withdrawal (death, adverse events, disease progression, consent withdrawal, protocol deviations, and non‐compliance) were similar across study groups (Bastit 2008). The trial by Beguin et al was a multicenter, three‐arm RCT, not placebo‐controlled and open label (for IV arm) (Beguin 2008). The study by Henry et al had three arms and two references relating to this study (Henry 2007a; Henry 2007b). This was a multicenter, prospective, open‐label RCT (Henry 2007a; Henry 2007b). The study by Pedrazzoli et al was a randomized, open‐label, multicenter study (Pedrazzoli 2008). The study by Steensma et al has three arms and two references relating to this study (Steensma 2011a; Steensma 2011b). The study by Steensma et al was a prospective, multicenter, placebo‐controlled, randomized trial. Random assignment was stratified by participant sex, tumor type (solid tumors versus hematologic malignancies), severity of anemia on the basis of the World Health Organization (WHO) classification (mild: Hb ≥ 9.5 g/dL; severe: Hb < 9.5 g/dL), and whether or not participants were receiving a platinum‐containing chemotherapy regimen. The study by Bellet et al was a prospective, multicenter, randomized, open‐label, two‐stage phase III clinical trial (Bellet 2007). This study reported the change in Hb levels, other iron indices, quality of life, and adverse events, but reported data were not amenable to statistical analysis. The distribution of participants in the individual study arms in this study was not reported (Bellet 2007).
Sample sizes
The study by Auerbach et al included 157 participants with CIA comparing total dose infusion iron dextran, iron dextran (bolus), or oral iron ferrous sulfate as supplements to recombinant human erythropoietin versus ESAs alone (Auerbach 2004a; Auerbach 2004b; Auerbach 2004c). The trial by Auerbach et al included 238 non‐myeloid cancer patients with CIA comparing oral iron dextran as supplements to darbepoetin alfa versus ESAs alone (Auerbach 2010). The study by Bastit et al included 398 non‐myeloid cancer patients with CIA comparing IV ferric gluconate (or sucrose) or oral ferric gluconate (or sucrose) as supplements to darbepoetin alfa versus ESAs alone (Bastit 2008). The trial by Beguin et al was a joint public‐ and industry‐funded trial including 102 autologous hematopoietic cell transplantation recipients with lymphoid malignancies comparing oral iron sucrose as supplements to darbepoetin alfa versus ESAs alone (Beguin 2008). The study by Henry et al included 187 participants with CIA comparing sodium ferric gluconate or oral ferrous sulfate as supplements to epoetin alfa versus ESAs alone (Henry 2007a; Henry 2007b). The study by Pedrazzoli et al included 149 participants with CIA comparing sodium ferric gluconate as supplements to darbepoetin alfa versus ESAs alone (Pedrazzoli 2008). The study by Steensma et al included 502 participants with CIA comparing sodium ferric gluconate or oral ferrous sulfate as supplements to darbepoetin alfa versus ESAs alone (Steensma 2011a; Steensma 2011b). The study by Bellet et al included 375 CIA patients comparing iron sucrose as a supplement to darbepoetin alfa versus ESAs alone (Bellet 2007).
Setting
All the included studies were funded by the industry.
Participants
The participants in the study by Auerbach et al were with CIA and Hb ≤ 105 g/dL; ferritin ≤ 450 pmol/L or ≤ 675 pmol/L; TSAT ≤ 19%; ECOG performance status ≤ 2 (Auerbach 2004a). The mean age of participants was 64.7 years. The study by Auerbach et al included participants who were ≥ 18 years old and had non‐myeloid cancer, CIA (Hb ≤ 10 g/dL), and no iron deficiency, and excluded patients if they had absolute iron deficiency (TSAT < 15% and serum ferritin < 10 ng/mL). The mean age was about 62 years, and the most common tumor types were gastrointestinal, breast, and lung (Auerbach 2010).The participants in the study by Bastit et al included men and women ≥ 18 years old with anemia (Hb <11 g/dL within 24 hours before randomization) and non‐myeloid malignancy. Participants were required to have an ECOG performance status score of 0 to 2, adequate renal and liver function, and eight weeks of cytotoxic chemotherapy planned (Bastit 2008). The study by Beguin et al included autologous hematopoietic cell transplant recipients with lymphoid malignancies (Beguin 2008). The study by Henry et al included participants with CIA (Hb < 11 g/dl; serum ferritin > 100 ng/ml or TSAT > 15%) scheduled to receive chemotherapy and epoetin alfa (40,000 U subcutaneously weekly) (Henry 2007a). The participants in the study by Pedrazzoli et al were with lung, gynecologic, breast, and colorectal cancers and ≥ 12 weeks of planned chemotherapy. Participants were required to have Hb ≤ 11 g/L and no absolute or functional iron deficiency (Pedrazzoli 2008). The participants in the study by Steensma et al were with < 11 g/dL Hb undergoing chemotherapy for non‐myeloid malignancies (Steensma 2011a). The study by Bellet et al included participants older than 18 years with CIA (Hb ≤ 10 g/dL) who had completed eight prior weeks of ESA therapy (Bellet 2007).
Interventions
All of the studies had at least one IV iron arm; gluconate and sucrose were used in 4 of 12 comparisons in each case and sulfate and dextran were used in 3 of 12 comparisons in each case. Only three studies included an oral iron arm (all iron sulfate). In terms of type of ESA in the control arm, half of the comparisons included darbepoetin and half included epoetin.
Outcomes
None of the included RCTs reported data on overall survival. All of the studies had response to iron as one of the primary outcomes. See Characteristics of included studies for details.
Excluded studies
After assessing full texts of 21 studies, we excluded 13 trials for a variety of reasons. Four studies, (Demarteau 2007, Lerchenmueller 2006, Pinter 2007, and Vandebroek 2006), were duplicate publications of the study by Bastit et al (Bastit 2008), and one study, (Auerbach 2008), was a duplicate publication of the study by Auerbach et al (Auerbach 2010). Three studies were not RCTs (Agrawal 2005; Doherty 2008; Savonije 2006). Four studies did not employ ESAs (Dangsuwan 2010; Kim 2007; Athibovonsuk 2013; Hedenus 2014). Three studies had participants who were not diagnosed with CIA (Birgegard 2006; Hedenus 2007; Ferrari 2012), and one study assessed safety and efficacy of oral lactoferrin (Maccio 2010). See Characteristics of excluded studies for details.
Risk of bias in included studies
We have presented the results of the 'Risk of bias' assessment in Figure 2. The studies by Beguin et al and Bellet et al were published as meeting abstracts (Beguin 2008; Bellet 2007). The abstract of the study by Bellet et al lacked the details needed for us to assess the methodological quality of this study (Bellet 2007).

Risk of bias summary: Review authors' judgments about risk of bias in each included study.
Allocation
Only 37% (3/8) of included studies reported the method of generation of randomization sequence (Auerbach 2010; Beguin 2008; Steensma 2011a). In the other trials, the authors described the study as "randomized," although the information required to assess the adequacy of methods used for generation of randomization sequence was not reported (Auerbach 2004a; Bastit 2008; Henry 2007a; Pedrazzoli 2008). However, the allocated intervention assignment was adequately concealed in 87% (7/8) of trials. In two of these seven trials the authors explicitly reported the method used for allocation concealment: “interactive voice response system” in Bastit 2008 and “by calling the central randomization center” in Steensma 2011a. In summary, considering the quality of evidence for the generation of randomization sequence and methods of allocation concealment together, we judged there to be moderate risk of selection bias.
Blinding
Five trials were described as "open‐label," suggesting that participants, caregivers, outcome assessors, or data analysts were probably aware of the arm to which participants were allocated (Auerbach 2004a; Bastit 2008; Bellet 2007; Henry 2007a; Pedrazzoli 2008). In the study by Auerbach et al, the control arm was blinded, whereas the IV iron arm was open label (Auerbach 2010). Furthermore, this study reported that the participants were assigned blinded boxes of study medication using box numbers, which were recorded and reconciled. The study was blinded while ongoing and unblinded after all participants had completed the study. However, it was unclear whether or not the investigators were blinded. Hence we interpreted this as a unclear risk of performance and detection bias. Although it appeared that there was evidence of blinding procedures in one study in which "patients and investigators were blinded to assignment of oral iron or oral placebo" (Steensma 2011a), trial authors also stated that "for practical reasons, assignment to IV iron versus an oral product was not blinded," which in our opinion could potentially increase risk of bias in the results.
Incomplete outcome data
Sixty‐two per cent (5/8) of the trials had low risk of bias with respect to incomplete outcome reporting (Auerbach 2004a; Auerbach 2010; Bastit 2008; Pedrazzoli 2008; Steensma 2011a). Two trials were published as abstracts and had insufficient information for us to assess whether risk of attrition bias existed (Beguin 2008; Bellet 2007). In the trial by Bastit et al, the authors reported that efficacy data were analyzed according to the ITT principle (Bastit 2008). Most participants (67% in the IV iron group, 76% in the control group) completed this study. The authors clearly described the number of and reasons for withdrawals and dropouts. Importantly, the reasons for withdrawal (death, adverse events, disease progression, consent withdrawal, protocol deviations, non‐compliance) were similar across study groups. Hence, we judged this study to have low risk of attrition bias. In the trial by Henry et al, the authors reported that “except for number of transfusions and patients receiving transfusions,” analysis of primary and secondary efficacy endpoints were based on “evaluable population,” that is performed per protocol (Henry 2007a). In addition, the imputation method used, that is “last observed data recorded for each parameter before receiving a transfusion were carried forward through the endpoint,” could potentially bias the findings. Hence, we judged the risk of attrition bias for this trial to be high. Overall, the risk of attrition bias was low in the included studies.
Selective reporting
We assessed included studies for completeness of reporting for both benefits as well as treatment‐related harms associated with 'ESAs plus iron' versus 'ESAs alone' groups. All included studies reported the benefits and harms of the interventions in the way specified in the methods section of trial publications. It is important to note that we did not have access to trial protocols, and hence could not assess the trial publications for selective reporting of outcomes. Overall, the risk of reporting bias was low in the included studies.
Other potential sources of bias
Two trials were published as abstracts and had insufficient information for us to assess whether an important risk of bias existed (Beguin 2008; Bellet 2007). Each of the remaining trials had evidence of low risk of bias with respect to other potential sources of bias. For example, prespecified sample size, alpha error, beta error (power), and delta, or both, were reported. In the trial by Auerbach et al, we noted that data on alpha, beta errors, sample size calculation and delta were not reported. Moreover, the authors stated in the methods section that "patients could receive oral iron if they were not randomized to IV iron supplementation." However, the authors did not report the number of participants in the 'ESAs only arm' who (may have) received oral iron supplementation (Auerbach 2010). Overall, the risk of other bias was low in the included studies.
Effects of interventions
The meta‐analysis included 1008 participants in the ESAs plus iron group and 704 participants in the ESAs alone group from seven studies (11 comparisons). The study by Bellet et al was published as an abstract, and the data were not reported in a manner useful for meta‐analysis (Bellet 2007).
Benefits of iron supplementation
Overall survival
None of the included RCTs reported data on overall survival. We were thus unable to perform meta‐analysis on this outcome. Only Auerbach et al acknowledged that their study was not designed both in follow‐up duration and power to detect survival benefit (Auerbach 2004a).
Hematopoietic response
We extracted data from seven studies (11 comparisons; 1712 participants). Hematopoietic response rate was statistically significantly superior in participants receiving iron supplementation to ESAs than participants receiving ESAs alone in the management of CIA (risk ratio (RR) 1.17, 95% confidence interval (CI) 1.09 to 1.26; P < 0.0001) (Analysis 1.1). There was no heterogeneity among these trials (I² = 15%, P = 0.30).
RBC transfusions
We extracted data from seven studies (11 comparisons; 1719 participants). Significantly fewer participants treated with iron supplementation to ESAs required RBC transfusions compared to participants treated with ESAs alone (RR 0.74, 95% CI 0.60 to 0.92; P = 0.007) (Analysis 1.2). There was no heterogeneity among these trials (I² = 0%, P = 0.90).
Median time to hematopoietic response
We extracted data from five studies (seven comparisons; 1042 participants). We found no differences in the median time to hematopoietic response between participants receiving iron supplementation to ESAs versus those who received ESAs alone (HR 0.93, 95% CI 0.67 to 1.28; P = 0.65) (Analysis 1.3). There was considerable heterogeneity among these trials (I² = 86%, P < 0.00001).
Mean change in Hb level
We extracted data from three studies (seven comparisons; 827 participants). Hb level was statistically significantly superior in participants receiving iron supplementation to ESAs than in participants receiving ESAs alone in the management of CIA (mean difference (MD) 0.48, 95% CI 0.10 to 0.86; P = 0.01) (Analysis 1.4). There was substantial heterogeneity among these trials (I² = 69%, P = 0.003).
Quality of life
Quality of life data were extractable from three studies (four comparisons; 1124 participants). We found no differences in terms of quality of life between participants receiving iron supplementation to ESAs versus those who received ESAs alone (standardized mean difference (SMD) 0.01, 95% CI ‐0.10 to 0.12; P = 0.88) (Analysis 1.5). There was no heterogeneity among these trials (I² = 0%, P = 0.54).
Adverse events
Three studies reported data on thromboembolic events. Other adverse events cited in the studies included nausea, vomiting, asthenia, dyspnea, diarrhea, leukopenia, and constipation; see Table 1 for details regarding adverse events reported by each study. However, data on these adverse events were reported mostly for the participants enrolled in the intervention arm only, and hence were inadequate for meta‐analysis. Moreover, in most of the included studies adverse events were not reported as events per participant, and thus were not useful for meta‐analysis.
| Study ID | Morbidities | Rx group 1 N (%) | Rx group 2 N (%) | Rx group 3 N (%) | Treatment‐related mortality |
| Auerbach 2004 | Participants with any AEs
| ESAs + TDI iron N = 41 | ESAs + bolus iron N = 37 | ESAs + oral iron N = 43 | Zero events |
| 3 (7) | 3 (8) | 1 (2) | |||
| Auerbach 2010 | ‐ | ‐ | ESAs + IV iron N = 117 | ESAs alone N = 121 | Zero events |
| Participants with any AEs | ‐ | 104 (89) | 110 (91) | ||
| Participants with serious AEs | ‐ | 41 (35) | 45 (37) | ||
| Participants with treatment‐related AEs | ‐ | 14 (12) | 0 (0) | ||
| Participants with serious treatment‐related AEs | ‐ | 3 (3)a | 0 (0) | ||
| Participants with AEs leading to study discontinuation | ‐ | 12 (10) | 14 (12) | ||
| Cardiovascular and thromboembolic events | ‐ | 18 (15) | 19 (16) | ||
| Embolism/thrombosis | ‐ | 8 (7) | 10 (8) | ||
| Arrhythmias | ‐ | 9 (8) | 7 (6) | ||
| Congestive heart failure | ‐ | 3 (3) | 1 (1) | ||
| Myocardial infarction/artery disorders | ‐ | 2 (2) | 2 (2) | ||
| Cerebrovascular accident | ‐ | 1 (1) | 0 (0) | ||
| Deaths on study (any reason)b | ‐ | 8 (7) | 13 (11) | ||
| Bastit 2008 | ‐ | ‐ | ESAs + IV iron N = 203 | ESAs alone N = 193 | Not reported |
| No. of participants reporting specific AEs | ‐ | 21 (10) | 26 (13) | ||
| Embolism/thrombosis, arterial and venous | ‐ | 12 (6) | 12 (6) | ||
| Myocardial infarction, ischemic and coronary artery disease | ‐ | 3 (1) | 1 (1) | ||
| Hypertension | ‐ | 2 (1) | 5 (3) | ||
| Congestive heart failure | ‐ | 1 (0) | 3 (2) | ||
| Cerebrovascular accident | ‐ | 0 (0) | 0 (0) | ||
| Deaths on study (any reason) | ‐ | 21 (10) | 15 (8) | ||
| Beguin 2008 | Data are not reported. Authors state that there was no difference in rates of thromboembolic events or other complications among the groups | Not reported | |||
| Bellet 2007 | A total of 375 participants were enrolled in this phase III RCT. However, the number of participants randomized to each study arm is not reported. Three serious but non‐life‐threatening iron sucrose‐related AEs were observed, including 1 case of significant, transient hypotension in a female weighing 50 kg | ‐ | IV iron + ESAs | ESAs alone | Not reported |
| Henry 2007c,d | ‐ | ‐ | ESAs + IV iron N = 63 | ESAs + oral iron N = 61 | Not reported |
| Constipation | ‐ | 2 (3.2) | 11 (18) | ||
| Nausea | ‐ | 2 (3.2) | 3 (4.9) | ||
| Dyspepsia | ‐ | 1 (1.6) | 3 (4.9) | ||
| Asthenia | ‐ | 1 (1.6) | 2 (3.3) | ||
| Anorexia | ‐ | 0 | 2 (3.3) | ||
| Abdominal pain | ‐ | 0 | 2 (3.3) | ||
| Diarrhea | ‐ | 1 (1.6) | 0 | ||
| Hypotension | ‐ | 1 (1.6) | 0 | ||
| Vasodilation | ‐ | 1 (1.6) | 0 | ||
| Angina pectoris | ‐ | 1 (1.6) | 0 | ||
| Tremor | ‐ | 1 (1.6) | 0 | ||
| Pain at injection site | ‐ | 1 (1.6) | 0 | ||
| Vomiting | ‐ | 0 | 1 (1.6) | ||
| Back pain | ‐ | 0 | 1 (1.6) | ||
| Dehydration | ‐ | 0 | 1 (1.6) | ||
| Dizziness | ‐ | 0 | 1 (1.6) | ||
| Taste perversion | ‐ | 0 | 1 (1.6) | ||
| Melena | ‐ | 0 | 1 (1.6) | ||
| Tinnitus | ‐ | 0 | 1 (1.6) | ||
| Pedrazzoli 2011e | ‐ | ‐ | ESAs + IV iron N = 73 | ESAs only N = 76 | Zero events |
| Participants with AEs | ‐ | 55 (75.3) | 49 (64.5) | ||
| Participants with serious AEs | ‐ | 8 (11) | 10 (13.2) | ||
| Participants with treatment‐related AEs | ‐ | 7 (9.6) | 6 (7.9) | ||
| Vascular/thromboembolic events | ‐ | 3 (4.1) | 2 (2.6) | ||
| Fatal AEs: all | ‐ | 4 (5.5) | 3 (3.9) | ||
| Fatal AEs: treatment related | ‐ | 0 (0) | 0 (0) | ||
| Steensma 2011f | Worst toxicity reported (toxicities were graded according to the National Cancer Institute Common Terminology Criteria of Adverse Events) | ESAs + IV iron N = 164 | ESAs + oral iron N = 162 | ESAs + placebo N = 163 | Zero events |
| None | 12 (7) | 15 (9) | 22 (13) | ||
| Mild | 28 (17) | 40 (25) | 33 (20) | ||
| Moderate | 35 (21) | 35 (22) | 33 (20) | ||
| Severe | 52 (32) | 42 (26) | 49 (30) | ||
| Life‐threatening | 29 (18) | 24 (15) | 23 (14) | ||
| Lethal (includes participants who died while on study regardless of causality) | 8 (5) | 6 (4) | 3 (2) | ||
aEpisodes of transient anaphylactoid reactions occurred in two participants soon after initiating IV iron, but these participants recovered uneventfully without hospitalization; one participant in this group had enlarged uvula, lip swelling, and dyspnea (symptoms resolved).
bDeaths on study or within 30 days after the last dose of study drug.
cParticipants may have experienced more than one AE.
dSix participants discontinued the study due to drug‐related AEs (sodium ferric gluconate complex, N = 2 (one angina, one nausea); oral iron, N = 4 (all gastrointestinal))
eSeven participants, four on DA/iron and three on DA only, died during the study or within four weeks after the last administered dose of DA. Deaths were ascribed to disease progression, two cases in each group; and respiratory complications, one in the DA‐only group (infection), two in the DA/iron group (bleeding in one, acute respiratory distress syndrome in one) not related to study drugs administration.
f7% (95% CI 3% to 12%) of participants in the IV iron arm discontinued study as a result of AEs versus 3% (95% CI 1% to 7%) for oral iron and 5% (95% CI 2% to 9%) for oral placebo. Study authors also stated that no individual AE was significantly more common in the IV iron arm compared with the other arms; instead, the overall difference was a result of small differences in several uncommon AEs, including dyspnea, back pain, and hypotension, which may have been caused by premedication rather than the IV iron product itself. Other AEs associated with IV iron in past studies, including myalgia, arthralgia, abdominal pain, pruritus, rash, nausea, vomiting, or fever, were not more common than with oral placebo or oral iron in this study.
AE = adverse event
CI = confidence interval
DA = darbepoietin
ESA = erythropoiesis‐stimulating agent
IV = intravenous
RCT = randomized controlled trial
TDI = total dose infusion
Thromboembolic events
We extracted data from three studies (three comparisons; 783 participants). The incidence of thromboembolic events in participants treated with iron supplementation to ESAs did not differ from that in participants treated with ESAs alone (RR 0.95, 95% CI 0.54 to 1.65; P = 0.85) (Analysis 1.6). There was no heterogeneity among these trials (I² = 0%, P = 0.82).
Treatment‐related mortality
Four studies reported data on treatment‐related mortality (six comparisons; 997 participants). The incidence of treatment‐related mortality was zero in these four studies. Hence, we were not able to conduct meta‐analysis of these data.
Subgroup analyses
Hematopoietic response
-
Route of iron administration: RCTs in which IV iron was used showed statistically significant evidence for a difference with iron supplementation versus ESAs alone (RR 1.20, 95% CI 1.10 to 1.31; P < 0.00001) compared with oral iron supplementation (RR 1.04, 95% CI 0.87 to 1.24; P = 0.68) for the outcome of hematopoietic response. However, the difference between the subgroups was not statistically significant (test of interaction: P = 0.16) (Analysis 2.2).
-
Type of iron: RCTs in which dextran (RR 1.76, 95% CI 1.01 to 3.09; P = 0.05), gluconate (RR 1.17, 95% CI 1.08 to 1.27; P = 0.0002) were used showed statistically significant evidence for a difference with iron supplementation versus ESAs alone compared with RCTs in which sucrose iron (RR 1.14, 95% CI 0.97 to 1.33; P = 0.10) and sulfate iron was used (RR 1.04, 95% CI 0.87 to 1.24; P = 0.68) for the outcome of hematopoietic response. However, the difference between the subgroups was not statistically significant (test of interaction: P = 0.31) (Analysis 2.1).
-
Total iron dose: We investigated whether the total iron dose as a covariate contributed to the increase in hematopoietic response (on the log scale) for oral and IV iron combined and IV iron alone. For oral and IV iron combined, meta‐regression showed that hematopoietic response increased by 108% per 1000 unit increase in iron dosage (RR 2.08, 95% CI 0.98 to 4.39; P = 0.055) given on the log scale. The iron dosage explained 9.6% of between‐study variance in both Knapp‐Hartung modified and unmodified analyses. Both the Knapp‐Hartung modified analysis (RR 2.08, 95% CI 0.98 to 4.39; P = 0.055) and Knapp‐Hartung unmodified analysis (RR 2.08, 95% CI 1.18 to 3.67; P = 0.012) produced similar results. Meta‐regression results indicated that the beneficial effect of iron on hematopoietic response may not be a function of dose of iron. For IV iron alone, meta‐regression showed that hematopoietic response increased by 168% per 1000 unit increase in iron dosage (RR 2.50, 95% CI 1.03 to 6.06; P = 0.0045) given on the log scale (Figure 3). The IV iron dosage explained 30.8% of between‐study variance in both Knapp‐Hartung modified and unmodified analyses. Both the Knapp‐Hartung modified analysis (RR 2.50, 95% CI 1.03 to 6.06; P = 0.045) and Knapp‐Hartung unmodified analysis (RR 2.50, 95% CI 1.27 to 4.90; P = 0.008) produced similar results. Meta‐regression results indicated that the beneficial effect of IV iron on hematopoietic response may not be a function of dose of iron.
-
Type of ESA: The hematopoietic response estimates for iron supplementation to ESAs versus ESAs alone did not statistically significantly differ based on type of ESA (Analysis 2.3).

Meta‐regression: total IV iron dose and hematopoietic response
Median time to hematopoietic response
-
Route of iron administration: RCTs in which IV iron (hazard ratio (HR) 0.88, 95% CI 0.60 to 1.29; P = 0.52) and oral iron (HR 1.24, 95% CI 0.99 to 1.56; P = 0.06) were used showed no evidence for difference between iron supplementation to ESAs over ESAs alone for the outcome of median time to hematopoietic response (Analysis 2.4). However, we noted that the pooled point estimate for trials using IV iron for this outcome was in favor of ESAs plus iron compared with pooled point estimate of trials using oral iron (test of interaction: P = 0.13).
-
Type of iron: RCTs in which dextran (HR 0.95, 95% CI 0.36 to 2.52; P = 0.92), sucrose iron (HR 1.15, 95% CI 0.60 to 2.21; P = 0.67), and sulfate iron (HR 1.24, 95% CI 0.99 to 1.56; P = 0.06) were used showed no evidence for difference between iron supplementation to ESAs over ESAs alone compared with RCTs in which gluconate (HR 0.78, 95% CI 0.65 to 0.94; P = 0.010) was used for the outcome of median time to hematopoietic response (test of interaction: P = 0.02) (Analysis 2.5).
-
Type of ESA: The hematopoietic response estimates for iron supplementation to ESAs versus ESAs alone did not statistically significantly differ based on type of ESA (Analysis 2.6).
Mean change in Hb level
-
Route of iron administration: RCTs in which IV iron was used showed statistically significant evidence for a difference with iron supplementation to ESAs versus ESAs alone (MD 0.84, 95% CI 0.21 to 1.46; P = 0.009) compared with oral iron supplementation (MD 0.07, 95% CI ‐0.19 to 0.34; P = 0.59) for the outcome of mean change in Hb level (test of interaction: P = 0.03) (Analysis 2.7).
-
Type of iron: RCTs in which dextran (MD 1.55, 95% CI 0.62 to 2.47; P = 0.001) was used showed evidence for a difference with iron supplementation to ESAs versus ESAs alone compared with RCTs in which gluconate (MD 0.54, 95% CI ‐0.15 to 1.22; P = 0.12) and sulfate iron (MD 0.07, 95% CI ‐0.19 to 0.34; P = 0.59) was used for the outcome of mean change in Hb level (test of interaction: P = 0.007) (Analysis 2.8).
-
Type of ESA: RCTs in which epoetin was used showed statistically significant evidence for a difference with iron supplementation to ESAs versus ESAs alone (MD 0.77, 95% CI 0.25 to 1.29; P = 0.004) compared with darbepoetin use (MD 0.10, 95% CI ‐0.13 to 0.33; P = 0.38) for the outcome of mean change in Hb level (test of interaction: P = 0.02) (Analysis 2.9).
We also attempted to conduct subgroup analyses based on cancer type, cancer stage, duration of follow‐up, type of chemotherapy, and study setting (single‐ versus multicenter study). However, data were not extractable for these outcomes (see below) to facilitate meta analysis.
-
Cancer type: Three studies explicitly reported cancer type. However, data were not extractable to facilitate meta‐analysis; that is Henry et al reported the number of participants with adenocarcinoma, squamous cell carcinoma, and other histology (Henry 2007a), whereas Steensma et al reported tumor types including hematologic neoplasm, solid tumor, or both (Steensma 2011a). Auerbach et al reported that participants had a histologic diagnosis of cancer but did not specify the type of cancer (Auerbach 2004a).
-
Cancer stage: Two studies reported data on cancer stage. However, data were not extractable for meta‐analysis; that is Henry et al reported number of participants with stage I, II, III, IV, or others (Henry 2007a), whereas Pedrazzoli et al reported the combined number of participants with cancer stages I/II/III (Pedrazzoli 2008).
-
Duration of follow‐up: Three studies reported data on duration of follow‐up (Auerbach 2004a; Henry 2007a; Pedrazzoli 2008). However, data were not extractable for meta‐analysis.
-
Type of chemotherapy: Only one study reported data on type of chemotherapy (Bastit 2008), thus meta‐analysis was not possible.
-
Single‐ versus multicenter study: All the included studies were multicenter, thus a subgroup analysis was not possible.
Sensitivity analysis according to methodological quality of reporting
We conducted sensitivity analyses according to each risk of bias domain for all outcomes. The results did not change for any outcome. We have presented the sensitivity analyses for the outcome of hematopoietic response for illustration purpose (Analysis 3.1; Analysis 3.2; Analysis 3.3; Analysis 3.4; Analysis 3.5; Analysis 3.6).
Sensitivity analysis according to definition(s) of Hb increase
We conducted sensitivity analyses according to definition(s) of Hb increase for all outcomes. The majority of the included studies defined Hb increase as hematopoietic response (increasing Hb by 2 g/dL from baseline or increase to Hb 12 g/dL without transfusion) (Auerbach 2004a; Auerbach 2010; Bastit 2008; Bellet 2007; Pedrazzoli 2008; Steensma 2011a; Steensma 2011b). The study by Beguin et al reported number of complete correctors (that is participants reaching Hb > 13 g/dL) before day 126 in each arm in the study (Beguin 2008). The study by Henry et al employed increasing Hb by 2 g/dL from baseline (hematologic response) as the outcome (Henry 2007a). We conducted sensitivity analyses according to the definition(s) of Hb increase for all outcomes. The results did not change for any outcome. We have presented the sensitivity analyses for the outcome of hematopoietic response for illustration purpose (Analysis 3.7).
Sensitivity analysis according to the baseline serum ferritin, TSAT, and Hb for hematopoietic response
Meta‐regression showed that hematopoietic response decreased by 0.2% per one unit increase in mean baseline serum ferritin level (RR 0.998, 95% CI 0.997 to 0.999; P = 0.009). The mean baseline serum ferritin level explained 75.8% of between‐study variance for the outcome of hematopoietic response in both Knapp‐Hartung modified and unmodified analyses (Figure 4). The adjusted R² was negative for the mean baseline TSAT (R² = ‐128.5%) but positive for Hb values (R² = 56.7%), indicating that TSAT explained little between‐study variance in hematopoietic response, and Hb level did.

Meta‐regression: baseline serum ferritin and hematopoietic response.
Meta‐analysis allowing for missing data
We conducted meta‐analyses using the metamiss command in the STATA software for the outcomes of hematopoietic response and RBC transfusion. Specifically, we employed the available case and imputed case analyses (impute as failure: ICA‐0; impute as success: ICA‐1; best‐case: ICA‐b (missing=success in E, failure in C) and worst‐case: ICA‐w). The results did not change for any analysis for both the outcomes.
Post‐hoc analyses
Effect of iron supplementation on mean change in serum ferritin level
We extracted data from four studies (six comparisons; 1010 participants). Serum ferritin levels were statistically significantly superior in participants receiving iron supplementation to ESAs than in participants receiving ESAs alone in the management of CIA (MD 253.02, 95% CI 84.30 to 421.73; P = 0.003) (Analysis 1.7). There was considerable heterogeneity among these trials (I² = 90%, P < 0.00001).
RCTs in which IV iron was used showed evidence for a difference with iron supplementation to ESAs versus ESAs alone compared with oral iron supplementation for the outcome of mean change in serum ferritin level (test of interaction: P = 0.00005) (Analysis 2.10). RCTs in which dextran and gluconate were used showed evidence for a difference with iron supplementation to ESAs versus ESAs alone compared with RCTs in which sulfate and sucrose were used (test of interaction: P < 0.00001) (Analysis 2.11). The mean change in serum ferritin estimates for iron supplementation to ESAs versus ESAs alone did not statistically significantly differ based on type of ESAs (test of interaction: P = 0.95) (Analysis 2.12).
Effect of iron supplementation on mean change in TSAT level
We extracted data from three studies (five comparisons; 908 participants). TSAT levels were statistically significantly superior in participants receiving iron supplementation to ESAs than in participants receiving ESAs alone in the management of CIA (MD 4.96, 95% CI 0.94 to 8.99; P = 0.02) (Analysis 1.8). There was substantial heterogeneity among these trials (I² = 62%, P = 0.03).
The mean change in TSAT estimates for iron supplementation to ESAs versus ESAs alone did not statistically significantly differ based on route of iron administration (test of interaction: P = 0.86) (Analysis 2.13). Similarly, mean change in TSAT estimates for iron supplementation to ESAs versus ESAs alone did not statistically significantly differ based on type of iron (test of interaction: P = 0.93) (Analysis 2.14). RCTs in which epoetin was used showed evidence for a difference with iron supplementation to ESAs versus ESAs alone compared with RCTs in which darbepoetin was used for the outcome of mean change in TSAT level (test of interaction: P = 0.04) (Analysis 2.15).
Discussion
Summary of main results
This systematic review included eight RCTs funded by industry. None of the included studies reported data on overall survival. The results of this meta‐analysis show benefit of iron supplementation to ESAs for achieving hematopoietic response and reducing number of RBC transfusions in people with CIA. In absolute terms, assuming a baseline risk of 35% to 80% for hematopoietic response without treatment, between seven and 16 CIA patients should be treated to achieve hematopoietic response in one patient. Similarly, assuming a baseline risk of 7% to 40% for RBC transfusion without treatment, between 10 and 57 CIA patients should be treated to avoid RBC transfusion in one patient. Our results indicated no evidence of a difference in the median time to hematopoietic response and quality of life between people with CIA receiving iron supplementation to ESAs versus those who received ESAs alone. We found considerable improvement in the iron metabolism parameters as indicated by the superior end of study Hb levels compared to the baseline parameters. None of the participants who received ESAs plus iron versus ESAs alone died due to treatment. However, treatment‐related mortality data were reported in only four studies. Administration of iron was well tolerated with no substantial differences in the observed thromboembolic events and other adverse events among participants receiving ESAs plus iron versus ESAs alone.
Overall completeness and applicability of evidence
This systematic review included eight trials with 12 comparisons enrolling 2087 participants. We did not identify any study comparing iron alone versus ESAs alone addressing management of people diagnosed with CIA. Two trials were published as abstracts (Beguin 2008; Bellet 2007), and data from the trial by Bellet et al were not available for meta‐analysis (Bellet 2007). The study by Bellet et al included 375 people with CIA comparing iron sucrose as a supplement to darbapoetin alfa versus ESAs alone (Bellet 2007). This study reported the change in Hb levels, other iron indices, quality of life, and adverse events, but data reported were not amenable to statistical analysis. The distribution of participants in the individual study arms in this study was not reported. The conclusions from this study were in line with the majority of included studies addressing the role of IV iron in the management of CIA; that is in this study IV iron sucrose increased Hb levels and iron stores significantly and was well tolerated in doses up to 500 mg increments in people with CIA treated with ESAs. The studies identified and included in this systematic review in totality sufficiently address the role of iron in the management of people diagnosed with CIA. Overall, the findings of this systematic review have direct application to clinical practice for people diagnosed with CIA. We noticed that the included studies had shorter follow‐up duration (up to 20 weeks), and long‐term effects of iron supplementation are unknown. Specifically, with the known increased risks of ESA treatments (Bohlius 2009; Bohlius 2014; Tonia 2012), further studies addressing the long‐term effects of iron supplementation on morbidity and mortality (among patients receiving not only iron but RBCs as well, as they also contain iron) due to higher iron or ferritin levels are needed.
Quality of the evidence
We assessed the quality of the included trials according to the previously described quality domains; these are represented in Figure 2. The majority of included trials were free of selection bias, selective reporting, and other biases. The majority of the included studies reported analyses according to the principle of intention‐to‐treat, but most of the included studies were open label and had high risk of performance and detection bias.
None of the included RCTs reported data on overall survival, and hence we were not able to perform meta‐analysis on this outcome. Auerbach et al acknowledged that their study was not designed both in follow‐up duration and power to detect survival benefit (Auerbach 2004a). The overall quality of evidence for hematopoietic response was high. The route of iron administration (oral versus IV) explained the observed heterogeneity. The overall quality of evidence for RBC transfusion requirement was moderate, as the pooled estimates had wide confidence intervals. Two studies did not separately report the number RBC transfusions, but instead reported the total number of transfusions (Auerbach 2004a; Henry 2007a). Removing these studies from the meta‐analysis for the outcome of RBC transfusion requirement did not change the overall pooled estimate (favored addition of iron to ESAs). The overall quality of evidence for change in Hb level and time to hematopoietic response was low, as the pooled estimates had large variation and there was significant heterogeneity. The overall quality of evidence for quality of life was high. However, it is important to note that quality of life data were reported in four studies (Auerbach 2004a; Auerbach 2010; Bastit 2008; Steensma 2011a), but extractable from only three studies (Auerbach 2010; Bastit 2008; Steensma 2011a). In the study by Auerbach et al (Auerbach 2004a), quality of life was measured using the 100‐mm linear analog scale (LASA) of energy level, activities of daily living (ADL), and overall quality of life. Participants who received IV iron supplementation had a considerably better quality of life than those who received ESAs alone (Auerbach 2004a). However, the data were not extractable for meta‐analysis. The studies by Bastit et al, (Bastit 2008), and Auerbach et al, (Auerbach 2010), used the Functional Assessment of Cancer Therapy‐Fatigue (FACT‐F) scale, while the study by Steensma et al, (Steensma 2011a), used the Functional Assessment of Cancer Therapy‐Anemia (FACT‐An) scale for assessment of quality of life. These three studies reported data in a manner that could be used for meta‐analysis. The overall quality of evidence for risk of blood clots in veins was moderate, as the pooled estimate had wide confidence intervals. The overall quality of evidence for treatment‐related deaths was high. However, only four of eight included studies reported these data. Data were not extractable for cancer type, cancer stage, duration of follow‐up, and type of chemotherapy to facilitate planned subgroup meta‐analysis.
Potential biases in the review process
We did not find any methodological issues in the preparation of the review that could put it at risk for bias. There is potential risk of publication bias. If future updates of the review include more than 10 RCTs, we will assess the publication bias for each outcome and will include a funnel plot as per Cochrane guidelines. We were able to identify eight RCTs relevant to our review question; two of these were published as meeting abstract (Beguin 2008; Bellet 2007). We were able to extract relevant data from the study by Beguin et al, but the data reported in the study by Bellet et al were not amenable to statistical analysis. Nonetheless, the conclusions from this study were in line with the majority of included studies addressing the role of IV iron in the management of CIA (Bellet 2007). However, for reasons unknown to us, this study was not published as full manuscript, and hence we were not able to access the complete data and findings from this study. Overall, the quality of adverse event reporting was low in the included studies. Only four out of eight studies reported data on treatment‐related mortality, and the majority of studies did not report adverse events in a manner useful for meta‐analysis. Our meta‐regression analyses using baseline serum ferritin, TSAT, and Hb are based on aggregate data only and thus prone to ecological bias.
Agreements and disagreements with other studies or reviews
It is well known that approximately 50% of people diagnosed with CIA do not respond to ESAs; that is these patients do not show substantial improvement in the baseline Hb or a reduction in transfusions after a minimum of 12 weeks treatment with ESAs. People diagnosed with cancer may develop a state of iron‐restricted erythropoiesis in which the reticuloendothelial system cannot release stored iron quickly enough to permit the incorporation of iron into RBC during erythropoiesis despite what appears to be adequate iron stores. Essentially, the body is unable to use the stored iron. Other etiologies, such as hemorrhages, hemolysis, bone marrow infiltration, or nutritional deficiencies, may also contribute to anemia in people with cancer (Shord 2008). Many clinical trials have shown the beneficial effect of iron supplementation (oral and parenteral) to ESAs in the management of CIA (Auerbach 2004a; Auerbach 2010; Bastit 2008; Pedrazzoli 2008). Our results achieved by subgroup analyses suggest the superiority of parenteral iron over oral iron for the management of CIA for the outcomes of hematopoietic response and mean change in Hb level. Parenteral iron formulations may be preferred to improve adherence and avoid gastric adverse events associated with oral iron supplements. Also, IV iron can replace total iron stores within a short time frame compared with the four to six months required by oral iron supplementation. We explored which type of parenteral iron is superior in improving hematopoietic response. However, our results did not show any significant differences with iron supplementation versus ESAs alone with iron dextran, gluconate, and sucrose. It is important to note that none of the included studies assessed the timing, frequency, and amount of re‐dose after the participants received the initial cumulative iron supplementation. Hence, we were unable to comment on the re‐dosing schedule for iron supplementation to ESAs in people diagnosed with CIA.
This systematic review and meta‐analysis provides a synthesis of available clinical trial evidence on the topic of interest. The overall conclusion is in keeping with two prior meta‐analysis performed by Petrelli et al (Petrelli 2012) and Gafter‐Gvili et al (Gafter‐Gvili 2013). Our systematic review included trials comparing supplementation of iron to ESAs compared with ESAs alone. We excluded two studies that did not employ ESAs (Dangsuwan 2010 and Kim 2007), one study that assessed safety and efficacy of oral lactoferrin (Maccio 2010), and one study that did not enroll people with CIA but enrolled people suffering from anemia due to other reasons such as cancer (Hedenus 2007). The review by Petrelli et al showed that the erythropoietic response is higher when IV iron is coupled with epoetin alfa or beta compared to darbepoetin. They also state that oral iron but not parenteral formulations reduced the risk of transfusion, but only when given with epoetins, and IV iron reduced the transfusion rate only in darbepoetin‐treated participants (data were not shown in the manuscript by Petrelli et al for both of these outcomes). We found no difference in hematopoietic response based on type of ESA, and we also found no evidence of a difference in the risk of RBC transfusions based on type of ESA and route of iron administration. We noticed that the review by Petrelli et al used the per‐protocol population for the calculation of risk of transfusion for the trial by Henry et al, while the trial clearly stated that the number of transfusions was based on the enrolled 187 participants, which we have employed. Moreover, the review by Petrelli et al did not include the trial by Beguin et al, which we have included in this systematic review and reported data on hematopoietic response and RBC transfusions. However, even after the removal of the trial by Beguin et al, we could not replicate the findings by Petrelli et al. The review by Gafter‐Gvili et al conducted meta‐regression and concluded that there was no association between baseline ferritin and TSAT and hematopoietic response. We reviewed these findings and noticed that Gafter‐Gvili et al may have used inaccurate estimates of the baseline TSAT and serum ferritin parameters. The TSAT and serum ferritin data reported by Gafter‐Gvili et al do not match the data reported in original publications by Auerbach 2004 and Auerbach 2010 (Auerbach 2004a; Auerbach 2004b; Auerbach 2004c; Auerbach 2010). Our results show the potential association between baseline serum ferritin and hematopoietic response.

Study flow diagram.

Risk of bias summary: Review authors' judgments about risk of bias in each included study.
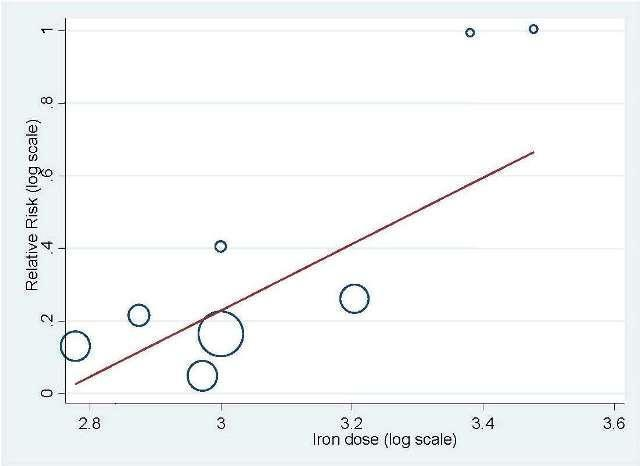
Meta‐regression: total IV iron dose and hematopoietic response

Meta‐regression: baseline serum ferritin and hematopoietic response.
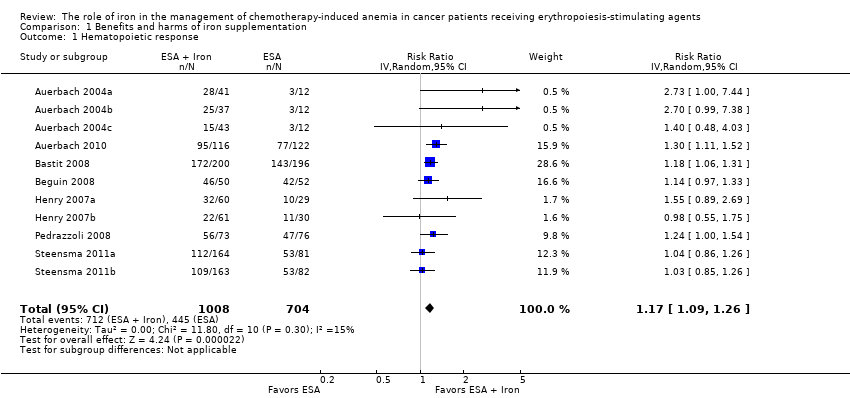
Comparison 1 Benefits and harms of iron supplementation, Outcome 1 Hematopoietic response.
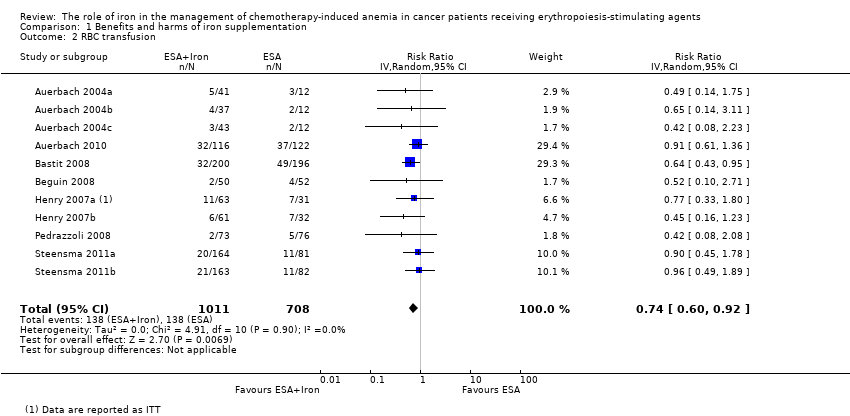
Comparison 1 Benefits and harms of iron supplementation, Outcome 2 RBC transfusion.

Comparison 1 Benefits and harms of iron supplementation, Outcome 3 Time to hematopoietic response.
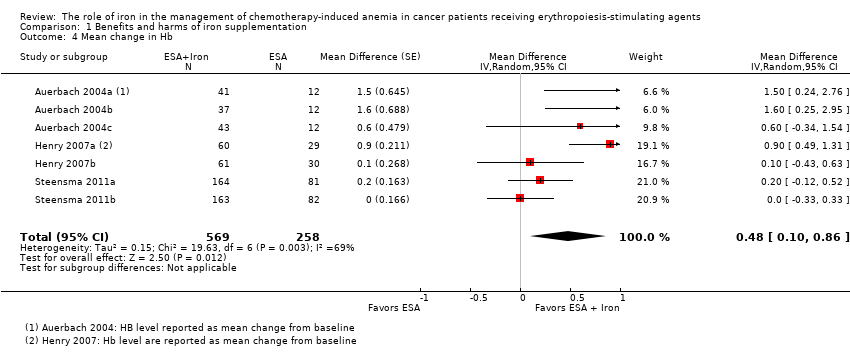
Comparison 1 Benefits and harms of iron supplementation, Outcome 4 Mean change in Hb.

Comparison 1 Benefits and harms of iron supplementation, Outcome 5 Quality of life.

Comparison 1 Benefits and harms of iron supplementation, Outcome 6 Thromboembolic events.

Comparison 1 Benefits and harms of iron supplementation, Outcome 7 Mean change in serum ferritin.
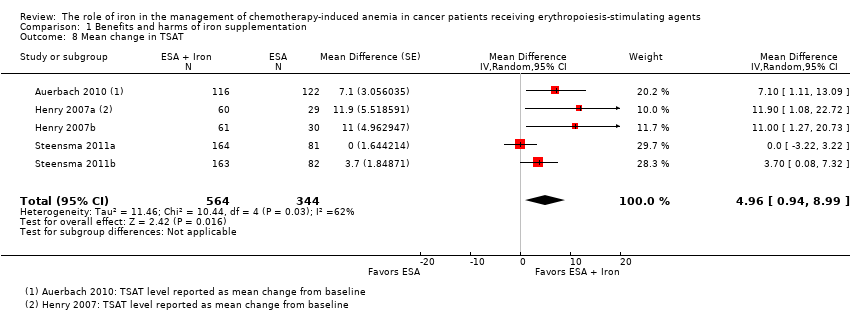
Comparison 1 Benefits and harms of iron supplementation, Outcome 8 Mean change in TSAT.
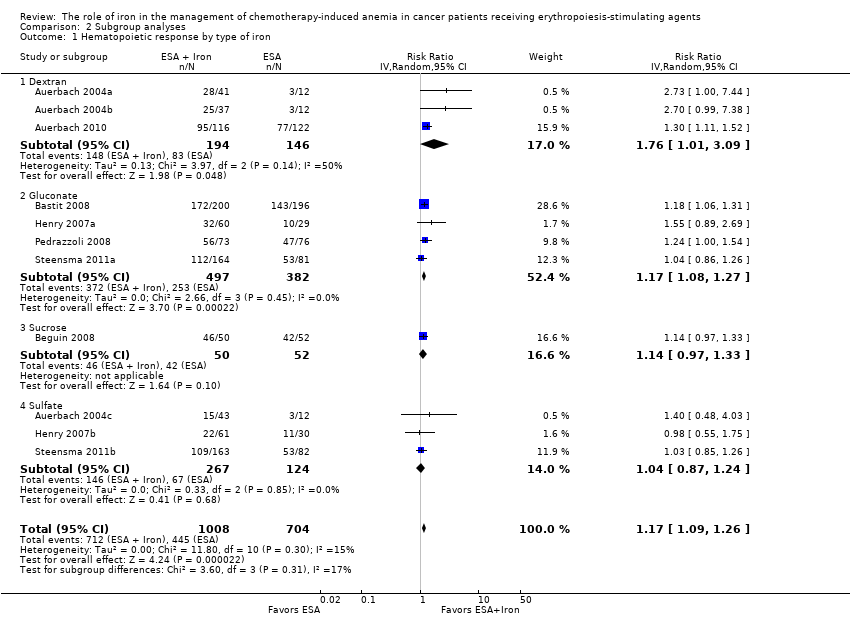
Comparison 2 Subgroup analyses, Outcome 1 Hematopoietic response by type of iron.

Comparison 2 Subgroup analyses, Outcome 2 Hematopoietic response by route of administration.

Comparison 2 Subgroup analyses, Outcome 3 Hematopoietic response by type of ESA.

Comparison 2 Subgroup analyses, Outcome 4 Time to hematopoietic response by route of administration.
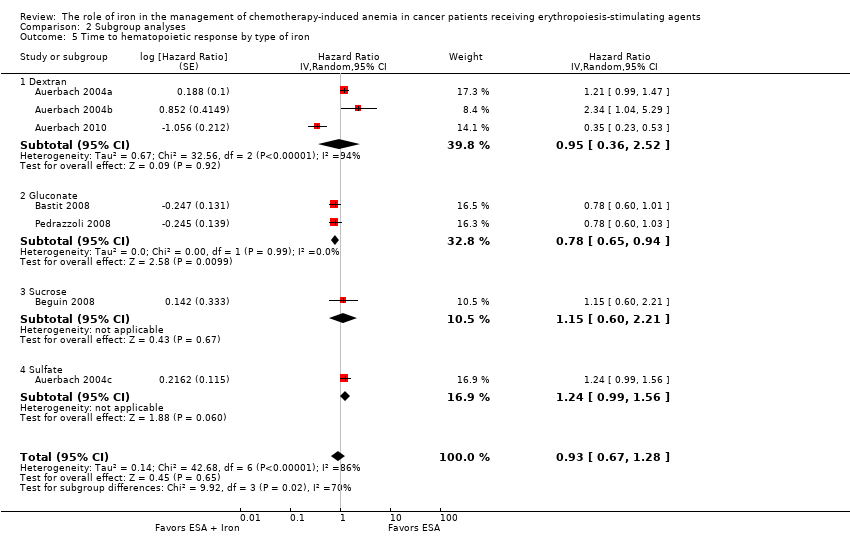
Comparison 2 Subgroup analyses, Outcome 5 Time to hematopoietic response by type of iron.

Comparison 2 Subgroup analyses, Outcome 6 Time to hematopoietic response by type of ESA.

Comparison 2 Subgroup analyses, Outcome 7 Mean change in Hb by route of administration.

Comparison 2 Subgroup analyses, Outcome 8 Mean change in Hb by type of iron.

Comparison 2 Subgroup analyses, Outcome 9 Mean change in Hb by type of ESA.

Comparison 2 Subgroup analyses, Outcome 10 Mean change in serum ferritin by route of administration.
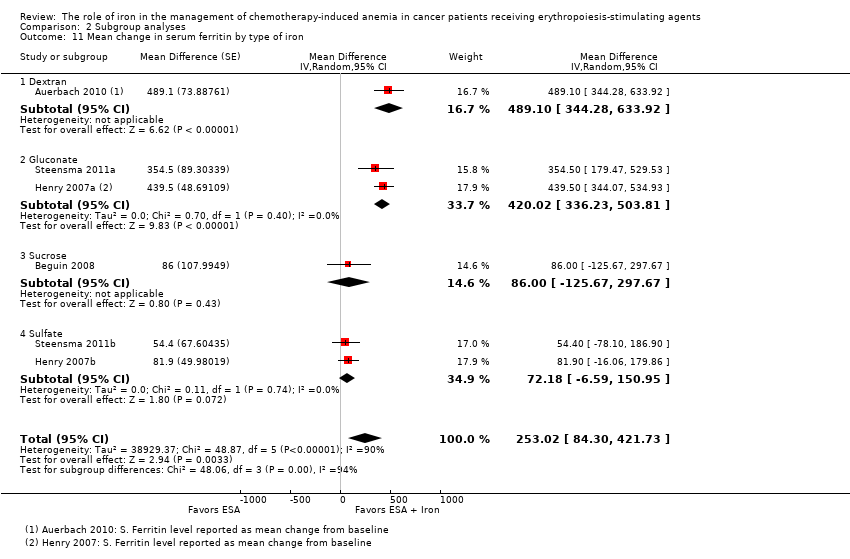
Comparison 2 Subgroup analyses, Outcome 11 Mean change in serum ferritin by type of iron.

Comparison 2 Subgroup analyses, Outcome 12 Mean change in serum ferritin by type of ESA.

Comparison 2 Subgroup analyses, Outcome 13 Mean change in TSAT by route of administration.
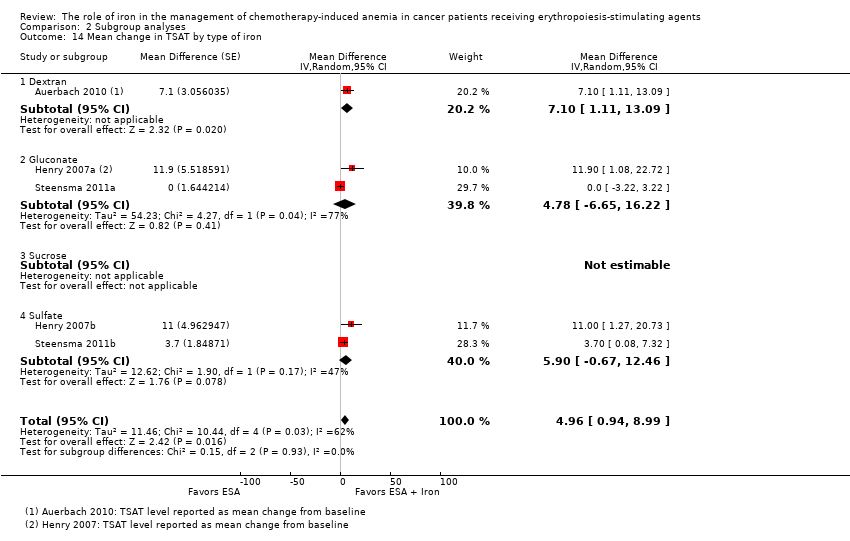
Comparison 2 Subgroup analyses, Outcome 14 Mean change in TSAT by type of iron.

Comparison 2 Subgroup analyses, Outcome 15 Mean change in TSAT by type of ESA.

Comparison 3 Sensitivity analyses, Outcome 1 Random sequence generation.

Comparison 3 Sensitivity analyses, Outcome 2 Allocation concealment.

Comparison 3 Sensitivity analyses, Outcome 3 Blinding.
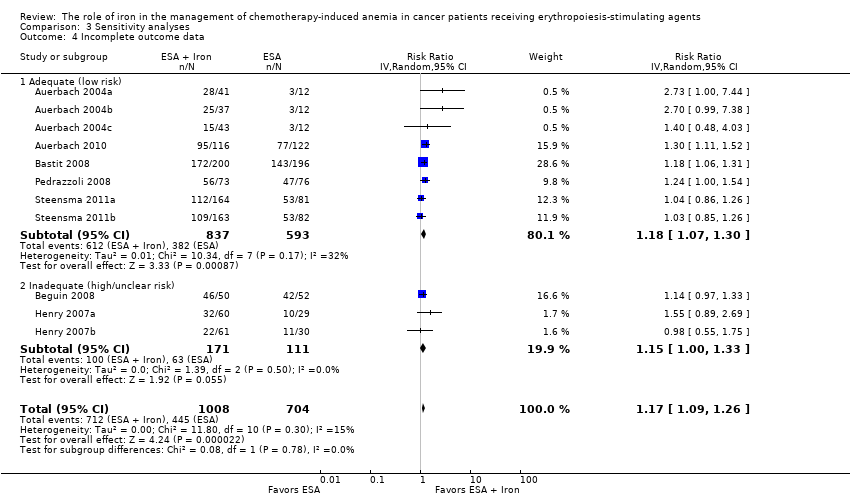
Comparison 3 Sensitivity analyses, Outcome 4 Incomplete outcome data.
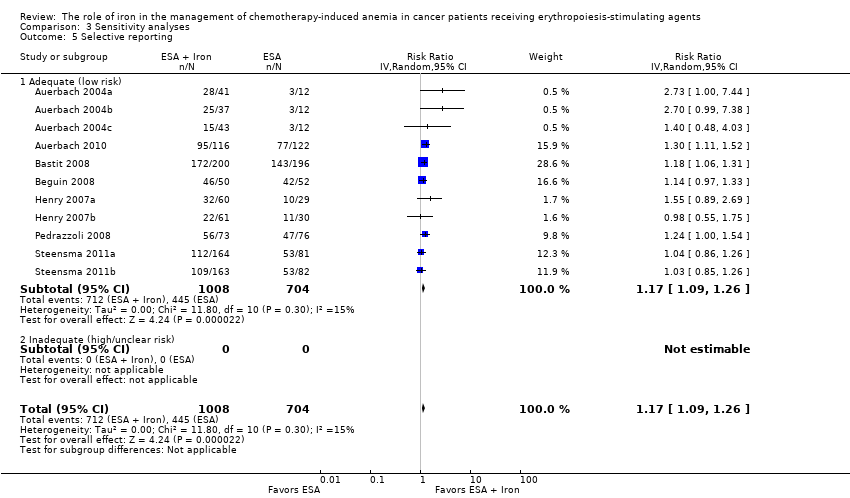
Comparison 3 Sensitivity analyses, Outcome 5 Selective reporting.
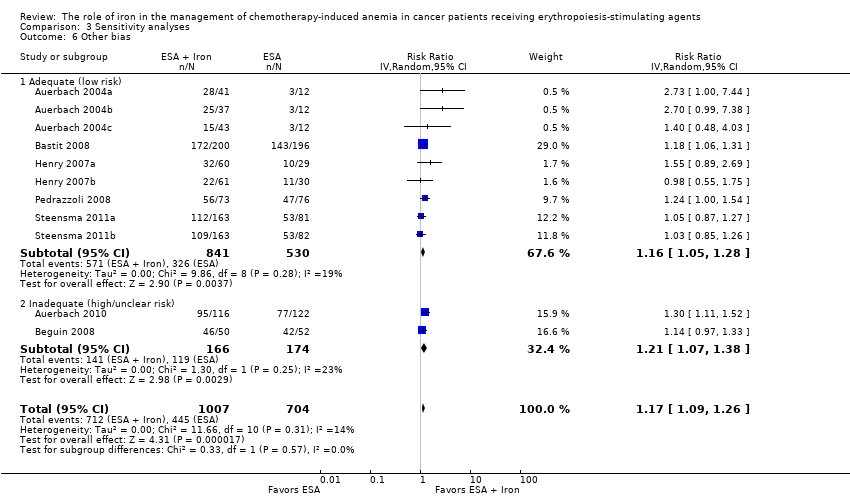
Comparison 3 Sensitivity analyses, Outcome 6 Other bias.

Comparison 3 Sensitivity analyses, Outcome 7 Hematopoietic response by definition(s).
| Benefits and harms of iron supplementation for chemotherapy‐induced anemia | |||||
| Patient or population: people diagnosed with chemotherapy‐induced anemia Comparison: erythropoiesis‐stimulating agents alone | |||||
| Outcomes | Illustrative comparative risks* (95% CI) | Relative effect | No of Participants | Quality of the evidence | |
| Assumed risk | Corresponding risk | ||||
| Control | Benefits and harms of iron supplementation | ||||
| Overall survival | None of the included studies reported data on overall survival | ||||
| Hematopoietic response | Study population | RR 1.17 | 1712 (7 studies, 11 comparisons) | ⊕⊕⊕⊕ | |
| 632 per 1000 | 740 per 1000 | ||||
| Moderate## | |||||
| 574 per 1000 | 672 per 1000 | ||||
| Red blood cell transfusion | Study population | RR 0.74 | 1719 (7 studies, 11 comparisons) | ⊕⊕⊕⊝ | |
| 195 per 1000 | 144 per 1000 | ||||
| Moderate## | |||||
| 167 per 1000 | 124 per 1000 | ||||
| Median time to hematopoietic response | Not applicable# | HR 0.93 (0.67 to 1.28) | 1042 (5 studies, 7 comparisons) | ⊕⊕⊝⊝ low1,2 | |
| Mean change in hemoglobin (better indicated by higher values) | The mean change in hemoglobin in the intervention groups was 0.48 higher | MD 0.48 (0.10 to 0.86) | 827 (3 studies, 7 comparisons) | ⊕⊕⊝⊝ | |
| Quality of life (better indicated by higher values) | The mean quality of life in the intervention groups was | SMD 0.01 (‐0.10 to 0.12) | 1124 (3 studies, 4 comparisons) | ⊕⊕⊕⊕ | |
| Thromboembolic events | Study population | RR 0.95 | 783 (3 studies) | ⊕⊕⊕⊝ | |
| 62 per 1000 | 58 per 1000 | ||||
| Moderate## | |||||
| 62 per 1000 | 59 per 1000 | ||||
| Treatment‐related mortality | Not applicable** | Zero events** | 997 (4 studies, 6 comparisons) | ⊕⊕⊕⊕ | |
| *The basis for the assumed risk (e.g. the median control group risk across studies) is provided in footnotes. The corresponding risk (and its 95% confidence interval) is based on the assumed risk in the comparison group and the relative effect of the intervention (and its 95% CI). | |||||
| GRADE Working Group grades of evidence | |||||
| 1Downgraded the quality of evidence by one level due to imprecision (the pooled estimate had wider confidence intervals). **Due to zero events we were not able to conduct meta‐analysis of these data. #Data were available as median and range, and hence were converted to log hazard ratio using the cumulative hazard log‐log transform method. ##The moderate control risk was calculated via GRADEpro software based on clinical experience of the review authors working in the field of hematological disorders. | |||||
| Study ID | Morbidities | Rx group 1 N (%) | Rx group 2 N (%) | Rx group 3 N (%) | Treatment‐related mortality |
| Auerbach 2004 | Participants with any AEs
| ESAs + TDI iron N = 41 | ESAs + bolus iron N = 37 | ESAs + oral iron N = 43 | Zero events |
| 3 (7) | 3 (8) | 1 (2) | |||
| Auerbach 2010 | ‐ | ‐ | ESAs + IV iron N = 117 | ESAs alone N = 121 | Zero events |
| Participants with any AEs | ‐ | 104 (89) | 110 (91) | ||
| Participants with serious AEs | ‐ | 41 (35) | 45 (37) | ||
| Participants with treatment‐related AEs | ‐ | 14 (12) | 0 (0) | ||
| Participants with serious treatment‐related AEs | ‐ | 3 (3)a | 0 (0) | ||
| Participants with AEs leading to study discontinuation | ‐ | 12 (10) | 14 (12) | ||
| Cardiovascular and thromboembolic events | ‐ | 18 (15) | 19 (16) | ||
| Embolism/thrombosis | ‐ | 8 (7) | 10 (8) | ||
| Arrhythmias | ‐ | 9 (8) | 7 (6) | ||
| Congestive heart failure | ‐ | 3 (3) | 1 (1) | ||
| Myocardial infarction/artery disorders | ‐ | 2 (2) | 2 (2) | ||
| Cerebrovascular accident | ‐ | 1 (1) | 0 (0) | ||
| Deaths on study (any reason)b | ‐ | 8 (7) | 13 (11) | ||
| Bastit 2008 | ‐ | ‐ | ESAs + IV iron N = 203 | ESAs alone N = 193 | Not reported |
| No. of participants reporting specific AEs | ‐ | 21 (10) | 26 (13) | ||
| Embolism/thrombosis, arterial and venous | ‐ | 12 (6) | 12 (6) | ||
| Myocardial infarction, ischemic and coronary artery disease | ‐ | 3 (1) | 1 (1) | ||
| Hypertension | ‐ | 2 (1) | 5 (3) | ||
| Congestive heart failure | ‐ | 1 (0) | 3 (2) | ||
| Cerebrovascular accident | ‐ | 0 (0) | 0 (0) | ||
| Deaths on study (any reason) | ‐ | 21 (10) | 15 (8) | ||
| Beguin 2008 | Data are not reported. Authors state that there was no difference in rates of thromboembolic events or other complications among the groups | Not reported | |||
| Bellet 2007 | A total of 375 participants were enrolled in this phase III RCT. However, the number of participants randomized to each study arm is not reported. Three serious but non‐life‐threatening iron sucrose‐related AEs were observed, including 1 case of significant, transient hypotension in a female weighing 50 kg | ‐ | IV iron + ESAs | ESAs alone | Not reported |
| Henry 2007c,d | ‐ | ‐ | ESAs + IV iron N = 63 | ESAs + oral iron N = 61 | Not reported |
| Constipation | ‐ | 2 (3.2) | 11 (18) | ||
| Nausea | ‐ | 2 (3.2) | 3 (4.9) | ||
| Dyspepsia | ‐ | 1 (1.6) | 3 (4.9) | ||
| Asthenia | ‐ | 1 (1.6) | 2 (3.3) | ||
| Anorexia | ‐ | 0 | 2 (3.3) | ||
| Abdominal pain | ‐ | 0 | 2 (3.3) | ||
| Diarrhea | ‐ | 1 (1.6) | 0 | ||
| Hypotension | ‐ | 1 (1.6) | 0 | ||
| Vasodilation | ‐ | 1 (1.6) | 0 | ||
| Angina pectoris | ‐ | 1 (1.6) | 0 | ||
| Tremor | ‐ | 1 (1.6) | 0 | ||
| Pain at injection site | ‐ | 1 (1.6) | 0 | ||
| Vomiting | ‐ | 0 | 1 (1.6) | ||
| Back pain | ‐ | 0 | 1 (1.6) | ||
| Dehydration | ‐ | 0 | 1 (1.6) | ||
| Dizziness | ‐ | 0 | 1 (1.6) | ||
| Taste perversion | ‐ | 0 | 1 (1.6) | ||
| Melena | ‐ | 0 | 1 (1.6) | ||
| Tinnitus | ‐ | 0 | 1 (1.6) | ||
| Pedrazzoli 2011e | ‐ | ‐ | ESAs + IV iron N = 73 | ESAs only N = 76 | Zero events |
| Participants with AEs | ‐ | 55 (75.3) | 49 (64.5) | ||
| Participants with serious AEs | ‐ | 8 (11) | 10 (13.2) | ||
| Participants with treatment‐related AEs | ‐ | 7 (9.6) | 6 (7.9) | ||
| Vascular/thromboembolic events | ‐ | 3 (4.1) | 2 (2.6) | ||
| Fatal AEs: all | ‐ | 4 (5.5) | 3 (3.9) | ||
| Fatal AEs: treatment related | ‐ | 0 (0) | 0 (0) | ||
| Steensma 2011f | Worst toxicity reported (toxicities were graded according to the National Cancer Institute Common Terminology Criteria of Adverse Events) | ESAs + IV iron N = 164 | ESAs + oral iron N = 162 | ESAs + placebo N = 163 | Zero events |
| None | 12 (7) | 15 (9) | 22 (13) | ||
| Mild | 28 (17) | 40 (25) | 33 (20) | ||
| Moderate | 35 (21) | 35 (22) | 33 (20) | ||
| Severe | 52 (32) | 42 (26) | 49 (30) | ||
| Life‐threatening | 29 (18) | 24 (15) | 23 (14) | ||
| Lethal (includes participants who died while on study regardless of causality) | 8 (5) | 6 (4) | 3 (2) | ||
| aEpisodes of transient anaphylactoid reactions occurred in two participants soon after initiating IV iron, but these participants recovered uneventfully without hospitalization; one participant in this group had enlarged uvula, lip swelling, and dyspnea (symptoms resolved). AE = adverse event | |||||
| Outcome or subgroup title | No. of studies | No. of participants | Statistical method | Effect size |
| 1 Hematopoietic response Show forest plot | 11 | 1712 | Risk Ratio (IV, Random, 95% CI) | 1.17 [1.09, 1.26] |
| 2 RBC transfusion Show forest plot | 11 | 1719 | Risk Ratio (IV, Random, 95% CI) | 0.74 [0.60, 0.92] |
| 3 Time to hematopoietic response Show forest plot | 7 | 1042 | Hazard Ratio (Random, 95% CI) | 0.93 [0.67, 1.28] |
| 4 Mean change in Hb Show forest plot | 7 | 827 | Mean Difference (Random, 95% CI) | 0.48 [0.10, 0.86] |
| 5 Quality of life Show forest plot | 4 | 1124 | Std. Mean Difference (Random, 95% CI) | 0.01 [‐0.10, 0.12] |
| 6 Thromboembolic events Show forest plot | 3 | 783 | Risk Ratio (IV, Random, 95% CI) | 0.95 [0.54, 1.65] |
| 7 Mean change in serum ferritin Show forest plot | 6 | 1010 | Mean Difference (Random, 95% CI) | 253.02 [84.30, 421.73] |
| 8 Mean change in TSAT Show forest plot | 5 | 908 | Mean Difference (Random, 95% CI) | 4.96 [0.94, 8.99] |
| Outcome or subgroup title | No. of studies | No. of participants | Statistical method | Effect size |
| 1 Hematopoietic response by type of iron Show forest plot | 11 | 1712 | Risk Ratio (IV, Random, 95% CI) | 1.17 [1.09, 1.26] |
| 1.1 Dextran | 3 | 340 | Risk Ratio (IV, Random, 95% CI) | 1.76 [1.01, 3.09] |
| 1.2 Gluconate | 4 | 879 | Risk Ratio (IV, Random, 95% CI) | 1.17 [1.08, 1.27] |
| 1.3 Sucrose | 1 | 102 | Risk Ratio (IV, Random, 95% CI) | 1.14 [0.97, 1.33] |
| 1.4 Sulfate | 3 | 391 | Risk Ratio (IV, Random, 95% CI) | 1.04 [0.87, 1.24] |
| 2 Hematopoietic response by route of administration Show forest plot | 11 | 1712 | Risk Ratio (IV, Random, 95% CI) | 1.17 [1.09, 1.26] |
| 2.1 Intravenous iron | 8 | 1321 | Risk Ratio (IV, Random, 95% CI) | 1.20 [1.10, 1.31] |
| 2.2 Oral iron | 3 | 391 | Risk Ratio (IV, Random, 95% CI) | 1.04 [0.87, 1.24] |
| 3 Hematopoietic response by type of ESA Show forest plot | 11 | 1712 | Risk Ratio (IV, Random, 95% CI) | 1.17 [1.09, 1.26] |
| 3.1 epoetin | 5 | 337 | Risk Ratio (IV, Random, 95% CI) | 1.53 [1.05, 2.22] |
| 3.2 darbepoetin | 6 | 1375 | Risk Ratio (IV, Random, 95% CI) | 1.16 [1.09, 1.24] |
| 4 Time to hematopoietic response by route of administration Show forest plot | 7 | Hazard Ratio (Random, 95% CI) | 0.93 [0.67, 1.28] | |
| 4.1 Intravenous iron | 6 | Hazard Ratio (Random, 95% CI) | 0.88 [0.60, 1.29] | |
| 4.2 Oral iron | 1 | Hazard Ratio (Random, 95% CI) | 1.24 [0.99, 1.56] | |
| 5 Time to hematopoietic response by type of iron Show forest plot | 7 | Hazard Ratio (Random, 95% CI) | 0.93 [0.67, 1.28] | |
| 5.1 Dextran | 3 | Hazard Ratio (Random, 95% CI) | 0.95 [0.36, 2.52] | |
| 5.2 Gluconate | 2 | Hazard Ratio (Random, 95% CI) | 0.78 [0.65, 0.94] | |
| 5.3 Sucrose | 1 | Hazard Ratio (Random, 95% CI) | 1.15 [0.60, 2.21] | |
| 5.4 Sulfate | 1 | Hazard Ratio (Random, 95% CI) | 1.24 [0.99, 1.56] | |
| 6 Time to hematopoietic response by type of ESA Show forest plot | 7 | Hazard Ratio (Random, 95% CI) | 0.93 [0.67, 1.28] | |
| 6.1 epoetin | 4 | Hazard Ratio (Random, 95% CI) | 1.00 [0.58, 1.72] | |
| 6.2 darbepoetin | 3 | Hazard Ratio (Random, 95% CI) | 0.81 [0.67, 0.96] | |
| 7 Mean change in Hb by route of administration Show forest plot | 7 | Mean Difference (Random, 95% CI) | 0.48 [0.10, 0.86] | |
| 7.1 Intravenous iron | 4 | Mean Difference (Random, 95% CI) | 0.84 [0.21, 1.46] | |
| 7.2 Oral iron | 3 | Mean Difference (Random, 95% CI) | 0.07 [‐0.19, 0.34] | |
| 8 Mean change in Hb by type of iron Show forest plot | 7 | Mean Difference (Random, 95% CI) | 0.48 [0.10, 0.86] | |
| 8.1 Dextran | 2 | Mean Difference (Random, 95% CI) | 1.55 [0.62, 2.47] | |
| 8.2 Gluconate | 2 | Mean Difference (Random, 95% CI) | 0.54 [‐0.15, 1.22] | |
| 8.3 Sucrose | 0 | Mean Difference (Random, 95% CI) | 0.0 [0.0, 0.0] | |
| 8.4 Sulfate | 3 | Mean Difference (Random, 95% CI) | 0.07 [‐0.19, 0.34] | |
| 9 Mean change in Hb by type of ESA Show forest plot | 7 | Mean Difference (Random, 95% CI) | 0.48 [0.10, 0.86] | |
| 9.1 epoetin | 5 | Mean Difference (Random, 95% CI) | 0.77 [0.25, 1.29] | |
| 9.2 darbepoetin | 2 | Mean Difference (Random, 95% CI) | 0.10 [‐0.13, 0.33] | |
| 10 Mean change in serum ferritin by route of administration Show forest plot | 6 | Mean Difference (Random, 95% CI) | 253.02 [84.30, 421.73] | |
| 10.1 Intravenous iron | 4 | Mean Difference (Random, 95% CI) | 362.15 [219.69, 504.61] | |
| 10.2 Oral iron | 2 | Mean Difference (Random, 95% CI) | 72.18 [‐6.59, 150.95] | |
| 11 Mean change in serum ferritin by type of iron Show forest plot | 6 | Mean Difference (Random, 95% CI) | 253.02 [84.30, 421.73] | |
| 11.1 Dextran | 1 | Mean Difference (Random, 95% CI) | 489.1 [344.28, 633.92] | |
| 11.2 Gluconate | 2 | Mean Difference (Random, 95% CI) | 420.02 [336.23, 503.81] | |
| 11.3 Sucrose | 1 | Mean Difference (Random, 95% CI) | 86.0 [‐125.67, 297.67] | |
| 11.4 Sulfate | 2 | Mean Difference (Random, 95% CI) | 72.18 [‐6.59, 150.95] | |
| 12 Mean change in serum ferritin by type of ESA Show forest plot | 6 | Mean Difference (Random, 95% CI) | 253.02 [84.30, 421.73] | |
| 12.1 epoetin | 2 | Mean Difference (Random, 95% CI) | 260.88 [‐89.56, 611.32] | |
| 12.2 darbepoetin | 4 | Mean Difference (Random, 95% CI) | 248.35 [26.24, 470.45] | |
| 13 Mean change in TSAT by route of administration Show forest plot | 5 | Mean Difference (Random, 95% CI) | 4.96 [0.94, 8.99] | |
| 13.1 Intravenous iron | 3 | Mean Difference (Random, 95% CI) | 5.07 [‐1.74, 11.87] | |
| 13.2 Oral iron | 2 | Mean Difference (Random, 95% CI) | 5.90 [‐0.67, 12.46] | |
| 14 Mean change in TSAT by type of iron Show forest plot | 5 | Mean Difference (Random, 95% CI) | 4.96 [0.94, 8.99] | |
| 14.1 Dextran | 1 | Mean Difference (Random, 95% CI) | 7.1 [1.11, 13.09] | |
| 14.2 Gluconate | 2 | Mean Difference (Random, 95% CI) | 4.78 [‐6.65, 16.22] | |
| 14.3 Sucrose | 0 | Mean Difference (Random, 95% CI) | 0.0 [0.0, 0.0] | |
| 14.4 Sulfate | 2 | Mean Difference (Random, 95% CI) | 5.90 [‐0.67, 12.46] | |
| 15 Mean change in TSAT by type of ESA Show forest plot | 5 | Mean Difference (Random, 95% CI) | 4.96 [0.94, 8.99] | |
| 15.1 epoetin | 2 | Mean Difference (Random, 95% CI) | 11.40 [4.17, 18.64] | |
| 15.2 darbepoetin | 3 | Mean Difference (Random, 95% CI) | 3.01 [‐0.73, 6.75] | |
| Outcome or subgroup title | No. of studies | No. of participants | Statistical method | Effect size |
| 1 Random sequence generation Show forest plot | 11 | 1712 | Risk Ratio (IV, Random, 95% CI) | 1.17 [1.09, 1.26] |
| 1.1 Adequate (low risk) | 4 | 830 | Risk Ratio (IV, Random, 95% CI) | 1.13 [1.02, 1.26] |
| 1.2 Inadequate (high/unclear risk) | 7 | 882 | Risk Ratio (IV, Random, 95% CI) | 1.23 [1.09, 1.39] |
| 2 Allocation concealment Show forest plot | 11 | 1711 | Risk Ratio (IV, Random, 95% CI) | 1.17 [1.09, 1.26] |
| 2.1 Adequate (low risk) | 11 | 1711 | Risk Ratio (IV, Random, 95% CI) | 1.17 [1.09, 1.26] |
| 2.2 Inadequate (high/unclear risk) | 0 | 0 | Risk Ratio (IV, Random, 95% CI) | 0.0 [0.0, 0.0] |
| 3 Blinding Show forest plot | 11 | 1712 | Risk Ratio (IV, Random, 95% CI) | 1.17 [1.09, 1.26] |
| 3.1 Adequate (low risk) | 1 | 102 | Risk Ratio (IV, Random, 95% CI) | 1.14 [0.97, 1.33] |
| 3.2 Inadequate (high/unclear risk) | 10 | 1610 | Risk Ratio (IV, Random, 95% CI) | 1.18 [1.08, 1.29] |
| 4 Incomplete outcome data Show forest plot | 11 | 1712 | Risk Ratio (IV, Random, 95% CI) | 1.17 [1.09, 1.26] |
| 4.1 Adequate (low risk) | 8 | 1430 | Risk Ratio (IV, Random, 95% CI) | 1.18 [1.07, 1.30] |
| 4.2 Inadequate (high/unclear risk) | 3 | 282 | Risk Ratio (IV, Random, 95% CI) | 1.15 [1.00, 1.33] |
| 5 Selective reporting Show forest plot | 11 | 1712 | Risk Ratio (IV, Random, 95% CI) | 1.17 [1.09, 1.26] |
| 5.1 Adequate (low risk) | 11 | 1712 | Risk Ratio (IV, Random, 95% CI) | 1.17 [1.09, 1.26] |
| 5.2 Inadequate (high/unclear risk) | 0 | 0 | Risk Ratio (IV, Random, 95% CI) | 0.0 [0.0, 0.0] |
| 6 Other bias Show forest plot | 11 | 1711 | Risk Ratio (IV, Random, 95% CI) | 1.17 [1.09, 1.26] |
| 6.1 Adequate (low risk) | 9 | 1371 | Risk Ratio (IV, Random, 95% CI) | 1.16 [1.05, 1.28] |
| 6.2 Inadequate (high/unclear risk) | 2 | 340 | Risk Ratio (IV, Random, 95% CI) | 1.21 [1.07, 1.38] |
| 7 Hematopoietic response by definition(s) Show forest plot | 11 | 1712 | Risk Ratio (IV, Random, 95% CI) | 1.17 [1.09, 1.26] |
| 7.1 Hematopoietic response | 8 | 1430 | Risk Ratio (IV, Random, 95% CI) | 1.18 [1.07, 1.30] |
| 7.2 Hematologic response | 2 | 180 | Risk Ratio (IV, Random, 95% CI) | 1.24 [0.80, 1.94] |
| 7.3 Patients reaching Hb > 13 g/dL | 1 | 102 | Risk Ratio (IV, Random, 95% CI) | 1.14 [0.97, 1.33] |