Función del hierro en el tratamiento de la anemia inducida por la quimioterapia en pacientes con cáncer que reciben agentes estimulantes de la eritropoyesis
Resumen
Antecedentes
Los agentes estimulantes de la eritropoyesis (AEE) se administran habitualmente para tratar la anemia inducida por la quimioterapia (AIQ). Sin embargo, cerca de la mitad de pacientes no se benefician.
Objetivos
Evaluar los efectos beneficiosos y perjudiciales relacionados con la administración de hierro como un suplemento para los AEE y hierro solo en comparación con AEE solo en el tratamiento de la AIQ.
Métodos de búsqueda
Se hicieron búsquedas de ensayos relevantes en el Registro Cochrane Central de Ensayos Controlados (Cochrane Central Register of Controlled Trials) (CENTRAL) (número 1, enero 2016), MEDLINE (1950 hasta febrero 2016), y en www.clinicaltrials.gov sin aplicar ninguna restricción de idioma.
Criterios de selección
Fueron elegibles para inclusión todos los ensayos controlados aleatorios (ECA) que compararon "hierro más AEE" o "hierro solo" versus "AEE solo" en pacientes con AIQ.
Obtención y análisis de los datos
Se utilizaron los procedimientos metodológicos estándar previstos por la Colaboración Cochrane.
Resultados principales
Se incluyeron ocho ECA (12 comparaciones) que compararon AEE más hierro versus AEE solo y reclutaron a 2087 participantes. No se encontraron ensayos que compararan hierro solo versus AEE solos en pacientes con AIQ. Ninguno de los ECA incluidos informó la supervivencia general. Hubo un efecto beneficioso de la administración de suplementos de hierro con los AEE en comparación con los AEE solos en la respuesta hematopoyética (cociente de riesgos [CR] 1,17; intervalo de confianza [IC] del 95%: 1,09 a 1,26; P < 0,0001; 1712 participantes; 11 comparaciones; pruebas de alta calidad). Si se supone un riesgo inicial del 35% al 80% para la respuesta hematopoyética sin la administración de suplementos de hierro, entre siete y 16 pacientes deberían ser tratados para lograr la respuesta hematopoyética en un paciente. En los análisis de subgrupos, los ECA que administraron hierro intravenoso (IV) favorecieron a los AEE y al hierro (CR 1,20 [IC del 95%: 1,10 a 1,31]; P < 0,00001; 1321 participantes; ocho comparaciones), mientras que no se encontraron pruebas de una diferencia en la respuesta hematopoyética en los ECA que administraron hierro oral (CR 1,04 [IC del 95%: 0,87 a 1,24]; P = 0,68; 391 participantes; tres comparaciones). No hubo pruebas de una diferencia entre los subgrupos de hierro IV y oral (P = 0,16). No hubo pruebas de una diferencia entre los subgrupos de tipos de hierro (p = 0,31) y tipos de AEE (p = 0,16) en la respuesta hematopoyética.
La administración de suplementos de hierro con los AEE podría ser beneficiosa ya que menos participantes tratados con suplementos de hierro necesitaron transfusiones de eritrocitos en comparación con el número de participantes tratados con AEE solos (CR 0,74 [IC del 95%: 0,60 a 0,92]; P = 0,007; 1719 participantes; 11 comparaciones; pruebas de calidad moderada). Si se supone un riesgo inicial de un 7% a un 40% para la transfusión de eritrocitos sin administración de suplementos de hierro, entre diez y 57 pacientes deberían ser tratados para evitar una transfusión de eritrocitos en un paciente.
No se encontraron pruebas de una diferencia en la mediana del tiempo hasta la respuesta hematopoyética con el agregado de hierro a los AEE (cociente de riesgos instantáneos [CRI] 0,93 [IC del 95%: 0,67 a 1,28]; P = 0,65; 1042 participantes; siete comparaciones; pruebas de baja calidad). En los análisis de subgrupos, los ECA en los que se administró dextrán (CRI 0,95 [IC del 95%: 0,36 a 2,52]; P = 0,92; 340 participantes; tres comparaciones), sacarosa de hierro (CRI 1,15 [IC del 95%: 0,60 a 2,21]; P = 0,67; 102 participantes; una comparación) y sulfato de hierro (CRI 1,24 [IC del 95%: 0,99 a 1,56]; P = 0,06; 55 participantes; una comparación) no mostraron pruebas de diferencias entre la administración de suplementos de hierro versus AEE solos en comparación con los ECA que administraron gluconato (CRI 0,78 [IC del 95%: 0,65 a 0,94]; P = 0,01; 464 participantes; dos comparaciones) en la mediana del tiempo hasta la respuesta hematopoyética (P = 0,02). No hubo pruebas de una diferencia entre los subgrupos según la vía de administración del hierro (p = 0,13) y los tipos de AEE (p = 0,46) en la mediana del tiempo hasta la respuesta hematopoyética.
Los resultados indicaron que podría haber una mejoría en los niveles de hemoglobina (Hb) con el agregado de hierro a los AEE (diferencia de medias [DM] 0,48 [IC del 95%: 0,10 a 0,86]; P = 0,01; 827 participantes; siete comparaciones; pruebas de baja calidad). En los ECA en los cuales se administró hierro IV hubo pruebas de una diferencia (DM 0,84 [IC del 95%: 0,21 a 1,46]; P = 0,009; 436 participantes; cuatro comparaciones) en comparación con el hierro oral (DM 0,07 [IC del 95%: ‐0,19 a 0,34]; P = 0,59; 391 participantes; tres comparaciones) en el cambio medio en el nivel de Hb (P = 0,03). Los ECA que administraron dextrán (DM 1,55 [IC del 95%: 0,62 a 2,47]; P = 0,001; 102 participantes; dos comparaciones) mostraron pruebas de una diferencia con la administración de suplementos de hierro versus AEE solos en comparación con los ECA que administraron gluconato (DM 0,54 [IC del 95%: ‐0,15 a 1,22]; P = 0,12; 334 participantes; dos comparaciones) y sulfato de hierro (DM 0,07 [IC del 95%: ‐0,19 a 0,34]; P = 0,59; 391 participantes; tres comparaciones) en el cambio medio en el nivel de Hb (P = 0,007). Los ECA que administraron epoyetina mostraron pruebas de una diferencia con la administración de suplementos de hierro versus AEE solos (DM 0,77 [IC del 95%: 0,25 a 1,29]; P = 0,004; 337 participantes; cinco comparaciones) en comparación con la administración de darbepoyetina (DM 0,10 [IC del 95%: ‐0,13 a 0,33]; P = 0,38; 490 participantes; dos comparaciones) en el cambio medio en el nivel de Hb (P = 0,02).
No se encontraron pruebas de una diferencia en la calidad de vida con el agregado de hierro a los AEE (diferencia de medias estandarizada 0,01 [IC del 95%: ‐0,10 a 0,12]; P = 0,88; 1124 participantes; tres ECA; pruebas de alta calidad).
No se encontraron pruebas de una diferencia en el riesgo de eventos tromboembólicos grado III‐IV (CR 0,95 [IC del 95%: 0,54 a 1,65]; P = 0,85; 783 participantes; tres ECA; pruebas de calidad moderada). La incidencia de mortalidad relacionada con el tratamiento (MRT) fue del 0% (997 participantes; cuatro comparaciones; pruebas de alta calidad).
Otros eventos adversos frecuentes incluyeron vómitos, astenia y leucopenia y fueron similares en ambos brazos.
En general el riesgo de sesgo entre los resultados fue alto a bajo. Debido a que los ECA incluidos tuvieron una duración del seguimiento más corta (hasta 20 semanas), no se conocen los efectos a largo plazo de la administración de suplementos de hierro. Las razones principales para la disminución de la calidad de las pruebas fueron la inconsistencia entre los estudios incluidos y la imprecisión de los resultados.
Conclusiones de los autores
Esta revisión sistemática indica que el agregado de hierro a los AEE ofrece una respuesta hematopoyética superior, reduce el riesgo de transfusiones de eritrocitos, mejora los niveles de Hb y parece tolerarse bien. Ninguno de los ECA incluidos informó la supervivencia general. No se encontraron pruebas de una diferencia en la calidad de vida con la administración de suplementos de hierro.
PICO
Resumen en términos sencillos
Función del hierro en el tratamiento de la anemia inducida por la quimioterapia en pacientes con cáncer que reciben agentes estimulantes de la eritropoyesis
Pregunta de la revisión: ¿El hierro solo o el hierro como un suplemento a los agentes estimulantes de la eritropoyesis (AEE) es superior a los AEE solos en el tratamiento de los pacientes diagnosticados con anemia inducida por la quimioterapia (AIQ)?
Antecedentes: El tratamiento actual de la AIQ son los AEE, que aumentan la producción de eritrocitos (eritropoyesis), y en algunos casos AEE y hierro. En algunos casos, estrategias como ningún tratamiento o esperar y observar con vigilancia clínica y transfusión de eritrocitos pueden ser opciones seguras y apropiadas. Se realizó una revisión sistemática para evaluar los efectos beneficiosos y perjudiciales del hierro en el tratamiento de la AIQ.
Fecha de la búsqueda: Las pruebas están actualizadas hasta febrero 2016
Características de los estudios: Se incluyeron ocho ensayos controlados aleatorios (ECA) financiados por la industria que compararon AEE más hierro versus AEE solos y que reclutaron a 2087 participantes. No se encontraron ensayos que compararan hierro solo versus AEE solos.
Financiamiento del estudio: Todos los ensayos incluidos fueron financiados por la industria.
Resultados clave: El agregado de hierro a los AEE mejora la respuesta hematopoyética en los pacientes con AIQ. La administración de hierro con los AEE podría reducir el riesgo de transfusiones de sangre y mejorar la hemoglobina. No se encontraron mejorías en la calidad de vida con el agregado de hierro. No se encontraron pruebas de una diferencia en el tiempo hasta la respuesta hematopoyética y el riesgo de desarrollar coágulos de sangre en las venas de los pacientes con AIQ tratados con hierro y AEE en comparación con AEE solos. Hubo cero muertes relacionadas con el tratamiento entre 997 participantes en los cuatro ensayos que informaron este resultado. Otros efectos perjudiciales incluyeron estreñimiento, vómitos y diarrea y fueron similares con AEE y hierro en comparación con AEE solos. Ninguno de los ensayos informó datos sobre la supervivencia.
Calidad de la evidencia: La calidad de las pruebas para la respuesta hematopoyética fue alta. La calidad de las pruebas para la transfusión de eritrocitos fue moderada, ya que la estimación agrupada tuvo una gran variación. La calidad de las pruebas para el cambio en la hemoglobina y el tiempo hasta la respuesta hematopoyética fue baja, ya que las estimaciones agrupadas tuvieron gran variación y los resultados no fueron similares entre los estudios. La calidad de las pruebas de la calidad de vida fue alta. La calidad de las pruebas del riesgo de coágulos sanguíneos en las venas fue moderada debido a la variación en la estimación agrupada. Debido a que los ECA incluidos tuvieron una duración del seguimiento más corta (hasta 20 semanas), no se conocen los efectos a largo plazo de la administración de suplementos de hierro.
Conclusiones de los autores
Summary of findings
| Benefits and harms of iron supplementation for chemotherapy‐induced anemia | |||||
| Patient or population: people diagnosed with chemotherapy‐induced anemia Comparison: erythropoiesis‐stimulating agents alone | |||||
| Outcomes | Illustrative comparative risks* (95% CI) | Relative effect | No of Participants | Quality of the evidence | |
| Assumed risk | Corresponding risk | ||||
| Control | Benefits and harms of iron supplementation | ||||
| Overall survival | None of the included studies reported data on overall survival | ||||
| Hematopoietic response | Study population | RR 1.17 | 1712 (7 studies, 11 comparisons) | ⊕⊕⊕⊕ | |
| 632 per 1000 | 740 per 1000 | ||||
| Moderate## | |||||
| 574 per 1000 | 672 per 1000 | ||||
| Red blood cell transfusion | Study population | RR 0.74 | 1719 (7 studies, 11 comparisons) | ⊕⊕⊕⊝ | |
| 195 per 1000 | 144 per 1000 | ||||
| Moderate## | |||||
| 167 per 1000 | 124 per 1000 | ||||
| Median time to hematopoietic response | Not applicable# | HR 0.93 (0.67 to 1.28) | 1042 (5 studies, 7 comparisons) | ⊕⊕⊝⊝ low1,2 | |
| Mean change in hemoglobin (better indicated by higher values) | The mean change in hemoglobin in the intervention groups was 0.48 higher | MD 0.48 (0.10 to 0.86) | 827 (3 studies, 7 comparisons) | ⊕⊕⊝⊝ | |
| Quality of life (better indicated by higher values) | The mean quality of life in the intervention groups was | SMD 0.01 (‐0.10 to 0.12) | 1124 (3 studies, 4 comparisons) | ⊕⊕⊕⊕ | |
| Thromboembolic events | Study population | RR 0.95 | 783 (3 studies) | ⊕⊕⊕⊝ | |
| 62 per 1000 | 58 per 1000 | ||||
| Moderate## | |||||
| 62 per 1000 | 59 per 1000 | ||||
| Treatment‐related mortality | Not applicable** | Zero events** | 997 (4 studies, 6 comparisons) | ⊕⊕⊕⊕ | |
| *The basis for the assumed risk (e.g. the median control group risk across studies) is provided in footnotes. The corresponding risk (and its 95% confidence interval) is based on the assumed risk in the comparison group and the relative effect of the intervention (and its 95% CI). | |||||
| GRADE Working Group grades of evidence | |||||
| 1Downgraded the quality of evidence by one level due to imprecision (the pooled estimate had wider confidence intervals). **Due to zero events we were not able to conduct meta‐analysis of these data. #Data were available as median and range, and hence were converted to log hazard ratio using the cumulative hazard log‐log transform method. ##The moderate control risk was calculated via GRADEpro software based on clinical experience of the review authors working in the field of hematological disorders. | |||||
Antecedentes
La mayoría de los pacientes con cáncer que reciben quimioterapia desarrollan anemia inducida por la quimioterapia (AIQ) (Kitano 2007; Knight 2004; Leonard 2005; Ludwig 2004; Pujade‐Lauraine). Aproximadamente el 83% de los pacientes que reciben quimioterapia desarrollan AIQ (Barrett‐Lee 2006). En los pacientes que reciben quimioterapia mielosupresora o radioterapia, o ambas, la incidencia es tan alta como del 70% al 90% y está cerca del 60% en los pacientes con tumores sólidos y linfomas (Schwartz 2007). La mayoría de los pacientes con AIQ presenta fatiga, debilidad y disnea, lo que reduce la calidad de vida y el estado funcional (Littlewood 2001; Mancuso 2006; Stasi 2003). El objetivo general del tratamiento en los pacientes con AIQ es la reducción de las necesidades de transfusión y el aumento de la calidad de vida (Rizzo 2008; Rizzo 2010). Las guías de la National Comprehensive Cancer Network (NCCN),NCCN 2009, y las guías de la European Organisation of Research and Treatment of Cancer (EORTC), Aapro 2008, recomiendan la transfusión de eritrocitos como una estrategia eficaz para tratar la AIQ porque da lugar al reemplazo de la hemoglobina (Hb) agotada. Sin embargo, los estudios de investigación han mostrado que el efecto de la transfusión de eritrocitos es temporal y posiblemente se asocia con eventos tromboembólicos graves y un aumento en la mortalidad (Khorana 2008; Mercadante 2009). Una alternativa a la transfusión de eritrocitos en el tratamiento de la AIQ en los pacientes con cáncer incluye la administración de agentes estimulantes de la eritropoyesis (AEE).
Los AEE son proteínas producidas por el hombre que estimulan la producción de eritrocitos en la médula ósea cuando disminuye el nivel de oxígeno en la sangre. Los AEE aumentan los niveles de Hb, reducen las necesidades de transfusión y mejoran la calidad de vida (Demetri 1998; Glaspy 1997; Littlewood 2001; Rizzo 2002). Sin embargo, un metanálisis reciente que emplea datos publicados y no publicados / no informados de ensayos controlados aleatorios (ECA) mostró que no se encontraron pruebas de una mejoría clínicamente relevante en los síntomas relacionados con la fatiga y solamente se encontraron efectos beneficiosos pequeños en los síntomas relacionados con la anemia en los pacientes con cáncer que recibieron AEE en comparación con los controles (Bohlius 2014). Además, las pruebas de varios estudios indican que el tratamiento con AEE también se asocia con mayor riesgo de eventos tromboembólicos (Glaspy 2010; Rizzo 2008). Una revisión sistemática de 51 ECA de fase III que examina la administración de los AEE en el tratamiento de la AIQ mostró un aumento relativo del 57% en el riesgo de coágulos sanguíneos (tromboembolia venosa) y un aumento relativo del 10% en el riesgo de mortalidad entre los participantes (Bennett 2008). Un metanálisis de datos de participantes individuales (53 ECA, 13 933 participantes) que examinó los efectos de dos tipos de AEE (epoyetina y darbepoyetina) sobre la supervivencia de los pacientes con cáncer, mostró que los AEE aumentaron la mortalidad general en el 17% en todos los participantes en comparación con los grupos control y en el 10% en los participantes que recibieron quimioterapia en comparación con los grupos control (Bohlius 2009). En los pacientes que reciben quimioterapia con una Hb menor de 10 g/dl, la American Society of Hematology (ASH)/American Society of Clinical Oncology (ASCO) recomiendan que los médicos deben tratar los posibles efectos perjudiciales (por ejemplo, el aumento en la incidencia de eventos tromboembólicos y la reducción en la supervivencia) y beneficiosos (por ejemplo, reducción en las transfusiones de eritrocitos) de los AEE con los pacientes (Bohlius 2009; Bohlius 2014; Tonia 2012), así como las preferencias de los pacientes por las decisiones guiadas con riesgo demostrado en el tratamiento de la AIQ (Rizzo 2010). En realidad, la NCCN desestimula la administración de AEE con una intención curativa en los pacientes que reciben quimioterapia (NCCN 2010).
Debido a los posibles efectos perjudiciales asociados con el tratamiento con AEE, el hierro se ha propuesto como un complemento a los AEE en el tratamiento de la AIQ. Los pacientes con cáncer que presentan AIQ y son tratados solo con AEE tienen probabilidades de experimentar un aumento de las necesidades de hierro del eritrón que exceden el suministro disponible (que es la deficiencia funcional de hierro [DFH]) y una producción de eritrocitos deficientes en hierro en la médula ósea (Eschbach 2005). La administración concurrente de hierro previene la DFH y puede requerir una reducción de la dosis de AEE para lograr los niveles de Hb proyectados (Auerbach 2008a). Sin embargo, el tratamiento con hierro no está libre de riesgo. Por ejemplo, el hierro oral puede causar diarrea, estreñimiento, trastornos gástricos y reacciones alérgicas como erupción cutánea, prurito y tumefacción de cara / lengua / garganta. El hierro dextrán de alto peso molecular se asocia con una tasa de eventos adversos mucho mayor que el hierro dextrán de bajo peso molecular (Fletes 2001; Mamula 2002). Sin embargo, las preparaciones más nuevas de hierro intravenoso (IV) que incluyen hierro dextrán de bajo peso molecular, sacarosa de hierro y gluconato férrico se asocian con pocos eventos adversos(Chertow 2004; Chertow 2006).
Se han realizado varios ECA para evaluar la eficacia de la administración de suplementos de hierro con los AEE versus AEE solos para el tratamiento de la AIQ. Sin embargo, las pruebas relacionadas con la eficacia del hierro en combinación con los AEE en comparación con los AEE solos en los pacientes con la AIQ son contradictorias. Aunque algunos ensayos han indicado que la administración de hierro como complemento a los AEE en comparación con los AEE solos se asocia con mejor respuesta a los AEE, aumenta los niveles de Hb, provoca mayor respuesta hematopoyética y mejora la calidad de vida relacionada con la salud en los pacientes con cáncer (Bastit 2008; Bellet 2007; Hedenus 2007; Pedrazzoli 2008), otros han mostrado que el hierro IV no tiene una repercusión diferencial sobre los niveles de Hb, las transfusiones de sangre, la administración de AEE o la calidad de vida de los pacientes en comparación con la administración de suplementos orales o placebo (Steensma 2011a). Además, los estudios que apoyaron la administración de suplementos de hierro no han analizado definitivamente la dosis óptima ni el tipo y la vía de administración del hierro. La falta de pruebas definitivas con respecto a los efectos beneficiosos y perjudiciales de la administración de suplementos de hierro con los AEE en los pacientes con AIQ requiere una evaluación sistemática integral de los efectos de la administración de suplementos de hierro con los AEE.
Descripción de la afección
La anemia es una reducción del número de recuentos de eritrocitos o hemoglobina (una proteína dentro de los eritrocitos que contiene hierro y transporta oxígeno a diferentes sistemas del cuerpo), que provoca una reducción en la capacidad de la sangre de transportar el oxígeno a los tejidos corporales. Según la Organización Mundial de la Salud (OMS), se considera que un hombre con un nivel de Hb menor de 13 g/dl o una mujer con un nivel de Hb menor de 12 g/dl presentan anemia. Los pacientes con cáncer, especialmente los que reciben quimioterapia, son susceptibles a la anemia porque tienen niveles de eritropoyetina bajos. La AIQ ocurre cuando los agentes quimioterapéuticos atacan rápidamente las células que se dividen rápidamente que incluyen los eritrocitos, por lo que impiden que se dividan. Además de interrumpir la eritropoyesis (la producción de eritrocitos), la quimioterapia puede provocar heridas en la boca, cambios gustativos y náuseas, por lo que reduce la ingesta de los nutrientes necesarios para la producción de eritrocitos. La AIQ se asocia con una reducción en la producción de eritrocitos en la médula ósea, una disminución en la eritropoyetina y la liberación insuficiente de hierro. Una de las manifestaciones clínicas más graves de la AIQ es la fatiga, que experimenta el 63% de los pacientes con cáncer que presentan anemia después de la quimioterapia(Gabrilove 2007). Otros síntomas pueden incluir insomnio, anorexia y depresión (van Weert 2006); edema periférico, taquicardia mantenida, taquipnea, dolor torácico, disnea al esfuerzo y mareo ortostático (NCCN 2009).
Descripción de la intervención
Varios ECA han indicado que la administración de hierro como un complemento a los AEE puede aumentar la tasa a la cual los pacientes responden al tratamiento con AEE y acortar la duración de la administración de los AEE (Auerbach 2004a; Bellet 2007; Hedenus 2007; Henry 2007a). El hierro se puede administrar por vía oral o por vía intravenosa (IV). Los pacientes con AIQ que son tratados con hierro IV en contraposición con hierro oral han experimentado una respuesta significativamente mayor de la Hb en Auerbach 2004ayHenry 2007a, y una reducción significativa en la transfusión de eritrocitos y en el tiempo de demora hasta la respuesta (Bastit 2008). Sin embargo, el hierro IV es más costoso(Shord 2008). Los eventos adversos, que incluyen reacciones alérgicas y anafilactoides, se asocian con el tratamiento con hierro dextrán(Bailie 2005; Shander 2010). Algunos ejemplos de sales de hierro oral actualmente autorizadas por la Food and Drug Administration de los EE.UU. para su uso en el tratamiento de la AIQ incluyen sulfato ferroso, gluconato ferroso y fumarato ferroso, mientras que las formulaciones IV incluyen hierro dextrán (autorizado en 1991), hierro como gluconato férrico (autorizado en 1999), sacarosa de hierro (autorizado en 2000) y ferumoxitol (autorizado en 2009)(Shander 2010). La dosis de hierro utilizada en los ECA recientes incluyen infusión de la dosis total de hierro dextrán o inyecciones de bolos de 100 mg (Auerbach 2004a), gluconato férrico 125 mg una vez a la semana durante ocho semanas (Henry 2007a), sacarosa de hierro 100 mg una vez a la semana durante las semanas uno a seis y 100 mg cada dos semanas durante las semanas ocho a 14(Hedenus 2007), gluconato férrico o sacarosa de hierro 200 mg cada tres semanas (Bastit 2008), gluconato férrico 125 mg durante seis semanas (Pedrazzoli 2008), y hierro dextrán 400 mg cada tres semanas (Auerbach 2008a).
De qué manera podría funcionar la intervención
La eritropoyetina es la hormona que facilita la producción de eritrocitos en la médula ósea. Las cantidades insuficientes de hierro o eritropoyetina, o ambos, provocan anemia. Aunque los AEE se han utilizado para tratar la AIQ en los pacientes con cáncer, sin la administración de suplementos de hierro estos pacientes tienen probabilidades de experimentar DFH y una producción de eritrocitos deficientes en hierro en la médula ósea (Eschbach 2005). Sin embargo, la administración concurrente de hierro evita la DFH y puede requerir una reducción de la dosis de AEE para lograr los niveles de Hb proyectados (Auerbach 2008a).
Por qué es importante realizar esta revisión
Actualmente, los AEE se utilizan a menudo para tratar la AIQ. Sin embargo, cerca de la mitad de los pacientes no logra experimentar un aumento de la Hb inicial, una reducción de las transfusiones o una mejoría en la función después del tratamiento con los AEE(Birgegard 2006; Henry 1995; Razzouk 2006). Además, la administración de AEE está limitada de manera adicional por los eventos adversos tromboembólicos asociados. Por lo tanto, la administración de hierro como un complemento a los AEE se ha indicado como una manera de eludir los problemas relacionados con la administración de AEE solos. Sin embargo, los hallazgos de los ECA que analizan los efectos beneficiosos y perjudiciales del hierro en el tratamiento de la AIQ son contradictorios.
Los hallazgos brindarán respuestas con respecto a la repercusión de la administración de suplementos de hierro con los AEE sobre diversos resultados como la respuesta hematopoyética, el tiempo hasta la respuesta hematopoyética y el cambio medio en la Hb en los pacientes con la AIQ. Los resultados también mejorarán la comprensión de la dosis óptima, la duración del tratamiento y la vía de administración del hierro en el tratamiento de la AIQ. Esta revisión puede no ayudar a los médicos a tomar decisiones acerca de la administración de hierro para tratar a los pacientes con AIQ. Los ayudará en la toma de decisiones con respecto a la administración de hierro en los pacientes con AIQ que reciben AEE.
Objetivos
Evaluar los efectos beneficiosos y perjudiciales relacionados con la administración de hierro como un suplemento a los AEE y hierro solo en comparación con los AEE solos en el tratamiento de la AIQ.
Métodos
Criterios de inclusión de estudios para esta revisión
Tipos de estudios
Fueron elegibles para inclusión todos los ECA que compararan "hierro + AEE" o "hierro solo" versus "AEE solos". Se incluyeron todos los estudios publicados y no publicados independientemente del tipo de publicación (resúmenes, artículo completo, literatura gris, etc.). Se excluyó cualquier estudio observacional que utilizara diseños no aleatorios y cuasialeatorios. No se aplicó ninguna restricción de idioma.
Tipos de participantes
Se incluyeron todos los participantes con diagnóstico de AIQ, independientemente del tipo o la gravedad del cáncer y la edad, reclutados en ECA que evaluaran la función de la administración de suplementos de hierro con AEE o hierro solo en comparación con AEE solos para el tratamiento de la AIQ. No se consideraron para la revisión los ECA que incluyeron participantes con anemia atribuible a factores diferentes del cáncer o la quimioterapia (por ejemplo, deficiencia de folato, hemólisis, hemorragia gastrointestinal o síndromes mielodisplásicos).
Tipos de intervenciones
Se consideraron las siguientes intervenciones:
-
Intervención experimental: administración de suplementos de hierro con AEE (es decir, hierro y AEE) o hierro solo
-
Intervención control: tratamiento con AEE solos
Tipos de medida de resultado
Esta revisión sistemática se basa en el protocolo publicado (Mhaskar 2012).
Resultados primarios
Supervivencia general, definida como el tiempo hasta la muerte por cualquier causa o definiciones variables, como las utilizaron los autores de los estudios originales.
Resultados secundarios
Se consideraron los siguientes resultados secundarios:
-
Respuesta hematopoyética (resultado dicotómico); definida como aumento de la Hb ≥ 2 g/dl a partir del valor inicial o un aumento de la Hb hasta 12 g/dl sin transfusión
-
Transfusiones de eritrocitos (resultado dicotómico)
-
Tiempo hasta la respuesta hematopoyética (resultado tiempo hasta el evento)
-
Cambio medio en el nivel de Hb a partir del valor inicial (resultado continuo)
-
Cambios en la calidad de vida (resultado continuo)
-
Eventos adversos (resultado dicotómico)
-
Mortalidad relacionada con el tratamiento (resultado dicotómico)
Los datos con respecto a los niveles de ferritina sérica y de saturación de transferrina (TSAT) se agregaron posteriormente a los resultados, después de la presentación del protocolo (Mhaskar 2012).
Results
Description of studies
See Characteristics of included studies and Characteristics of excluded studies for details.
Results of the search
Our search identified 904 relevant studies excluding duplicates. After screening the titles and abstracts of these records, we found 880 to be non‐relevant and excluded them. The PRISMA flow chart depicts the inclusion and exclusion of studies (Figure 1). One study was published only as an abstract, and hence we contacted the author for more information, but received no response.
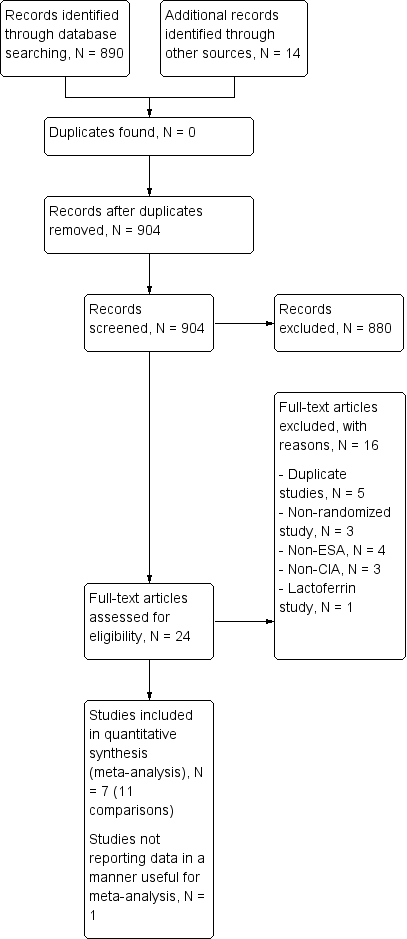
Study flow diagram.
Included studies
The present review includes eight multicenter national trials with 12 comparisons. We did not identify any study comparing iron alone versus ESAs alone addressing the management of people diagnosed with CIA.
Design
The study by Auerbach et al is an open‐label RCT with four arms and three references relating to this study (Auerbach 2004a; Auerbach 2004b; Auerbach 2004c). The study by Auerbach et al was a phase II, double‐blind, multicenter, and 2 × 2 factorial study (Auerbach 2010). The two study factors were dose of darbepoetin alfa (500 µg every three weeks versus 300 µg every three weeks) and IV iron usage (IV iron versus no IV iron). The study was blinded to the dose of darbepoetin alfa administered and open label for IV iron administration. Randomization was stratified by planned chemotherapy (platinum versus non‐platinum) and geographic region (North America versus Europe) (Auerbach 2010). The study by Bastit et al was a multicenter, randomized, open‐label, phase III study. Randomization was stratified by tumor type (lung/gynecologic versus other types) and baseline Hb category (< 10 g/dL versus ≥ 10 g/dL). Most participants (67% in the IV iron group, 76% in the control group) completed this study. Nonetheless importantly, the reasons for withdrawal (death, adverse events, disease progression, consent withdrawal, protocol deviations, and non‐compliance) were similar across study groups (Bastit 2008). The trial by Beguin et al was a multicenter, three‐arm RCT, not placebo‐controlled and open label (for IV arm) (Beguin 2008). The study by Henry et al had three arms and two references relating to this study (Henry 2007a; Henry 2007b). This was a multicenter, prospective, open‐label RCT (Henry 2007a; Henry 2007b). The study by Pedrazzoli et al was a randomized, open‐label, multicenter study (Pedrazzoli 2008). The study by Steensma et al has three arms and two references relating to this study (Steensma 2011a; Steensma 2011b). The study by Steensma et al was a prospective, multicenter, placebo‐controlled, randomized trial. Random assignment was stratified by participant sex, tumor type (solid tumors versus hematologic malignancies), severity of anemia on the basis of the World Health Organization (WHO) classification (mild: Hb ≥ 9.5 g/dL; severe: Hb < 9.5 g/dL), and whether or not participants were receiving a platinum‐containing chemotherapy regimen. The study by Bellet et al was a prospective, multicenter, randomized, open‐label, two‐stage phase III clinical trial (Bellet 2007). This study reported the change in Hb levels, other iron indices, quality of life, and adverse events, but reported data were not amenable to statistical analysis. The distribution of participants in the individual study arms in this study was not reported (Bellet 2007).
Sample sizes
The study by Auerbach et al included 157 participants with CIA comparing total dose infusion iron dextran, iron dextran (bolus), or oral iron ferrous sulfate as supplements to recombinant human erythropoietin versus ESAs alone (Auerbach 2004a; Auerbach 2004b; Auerbach 2004c). The trial by Auerbach et al included 238 non‐myeloid cancer patients with CIA comparing oral iron dextran as supplements to darbepoetin alfa versus ESAs alone (Auerbach 2010). The study by Bastit et al included 398 non‐myeloid cancer patients with CIA comparing IV ferric gluconate (or sucrose) or oral ferric gluconate (or sucrose) as supplements to darbepoetin alfa versus ESAs alone (Bastit 2008). The trial by Beguin et al was a joint public‐ and industry‐funded trial including 102 autologous hematopoietic cell transplantation recipients with lymphoid malignancies comparing oral iron sucrose as supplements to darbepoetin alfa versus ESAs alone (Beguin 2008). The study by Henry et al included 187 participants with CIA comparing sodium ferric gluconate or oral ferrous sulfate as supplements to epoetin alfa versus ESAs alone (Henry 2007a; Henry 2007b). The study by Pedrazzoli et al included 149 participants with CIA comparing sodium ferric gluconate as supplements to darbepoetin alfa versus ESAs alone (Pedrazzoli 2008). The study by Steensma et al included 502 participants with CIA comparing sodium ferric gluconate or oral ferrous sulfate as supplements to darbepoetin alfa versus ESAs alone (Steensma 2011a; Steensma 2011b). The study by Bellet et al included 375 CIA patients comparing iron sucrose as a supplement to darbepoetin alfa versus ESAs alone (Bellet 2007).
Setting
All the included studies were funded by the industry.
Participants
The participants in the study by Auerbach et al were with CIA and Hb ≤ 105 g/dL; ferritin ≤ 450 pmol/L or ≤ 675 pmol/L; TSAT ≤ 19%; ECOG performance status ≤ 2 (Auerbach 2004a). The mean age of participants was 64.7 years. The study by Auerbach et al included participants who were ≥ 18 years old and had non‐myeloid cancer, CIA (Hb ≤ 10 g/dL), and no iron deficiency, and excluded patients if they had absolute iron deficiency (TSAT < 15% and serum ferritin < 10 ng/mL). The mean age was about 62 years, and the most common tumor types were gastrointestinal, breast, and lung (Auerbach 2010).The participants in the study by Bastit et al included men and women ≥ 18 years old with anemia (Hb <11 g/dL within 24 hours before randomization) and non‐myeloid malignancy. Participants were required to have an ECOG performance status score of 0 to 2, adequate renal and liver function, and eight weeks of cytotoxic chemotherapy planned (Bastit 2008). The study by Beguin et al included autologous hematopoietic cell transplant recipients with lymphoid malignancies (Beguin 2008). The study by Henry et al included participants with CIA (Hb < 11 g/dl; serum ferritin > 100 ng/ml or TSAT > 15%) scheduled to receive chemotherapy and epoetin alfa (40,000 U subcutaneously weekly) (Henry 2007a). The participants in the study by Pedrazzoli et al were with lung, gynecologic, breast, and colorectal cancers and ≥ 12 weeks of planned chemotherapy. Participants were required to have Hb ≤ 11 g/L and no absolute or functional iron deficiency (Pedrazzoli 2008). The participants in the study by Steensma et al were with < 11 g/dL Hb undergoing chemotherapy for non‐myeloid malignancies (Steensma 2011a). The study by Bellet et al included participants older than 18 years with CIA (Hb ≤ 10 g/dL) who had completed eight prior weeks of ESA therapy (Bellet 2007).
Interventions
All of the studies had at least one IV iron arm; gluconate and sucrose were used in 4 of 12 comparisons in each case and sulfate and dextran were used in 3 of 12 comparisons in each case. Only three studies included an oral iron arm (all iron sulfate). In terms of type of ESA in the control arm, half of the comparisons included darbepoetin and half included epoetin.
Outcomes
None of the included RCTs reported data on overall survival. All of the studies had response to iron as one of the primary outcomes. See Characteristics of included studies for details.
Excluded studies
After assessing full texts of 21 studies, we excluded 13 trials for a variety of reasons. Four studies, (Demarteau 2007, Lerchenmueller 2006, Pinter 2007, and Vandebroek 2006), were duplicate publications of the study by Bastit et al (Bastit 2008), and one study, (Auerbach 2008), was a duplicate publication of the study by Auerbach et al (Auerbach 2010). Three studies were not RCTs (Agrawal 2005; Doherty 2008; Savonije 2006). Four studies did not employ ESAs (Dangsuwan 2010; Kim 2007; Athibovonsuk 2013; Hedenus 2014). Three studies had participants who were not diagnosed with CIA (Birgegard 2006; Hedenus 2007; Ferrari 2012), and one study assessed safety and efficacy of oral lactoferrin (Maccio 2010). See Characteristics of excluded studies for details.
Risk of bias in included studies
We have presented the results of the 'Risk of bias' assessment in Figure 2. The studies by Beguin et al and Bellet et al were published as meeting abstracts (Beguin 2008; Bellet 2007). The abstract of the study by Bellet et al lacked the details needed for us to assess the methodological quality of this study (Bellet 2007).

Risk of bias summary: Review authors' judgments about risk of bias in each included study.
Allocation
Only 37% (3/8) of included studies reported the method of generation of randomization sequence (Auerbach 2010; Beguin 2008; Steensma 2011a). In the other trials, the authors described the study as "randomized," although the information required to assess the adequacy of methods used for generation of randomization sequence was not reported (Auerbach 2004a; Bastit 2008; Henry 2007a; Pedrazzoli 2008). However, the allocated intervention assignment was adequately concealed in 87% (7/8) of trials. In two of these seven trials the authors explicitly reported the method used for allocation concealment: “interactive voice response system” in Bastit 2008 and “by calling the central randomization center” in Steensma 2011a. In summary, considering the quality of evidence for the generation of randomization sequence and methods of allocation concealment together, we judged there to be moderate risk of selection bias.
Blinding
Five trials were described as "open‐label," suggesting that participants, caregivers, outcome assessors, or data analysts were probably aware of the arm to which participants were allocated (Auerbach 2004a; Bastit 2008; Bellet 2007; Henry 2007a; Pedrazzoli 2008). In the study by Auerbach et al, the control arm was blinded, whereas the IV iron arm was open label (Auerbach 2010). Furthermore, this study reported that the participants were assigned blinded boxes of study medication using box numbers, which were recorded and reconciled. The study was blinded while ongoing and unblinded after all participants had completed the study. However, it was unclear whether or not the investigators were blinded. Hence we interpreted this as a unclear risk of performance and detection bias. Although it appeared that there was evidence of blinding procedures in one study in which "patients and investigators were blinded to assignment of oral iron or oral placebo" (Steensma 2011a), trial authors also stated that "for practical reasons, assignment to IV iron versus an oral product was not blinded," which in our opinion could potentially increase risk of bias in the results.
Incomplete outcome data
Sixty‐two per cent (5/8) of the trials had low risk of bias with respect to incomplete outcome reporting (Auerbach 2004a; Auerbach 2010; Bastit 2008; Pedrazzoli 2008; Steensma 2011a). Two trials were published as abstracts and had insufficient information for us to assess whether risk of attrition bias existed (Beguin 2008; Bellet 2007). In the trial by Bastit et al, the authors reported that efficacy data were analyzed according to the ITT principle (Bastit 2008). Most participants (67% in the IV iron group, 76% in the control group) completed this study. The authors clearly described the number of and reasons for withdrawals and dropouts. Importantly, the reasons for withdrawal (death, adverse events, disease progression, consent withdrawal, protocol deviations, non‐compliance) were similar across study groups. Hence, we judged this study to have low risk of attrition bias. In the trial by Henry et al, the authors reported that “except for number of transfusions and patients receiving transfusions,” analysis of primary and secondary efficacy endpoints were based on “evaluable population,” that is performed per protocol (Henry 2007a). In addition, the imputation method used, that is “last observed data recorded for each parameter before receiving a transfusion were carried forward through the endpoint,” could potentially bias the findings. Hence, we judged the risk of attrition bias for this trial to be high. Overall, the risk of attrition bias was low in the included studies.
Selective reporting
We assessed included studies for completeness of reporting for both benefits as well as treatment‐related harms associated with 'ESAs plus iron' versus 'ESAs alone' groups. All included studies reported the benefits and harms of the interventions in the way specified in the methods section of trial publications. It is important to note that we did not have access to trial protocols, and hence could not assess the trial publications for selective reporting of outcomes. Overall, the risk of reporting bias was low in the included studies.
Other potential sources of bias
Two trials were published as abstracts and had insufficient information for us to assess whether an important risk of bias existed (Beguin 2008; Bellet 2007). Each of the remaining trials had evidence of low risk of bias with respect to other potential sources of bias. For example, prespecified sample size, alpha error, beta error (power), and delta, or both, were reported. In the trial by Auerbach et al, we noted that data on alpha, beta errors, sample size calculation and delta were not reported. Moreover, the authors stated in the methods section that "patients could receive oral iron if they were not randomized to IV iron supplementation." However, the authors did not report the number of participants in the 'ESAs only arm' who (may have) received oral iron supplementation (Auerbach 2010). Overall, the risk of other bias was low in the included studies.
Effects of interventions
The meta‐analysis included 1008 participants in the ESAs plus iron group and 704 participants in the ESAs alone group from seven studies (11 comparisons). The study by Bellet et al was published as an abstract, and the data were not reported in a manner useful for meta‐analysis (Bellet 2007).
Benefits of iron supplementation
Overall survival
None of the included RCTs reported data on overall survival. We were thus unable to perform meta‐analysis on this outcome. Only Auerbach et al acknowledged that their study was not designed both in follow‐up duration and power to detect survival benefit (Auerbach 2004a).
Hematopoietic response
We extracted data from seven studies (11 comparisons; 1712 participants). Hematopoietic response rate was statistically significantly superior in participants receiving iron supplementation to ESAs than participants receiving ESAs alone in the management of CIA (risk ratio (RR) 1.17, 95% confidence interval (CI) 1.09 to 1.26; P < 0.0001) (Analysis 1.1). There was no heterogeneity among these trials (I² = 15%, P = 0.30).
RBC transfusions
We extracted data from seven studies (11 comparisons; 1719 participants). Significantly fewer participants treated with iron supplementation to ESAs required RBC transfusions compared to participants treated with ESAs alone (RR 0.74, 95% CI 0.60 to 0.92; P = 0.007) (Analysis 1.2). There was no heterogeneity among these trials (I² = 0%, P = 0.90).
Median time to hematopoietic response
We extracted data from five studies (seven comparisons; 1042 participants). We found no differences in the median time to hematopoietic response between participants receiving iron supplementation to ESAs versus those who received ESAs alone (HR 0.93, 95% CI 0.67 to 1.28; P = 0.65) (Analysis 1.3). There was considerable heterogeneity among these trials (I² = 86%, P < 0.00001).
Mean change in Hb level
We extracted data from three studies (seven comparisons; 827 participants). Hb level was statistically significantly superior in participants receiving iron supplementation to ESAs than in participants receiving ESAs alone in the management of CIA (mean difference (MD) 0.48, 95% CI 0.10 to 0.86; P = 0.01) (Analysis 1.4). There was substantial heterogeneity among these trials (I² = 69%, P = 0.003).
Quality of life
Quality of life data were extractable from three studies (four comparisons; 1124 participants). We found no differences in terms of quality of life between participants receiving iron supplementation to ESAs versus those who received ESAs alone (standardized mean difference (SMD) 0.01, 95% CI ‐0.10 to 0.12; P = 0.88) (Analysis 1.5). There was no heterogeneity among these trials (I² = 0%, P = 0.54).
Adverse events
Three studies reported data on thromboembolic events. Other adverse events cited in the studies included nausea, vomiting, asthenia, dyspnea, diarrhea, leukopenia, and constipation; see Table 1 for details regarding adverse events reported by each study. However, data on these adverse events were reported mostly for the participants enrolled in the intervention arm only, and hence were inadequate for meta‐analysis. Moreover, in most of the included studies adverse events were not reported as events per participant, and thus were not useful for meta‐analysis.
| Study ID | Morbidities | Rx group 1 N (%) | Rx group 2 N (%) | Rx group 3 N (%) | Treatment‐related mortality |
| Auerbach 2004 | Participants with any AEs
| ESAs + TDI iron N = 41 | ESAs + bolus iron N = 37 | ESAs + oral iron N = 43 | Zero events |
| 3 (7) | 3 (8) | 1 (2) | |||
| Auerbach 2010 | ‐ | ‐ | ESAs + IV iron N = 117 | ESAs alone N = 121 | Zero events |
| Participants with any AEs | ‐ | 104 (89) | 110 (91) | ||
| Participants with serious AEs | ‐ | 41 (35) | 45 (37) | ||
| Participants with treatment‐related AEs | ‐ | 14 (12) | 0 (0) | ||
| Participants with serious treatment‐related AEs | ‐ | 3 (3)a | 0 (0) | ||
| Participants with AEs leading to study discontinuation | ‐ | 12 (10) | 14 (12) | ||
| Cardiovascular and thromboembolic events | ‐ | 18 (15) | 19 (16) | ||
| Embolism/thrombosis | ‐ | 8 (7) | 10 (8) | ||
| Arrhythmias | ‐ | 9 (8) | 7 (6) | ||
| Congestive heart failure | ‐ | 3 (3) | 1 (1) | ||
| Myocardial infarction/artery disorders | ‐ | 2 (2) | 2 (2) | ||
| Cerebrovascular accident | ‐ | 1 (1) | 0 (0) | ||
| Deaths on study (any reason)b | ‐ | 8 (7) | 13 (11) | ||
| Bastit 2008 | ‐ | ‐ | ESAs + IV iron N = 203 | ESAs alone N = 193 | Not reported |
| No. of participants reporting specific AEs | ‐ | 21 (10) | 26 (13) | ||
| Embolism/thrombosis, arterial and venous | ‐ | 12 (6) | 12 (6) | ||
| Myocardial infarction, ischemic and coronary artery disease | ‐ | 3 (1) | 1 (1) | ||
| Hypertension | ‐ | 2 (1) | 5 (3) | ||
| Congestive heart failure | ‐ | 1 (0) | 3 (2) | ||
| Cerebrovascular accident | ‐ | 0 (0) | 0 (0) | ||
| Deaths on study (any reason) | ‐ | 21 (10) | 15 (8) | ||
| Beguin 2008 | Data are not reported. Authors state that there was no difference in rates of thromboembolic events or other complications among the groups | Not reported | |||
| Bellet 2007 | A total of 375 participants were enrolled in this phase III RCT. However, the number of participants randomized to each study arm is not reported. Three serious but non‐life‐threatening iron sucrose‐related AEs were observed, including 1 case of significant, transient hypotension in a female weighing 50 kg | ‐ | IV iron + ESAs | ESAs alone | Not reported |
| Henry 2007c,d | ‐ | ‐ | ESAs + IV iron N = 63 | ESAs + oral iron N = 61 | Not reported |
| Constipation | ‐ | 2 (3.2) | 11 (18) | ||
| Nausea | ‐ | 2 (3.2) | 3 (4.9) | ||
| Dyspepsia | ‐ | 1 (1.6) | 3 (4.9) | ||
| Asthenia | ‐ | 1 (1.6) | 2 (3.3) | ||
| Anorexia | ‐ | 0 | 2 (3.3) | ||
| Abdominal pain | ‐ | 0 | 2 (3.3) | ||
| Diarrhea | ‐ | 1 (1.6) | 0 | ||
| Hypotension | ‐ | 1 (1.6) | 0 | ||
| Vasodilation | ‐ | 1 (1.6) | 0 | ||
| Angina pectoris | ‐ | 1 (1.6) | 0 | ||
| Tremor | ‐ | 1 (1.6) | 0 | ||
| Pain at injection site | ‐ | 1 (1.6) | 0 | ||
| Vomiting | ‐ | 0 | 1 (1.6) | ||
| Back pain | ‐ | 0 | 1 (1.6) | ||
| Dehydration | ‐ | 0 | 1 (1.6) | ||
| Dizziness | ‐ | 0 | 1 (1.6) | ||
| Taste perversion | ‐ | 0 | 1 (1.6) | ||
| Melena | ‐ | 0 | 1 (1.6) | ||
| Tinnitus | ‐ | 0 | 1 (1.6) | ||
| Pedrazzoli 2011e | ‐ | ‐ | ESAs + IV iron N = 73 | ESAs only N = 76 | Zero events |
| Participants with AEs | ‐ | 55 (75.3) | 49 (64.5) | ||
| Participants with serious AEs | ‐ | 8 (11) | 10 (13.2) | ||
| Participants with treatment‐related AEs | ‐ | 7 (9.6) | 6 (7.9) | ||
| Vascular/thromboembolic events | ‐ | 3 (4.1) | 2 (2.6) | ||
| Fatal AEs: all | ‐ | 4 (5.5) | 3 (3.9) | ||
| Fatal AEs: treatment related | ‐ | 0 (0) | 0 (0) | ||
| Steensma 2011f | Worst toxicity reported (toxicities were graded according to the National Cancer Institute Common Terminology Criteria of Adverse Events) | ESAs + IV iron N = 164 | ESAs + oral iron N = 162 | ESAs + placebo N = 163 | Zero events |
| None | 12 (7) | 15 (9) | 22 (13) | ||
| Mild | 28 (17) | 40 (25) | 33 (20) | ||
| Moderate | 35 (21) | 35 (22) | 33 (20) | ||
| Severe | 52 (32) | 42 (26) | 49 (30) | ||
| Life‐threatening | 29 (18) | 24 (15) | 23 (14) | ||
| Lethal (includes participants who died while on study regardless of causality) | 8 (5) | 6 (4) | 3 (2) | ||
aEpisodes of transient anaphylactoid reactions occurred in two participants soon after initiating IV iron, but these participants recovered uneventfully without hospitalization; one participant in this group had enlarged uvula, lip swelling, and dyspnea (symptoms resolved).
bDeaths on study or within 30 days after the last dose of study drug.
cParticipants may have experienced more than one AE.
dSix participants discontinued the study due to drug‐related AEs (sodium ferric gluconate complex, N = 2 (one angina, one nausea); oral iron, N = 4 (all gastrointestinal))
eSeven participants, four on DA/iron and three on DA only, died during the study or within four weeks after the last administered dose of DA. Deaths were ascribed to disease progression, two cases in each group; and respiratory complications, one in the DA‐only group (infection), two in the DA/iron group (bleeding in one, acute respiratory distress syndrome in one) not related to study drugs administration.
f7% (95% CI 3% to 12%) of participants in the IV iron arm discontinued study as a result of AEs versus 3% (95% CI 1% to 7%) for oral iron and 5% (95% CI 2% to 9%) for oral placebo. Study authors also stated that no individual AE was significantly more common in the IV iron arm compared with the other arms; instead, the overall difference was a result of small differences in several uncommon AEs, including dyspnea, back pain, and hypotension, which may have been caused by premedication rather than the IV iron product itself. Other AEs associated with IV iron in past studies, including myalgia, arthralgia, abdominal pain, pruritus, rash, nausea, vomiting, or fever, were not more common than with oral placebo or oral iron in this study.
AE = adverse event
CI = confidence interval
DA = darbepoietin
ESA = erythropoiesis‐stimulating agent
IV = intravenous
RCT = randomized controlled trial
TDI = total dose infusion
Thromboembolic events
We extracted data from three studies (three comparisons; 783 participants). The incidence of thromboembolic events in participants treated with iron supplementation to ESAs did not differ from that in participants treated with ESAs alone (RR 0.95, 95% CI 0.54 to 1.65; P = 0.85) (Analysis 1.6). There was no heterogeneity among these trials (I² = 0%, P = 0.82).
Treatment‐related mortality
Four studies reported data on treatment‐related mortality (six comparisons; 997 participants). The incidence of treatment‐related mortality was zero in these four studies. Hence, we were not able to conduct meta‐analysis of these data.
Subgroup analyses
Hematopoietic response
-
Route of iron administration: RCTs in which IV iron was used showed statistically significant evidence for a difference with iron supplementation versus ESAs alone (RR 1.20, 95% CI 1.10 to 1.31; P < 0.00001) compared with oral iron supplementation (RR 1.04, 95% CI 0.87 to 1.24; P = 0.68) for the outcome of hematopoietic response. However, the difference between the subgroups was not statistically significant (test of interaction: P = 0.16) (Analysis 2.2).
-
Type of iron: RCTs in which dextran (RR 1.76, 95% CI 1.01 to 3.09; P = 0.05), gluconate (RR 1.17, 95% CI 1.08 to 1.27; P = 0.0002) were used showed statistically significant evidence for a difference with iron supplementation versus ESAs alone compared with RCTs in which sucrose iron (RR 1.14, 95% CI 0.97 to 1.33; P = 0.10) and sulfate iron was used (RR 1.04, 95% CI 0.87 to 1.24; P = 0.68) for the outcome of hematopoietic response. However, the difference between the subgroups was not statistically significant (test of interaction: P = 0.31) (Analysis 2.1).
-
Total iron dose: We investigated whether the total iron dose as a covariate contributed to the increase in hematopoietic response (on the log scale) for oral and IV iron combined and IV iron alone. For oral and IV iron combined, meta‐regression showed that hematopoietic response increased by 108% per 1000 unit increase in iron dosage (RR 2.08, 95% CI 0.98 to 4.39; P = 0.055) given on the log scale. The iron dosage explained 9.6% of between‐study variance in both Knapp‐Hartung modified and unmodified analyses. Both the Knapp‐Hartung modified analysis (RR 2.08, 95% CI 0.98 to 4.39; P = 0.055) and Knapp‐Hartung unmodified analysis (RR 2.08, 95% CI 1.18 to 3.67; P = 0.012) produced similar results. Meta‐regression results indicated that the beneficial effect of iron on hematopoietic response may not be a function of dose of iron. For IV iron alone, meta‐regression showed that hematopoietic response increased by 168% per 1000 unit increase in iron dosage (RR 2.50, 95% CI 1.03 to 6.06; P = 0.0045) given on the log scale (Figure 3). The IV iron dosage explained 30.8% of between‐study variance in both Knapp‐Hartung modified and unmodified analyses. Both the Knapp‐Hartung modified analysis (RR 2.50, 95% CI 1.03 to 6.06; P = 0.045) and Knapp‐Hartung unmodified analysis (RR 2.50, 95% CI 1.27 to 4.90; P = 0.008) produced similar results. Meta‐regression results indicated that the beneficial effect of IV iron on hematopoietic response may not be a function of dose of iron.
-
Type of ESA: The hematopoietic response estimates for iron supplementation to ESAs versus ESAs alone did not statistically significantly differ based on type of ESA (Analysis 2.3).

Meta‐regression: total IV iron dose and hematopoietic response
Median time to hematopoietic response
-
Route of iron administration: RCTs in which IV iron (hazard ratio (HR) 0.88, 95% CI 0.60 to 1.29; P = 0.52) and oral iron (HR 1.24, 95% CI 0.99 to 1.56; P = 0.06) were used showed no evidence for difference between iron supplementation to ESAs over ESAs alone for the outcome of median time to hematopoietic response (Analysis 2.4). However, we noted that the pooled point estimate for trials using IV iron for this outcome was in favor of ESAs plus iron compared with pooled point estimate of trials using oral iron (test of interaction: P = 0.13).
-
Type of iron: RCTs in which dextran (HR 0.95, 95% CI 0.36 to 2.52; P = 0.92), sucrose iron (HR 1.15, 95% CI 0.60 to 2.21; P = 0.67), and sulfate iron (HR 1.24, 95% CI 0.99 to 1.56; P = 0.06) were used showed no evidence for difference between iron supplementation to ESAs over ESAs alone compared with RCTs in which gluconate (HR 0.78, 95% CI 0.65 to 0.94; P = 0.010) was used for the outcome of median time to hematopoietic response (test of interaction: P = 0.02) (Analysis 2.5).
-
Type of ESA: The hematopoietic response estimates for iron supplementation to ESAs versus ESAs alone did not statistically significantly differ based on type of ESA (Analysis 2.6).
Mean change in Hb level
-
Route of iron administration: RCTs in which IV iron was used showed statistically significant evidence for a difference with iron supplementation to ESAs versus ESAs alone (MD 0.84, 95% CI 0.21 to 1.46; P = 0.009) compared with oral iron supplementation (MD 0.07, 95% CI ‐0.19 to 0.34; P = 0.59) for the outcome of mean change in Hb level (test of interaction: P = 0.03) (Analysis 2.7).
-
Type of iron: RCTs in which dextran (MD 1.55, 95% CI 0.62 to 2.47; P = 0.001) was used showed evidence for a difference with iron supplementation to ESAs versus ESAs alone compared with RCTs in which gluconate (MD 0.54, 95% CI ‐0.15 to 1.22; P = 0.12) and sulfate iron (MD 0.07, 95% CI ‐0.19 to 0.34; P = 0.59) was used for the outcome of mean change in Hb level (test of interaction: P = 0.007) (Analysis 2.8).
-
Type of ESA: RCTs in which epoetin was used showed statistically significant evidence for a difference with iron supplementation to ESAs versus ESAs alone (MD 0.77, 95% CI 0.25 to 1.29; P = 0.004) compared with darbepoetin use (MD 0.10, 95% CI ‐0.13 to 0.33; P = 0.38) for the outcome of mean change in Hb level (test of interaction: P = 0.02) (Analysis 2.9).
We also attempted to conduct subgroup analyses based on cancer type, cancer stage, duration of follow‐up, type of chemotherapy, and study setting (single‐ versus multicenter study). However, data were not extractable for these outcomes (see below) to facilitate meta analysis.
-
Cancer type: Three studies explicitly reported cancer type. However, data were not extractable to facilitate meta‐analysis; that is Henry et al reported the number of participants with adenocarcinoma, squamous cell carcinoma, and other histology (Henry 2007a), whereas Steensma et al reported tumor types including hematologic neoplasm, solid tumor, or both (Steensma 2011a). Auerbach et al reported that participants had a histologic diagnosis of cancer but did not specify the type of cancer (Auerbach 2004a).
-
Cancer stage: Two studies reported data on cancer stage. However, data were not extractable for meta‐analysis; that is Henry et al reported number of participants with stage I, II, III, IV, or others (Henry 2007a), whereas Pedrazzoli et al reported the combined number of participants with cancer stages I/II/III (Pedrazzoli 2008).
-
Duration of follow‐up: Three studies reported data on duration of follow‐up (Auerbach 2004a; Henry 2007a; Pedrazzoli 2008). However, data were not extractable for meta‐analysis.
-
Type of chemotherapy: Only one study reported data on type of chemotherapy (Bastit 2008), thus meta‐analysis was not possible.
-
Single‐ versus multicenter study: All the included studies were multicenter, thus a subgroup analysis was not possible.
Sensitivity analysis according to methodological quality of reporting
We conducted sensitivity analyses according to each risk of bias domain for all outcomes. The results did not change for any outcome. We have presented the sensitivity analyses for the outcome of hematopoietic response for illustration purpose (Analysis 3.1; Analysis 3.2; Analysis 3.3; Analysis 3.4; Analysis 3.5; Analysis 3.6).
Sensitivity analysis according to definition(s) of Hb increase
We conducted sensitivity analyses according to definition(s) of Hb increase for all outcomes. The majority of the included studies defined Hb increase as hematopoietic response (increasing Hb by 2 g/dL from baseline or increase to Hb 12 g/dL without transfusion) (Auerbach 2004a; Auerbach 2010; Bastit 2008; Bellet 2007; Pedrazzoli 2008; Steensma 2011a; Steensma 2011b). The study by Beguin et al reported number of complete correctors (that is participants reaching Hb > 13 g/dL) before day 126 in each arm in the study (Beguin 2008). The study by Henry et al employed increasing Hb by 2 g/dL from baseline (hematologic response) as the outcome (Henry 2007a). We conducted sensitivity analyses according to the definition(s) of Hb increase for all outcomes. The results did not change for any outcome. We have presented the sensitivity analyses for the outcome of hematopoietic response for illustration purpose (Analysis 3.7).
Sensitivity analysis according to the baseline serum ferritin, TSAT, and Hb for hematopoietic response
Meta‐regression showed that hematopoietic response decreased by 0.2% per one unit increase in mean baseline serum ferritin level (RR 0.998, 95% CI 0.997 to 0.999; P = 0.009). The mean baseline serum ferritin level explained 75.8% of between‐study variance for the outcome of hematopoietic response in both Knapp‐Hartung modified and unmodified analyses (Figure 4). The adjusted R² was negative for the mean baseline TSAT (R² = ‐128.5%) but positive for Hb values (R² = 56.7%), indicating that TSAT explained little between‐study variance in hematopoietic response, and Hb level did.

Meta‐regression: baseline serum ferritin and hematopoietic response.
Meta‐analysis allowing for missing data
We conducted meta‐analyses using the metamiss command in the STATA software for the outcomes of hematopoietic response and RBC transfusion. Specifically, we employed the available case and imputed case analyses (impute as failure: ICA‐0; impute as success: ICA‐1; best‐case: ICA‐b (missing=success in E, failure in C) and worst‐case: ICA‐w). The results did not change for any analysis for both the outcomes.
Post‐hoc analyses
Effect of iron supplementation on mean change in serum ferritin level
We extracted data from four studies (six comparisons; 1010 participants). Serum ferritin levels were statistically significantly superior in participants receiving iron supplementation to ESAs than in participants receiving ESAs alone in the management of CIA (MD 253.02, 95% CI 84.30 to 421.73; P = 0.003) (Analysis 1.7). There was considerable heterogeneity among these trials (I² = 90%, P < 0.00001).
RCTs in which IV iron was used showed evidence for a difference with iron supplementation to ESAs versus ESAs alone compared with oral iron supplementation for the outcome of mean change in serum ferritin level (test of interaction: P = 0.00005) (Analysis 2.10). RCTs in which dextran and gluconate were used showed evidence for a difference with iron supplementation to ESAs versus ESAs alone compared with RCTs in which sulfate and sucrose were used (test of interaction: P < 0.00001) (Analysis 2.11). The mean change in serum ferritin estimates for iron supplementation to ESAs versus ESAs alone did not statistically significantly differ based on type of ESAs (test of interaction: P = 0.95) (Analysis 2.12).
Effect of iron supplementation on mean change in TSAT level
We extracted data from three studies (five comparisons; 908 participants). TSAT levels were statistically significantly superior in participants receiving iron supplementation to ESAs than in participants receiving ESAs alone in the management of CIA (MD 4.96, 95% CI 0.94 to 8.99; P = 0.02) (Analysis 1.8). There was substantial heterogeneity among these trials (I² = 62%, P = 0.03).
The mean change in TSAT estimates for iron supplementation to ESAs versus ESAs alone did not statistically significantly differ based on route of iron administration (test of interaction: P = 0.86) (Analysis 2.13). Similarly, mean change in TSAT estimates for iron supplementation to ESAs versus ESAs alone did not statistically significantly differ based on type of iron (test of interaction: P = 0.93) (Analysis 2.14). RCTs in which epoetin was used showed evidence for a difference with iron supplementation to ESAs versus ESAs alone compared with RCTs in which darbepoetin was used for the outcome of mean change in TSAT level (test of interaction: P = 0.04) (Analysis 2.15).
Discusión
Resumen de los resultados principales
Esta revisión sistemática incluyó ocho ECA financiados por la industria. Ninguno de los estudios incluidos informó datos sobre los supervivencia general. Los resultados de este metanálisis muestran un efecto beneficioso de la administración de suplementos de hierro con los AEE para lograr la respuesta hematopoyética y reducir el número de transfusiones de eritrocitos en los pacientes con AIQ. En términos absolutos, si se supone un riesgo inicial del 35% al 80% para la respuesta hematopoyética sin tratamiento, entre siete y 16 pacientes con AIQ deberían ser tratados para lograr la respuesta hematopoyética en un paciente. De manera similar, si se supone un riesgo inicial del 7% al 40% para la transfusión de eritrocitos sin tratamiento, entre diez y 57 pacientes con AIQ deberían ser tratados para evitar una transfusión de eritrocitos en un paciente. Estos resultados no indicaron pruebas de una diferencia en la mediana del tiempo hasta la respuesta hematopoyética y la calidad de vida entre los pacientes con AIQ que recibieron suplementos de hierro con los AEE versus los que recibieron AEE solos. Se encontró una mejoría considerable en los parámetros del metabolismo del hierro, como lo indica el borde superior de los niveles de Hb de estudio en comparación con los parámetros iniciales. No hubo muertes debido al tratamiento entre los participantes que recibieron AEE más hierro versus AEE solos. Sin embargo, los datos de mortalidad relacionados con el tratamiento solamente se informaron en cuatro estudios. La administración de hierro se toleró bien, sin diferencias significativas en los eventos tromboembólicos observados ni en otros eventos adversos entre los participantes que recibieron AEE más hierro versus AEE solos.
Compleción y aplicabilidad general de las pruebas
Esta revisión sistemática incluyó ocho ensayos con 12 comparaciones que reclutaron a 2087 participantes. No se identificaron estudios que compararan hierro solo versus AEE solos que analizaran el tratamiento de los pacientes con diagnóstico de AIQ. Dos ensayos se publicaron como resúmenes (Beguin 2008; Bellet 2007), y los datos del ensayo de Bellet y cols. no estaban disponibles para el metanálisis (Bellet 2007). El estudio realizado por Bellet y cols. incluyó 375 pacientes con AIQ y comparó sacarosa de hierro como suplemento con darbapoyetina alfa versus AEE solos (Bellet 2007). Este estudio informó el cambio en los niveles de Hb, otros índices del hierro, la calidad de vida y los eventos adversos, pero los datos informados no fueron apropiados para el análisis estadístico. En este estudio no se informó la distribución de los participantes en los brazos individuales de estudio. Las conclusiones de este estudio coincidieron con la mayoría de los estudios incluidos que analizaron la función del hierro IV en el tratamiento de la AIQ; es decir, en este estudio la sacarosa de hierro IV aumentó significativamente los niveles de Hb y las reservas de hierro y se toleró bien en incrementos de dosis de hasta 500 mg en los pacientes con AIQ tratados con AEE. Todos los estudios identificados e incluidos en esta revisión sistemática analizan suficientemente la función del hierro en el tratamiento de los pacientes con diagnóstico de AIQ. En general, los resultados de esta revisión sistemática tienen aplicación directa para la práctica clínica en los pacientes con diagnóstico de AIQ. Es de señalar que los estudios incluidos tuvieron una duración del seguimiento más corta (hasta 20 semanas), y no se conocen los efectos a largo plazo de la administración de suplementos de hierro. Específicamente, con el aumento de los riesgos conocidos de los tratamientos con AEE (Bohlius 2009; Bohlius 2014; Tonia 2012), se necesitan estudios adicionales que analicen los efectos a largo plazo de la administración de suplementos de hierro sobre la morbilidad y la mortalidad (entre los pacientes que reciben no solamente hierro, sino también eritrocitos, ya que también contienen hierro) debido a los mayores niveles de hierro o ferritina.
Calidad de la evidencia
Se evaluó la calidad de los ensayos incluidos según los dominios de calidad descritos anteriormente y que se presentan en la Figura 2. La mayoría de los ensayos incluidos estuvo libre de sesgo de selección, informe selectivo y otros sesgos. La mayoría de los estudios incluidos informó los análisis según el principio de intención de tratar, pero en su mayoría los estudios incluidos fueron abiertos y tuvieron alto riesgo de sesgo de realización y detección.
Ninguno de los ECA incluidos informó datos sobre la supervivencia general, por lo que no fue posible realizar un metanálisis sobre este resultado. Auerbach y cols. reconocieron que su estudio no se diseñó con respecto a la duración del seguimiento y al poder estadístico para detectar un efecto beneficioso sobre la supervivencia (Auerbach 2004a). La calidad general de las pruebas para la respuesta hematopoyética fue alta. La vía de administración del hierro (oral versus IV) explicó la heterogeneidad observada. La calidad general de las pruebas para la necesidad de transfusión de eritrocitos fue moderada, ya que las estimaciones agrupadas tuvieron intervalos de confianza amplios. Dos estudios no informaron por separado el número de transfusiones de eritrocitos, pero en su lugar informaron el número total de transfusiones (Auerbach 2004a; Henry 2007a). Al retirar estos estudios del metanálisis para el resultado necesidad de transfusión de eritrocitos no cambió la estimación agrupada general (favoreció al agregado de hierro a los AEE). La calidad general de las pruebas para el cambio en el nivel de Hb y el tiempo hasta la respuesta hematopoyética fue baja, ya que las estimaciones agrupadas tuvieron una gran variación y hubo heterogeneidad significativa. La calidad general de las pruebas para la calidad de vida fue alta. Sin embargo, es importante observar que los datos de la calidad de vida se informaron en cuatro estudios (Auerbach 2004a; Auerbach 2010; Bastit 2008; Steensma 2011a), pero solamente fue posible extraerlos de tres (Auerbach 2010; Bastit 2008; Steensma 2011a). En el estudio de Auerbach y cols. Auerbach 2004a), la calidad de vida se midió con la escala analógica lineal de 100 mm (LASA) del nivel de energía, las actividades cotidianas y la calidad de vida general. Los participantes que recibieron suplementos de hierro IV tuvieron una calidad de vida considerablemente mejor que los que recibieron AEE solos (Auerbach 2004a). Sin embargo, los datos no eran extraíbles para el metanálisis. Los estudios de Bastit y cols. (Bastit 2008),y Auerbach y cols. (Auerbach 2010), utilizaron la escala Functional Assessment of Cancer Therapy‐Fatigue (FACT‐F), mientras que el estudio realizado por Steensma y cols., (Steensma 2011a), utilizó la escala Functional Assessment of Cancer Therapy‐Anemia (FACT‐An) para evaluar la calidad de vida. Estos tres estudios informaron datos de una manera que podía ser utilizada para el metanálisis. La calidad general de las pruebas para el riesgo de coágulos sanguíneos en las venas fue moderada, ya que la estimación agrupada tuvo intervalos de confianza amplios. La calidad general de las pruebas para las muertes relacionadas con el tratamiento fue alta. Sin embargo, sólo cuatro de los ocho estudios incluidos informaron estos datos. No fue posible extraer los datos del tipo de cáncer, el estadio del cáncer, la duración del seguimiento y el tipo de quimioterapia para facilitar el metanálisis de subgrupos planificado.
Sesgos potenciales en el proceso de revisión
No se encontraron problemas metodológicos en la preparación de la revisión que pudieran implicar riesgo de sesgo. Existe un riesgo potencial de sesgo de publicación. Si las actualizaciones futuras de la revisión incluyen más de diez ECA, se evaluará el sesgo de publicación para cada resultado y se incluirá un gráfico en embudo (funnel plot) según las guías Cochrane. Fue posible identificar ocho ECA relevantes para la pregunta de revisión; dos se publicaron como resumen de reunión (Beguin 2008; Bellet 2007). Fue posible extraer datos relevantes del estudio realizado por Beguin y cols., pero los datos informados en el estudio de Bellet y cols. no fueron apropiados para el análisis estadístico. No obstante, las conclusiones de este estudio coincidieron con la mayoría de los estudios incluidos que analizaron la función del hierro IV para el tratamiento de la AIQ (Bellet 2007). Sin embargo, por razones desconocidas, este estudio no se publicó como texto completo y, por lo tanto, no fue posible acceder a los datos y a los hallazgos completos de este estudio. En general, el número de eventos adversos fue escaso en los estudios incluidos. JUAN Solamente cuatro de cada ocho estudios informaron datos sobre la mortalidad relacionada con el tratamiento, y la mayoría de los estudios no informó los eventos adversos de una manera útil para el metanálisis. Los análisis de metarregresión que utilizaron la ferritina sérica inicial, la TSAT y la Hb se basan en datos agrupados solamente y, por lo tanto, propensos al sesgo ecológico.
Acuerdos y desacuerdos con otros estudios o revisiones
Es bien conocido que aproximadamente el 50% de los pacientes diagnosticados con AIQ no responden a los AEE; que son los pacientes que no muestran una mejoría significativa en la Hb inicial o una reducción en las transfusiones después de un mínimo de 12 semanas de tratamiento con AEE. Las personas diagnosticadas con cáncer pueden desarrollar un estado de eritropoyesis con hierro limitado, en el cual el sistema reticuloendotelial no puede liberar el hierro almacenado rápidamente de forma suficiente para permitir la incorporación del hierro en los eritrocitos durante la eritropoyesis a pesar de que parece haber reservas de hierro suficientes. Básicamente, el cuerpo no puede utilizar el hierro almacenado. Otras etiologías, como las hemorragias, la hemólisis, la infiltración de la médula ósea, o las deficiencias nutritivas, también puede contribuir a la anemia en los pacientes con cáncer (Shord 2008). Muchos ensayos clínicos han mostrado el efecto beneficioso de la administración de suplementos de hierro (oral y parenteral) con los AEE en el tratamiento de la AIQ(Auerbach 2004a; Auerbach 2010; Bastit 2008; Pedrazzoli 2008). Los resultados logrados mediante los análisis de subgrupos indican la superioridad del hierro parenteral sobre el hierro oral para el tratamiento de la AIQ en los resultados de la respuesta hematopoyética y el cambio medio en el nivel de Hb. Se pueden preferir las formulaciones de hierro parenterales para mejorar el cumplimiento y evitar los eventos adversos gástricos asociados con los suplementos de hierro oral. Además, el hierro IV puede reemplazar las reservas totales de hierro en un plazo corto en comparación con los cuatro a seis meses requeridos mediante la administración de suplementos de hierro oral. Se exploró qué tipo de hierro parenteral es superior para mejorar la respuesta hematopoyética. Sin embargo, los resultados no mostraron diferencias significativas con los suplementos de hierro versus AEE solos con hierro dextrán, gluconato y sacarosa. Es importante observar que ninguno de los estudios incluidos evaluó el momento, la frecuencia y la cantidad de nuevas dosis después que los participantes recibieron la administración de suplementos de hierro acumulativo iniciales. En consecuencia, no fue posible hacer observaciones sobre el régimen de nuevas dosis para la administración de suplementos de hierro con los AEE en los pacientes diagnosticados con AIQ.
Esta revisión sistemática y metanálisis proporcionan una síntesis de las pruebas de ensayos clínicos disponibles sobre el tema de interés. La conclusión general coincide con dos metanálisis previos realizados por Petrelli y cols. (Petrelli 2012) y Gafter‐Gvili y cols. (Gafter‐Gvili 2013). La presente revisión sistemática incluyó ensayos que compararon la administración de suplementos de hierro con los AEE en comparación con los AEE solos. Se excluyeron dos estudios que no utilizaron AEE (Dangsuwan 2010 yKim 2007), un estudio que evaluó la seguridad y eficacia de la lactoferrina oral(Maccio 2010), y un estudio que no reclutó a pacientes con AIQ, sino que reclutó a pacientes que presentaban anemia debido a otras razones como el cáncer (Hedenus 2007). La revisión realizada por Petrelli y cols. mostró que la respuesta eritropoyética es mayor cuando el hierro IV se une a la epoyetina alfa o beta en comparación con la darbepoyetina. También señalan que el hierro oral, pero no las formulaciones parenterales, redujo el riesgo de transfusión, pero solamente cuando se administró con epoyetinas, y que el hierro IV redujo la tasa de transfusión solamente en los participantes tratados con darbepoyetina (los datos no se mostraron en el texto de Petrelli y cols. para estos dos resultados). No se encontraron diferencias en la respuesta hematopoyética según el tipo de AEE, y tampoco se encontraron pruebas de una diferencia en el riesgo de transfusiones de eritrocitos según el tipo de AEE y la vía de administración del hierro. Es de señalar que la revisión realizada por Petrelli y cols. utilizó la población por protocolo para el cálculo del riesgo de transfusión para el ensayo de Henry y cols., mientras el ensayo señaló claramente que el número de transfusiones se basó en los 187 participantes reclutados, que se empleó en la presente revisión. Además, la revisión realizada por Petrelli y cols. no incluyó el ensayo de Beguin y cols., que se ha incluido en esta revisión sistemática y que informó datos sobre la respuesta hematopoyética y las transfusiones de eritrocitos. Sin embargo, incluso después de la extracción del ensayo de Beguin y cols., no fue posible repetir los hallazgos de Petrelli y cols. La revisión realizada por Gafter‐Gvili y cols. realizó una metarregresión y concluyó que no hubo asociación entre la ferritina inicial y la TSAT y la respuesta hematopoyética. Se examinaron estos resultados y se señala que Gafter‐Gvili y cols. pueden haber utilizados estimaciones inexactas de la TSAT inicial y parámetros de la ferritina sérica. Los datos de la TSAT y la ferritina sérica informados por Gafter‐Gvili y cols. no coinciden con los datos informados en las publicaciones originales Auerbach 2004 y Auerbach 2010 (Auerbach 2004a; Auerbach 2004b; Auerbach 2004c; Auerbach 2010). Los resultados muestran la posible asociación entre la ferritina sérica inicial y la respuesta hematopoyética.

Study flow diagram.

Risk of bias summary: Review authors' judgments about risk of bias in each included study.
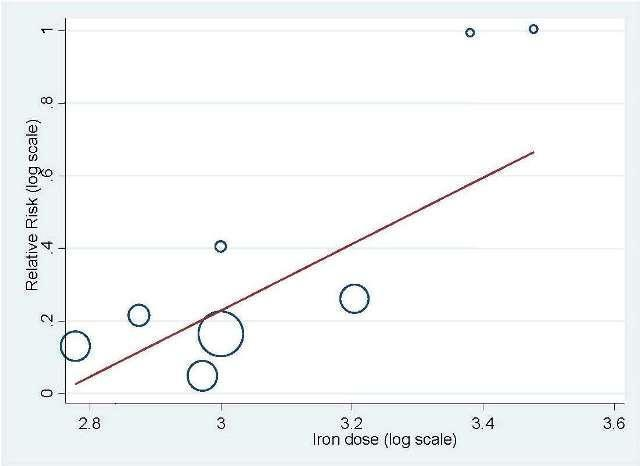
Meta‐regression: total IV iron dose and hematopoietic response

Meta‐regression: baseline serum ferritin and hematopoietic response.
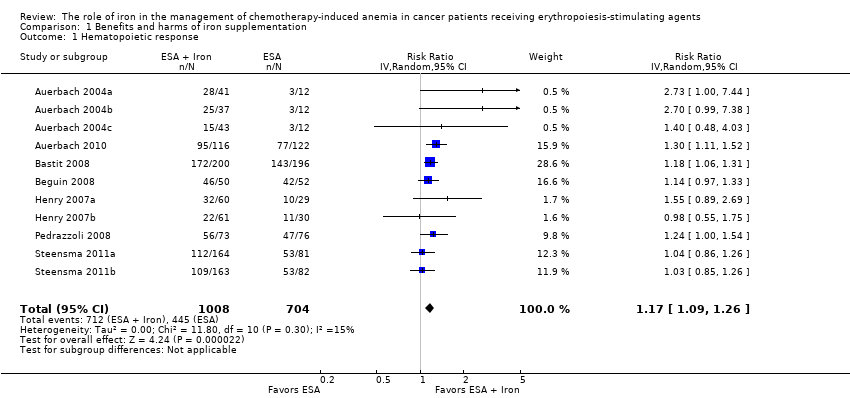
Comparison 1 Benefits and harms of iron supplementation, Outcome 1 Hematopoietic response.
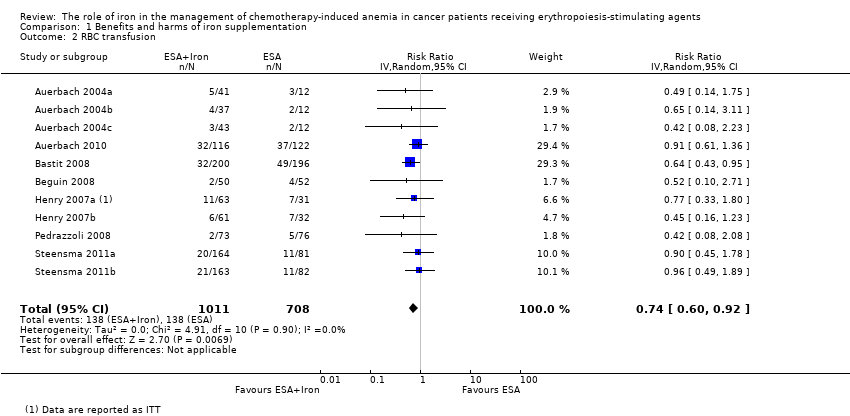
Comparison 1 Benefits and harms of iron supplementation, Outcome 2 RBC transfusion.

Comparison 1 Benefits and harms of iron supplementation, Outcome 3 Time to hematopoietic response.
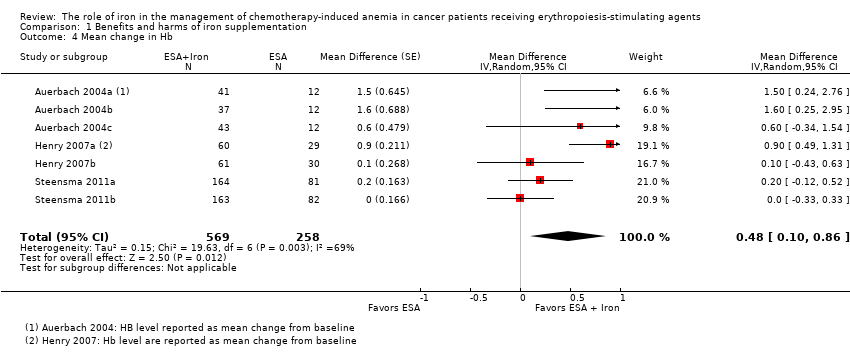
Comparison 1 Benefits and harms of iron supplementation, Outcome 4 Mean change in Hb.

Comparison 1 Benefits and harms of iron supplementation, Outcome 5 Quality of life.

Comparison 1 Benefits and harms of iron supplementation, Outcome 6 Thromboembolic events.

Comparison 1 Benefits and harms of iron supplementation, Outcome 7 Mean change in serum ferritin.
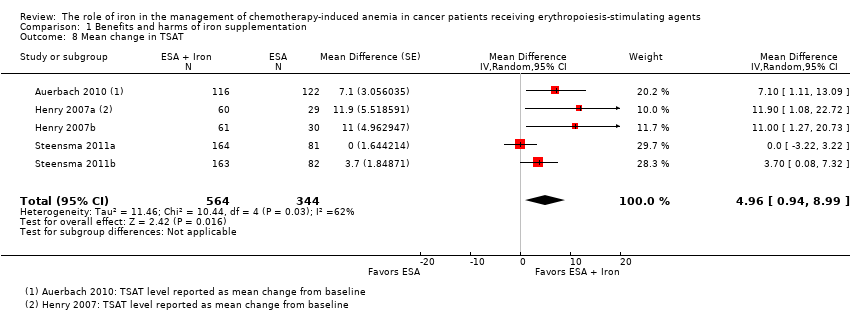
Comparison 1 Benefits and harms of iron supplementation, Outcome 8 Mean change in TSAT.
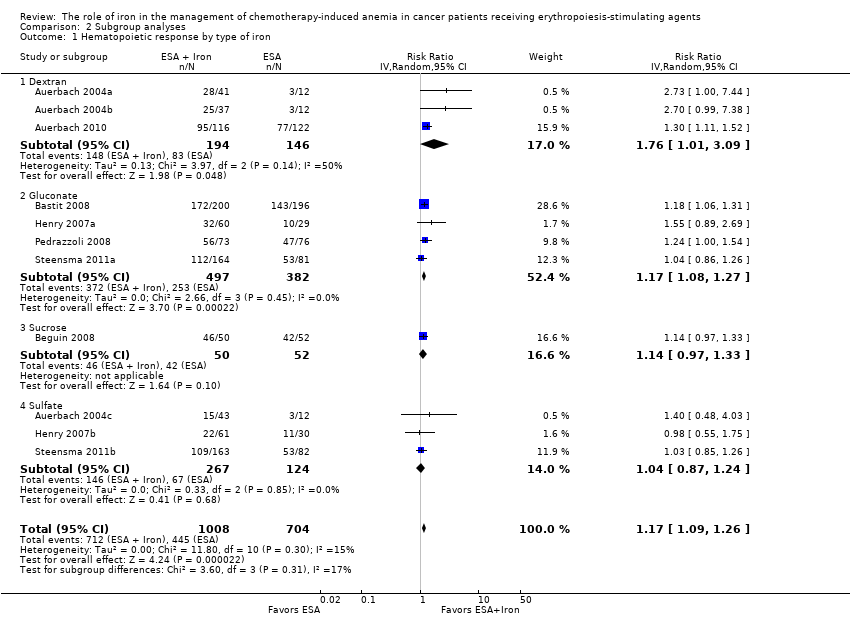
Comparison 2 Subgroup analyses, Outcome 1 Hematopoietic response by type of iron.

Comparison 2 Subgroup analyses, Outcome 2 Hematopoietic response by route of administration.

Comparison 2 Subgroup analyses, Outcome 3 Hematopoietic response by type of ESA.

Comparison 2 Subgroup analyses, Outcome 4 Time to hematopoietic response by route of administration.
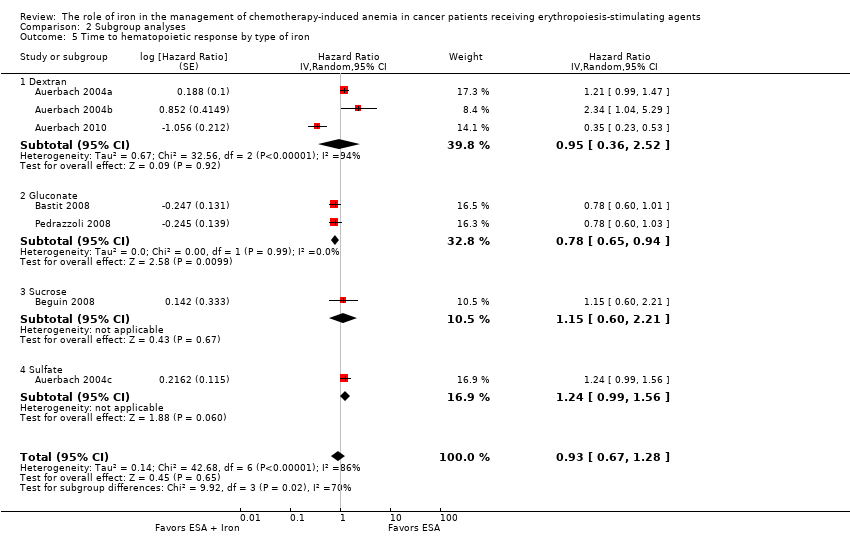
Comparison 2 Subgroup analyses, Outcome 5 Time to hematopoietic response by type of iron.

Comparison 2 Subgroup analyses, Outcome 6 Time to hematopoietic response by type of ESA.

Comparison 2 Subgroup analyses, Outcome 7 Mean change in Hb by route of administration.

Comparison 2 Subgroup analyses, Outcome 8 Mean change in Hb by type of iron.

Comparison 2 Subgroup analyses, Outcome 9 Mean change in Hb by type of ESA.

Comparison 2 Subgroup analyses, Outcome 10 Mean change in serum ferritin by route of administration.
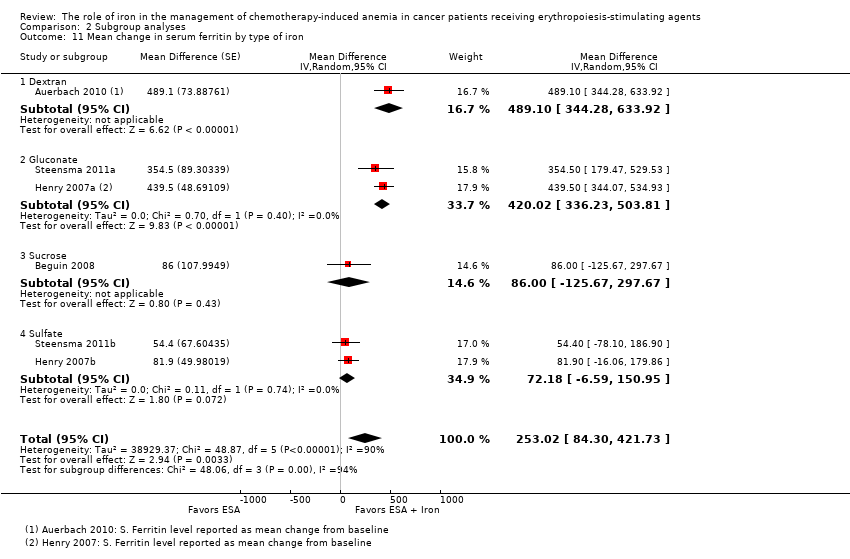
Comparison 2 Subgroup analyses, Outcome 11 Mean change in serum ferritin by type of iron.

Comparison 2 Subgroup analyses, Outcome 12 Mean change in serum ferritin by type of ESA.

Comparison 2 Subgroup analyses, Outcome 13 Mean change in TSAT by route of administration.
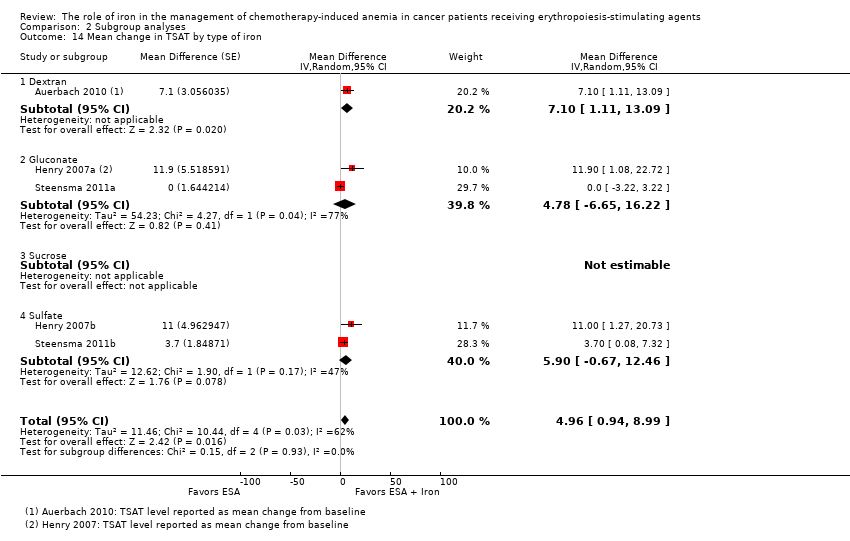
Comparison 2 Subgroup analyses, Outcome 14 Mean change in TSAT by type of iron.

Comparison 2 Subgroup analyses, Outcome 15 Mean change in TSAT by type of ESA.

Comparison 3 Sensitivity analyses, Outcome 1 Random sequence generation.

Comparison 3 Sensitivity analyses, Outcome 2 Allocation concealment.

Comparison 3 Sensitivity analyses, Outcome 3 Blinding.
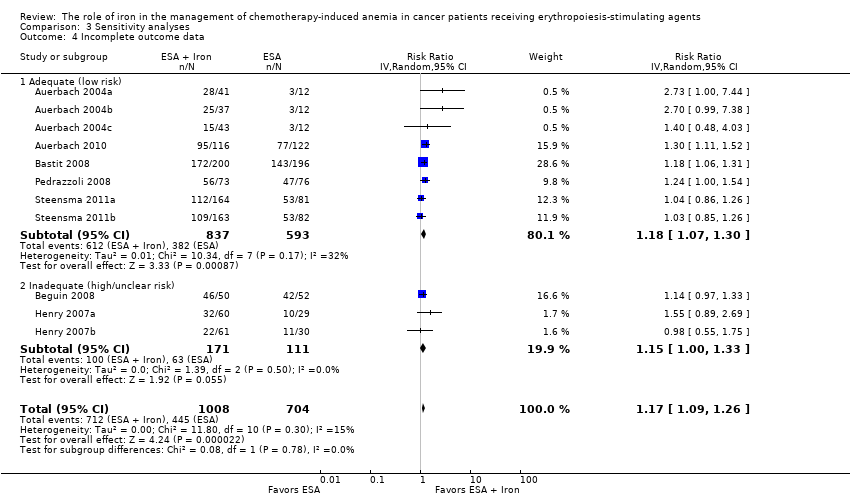
Comparison 3 Sensitivity analyses, Outcome 4 Incomplete outcome data.
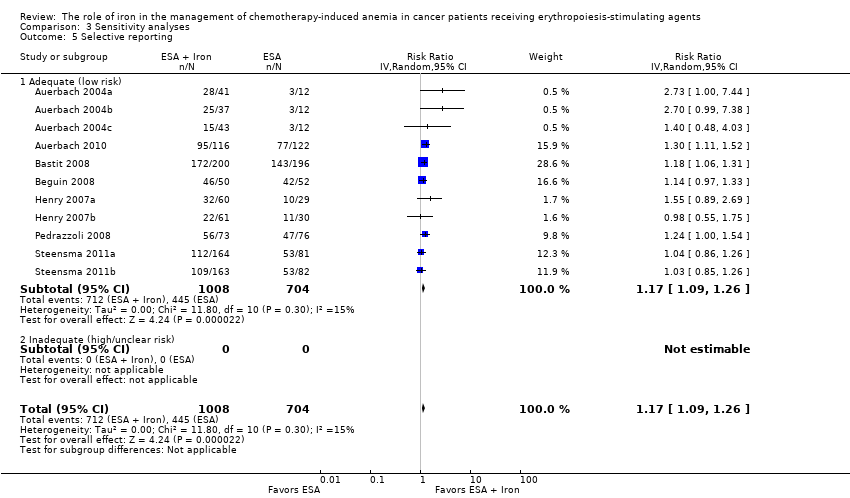
Comparison 3 Sensitivity analyses, Outcome 5 Selective reporting.
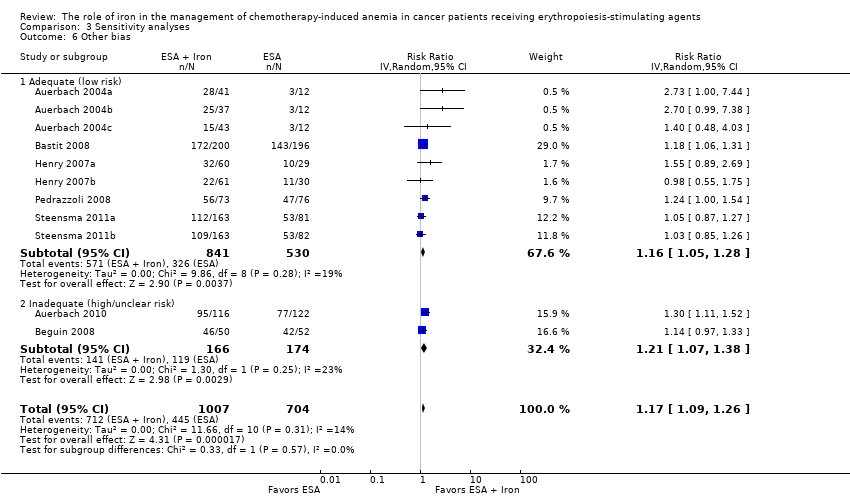
Comparison 3 Sensitivity analyses, Outcome 6 Other bias.

Comparison 3 Sensitivity analyses, Outcome 7 Hematopoietic response by definition(s).
| Benefits and harms of iron supplementation for chemotherapy‐induced anemia | |||||
| Patient or population: people diagnosed with chemotherapy‐induced anemia Comparison: erythropoiesis‐stimulating agents alone | |||||
| Outcomes | Illustrative comparative risks* (95% CI) | Relative effect | No of Participants | Quality of the evidence | |
| Assumed risk | Corresponding risk | ||||
| Control | Benefits and harms of iron supplementation | ||||
| Overall survival | None of the included studies reported data on overall survival | ||||
| Hematopoietic response | Study population | RR 1.17 | 1712 (7 studies, 11 comparisons) | ⊕⊕⊕⊕ | |
| 632 per 1000 | 740 per 1000 | ||||
| Moderate## | |||||
| 574 per 1000 | 672 per 1000 | ||||
| Red blood cell transfusion | Study population | RR 0.74 | 1719 (7 studies, 11 comparisons) | ⊕⊕⊕⊝ | |
| 195 per 1000 | 144 per 1000 | ||||
| Moderate## | |||||
| 167 per 1000 | 124 per 1000 | ||||
| Median time to hematopoietic response | Not applicable# | HR 0.93 (0.67 to 1.28) | 1042 (5 studies, 7 comparisons) | ⊕⊕⊝⊝ low1,2 | |
| Mean change in hemoglobin (better indicated by higher values) | The mean change in hemoglobin in the intervention groups was 0.48 higher | MD 0.48 (0.10 to 0.86) | 827 (3 studies, 7 comparisons) | ⊕⊕⊝⊝ | |
| Quality of life (better indicated by higher values) | The mean quality of life in the intervention groups was | SMD 0.01 (‐0.10 to 0.12) | 1124 (3 studies, 4 comparisons) | ⊕⊕⊕⊕ | |
| Thromboembolic events | Study population | RR 0.95 | 783 (3 studies) | ⊕⊕⊕⊝ | |
| 62 per 1000 | 58 per 1000 | ||||
| Moderate## | |||||
| 62 per 1000 | 59 per 1000 | ||||
| Treatment‐related mortality | Not applicable** | Zero events** | 997 (4 studies, 6 comparisons) | ⊕⊕⊕⊕ | |
| *The basis for the assumed risk (e.g. the median control group risk across studies) is provided in footnotes. The corresponding risk (and its 95% confidence interval) is based on the assumed risk in the comparison group and the relative effect of the intervention (and its 95% CI). | |||||
| GRADE Working Group grades of evidence | |||||
| 1Downgraded the quality of evidence by one level due to imprecision (the pooled estimate had wider confidence intervals). **Due to zero events we were not able to conduct meta‐analysis of these data. #Data were available as median and range, and hence were converted to log hazard ratio using the cumulative hazard log‐log transform method. ##The moderate control risk was calculated via GRADEpro software based on clinical experience of the review authors working in the field of hematological disorders. | |||||
| Study ID | Morbidities | Rx group 1 N (%) | Rx group 2 N (%) | Rx group 3 N (%) | Treatment‐related mortality |
| Auerbach 2004 | Participants with any AEs
| ESAs + TDI iron N = 41 | ESAs + bolus iron N = 37 | ESAs + oral iron N = 43 | Zero events |
| 3 (7) | 3 (8) | 1 (2) | |||
| Auerbach 2010 | ‐ | ‐ | ESAs + IV iron N = 117 | ESAs alone N = 121 | Zero events |
| Participants with any AEs | ‐ | 104 (89) | 110 (91) | ||
| Participants with serious AEs | ‐ | 41 (35) | 45 (37) | ||
| Participants with treatment‐related AEs | ‐ | 14 (12) | 0 (0) | ||
| Participants with serious treatment‐related AEs | ‐ | 3 (3)a | 0 (0) | ||
| Participants with AEs leading to study discontinuation | ‐ | 12 (10) | 14 (12) | ||
| Cardiovascular and thromboembolic events | ‐ | 18 (15) | 19 (16) | ||
| Embolism/thrombosis | ‐ | 8 (7) | 10 (8) | ||
| Arrhythmias | ‐ | 9 (8) | 7 (6) | ||
| Congestive heart failure | ‐ | 3 (3) | 1 (1) | ||
| Myocardial infarction/artery disorders | ‐ | 2 (2) | 2 (2) | ||
| Cerebrovascular accident | ‐ | 1 (1) | 0 (0) | ||
| Deaths on study (any reason)b | ‐ | 8 (7) | 13 (11) | ||
| Bastit 2008 | ‐ | ‐ | ESAs + IV iron N = 203 | ESAs alone N = 193 | Not reported |
| No. of participants reporting specific AEs | ‐ | 21 (10) | 26 (13) | ||
| Embolism/thrombosis, arterial and venous | ‐ | 12 (6) | 12 (6) | ||
| Myocardial infarction, ischemic and coronary artery disease | ‐ | 3 (1) | 1 (1) | ||
| Hypertension | ‐ | 2 (1) | 5 (3) | ||
| Congestive heart failure | ‐ | 1 (0) | 3 (2) | ||
| Cerebrovascular accident | ‐ | 0 (0) | 0 (0) | ||
| Deaths on study (any reason) | ‐ | 21 (10) | 15 (8) | ||
| Beguin 2008 | Data are not reported. Authors state that there was no difference in rates of thromboembolic events or other complications among the groups | Not reported | |||
| Bellet 2007 | A total of 375 participants were enrolled in this phase III RCT. However, the number of participants randomized to each study arm is not reported. Three serious but non‐life‐threatening iron sucrose‐related AEs were observed, including 1 case of significant, transient hypotension in a female weighing 50 kg | ‐ | IV iron + ESAs | ESAs alone | Not reported |
| Henry 2007c,d | ‐ | ‐ | ESAs + IV iron N = 63 | ESAs + oral iron N = 61 | Not reported |
| Constipation | ‐ | 2 (3.2) | 11 (18) | ||
| Nausea | ‐ | 2 (3.2) | 3 (4.9) | ||
| Dyspepsia | ‐ | 1 (1.6) | 3 (4.9) | ||
| Asthenia | ‐ | 1 (1.6) | 2 (3.3) | ||
| Anorexia | ‐ | 0 | 2 (3.3) | ||
| Abdominal pain | ‐ | 0 | 2 (3.3) | ||
| Diarrhea | ‐ | 1 (1.6) | 0 | ||
| Hypotension | ‐ | 1 (1.6) | 0 | ||
| Vasodilation | ‐ | 1 (1.6) | 0 | ||
| Angina pectoris | ‐ | 1 (1.6) | 0 | ||
| Tremor | ‐ | 1 (1.6) | 0 | ||
| Pain at injection site | ‐ | 1 (1.6) | 0 | ||
| Vomiting | ‐ | 0 | 1 (1.6) | ||
| Back pain | ‐ | 0 | 1 (1.6) | ||
| Dehydration | ‐ | 0 | 1 (1.6) | ||
| Dizziness | ‐ | 0 | 1 (1.6) | ||
| Taste perversion | ‐ | 0 | 1 (1.6) | ||
| Melena | ‐ | 0 | 1 (1.6) | ||
| Tinnitus | ‐ | 0 | 1 (1.6) | ||
| Pedrazzoli 2011e | ‐ | ‐ | ESAs + IV iron N = 73 | ESAs only N = 76 | Zero events |
| Participants with AEs | ‐ | 55 (75.3) | 49 (64.5) | ||
| Participants with serious AEs | ‐ | 8 (11) | 10 (13.2) | ||
| Participants with treatment‐related AEs | ‐ | 7 (9.6) | 6 (7.9) | ||
| Vascular/thromboembolic events | ‐ | 3 (4.1) | 2 (2.6) | ||
| Fatal AEs: all | ‐ | 4 (5.5) | 3 (3.9) | ||
| Fatal AEs: treatment related | ‐ | 0 (0) | 0 (0) | ||
| Steensma 2011f | Worst toxicity reported (toxicities were graded according to the National Cancer Institute Common Terminology Criteria of Adverse Events) | ESAs + IV iron N = 164 | ESAs + oral iron N = 162 | ESAs + placebo N = 163 | Zero events |
| None | 12 (7) | 15 (9) | 22 (13) | ||
| Mild | 28 (17) | 40 (25) | 33 (20) | ||
| Moderate | 35 (21) | 35 (22) | 33 (20) | ||
| Severe | 52 (32) | 42 (26) | 49 (30) | ||
| Life‐threatening | 29 (18) | 24 (15) | 23 (14) | ||
| Lethal (includes participants who died while on study regardless of causality) | 8 (5) | 6 (4) | 3 (2) | ||
| aEpisodes of transient anaphylactoid reactions occurred in two participants soon after initiating IV iron, but these participants recovered uneventfully without hospitalization; one participant in this group had enlarged uvula, lip swelling, and dyspnea (symptoms resolved). AE = adverse event | |||||
| Outcome or subgroup title | No. of studies | No. of participants | Statistical method | Effect size |
| 1 Hematopoietic response Show forest plot | 11 | 1712 | Risk Ratio (IV, Random, 95% CI) | 1.17 [1.09, 1.26] |
| 2 RBC transfusion Show forest plot | 11 | 1719 | Risk Ratio (IV, Random, 95% CI) | 0.74 [0.60, 0.92] |
| 3 Time to hematopoietic response Show forest plot | 7 | 1042 | Hazard Ratio (Random, 95% CI) | 0.93 [0.67, 1.28] |
| 4 Mean change in Hb Show forest plot | 7 | 827 | Mean Difference (Random, 95% CI) | 0.48 [0.10, 0.86] |
| 5 Quality of life Show forest plot | 4 | 1124 | Std. Mean Difference (Random, 95% CI) | 0.01 [‐0.10, 0.12] |
| 6 Thromboembolic events Show forest plot | 3 | 783 | Risk Ratio (IV, Random, 95% CI) | 0.95 [0.54, 1.65] |
| 7 Mean change in serum ferritin Show forest plot | 6 | 1010 | Mean Difference (Random, 95% CI) | 253.02 [84.30, 421.73] |
| 8 Mean change in TSAT Show forest plot | 5 | 908 | Mean Difference (Random, 95% CI) | 4.96 [0.94, 8.99] |
| Outcome or subgroup title | No. of studies | No. of participants | Statistical method | Effect size |
| 1 Hematopoietic response by type of iron Show forest plot | 11 | 1712 | Risk Ratio (IV, Random, 95% CI) | 1.17 [1.09, 1.26] |
| 1.1 Dextran | 3 | 340 | Risk Ratio (IV, Random, 95% CI) | 1.76 [1.01, 3.09] |
| 1.2 Gluconate | 4 | 879 | Risk Ratio (IV, Random, 95% CI) | 1.17 [1.08, 1.27] |
| 1.3 Sucrose | 1 | 102 | Risk Ratio (IV, Random, 95% CI) | 1.14 [0.97, 1.33] |
| 1.4 Sulfate | 3 | 391 | Risk Ratio (IV, Random, 95% CI) | 1.04 [0.87, 1.24] |
| 2 Hematopoietic response by route of administration Show forest plot | 11 | 1712 | Risk Ratio (IV, Random, 95% CI) | 1.17 [1.09, 1.26] |
| 2.1 Intravenous iron | 8 | 1321 | Risk Ratio (IV, Random, 95% CI) | 1.20 [1.10, 1.31] |
| 2.2 Oral iron | 3 | 391 | Risk Ratio (IV, Random, 95% CI) | 1.04 [0.87, 1.24] |
| 3 Hematopoietic response by type of ESA Show forest plot | 11 | 1712 | Risk Ratio (IV, Random, 95% CI) | 1.17 [1.09, 1.26] |
| 3.1 epoetin | 5 | 337 | Risk Ratio (IV, Random, 95% CI) | 1.53 [1.05, 2.22] |
| 3.2 darbepoetin | 6 | 1375 | Risk Ratio (IV, Random, 95% CI) | 1.16 [1.09, 1.24] |
| 4 Time to hematopoietic response by route of administration Show forest plot | 7 | Hazard Ratio (Random, 95% CI) | 0.93 [0.67, 1.28] | |
| 4.1 Intravenous iron | 6 | Hazard Ratio (Random, 95% CI) | 0.88 [0.60, 1.29] | |
| 4.2 Oral iron | 1 | Hazard Ratio (Random, 95% CI) | 1.24 [0.99, 1.56] | |
| 5 Time to hematopoietic response by type of iron Show forest plot | 7 | Hazard Ratio (Random, 95% CI) | 0.93 [0.67, 1.28] | |
| 5.1 Dextran | 3 | Hazard Ratio (Random, 95% CI) | 0.95 [0.36, 2.52] | |
| 5.2 Gluconate | 2 | Hazard Ratio (Random, 95% CI) | 0.78 [0.65, 0.94] | |
| 5.3 Sucrose | 1 | Hazard Ratio (Random, 95% CI) | 1.15 [0.60, 2.21] | |
| 5.4 Sulfate | 1 | Hazard Ratio (Random, 95% CI) | 1.24 [0.99, 1.56] | |
| 6 Time to hematopoietic response by type of ESA Show forest plot | 7 | Hazard Ratio (Random, 95% CI) | 0.93 [0.67, 1.28] | |
| 6.1 epoetin | 4 | Hazard Ratio (Random, 95% CI) | 1.00 [0.58, 1.72] | |
| 6.2 darbepoetin | 3 | Hazard Ratio (Random, 95% CI) | 0.81 [0.67, 0.96] | |
| 7 Mean change in Hb by route of administration Show forest plot | 7 | Mean Difference (Random, 95% CI) | 0.48 [0.10, 0.86] | |
| 7.1 Intravenous iron | 4 | Mean Difference (Random, 95% CI) | 0.84 [0.21, 1.46] | |
| 7.2 Oral iron | 3 | Mean Difference (Random, 95% CI) | 0.07 [‐0.19, 0.34] | |
| 8 Mean change in Hb by type of iron Show forest plot | 7 | Mean Difference (Random, 95% CI) | 0.48 [0.10, 0.86] | |
| 8.1 Dextran | 2 | Mean Difference (Random, 95% CI) | 1.55 [0.62, 2.47] | |
| 8.2 Gluconate | 2 | Mean Difference (Random, 95% CI) | 0.54 [‐0.15, 1.22] | |
| 8.3 Sucrose | 0 | Mean Difference (Random, 95% CI) | 0.0 [0.0, 0.0] | |
| 8.4 Sulfate | 3 | Mean Difference (Random, 95% CI) | 0.07 [‐0.19, 0.34] | |
| 9 Mean change in Hb by type of ESA Show forest plot | 7 | Mean Difference (Random, 95% CI) | 0.48 [0.10, 0.86] | |
| 9.1 epoetin | 5 | Mean Difference (Random, 95% CI) | 0.77 [0.25, 1.29] | |
| 9.2 darbepoetin | 2 | Mean Difference (Random, 95% CI) | 0.10 [‐0.13, 0.33] | |
| 10 Mean change in serum ferritin by route of administration Show forest plot | 6 | Mean Difference (Random, 95% CI) | 253.02 [84.30, 421.73] | |
| 10.1 Intravenous iron | 4 | Mean Difference (Random, 95% CI) | 362.15 [219.69, 504.61] | |
| 10.2 Oral iron | 2 | Mean Difference (Random, 95% CI) | 72.18 [‐6.59, 150.95] | |
| 11 Mean change in serum ferritin by type of iron Show forest plot | 6 | Mean Difference (Random, 95% CI) | 253.02 [84.30, 421.73] | |
| 11.1 Dextran | 1 | Mean Difference (Random, 95% CI) | 489.1 [344.28, 633.92] | |
| 11.2 Gluconate | 2 | Mean Difference (Random, 95% CI) | 420.02 [336.23, 503.81] | |
| 11.3 Sucrose | 1 | Mean Difference (Random, 95% CI) | 86.0 [‐125.67, 297.67] | |
| 11.4 Sulfate | 2 | Mean Difference (Random, 95% CI) | 72.18 [‐6.59, 150.95] | |
| 12 Mean change in serum ferritin by type of ESA Show forest plot | 6 | Mean Difference (Random, 95% CI) | 253.02 [84.30, 421.73] | |
| 12.1 epoetin | 2 | Mean Difference (Random, 95% CI) | 260.88 [‐89.56, 611.32] | |
| 12.2 darbepoetin | 4 | Mean Difference (Random, 95% CI) | 248.35 [26.24, 470.45] | |
| 13 Mean change in TSAT by route of administration Show forest plot | 5 | Mean Difference (Random, 95% CI) | 4.96 [0.94, 8.99] | |
| 13.1 Intravenous iron | 3 | Mean Difference (Random, 95% CI) | 5.07 [‐1.74, 11.87] | |
| 13.2 Oral iron | 2 | Mean Difference (Random, 95% CI) | 5.90 [‐0.67, 12.46] | |
| 14 Mean change in TSAT by type of iron Show forest plot | 5 | Mean Difference (Random, 95% CI) | 4.96 [0.94, 8.99] | |
| 14.1 Dextran | 1 | Mean Difference (Random, 95% CI) | 7.1 [1.11, 13.09] | |
| 14.2 Gluconate | 2 | Mean Difference (Random, 95% CI) | 4.78 [‐6.65, 16.22] | |
| 14.3 Sucrose | 0 | Mean Difference (Random, 95% CI) | 0.0 [0.0, 0.0] | |
| 14.4 Sulfate | 2 | Mean Difference (Random, 95% CI) | 5.90 [‐0.67, 12.46] | |
| 15 Mean change in TSAT by type of ESA Show forest plot | 5 | Mean Difference (Random, 95% CI) | 4.96 [0.94, 8.99] | |
| 15.1 epoetin | 2 | Mean Difference (Random, 95% CI) | 11.40 [4.17, 18.64] | |
| 15.2 darbepoetin | 3 | Mean Difference (Random, 95% CI) | 3.01 [‐0.73, 6.75] | |
| Outcome or subgroup title | No. of studies | No. of participants | Statistical method | Effect size |
| 1 Random sequence generation Show forest plot | 11 | 1712 | Risk Ratio (IV, Random, 95% CI) | 1.17 [1.09, 1.26] |
| 1.1 Adequate (low risk) | 4 | 830 | Risk Ratio (IV, Random, 95% CI) | 1.13 [1.02, 1.26] |
| 1.2 Inadequate (high/unclear risk) | 7 | 882 | Risk Ratio (IV, Random, 95% CI) | 1.23 [1.09, 1.39] |
| 2 Allocation concealment Show forest plot | 11 | 1711 | Risk Ratio (IV, Random, 95% CI) | 1.17 [1.09, 1.26] |
| 2.1 Adequate (low risk) | 11 | 1711 | Risk Ratio (IV, Random, 95% CI) | 1.17 [1.09, 1.26] |
| 2.2 Inadequate (high/unclear risk) | 0 | 0 | Risk Ratio (IV, Random, 95% CI) | 0.0 [0.0, 0.0] |
| 3 Blinding Show forest plot | 11 | 1712 | Risk Ratio (IV, Random, 95% CI) | 1.17 [1.09, 1.26] |
| 3.1 Adequate (low risk) | 1 | 102 | Risk Ratio (IV, Random, 95% CI) | 1.14 [0.97, 1.33] |
| 3.2 Inadequate (high/unclear risk) | 10 | 1610 | Risk Ratio (IV, Random, 95% CI) | 1.18 [1.08, 1.29] |
| 4 Incomplete outcome data Show forest plot | 11 | 1712 | Risk Ratio (IV, Random, 95% CI) | 1.17 [1.09, 1.26] |
| 4.1 Adequate (low risk) | 8 | 1430 | Risk Ratio (IV, Random, 95% CI) | 1.18 [1.07, 1.30] |
| 4.2 Inadequate (high/unclear risk) | 3 | 282 | Risk Ratio (IV, Random, 95% CI) | 1.15 [1.00, 1.33] |
| 5 Selective reporting Show forest plot | 11 | 1712 | Risk Ratio (IV, Random, 95% CI) | 1.17 [1.09, 1.26] |
| 5.1 Adequate (low risk) | 11 | 1712 | Risk Ratio (IV, Random, 95% CI) | 1.17 [1.09, 1.26] |
| 5.2 Inadequate (high/unclear risk) | 0 | 0 | Risk Ratio (IV, Random, 95% CI) | 0.0 [0.0, 0.0] |
| 6 Other bias Show forest plot | 11 | 1711 | Risk Ratio (IV, Random, 95% CI) | 1.17 [1.09, 1.26] |
| 6.1 Adequate (low risk) | 9 | 1371 | Risk Ratio (IV, Random, 95% CI) | 1.16 [1.05, 1.28] |
| 6.2 Inadequate (high/unclear risk) | 2 | 340 | Risk Ratio (IV, Random, 95% CI) | 1.21 [1.07, 1.38] |
| 7 Hematopoietic response by definition(s) Show forest plot | 11 | 1712 | Risk Ratio (IV, Random, 95% CI) | 1.17 [1.09, 1.26] |
| 7.1 Hematopoietic response | 8 | 1430 | Risk Ratio (IV, Random, 95% CI) | 1.18 [1.07, 1.30] |
| 7.2 Hematologic response | 2 | 180 | Risk Ratio (IV, Random, 95% CI) | 1.24 [0.80, 1.94] |
| 7.3 Patients reaching Hb > 13 g/dL | 1 | 102 | Risk Ratio (IV, Random, 95% CI) | 1.14 [0.97, 1.33] |