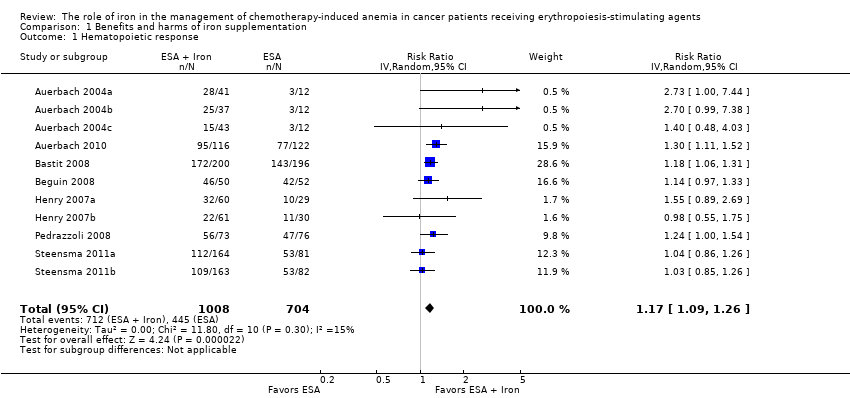
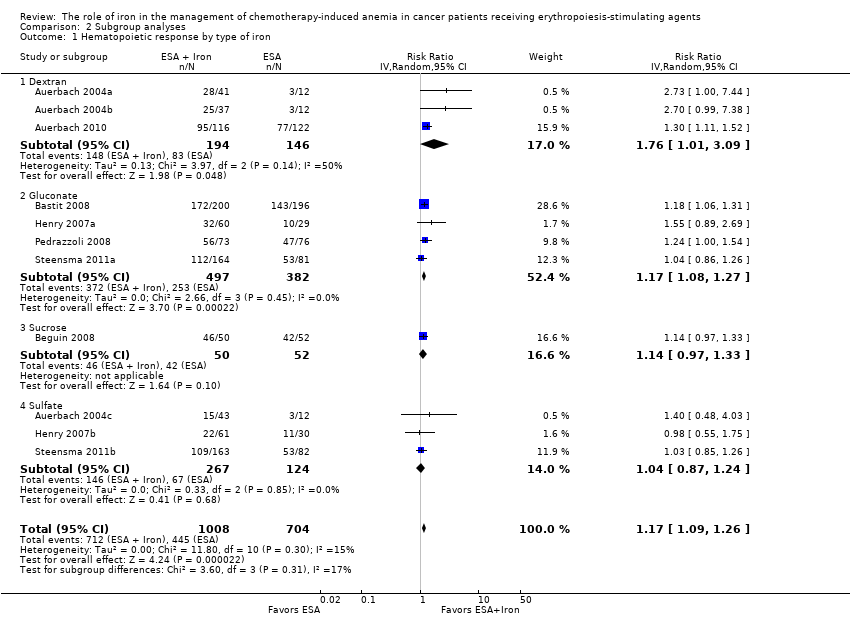
| 1 Hematopoietic response by type of iron Show forest plot | 11 | 1712 | Risk Ratio (IV, Random, 95% CI) | 1.17 [1.09, 1.26] |
|
| 1.1 Dextran | 3 | 340 | Risk Ratio (IV, Random, 95% CI) | 1.76 [1.01, 3.09] |
| 1.2 Gluconate | 4 | 879 | Risk Ratio (IV, Random, 95% CI) | 1.17 [1.08, 1.27] |
| 1.3 Sucrose | 1 | 102 | Risk Ratio (IV, Random, 95% CI) | 1.14 [0.97, 1.33] |
| 1.4 Sulfate | 3 | 391 | Risk Ratio (IV, Random, 95% CI) | 1.04 [0.87, 1.24] |
| 2 Hematopoietic response by route of administration Show forest plot | 11 | 1712 | Risk Ratio (IV, Random, 95% CI) | 1.17 [1.09, 1.26] |
|
| 2.1 Intravenous iron | 8 | 1321 | Risk Ratio (IV, Random, 95% CI) | 1.20 [1.10, 1.31] |
| 2.2 Oral iron | 3 | 391 | Risk Ratio (IV, Random, 95% CI) | 1.04 [0.87, 1.24] |
| 3 Hematopoietic response by type of ESA Show forest plot | 11 | 1712 | Risk Ratio (IV, Random, 95% CI) | 1.17 [1.09, 1.26] |
|
| 3.1 epoetin | 5 | 337 | Risk Ratio (IV, Random, 95% CI) | 1.53 [1.05, 2.22] |
| 3.2 darbepoetin | 6 | 1375 | Risk Ratio (IV, Random, 95% CI) | 1.16 [1.09, 1.24] |
| 4 Time to hematopoietic response by route of administration Show forest plot | 7 | | Hazard Ratio (Random, 95% CI) | 0.93 [0.67, 1.28] |
|
| 4.1 Intravenous iron | 6 | | Hazard Ratio (Random, 95% CI) | 0.88 [0.60, 1.29] |
| 4.2 Oral iron | 1 | | Hazard Ratio (Random, 95% CI) | 1.24 [0.99, 1.56] |
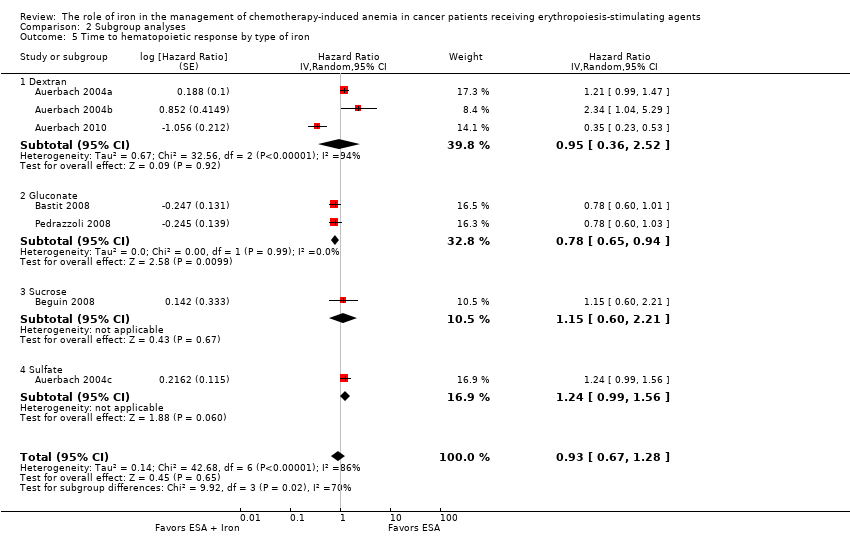
| 5 Time to hematopoietic response by type of iron Show forest plot | 7 | | Hazard Ratio (Random, 95% CI) | 0.93 [0.67, 1.28] |
|
| 5.1 Dextran | 3 | | Hazard Ratio (Random, 95% CI) | 0.95 [0.36, 2.52] |
| 5.2 Gluconate | 2 | | Hazard Ratio (Random, 95% CI) | 0.78 [0.65, 0.94] |
| 5.3 Sucrose | 1 | | Hazard Ratio (Random, 95% CI) | 1.15 [0.60, 2.21] |
| 5.4 Sulfate | 1 | | Hazard Ratio (Random, 95% CI) | 1.24 [0.99, 1.56] |
| 6 Time to hematopoietic response by type of ESA Show forest plot | 7 | | Hazard Ratio (Random, 95% CI) | 0.93 [0.67, 1.28] |
|
| 6.1 epoetin | 4 | | Hazard Ratio (Random, 95% CI) | 1.00 [0.58, 1.72] |
| 6.2 darbepoetin | 3 | | Hazard Ratio (Random, 95% CI) | 0.81 [0.67, 0.96] |
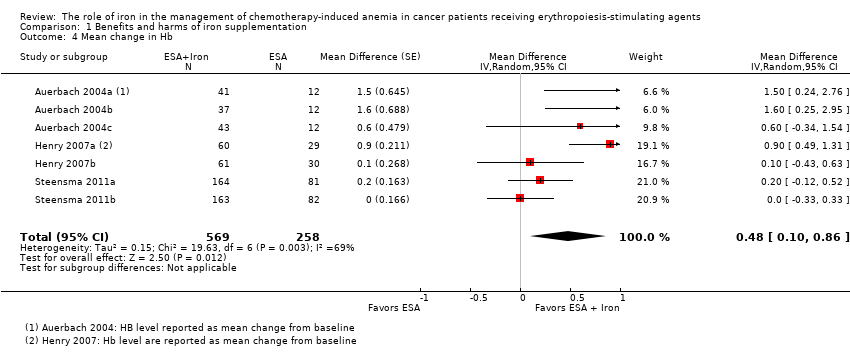
| 7 Mean change in Hb by route of administration Show forest plot | 7 | | Mean Difference (Random, 95% CI) | 0.48 [0.10, 0.86] |
|
| 7.1 Intravenous iron | 4 | | Mean Difference (Random, 95% CI) | 0.84 [0.21, 1.46] |
| 7.2 Oral iron | 3 | | Mean Difference (Random, 95% CI) | 0.07 [‐0.19, 0.34] |
| 8 Mean change in Hb by type of iron Show forest plot | 7 | | Mean Difference (Random, 95% CI) | 0.48 [0.10, 0.86] |
|
| 8.1 Dextran | 2 | | Mean Difference (Random, 95% CI) | 1.55 [0.62, 2.47] |
| 8.2 Gluconate | 2 | | Mean Difference (Random, 95% CI) | 0.54 [‐0.15, 1.22] |
| 8.3 Sucrose | 0 | | Mean Difference (Random, 95% CI) | 0.0 [0.0, 0.0] |
| 8.4 Sulfate | 3 | | Mean Difference (Random, 95% CI) | 0.07 [‐0.19, 0.34] |
| 9 Mean change in Hb by type of ESA Show forest plot | 7 | | Mean Difference (Random, 95% CI) | 0.48 [0.10, 0.86] |
|
| 9.1 epoetin | 5 | | Mean Difference (Random, 95% CI) | 0.77 [0.25, 1.29] |
| 9.2 darbepoetin | 2 | | Mean Difference (Random, 95% CI) | 0.10 [‐0.13, 0.33] |
| 10 Mean change in serum ferritin by route of administration Show forest plot | 6 | | Mean Difference (Random, 95% CI) | 253.02 [84.30, 421.73] |
|
| 10.1 Intravenous iron | 4 | | Mean Difference (Random, 95% CI) | 362.15 [219.69, 504.61] |
| 10.2 Oral iron | 2 | | Mean Difference (Random, 95% CI) | 72.18 [‐6.59, 150.95] |
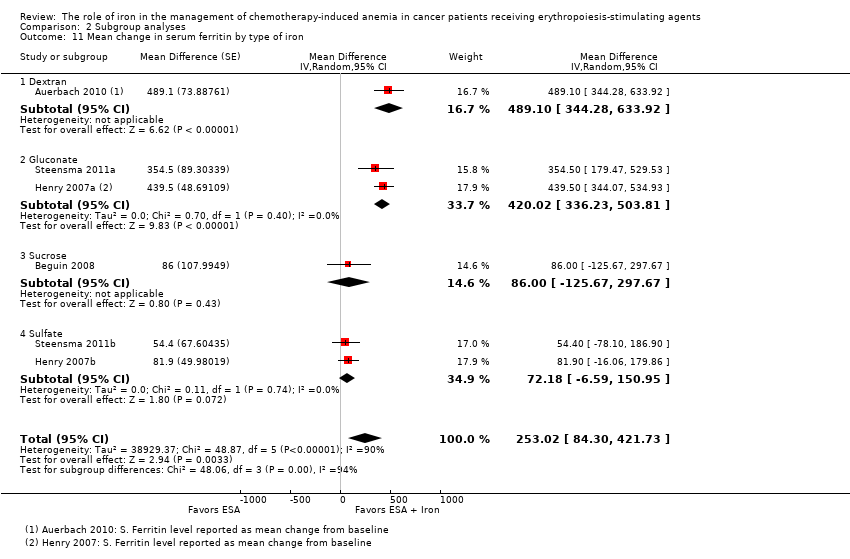
| 11 Mean change in serum ferritin by type of iron Show forest plot | 6 | | Mean Difference (Random, 95% CI) | 253.02 [84.30, 421.73] |
|
| 11.1 Dextran | 1 | | Mean Difference (Random, 95% CI) | 489.1 [344.28, 633.92] |
| 11.2 Gluconate | 2 | | Mean Difference (Random, 95% CI) | 420.02 [336.23, 503.81] |
| 11.3 Sucrose | 1 | | Mean Difference (Random, 95% CI) | 86.0 [‐125.67, 297.67] |
| 11.4 Sulfate | 2 | | Mean Difference (Random, 95% CI) | 72.18 [‐6.59, 150.95] |
| 12 Mean change in serum ferritin by type of ESA Show forest plot | 6 | | Mean Difference (Random, 95% CI) | 253.02 [84.30, 421.73] |
|
| 12.1 epoetin | 2 | | Mean Difference (Random, 95% CI) | 260.88 [‐89.56, 611.32] |
| 12.2 darbepoetin | 4 | | Mean Difference (Random, 95% CI) | 248.35 [26.24, 470.45] |
| 13 Mean change in TSAT by route of administration Show forest plot | 5 | | Mean Difference (Random, 95% CI) | 4.96 [0.94, 8.99] |
|
| 13.1 Intravenous iron | 3 | | Mean Difference (Random, 95% CI) | 5.07 [‐1.74, 11.87] |
| 13.2 Oral iron | 2 | | Mean Difference (Random, 95% CI) | 5.90 [‐0.67, 12.46] |
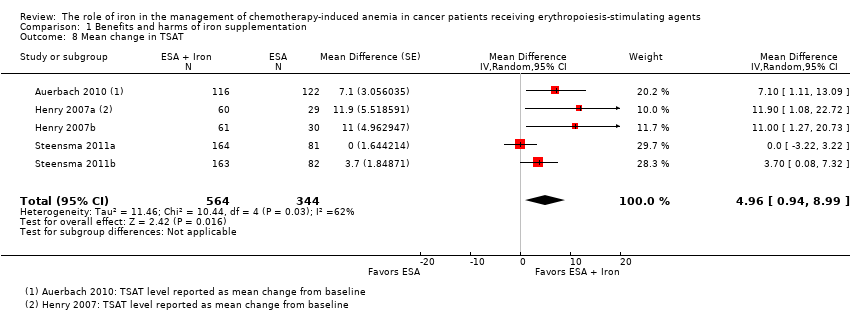
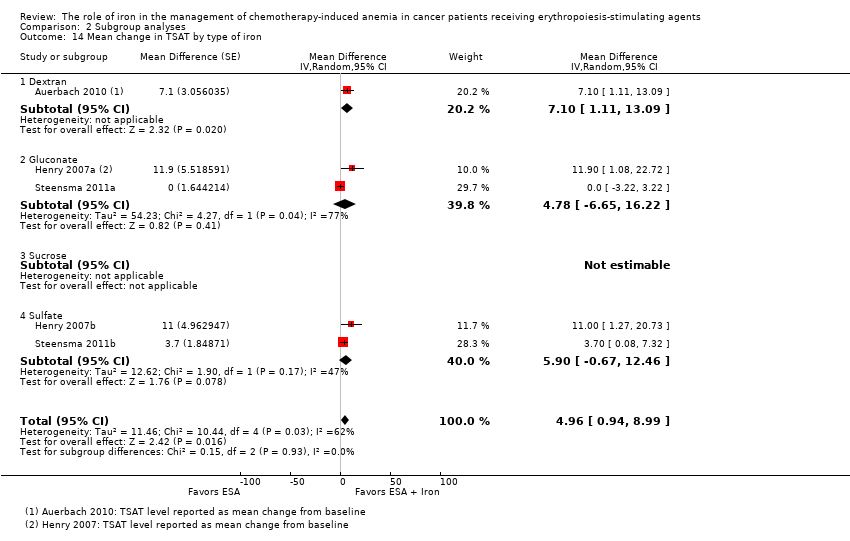
| 14 Mean change in TSAT by type of iron Show forest plot | 5 | | Mean Difference (Random, 95% CI) | 4.96 [0.94, 8.99] |
|
| 14.1 Dextran | 1 | | Mean Difference (Random, 95% CI) | 7.1 [1.11, 13.09] |
| 14.2 Gluconate | 2 | | Mean Difference (Random, 95% CI) | 4.78 [‐6.65, 16.22] |
| 14.3 Sucrose | 0 | | Mean Difference (Random, 95% CI) | 0.0 [0.0, 0.0] |
| 14.4 Sulfate | 2 | | Mean Difference (Random, 95% CI) | 5.90 [‐0.67, 12.46] |
| 15 Mean change in TSAT by type of ESA Show forest plot | 5 | | Mean Difference (Random, 95% CI) | 4.96 [0.94, 8.99] |
|
| 15.1 epoetin | 2 | | Mean Difference (Random, 95% CI) | 11.40 [4.17, 18.64] |
| 15.2 darbepoetin | 3 | | Mean Difference (Random, 95% CI) | 3.01 [‐0.73, 6.75] |