化学療法に伴う貧血管理のために赤血球造血刺激因子製剤を投与されているがん患者に対する鉄の役割について
Referencias
References to studies included in this review
References to studies excluded from this review
References to ongoing studies
Additional references
Characteristics of studies
Characteristics of included studies [ordered by study ID]
| Methods |
| |
| Participants |
| |
| Interventions |
| |
| Outcomes |
| |
| Notes |
| |
| Risk of bias | ||
| Bias | Authors' judgement | Support for judgement |
| Random sequence generation (selection bias) | High risk | Trial authors described the study as “randomized controlled” and reported that “patients were centrally randomly assigned…”, however, this information is insufficient to permit judgment about the sequence generation process because details of how sequence was generated are not provided. |
| Allocation concealment (selection bias) | Low risk | “patients were centrally randomly assigned” |
| Blinding (performance bias and detection bias) | High risk | There was no blinding (study described as “open‐label”) yet outcome measurement was likely to be influenced by lack of blinding. |
| Incomplete outcome data (attrition bias) | Low risk | Trial authors reported that efficacy data were analyzed according to the "modified ITT principle". Withdrawals and drop‐outs were adequately |
| Selective reporting (reporting bias) | Low risk | One of outcomes of interest in the review (RBC transfusion) was not reported, however, it was reported that the study was not powered to detect differences in RBC transfusion requirements. |
| Other bias | Low risk | Pre‐specified values of sample size, alpha and beta errors and delta were provided |
| Methods |
| |
| Participants |
| |
| Interventions |
| |
| Outcomes |
| |
| Notes |
| |
| Risk of bias | ||
| Bias | Authors' judgement | Support for judgement |
| Random sequence generation (selection bias) | High risk | Trial authors described the study as “randomized controlled” and reported that “patients were centrally randomly assigned…,” however this information is insufficient to permit judgment about the sequence generation process because details of how sequence was generated are not provided |
| Allocation concealment (selection bias) | Low risk | “patients were centrally randomly assigned” |
| Blinding (performance bias and detection bias) | High risk | There was no blinding (study described as “open‐label”), yet outcome measurement was likely to be influenced by lack of blinding |
| Incomplete outcome data (attrition bias) | Low risk | Trial authors reported that efficacy data were analyzed according to the "modified ITT principle." Withdrawals and dropouts were described adequately |
| Selective reporting (reporting bias) | Low risk | One outcome of interest in the review (RBC transfusion) was not reported, however it was reported that the study was not powered to detect differences in RBC transfusion requirements |
| Other bias | Low risk | Prespecified values of sample size, alpha and beta errors and delta were provided |
| Methods |
| |
| Participants |
| |
| Interventions |
| |
| Outcomes |
| |
| Notes |
| |
| Risk of bias | ||
| Bias | Authors' judgement | Support for judgement |
| Random sequence generation (selection bias) | Low risk | A randomization list was created and maintained by an independent randomization group at the study sponsor using permuted blocks. The randomization list was transmitted to an IVRS vendor for execution. |
| Allocation concealment (selection bias) | Low risk | A randomization list was created and maintained by an independent randomization group at the study sponsor using permuted blocks. The randomization list was transmitted to an IVRS vendor for execution. |
| Blinding (performance bias and detection bias) | Unclear risk | Participants were assigned blinded boxes of study medication using box numbers, which were recorded and reconciled. The study was blinded while ongoing and unblinded after all participants had completed the study. However, it is not clear whether or not the investigators were blinded |
| Incomplete outcome data (attrition bias) | Low risk | Efficay data were analyzed according to the ITT principle. Withdrawals and dropouts were described adequately |
| Selective reporting (reporting bias) | Low risk | Benefits and harms were reported as indicated in a prespecified method |
| Other bias | High risk | Data on alpha, beta errors, sample size calculation and delta were not reported; authors state in the methods section that "patients could receive oral iron if they were not randomized to IV iron supplementation." However, authors do not report the number of participants in the "ESAs only arm" who (may have) received oral iron supplementation |
| Methods |
| |
| Participants |
| |
| Interventions |
| |
| Outcomes |
| |
| Notes |
| |
| Risk of bias | ||
| Bias | Authors' judgement | Support for judgement |
| Random sequence generation (selection bias) | High risk | Trial authors described the study as a “randomized controlled trial,” but this information is insufficient to permit judgment about the sequence generation process as it lacks details of how sequence was generated |
| Allocation concealment (selection bias) | Low risk | Randomization was assigned using an interactive voice response system, which, in our opinion, could prevent participants from foreseeing assignment |
| Blinding (performance bias and detection bias) | High risk | There was no blinding (study described as “open‐label”), yet outcome measurement was likely to be influenced by lack of blinding |
| Incomplete outcome data (attrition bias) | Low risk | Trial authors reported that efficacy data were analyzed according to the ITT principle. Most participants (67% in the IV iron group, 76% in the control group) completed this study. Nonetheless importantly, the reasons for withdrawal (death, adverse events, disease progression, consent withdrawal, protocol deviations, non‐compliance) were similar across study groups |
| Selective reporting (reporting bias) | Low risk | Benefits and harms were reported as indicated in a prespecified method |
| Other bias | Low risk | Prespecified values of sample size, alpha, beta (power), and delta were provided |
| Methods |
| |
| Participants |
| |
| Interventions |
| |
| Outcomes |
| |
| Notes |
*Data obtained from www.clinicaltrials.gov records. #Some data for 'Risk of bias' assessment were obtained from www.druglib.com records. | |
| Risk of bias | ||
| Bias | Authors' judgement | Support for judgement |
| Random sequence generation (selection bias) | Low risk | Randomization was carried out following a computer‐generated randomization list |
| Allocation concealment (selection bias) | Low risk | # Randomization will be carried out centrally in Liege by faxing the inclusion form at the following number: 32‐4‐3668855. This was done around day 21 post‐transplant |
| Blinding (performance bias and detection bias) | Low risk | Personnel involved in clinical care of the participants were blinded |
| Incomplete outcome data (attrition bias) | Unclear risk | There was no reporting of data on attrition/exclusion to permit judgment about adequacy of completeness of outcome reporting |
| Selective reporting (reporting bias) | Low risk | Benefits and harms were reported as indicated in a prespecified method |
| Other bias | Unclear risk | There was insufficient information in the abstract for us to assess whether an important risk of bias existed or not |
| Methods |
| |
| Participants |
| |
| Interventions |
| |
| Outcomes |
Data reported were not amenable to statistical analysis (data are not reported per study arm). The distribution of participants in the individual study arms is not reported. | |
| Notes |
| |
| Risk of bias | ||
| Bias | Authors' judgement | Support for judgement |
| Random sequence generation (selection bias) | Unclear risk | Trial authors described the study as “randomized phase III clinical trial,” but this information is insufficient to permit judgment about the sequence generation process as it lacks details of how sequence was generated |
| Allocation concealment (selection bias) | Unclear risk | Method of concealment is not described in the abstract |
| Blinding (performance bias and detection bias) | High risk | There was no blinding (study described as “open‐label”), yet outcome measurement was likely to be influenced by lack of blinding |
| Incomplete outcome data (attrition bias) | Unclear risk | There was insufficient data to permit judgment regarding attrition bias |
| Selective reporting (reporting bias) | Unclear risk | Abstract lacks information to make a judgment regarding reporting biases |
| Other bias | Unclear risk | There was insufficient information in the abstract to assess whether an important risk of bias existed |
| Methods |
| |
| Participants |
| |
| Interventions |
| |
| Outcomes |
| |
| Notes |
| |
| Risk of bias | ||
| Bias | Authors' judgement | Support for judgement |
| Random sequence generation (selection bias) | High risk | Study described as “randomized controlled,” but this information is insufficient to permit judgment about the sequence generation process as it lacks details of how randomization sequence was generated |
| Allocation concealment (selection bias) | Low risk | “randomization was conducted centrally to avoid selection bias” |
| Blinding (performance bias and detection bias) | High risk | There was no blinding (study described as “open‐label”); outcome measurement was likely to be influenced by lack of blinding |
| Incomplete outcome data (attrition bias) | High risk | Trial authors reported that “except for number of transfusions and patients receiving transfusions,” analysis of primary and secondary efficacy endpoints was based on “evaluable population,” that is performed per protocol. In addition, the imputation method used, that is “last observed data recorded for each parameter before receiving a transfusion were carried forward through the endpoint,” could potentially bias the results |
| Selective reporting (reporting bias) | Low risk | Benefits and harms were reported as indicated in a prespecified method |
| Other bias | Low risk | Prespecified values of sample size, alpha, beta (power), and delta were provided |
| Methods |
| |
| Participants |
| |
| Interventions |
| |
| Outcomes |
| |
| Notes |
| |
| Risk of bias | ||
| Bias | Authors' judgement | Support for judgement |
| Random sequence generation (selection bias) | High risk | Study described as “randomized controlled,” but this information is insufficient to permit judgment about the sequence generation process as it lacks details of how sequence was generated |
| Allocation concealment (selection bias) | Low risk | “randomization was conducted centrally to avoid selection bias” |
| Blinding (performance bias and detection bias) | High risk | There was no blinding (study described as “open‐label”), yet outcome measurement was likely to be influenced by lack of blinding |
| Incomplete outcome data (attrition bias) | High risk | Trial authors reported that “except for number of transfusions and patients receiving transfusions,” analysis of primary and secondary efficacy endpoints was based on “evaluable population,” that is performed per protocol. In addition, the imputation method used, that is “last observed data recorded for each parameter before receiving a transfusion were carried forward through the endpoint,” could potentially bias the results |
| Selective reporting (reporting bias) | Low risk | Benefits and harms were reported as indicated in a prespecified method |
| Other bias | Low risk | Prespecified values of sample size, alpha, beta (power), and delta were provided |
| Methods |
| |
| Participants |
| |
| Interventions |
| |
| Outcomes |
| |
| Notes |
| |
| Risk of bias | ||
| Bias | Authors' judgement | Support for judgement |
| Random sequence generation (selection bias) | High risk | Trial authors described the study as “randomized trial,” but this information was insufficient to permit judgment about the sequence generation process |
| Allocation concealment (selection bias) | Low risk | Randomization was centrally conducted to avoid selection bias |
| Blinding (performance bias and detection bias) | High risk | There was no blinding (study described as “open‐label”), yet outcome measurement was likely to be influenced by lack of blinding |
| Incomplete outcome data (attrition bias) | Low risk | Data were analyzed using both ITT and per‐protocol principles |
| Selective reporting (reporting bias) | Low risk | Benefits and harms were reported as indicated in a prespecified method |
| Other bias | Low risk | Prespecified values of sample size, alpha, beta (power), and delta were provided |
| Methods |
| |
| Participants |
| |
| Interventions |
| |
| Outcomes |
| |
| Notes |
| |
| Risk of bias | ||
| Bias | Authors' judgement | Support for judgement |
| Random sequence generation (selection bias) | Low risk | In the online appendix of the paper, trial authors reported that “patients were randomly assigned at a central randomization center by using the method of Pocock and Simon, which balances the marginal distributions of each stratification factor in each of the treatment arms" |
| Allocation concealment (selection bias) | Low risk | Trial authors reported (in the online appendix) that “random assignment was done by calling the central randomization center by telephone [which] randomly assigned the patient on the basis of the stratification factors and notified the enrolling/treating institution which bottles to use for treatment. Treatment bottles (oral iron versus oral placebo) were labelled with random numbers assigned by the study statisticians by using blocked randomization…” |
| Blinding (performance bias and detection bias) | High risk | Patients and investigators were blinded to assignment of oral iron or oral placebo. However, trial authors stated that "for practical reasons, assignment to IV iron versus an oral product was not blinded," which in our opinion could bias study results |
| Incomplete outcome data (attrition bias) | Low risk | Efficacy data were analyzed using ITT principle |
| Selective reporting (reporting bias) | Low risk | Benefits and harms were reported as indicated in a prespecified method |
| Other bias | Low risk | Prespecified values of sample size, alpha, and beta (power) were provided |
ADL = activities of daily living
BFI = Brief Fatigue Inventory
CIA = chemotherapy‐induced anemia
COI = conflicts of interest
DA = darbepoietin
ECOG PS = Eastern Cooperative Oncology Group performance status
ESA = erythropoiesis‐stimulating agent
FACT‐An = Functional Assessment of Cancer Therapy‐Anemia
FACT‐F = Functional Assessment of Cancer Therapy‐Fatigue
Hb = hemoglobin
HCT = hematocrit
ITT = intention‐to‐treat
IV = intravenous
IVRS = interactive voice response system
KPS = Karnofsky Performance Scale
LASA = linear analog scale assessment
Q3W = every 3 weeks
QOL = quality of life
QOW = every other week
PBSC = peripheral blood stem cell
RBC = red blood cell
RCT = randomized controlled trial
rHuEPO = recombinant human erythropoietin
SC = subcutaneous
SD = standard deviation
SDS = Symptom Distress Scale
TDI = total dose infusion
TSAT = transferrin saturation
WHO = World Health Organization
Characteristics of excluded studies [ordered by study ID]
| Study | Reason for exclusion |
| Non‐randomized study | |
| ESA is not administered | |
| Duplicate study | |
| Participants not diagnosed with CIA | |
| ESA is not administered | |
| Duplicate study | |
| Non‐randomized study | |
| Non‐chemotherapy‐induced iron deficiency anemia in cancer patients are included | |
| This study included participants with lymphoproliferative malignancies not receiving chemotherapy. Hence these patients suffered from anemia due to cancer and not to chemotherapy | |
| ESA is not administered | |
| ESA is not administered | |
| Duplicate study | |
| Participants were randomized to receive ferric gluconate plus ESA versus lactoferrin plus ESA | |
| Duplicate study | |
| Non‐randomized study | |
| Duplicate study |
CIA = chemotherapy‐induced anemia
ESA = erythropoiesis‐stimulating agent
Characteristics of ongoing studies [ordered by study ID]
| Trial name or title | A Phase III, Randomized, Open‐Label Study of Intravenous Iron Isomaltoside 1000 (Monofer®) as Mono Therapy (Without Erythropoiesis Stimulating Agents) in Comparison With Oral Iron Sulfate in Subjects With Non‐Myeloid Malignancies Associated With Chemotherapy Induced Anaemia (CIA) |
| Methods | A 2‐arm, open‐label, parallel, randomized safety/efficacy study Study location: Appolo Hospitals, New Delhi, India |
| Participants | Inclusion criteria:
Exclusion criteria:
|
| Interventions | Experimental drug: iron isomaltoside 1000; intravenously as bolus or infusion, 500 mg or 1000 mg up to full replacement dose. Other name: Monofer Active comparator drug: iron sulphate; oral, 200 mg per day (100 mg twice a day), 12 weeks. Other name: Ferro Duretter |
| Outcomes | Primary outcome: change in Hb concentration (Time Frame: Baseline and 12 weeks); (Designated as safety issue: No) Secondary outcomes: number of study drug‐related adverse events (including serious adverse reactions) in iron isomaltoside 1000 (Monofer®) group and iron sulfate group. (Time Frame: Baseline and 24 weeks); (Designated as safety issue: Yes) |
| Starting date | October 2010 |
| Contact information | ClinicalTrials.gov identifier: NCT01145638. Study PI: Dr. Thomsen Lars Lykee, MD |
| Notes | Funded by: Pharmacosmos A/S Other study IDs: P‐Monofer‐CIA‐01, EudraCT no. 2009‐016727‐53 |
CIA = chemotherapy‐induced anemia
ECOG PS = Eastern Cooperative Oncology Group performance status
Hb = hemoglobin
HIPAA = Health Insurance Portability and Accountability Act
IV = intravenous
TSAT = transferrin saturation
Data and analyses
| Outcome or subgroup title | No. of studies | No. of participants | Statistical method | Effect size |
| 1 Hematopoietic response Show forest plot | 11 | 1712 | Risk Ratio (IV, Random, 95% CI) | 1.17 [1.09, 1.26] |
| Analysis 1.1  Comparison 1 Benefits and harms of iron supplementation, Outcome 1 Hematopoietic response. | ||||
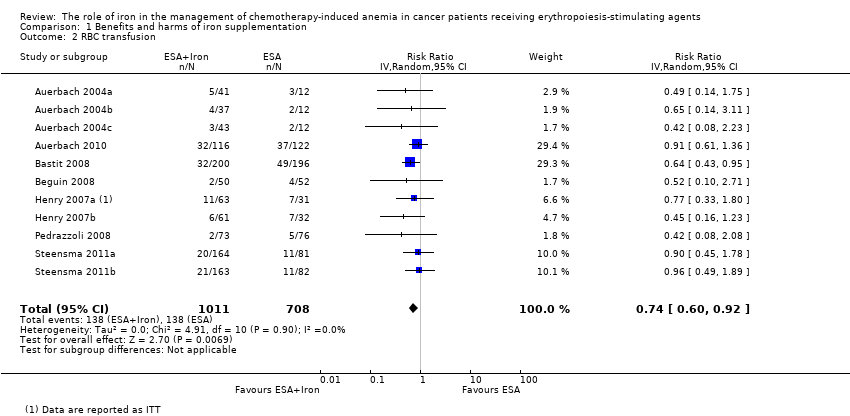
| 2 RBC transfusion Show forest plot | 11 | 1719 | Risk Ratio (IV, Random, 95% CI) | 0.74 [0.60, 0.92] |
| Analysis 1.2  Comparison 1 Benefits and harms of iron supplementation, Outcome 2 RBC transfusion. | ||||
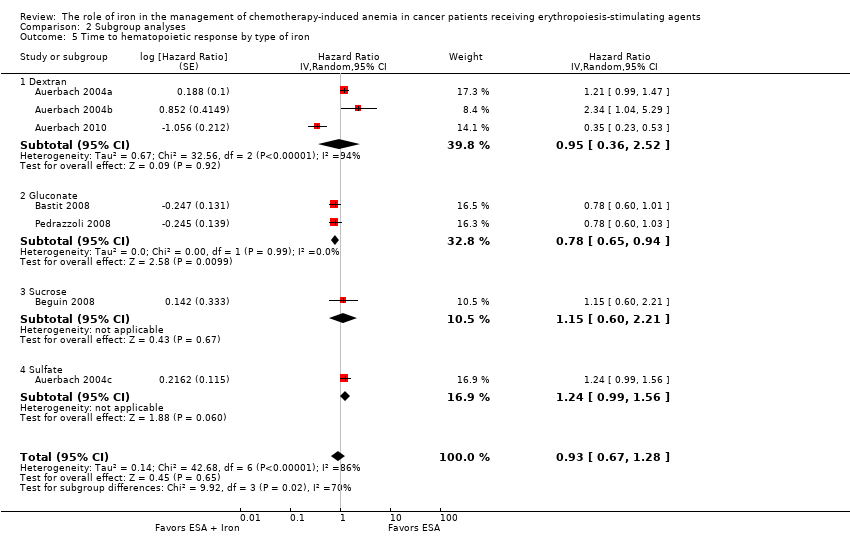
| 3 Time to hematopoietic response Show forest plot | 7 | 1042 | Hazard Ratio (Random, 95% CI) | 0.93 [0.67, 1.28] |
| Analysis 1.3  Comparison 1 Benefits and harms of iron supplementation, Outcome 3 Time to hematopoietic response. | ||||
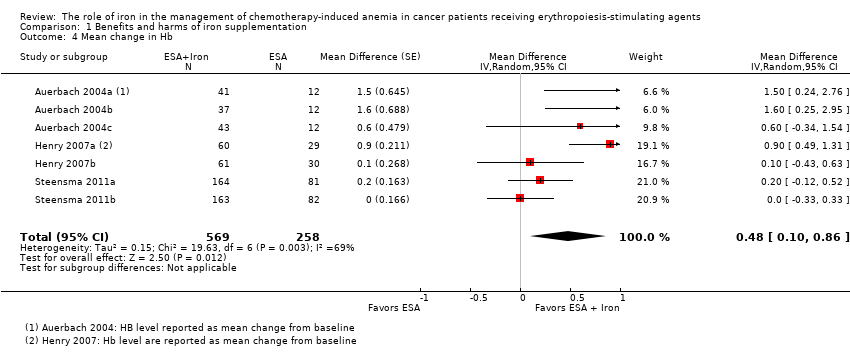
| 4 Mean change in Hb Show forest plot | 7 | 827 | Mean Difference (Random, 95% CI) | 0.48 [0.10, 0.86] |
| Analysis 1.4  Comparison 1 Benefits and harms of iron supplementation, Outcome 4 Mean change in Hb. | ||||
| 5 Quality of life Show forest plot | 4 | 1124 | Std. Mean Difference (Random, 95% CI) | 0.01 [‐0.10, 0.12] |
| Analysis 1.5  Comparison 1 Benefits and harms of iron supplementation, Outcome 5 Quality of life. | ||||
| 6 Thromboembolic events Show forest plot | 3 | 783 | Risk Ratio (IV, Random, 95% CI) | 0.95 [0.54, 1.65] |
| Analysis 1.6 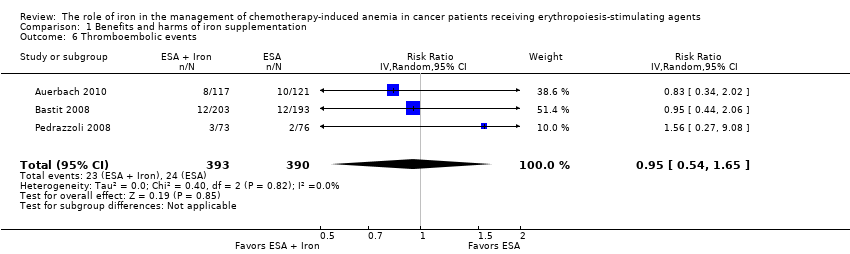 Comparison 1 Benefits and harms of iron supplementation, Outcome 6 Thromboembolic events. | ||||
| 7 Mean change in serum ferritin Show forest plot | 6 | 1010 | Mean Difference (Random, 95% CI) | 253.02 [84.30, 421.73] |
| Analysis 1.7  Comparison 1 Benefits and harms of iron supplementation, Outcome 7 Mean change in serum ferritin. | ||||
| 8 Mean change in TSAT Show forest plot | 5 | 908 | Mean Difference (Random, 95% CI) | 4.96 [0.94, 8.99] |
| Analysis 1.8  Comparison 1 Benefits and harms of iron supplementation, Outcome 8 Mean change in TSAT. | ||||
| Outcome or subgroup title | No. of studies | No. of participants | Statistical method | Effect size |
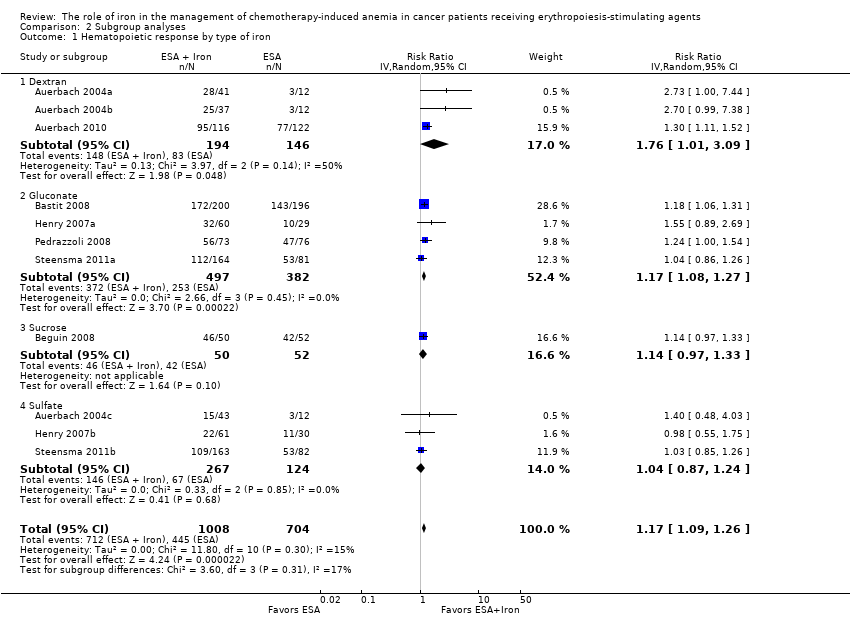
| 1 Hematopoietic response by type of iron Show forest plot | 11 | 1712 | Risk Ratio (IV, Random, 95% CI) | 1.17 [1.09, 1.26] |
| Analysis 2.1  Comparison 2 Subgroup analyses, Outcome 1 Hematopoietic response by type of iron. | ||||
| 1.1 Dextran | 3 | 340 | Risk Ratio (IV, Random, 95% CI) | 1.76 [1.01, 3.09] |
| 1.2 Gluconate | 4 | 879 | Risk Ratio (IV, Random, 95% CI) | 1.17 [1.08, 1.27] |
| 1.3 Sucrose | 1 | 102 | Risk Ratio (IV, Random, 95% CI) | 1.14 [0.97, 1.33] |
| 1.4 Sulfate | 3 | 391 | Risk Ratio (IV, Random, 95% CI) | 1.04 [0.87, 1.24] |
| 2 Hematopoietic response by route of administration Show forest plot | 11 | 1712 | Risk Ratio (IV, Random, 95% CI) | 1.17 [1.09, 1.26] |
| Analysis 2.2 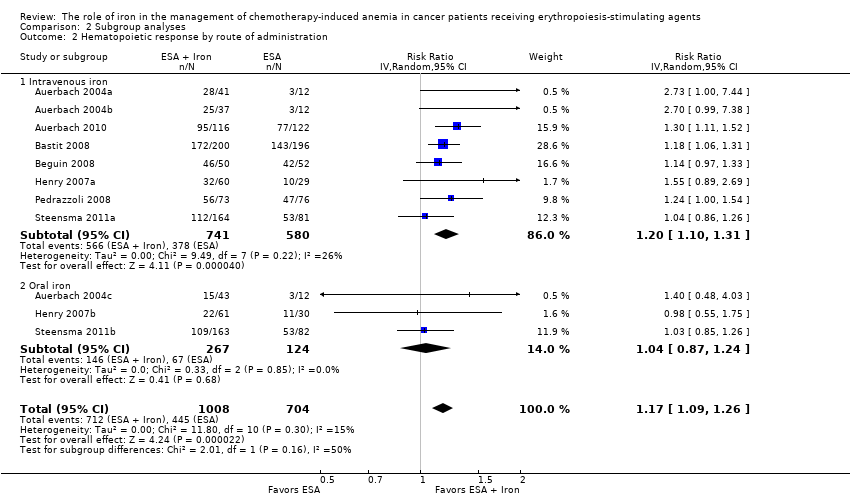 Comparison 2 Subgroup analyses, Outcome 2 Hematopoietic response by route of administration. | ||||
| 2.1 Intravenous iron | 8 | 1321 | Risk Ratio (IV, Random, 95% CI) | 1.20 [1.10, 1.31] |
| 2.2 Oral iron | 3 | 391 | Risk Ratio (IV, Random, 95% CI) | 1.04 [0.87, 1.24] |
| 3 Hematopoietic response by type of ESA Show forest plot | 11 | 1712 | Risk Ratio (IV, Random, 95% CI) | 1.17 [1.09, 1.26] |
| Analysis 2.3 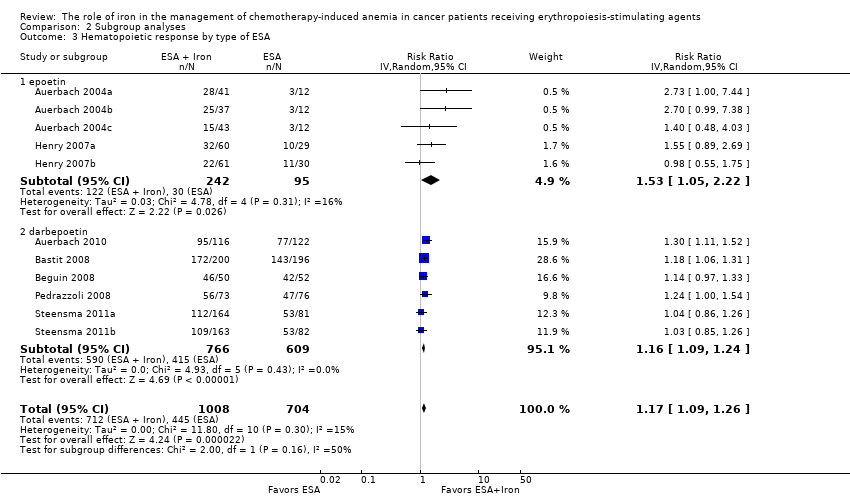 Comparison 2 Subgroup analyses, Outcome 3 Hematopoietic response by type of ESA. | ||||
| 3.1 epoetin | 5 | 337 | Risk Ratio (IV, Random, 95% CI) | 1.53 [1.05, 2.22] |
| 3.2 darbepoetin | 6 | 1375 | Risk Ratio (IV, Random, 95% CI) | 1.16 [1.09, 1.24] |
| 4 Time to hematopoietic response by route of administration Show forest plot | 7 | Hazard Ratio (Random, 95% CI) | 0.93 [0.67, 1.28] | |
| Analysis 2.4 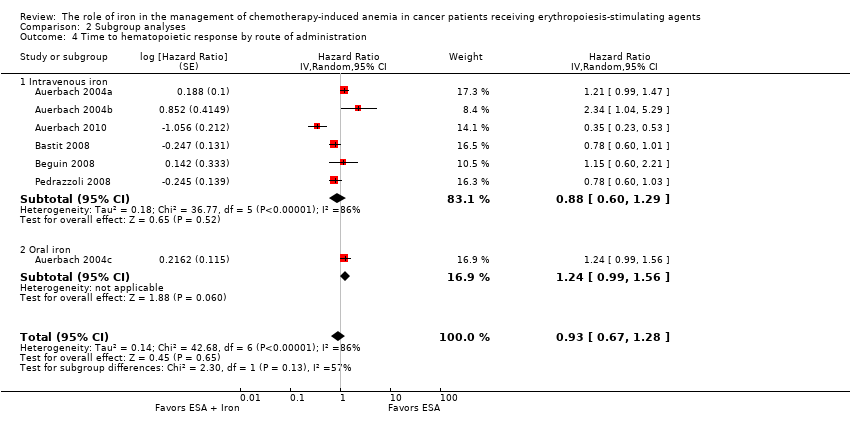 Comparison 2 Subgroup analyses, Outcome 4 Time to hematopoietic response by route of administration. | ||||
| 4.1 Intravenous iron | 6 | Hazard Ratio (Random, 95% CI) | 0.88 [0.60, 1.29] | |
| 4.2 Oral iron | 1 | Hazard Ratio (Random, 95% CI) | 1.24 [0.99, 1.56] | |
| 5 Time to hematopoietic response by type of iron Show forest plot | 7 | Hazard Ratio (Random, 95% CI) | 0.93 [0.67, 1.28] | |
| Analysis 2.5  Comparison 2 Subgroup analyses, Outcome 5 Time to hematopoietic response by type of iron. | ||||
| 5.1 Dextran | 3 | Hazard Ratio (Random, 95% CI) | 0.95 [0.36, 2.52] | |
| 5.2 Gluconate | 2 | Hazard Ratio (Random, 95% CI) | 0.78 [0.65, 0.94] | |
| 5.3 Sucrose | 1 | Hazard Ratio (Random, 95% CI) | 1.15 [0.60, 2.21] | |
| 5.4 Sulfate | 1 | Hazard Ratio (Random, 95% CI) | 1.24 [0.99, 1.56] | |
| 6 Time to hematopoietic response by type of ESA Show forest plot | 7 | Hazard Ratio (Random, 95% CI) | 0.93 [0.67, 1.28] | |
| Analysis 2.6  Comparison 2 Subgroup analyses, Outcome 6 Time to hematopoietic response by type of ESA. | ||||
| 6.1 epoetin | 4 | Hazard Ratio (Random, 95% CI) | 1.00 [0.58, 1.72] | |
| 6.2 darbepoetin | 3 | Hazard Ratio (Random, 95% CI) | 0.81 [0.67, 0.96] | |
| 7 Mean change in Hb by route of administration Show forest plot | 7 | Mean Difference (Random, 95% CI) | 0.48 [0.10, 0.86] | |
| Analysis 2.7  Comparison 2 Subgroup analyses, Outcome 7 Mean change in Hb by route of administration. | ||||
| 7.1 Intravenous iron | 4 | Mean Difference (Random, 95% CI) | 0.84 [0.21, 1.46] | |
| 7.2 Oral iron | 3 | Mean Difference (Random, 95% CI) | 0.07 [‐0.19, 0.34] | |
| 8 Mean change in Hb by type of iron Show forest plot | 7 | Mean Difference (Random, 95% CI) | 0.48 [0.10, 0.86] | |
| Analysis 2.8 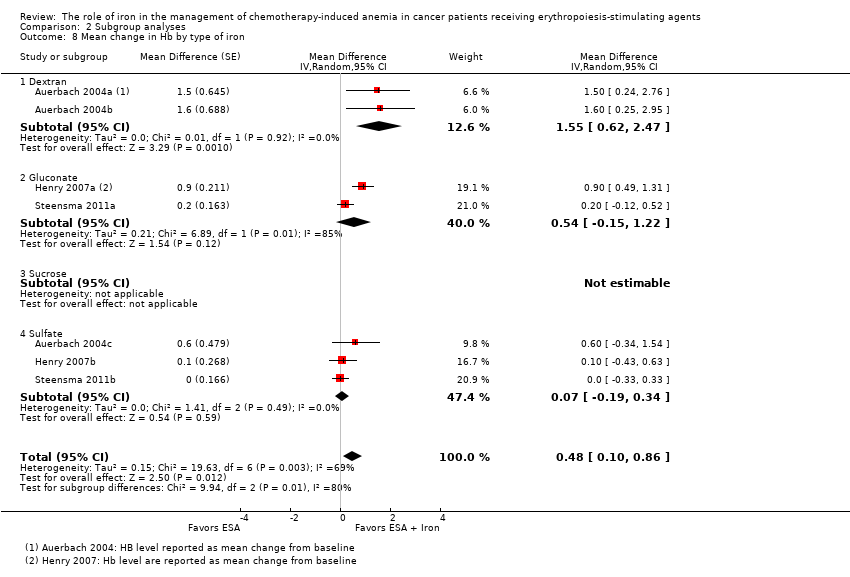 Comparison 2 Subgroup analyses, Outcome 8 Mean change in Hb by type of iron. | ||||
| 8.1 Dextran | 2 | Mean Difference (Random, 95% CI) | 1.55 [0.62, 2.47] | |
| 8.2 Gluconate | 2 | Mean Difference (Random, 95% CI) | 0.54 [‐0.15, 1.22] | |
| 8.3 Sucrose | 0 | Mean Difference (Random, 95% CI) | 0.0 [0.0, 0.0] | |
| 8.4 Sulfate | 3 | Mean Difference (Random, 95% CI) | 0.07 [‐0.19, 0.34] | |
| 9 Mean change in Hb by type of ESA Show forest plot | 7 | Mean Difference (Random, 95% CI) | 0.48 [0.10, 0.86] | |
| Analysis 2.9 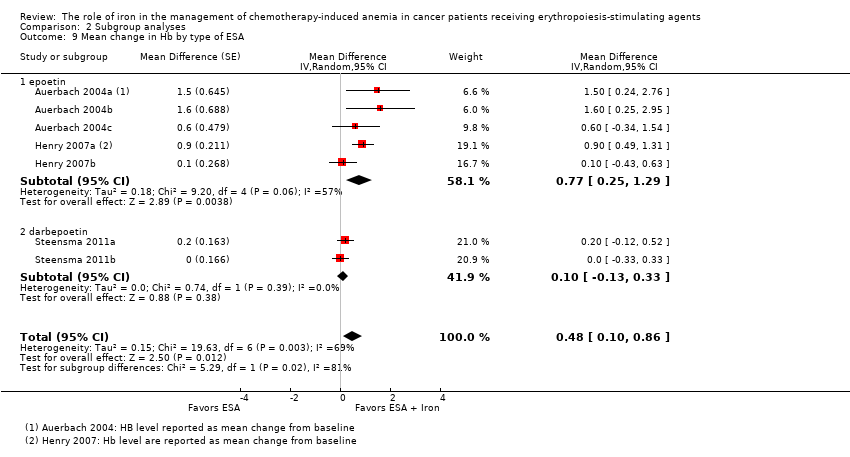 Comparison 2 Subgroup analyses, Outcome 9 Mean change in Hb by type of ESA. | ||||
| 9.1 epoetin | 5 | Mean Difference (Random, 95% CI) | 0.77 [0.25, 1.29] | |
| 9.2 darbepoetin | 2 | Mean Difference (Random, 95% CI) | 0.10 [‐0.13, 0.33] | |
| 10 Mean change in serum ferritin by route of administration Show forest plot | 6 | Mean Difference (Random, 95% CI) | 253.02 [84.30, 421.73] | |
| Analysis 2.10  Comparison 2 Subgroup analyses, Outcome 10 Mean change in serum ferritin by route of administration. | ||||
| 10.1 Intravenous iron | 4 | Mean Difference (Random, 95% CI) | 362.15 [219.69, 504.61] | |
| 10.2 Oral iron | 2 | Mean Difference (Random, 95% CI) | 72.18 [‐6.59, 150.95] | |
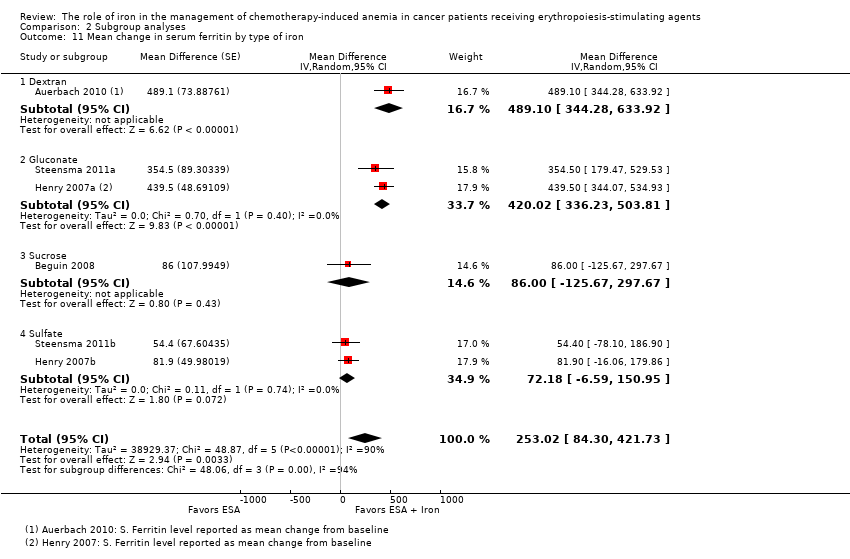
| 11 Mean change in serum ferritin by type of iron Show forest plot | 6 | Mean Difference (Random, 95% CI) | 253.02 [84.30, 421.73] | |
| Analysis 2.11  Comparison 2 Subgroup analyses, Outcome 11 Mean change in serum ferritin by type of iron. | ||||
| 11.1 Dextran | 1 | Mean Difference (Random, 95% CI) | 489.1 [344.28, 633.92] | |
| 11.2 Gluconate | 2 | Mean Difference (Random, 95% CI) | 420.02 [336.23, 503.81] | |
| 11.3 Sucrose | 1 | Mean Difference (Random, 95% CI) | 86.0 [‐125.67, 297.67] | |
| 11.4 Sulfate | 2 | Mean Difference (Random, 95% CI) | 72.18 [‐6.59, 150.95] | |
| 12 Mean change in serum ferritin by type of ESA Show forest plot | 6 | Mean Difference (Random, 95% CI) | 253.02 [84.30, 421.73] | |
| Analysis 2.12  Comparison 2 Subgroup analyses, Outcome 12 Mean change in serum ferritin by type of ESA. | ||||
| 12.1 epoetin | 2 | Mean Difference (Random, 95% CI) | 260.88 [‐89.56, 611.32] | |
| 12.2 darbepoetin | 4 | Mean Difference (Random, 95% CI) | 248.35 [26.24, 470.45] | |
| 13 Mean change in TSAT by route of administration Show forest plot | 5 | Mean Difference (Random, 95% CI) | 4.96 [0.94, 8.99] | |
| Analysis 2.13 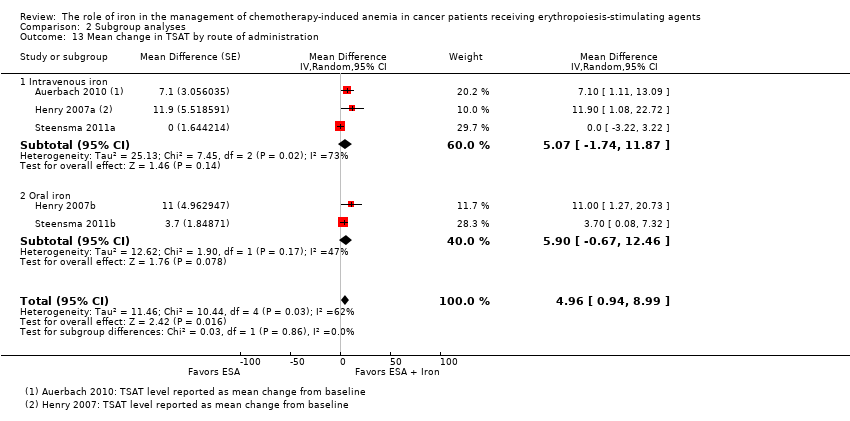 Comparison 2 Subgroup analyses, Outcome 13 Mean change in TSAT by route of administration. | ||||
| 13.1 Intravenous iron | 3 | Mean Difference (Random, 95% CI) | 5.07 [‐1.74, 11.87] | |
| 13.2 Oral iron | 2 | Mean Difference (Random, 95% CI) | 5.90 [‐0.67, 12.46] | |
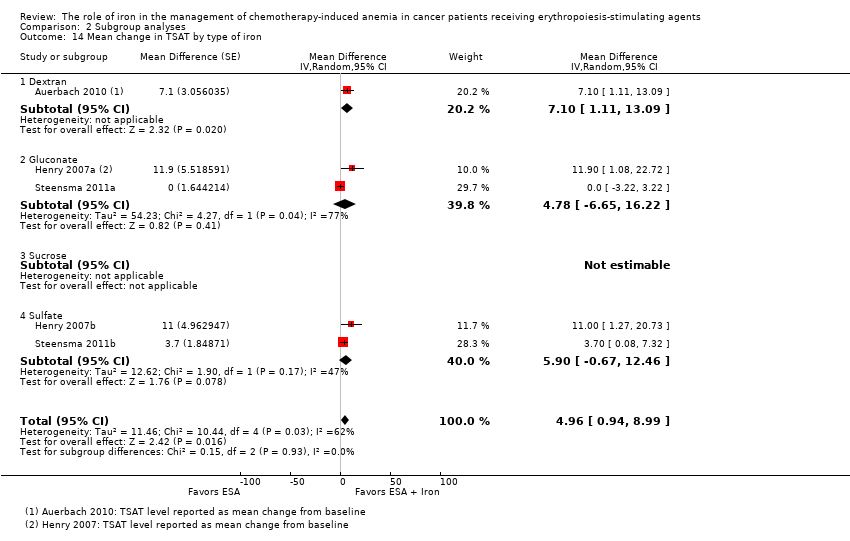
| 14 Mean change in TSAT by type of iron Show forest plot | 5 | Mean Difference (Random, 95% CI) | 4.96 [0.94, 8.99] | |
| Analysis 2.14  Comparison 2 Subgroup analyses, Outcome 14 Mean change in TSAT by type of iron. | ||||
| 14.1 Dextran | 1 | Mean Difference (Random, 95% CI) | 7.1 [1.11, 13.09] | |
| 14.2 Gluconate | 2 | Mean Difference (Random, 95% CI) | 4.78 [‐6.65, 16.22] | |
| 14.3 Sucrose | 0 | Mean Difference (Random, 95% CI) | 0.0 [0.0, 0.0] | |
| 14.4 Sulfate | 2 | Mean Difference (Random, 95% CI) | 5.90 [‐0.67, 12.46] | |
| 15 Mean change in TSAT by type of ESA Show forest plot | 5 | Mean Difference (Random, 95% CI) | 4.96 [0.94, 8.99] | |
| Analysis 2.15 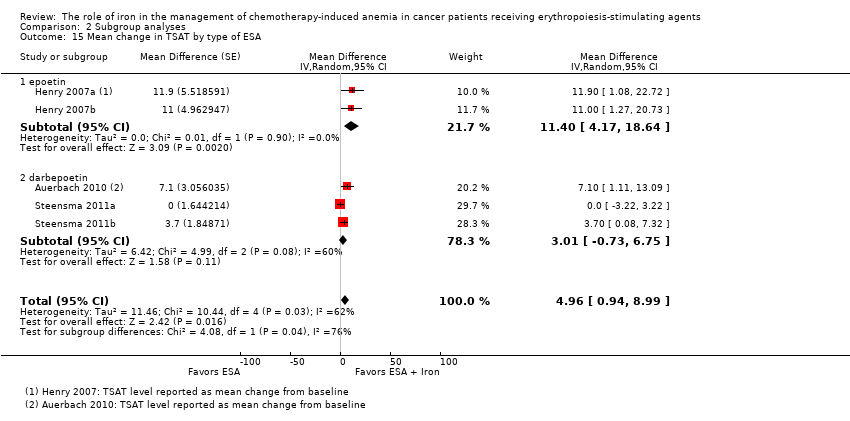 Comparison 2 Subgroup analyses, Outcome 15 Mean change in TSAT by type of ESA. | ||||
| 15.1 epoetin | 2 | Mean Difference (Random, 95% CI) | 11.40 [4.17, 18.64] | |
| 15.2 darbepoetin | 3 | Mean Difference (Random, 95% CI) | 3.01 [‐0.73, 6.75] | |
| Outcome or subgroup title | No. of studies | No. of participants | Statistical method | Effect size |
| 1 Random sequence generation Show forest plot | 11 | 1712 | Risk Ratio (IV, Random, 95% CI) | 1.17 [1.09, 1.26] |
| Analysis 3.1 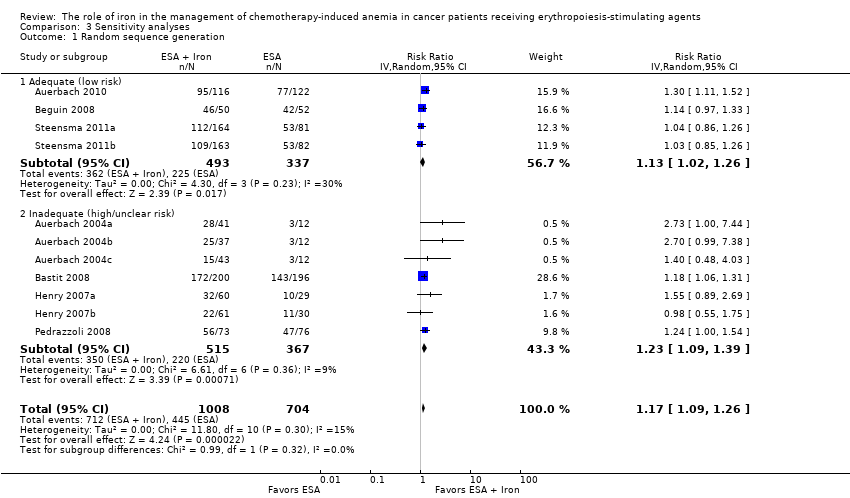 Comparison 3 Sensitivity analyses, Outcome 1 Random sequence generation. | ||||
| 1.1 Adequate (low risk) | 4 | 830 | Risk Ratio (IV, Random, 95% CI) | 1.13 [1.02, 1.26] |
| 1.2 Inadequate (high/unclear risk) | 7 | 882 | Risk Ratio (IV, Random, 95% CI) | 1.23 [1.09, 1.39] |
| 2 Allocation concealment Show forest plot | 11 | 1711 | Risk Ratio (IV, Random, 95% CI) | 1.17 [1.09, 1.26] |
| Analysis 3.2  Comparison 3 Sensitivity analyses, Outcome 2 Allocation concealment. | ||||
| 2.1 Adequate (low risk) | 11 | 1711 | Risk Ratio (IV, Random, 95% CI) | 1.17 [1.09, 1.26] |
| 2.2 Inadequate (high/unclear risk) | 0 | 0 | Risk Ratio (IV, Random, 95% CI) | 0.0 [0.0, 0.0] |
| 3 Blinding Show forest plot | 11 | 1712 | Risk Ratio (IV, Random, 95% CI) | 1.17 [1.09, 1.26] |
| Analysis 3.3 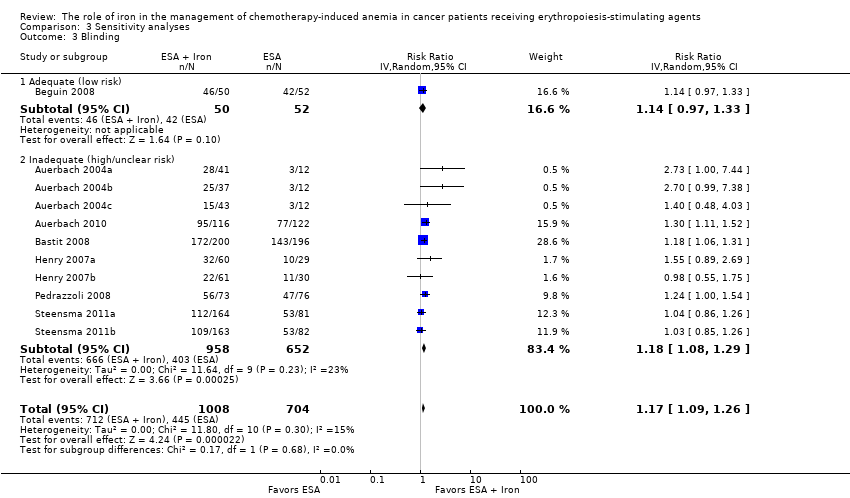 Comparison 3 Sensitivity analyses, Outcome 3 Blinding. | ||||
| 3.1 Adequate (low risk) | 1 | 102 | Risk Ratio (IV, Random, 95% CI) | 1.14 [0.97, 1.33] |
| 3.2 Inadequate (high/unclear risk) | 10 | 1610 | Risk Ratio (IV, Random, 95% CI) | 1.18 [1.08, 1.29] |
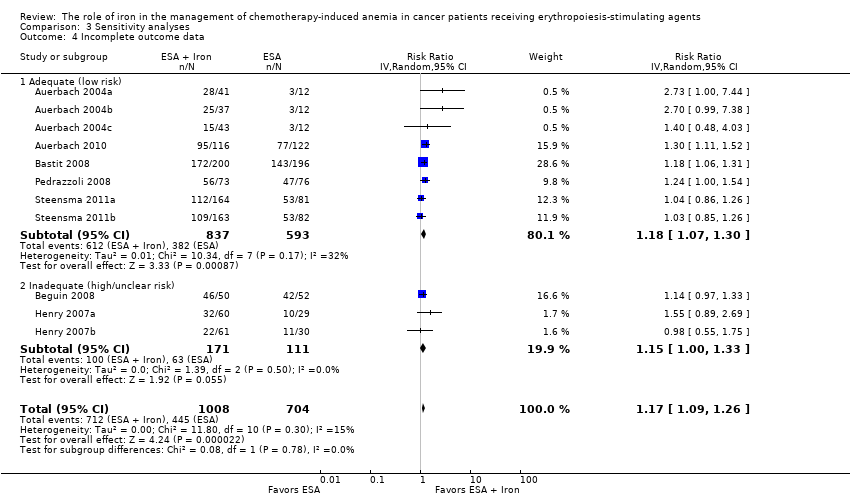
| 4 Incomplete outcome data Show forest plot | 11 | 1712 | Risk Ratio (IV, Random, 95% CI) | 1.17 [1.09, 1.26] |
| Analysis 3.4  Comparison 3 Sensitivity analyses, Outcome 4 Incomplete outcome data. | ||||
| 4.1 Adequate (low risk) | 8 | 1430 | Risk Ratio (IV, Random, 95% CI) | 1.18 [1.07, 1.30] |
| 4.2 Inadequate (high/unclear risk) | 3 | 282 | Risk Ratio (IV, Random, 95% CI) | 1.15 [1.00, 1.33] |
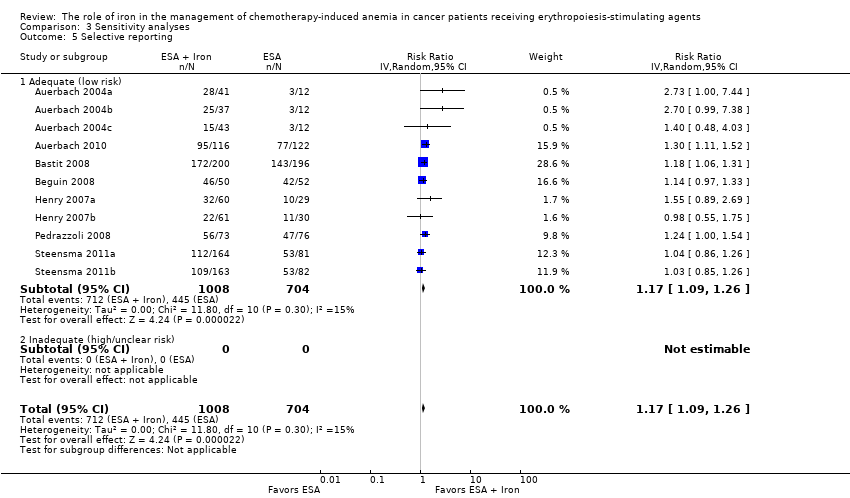
| 5 Selective reporting Show forest plot | 11 | 1712 | Risk Ratio (IV, Random, 95% CI) | 1.17 [1.09, 1.26] |
| Analysis 3.5  Comparison 3 Sensitivity analyses, Outcome 5 Selective reporting. | ||||
| 5.1 Adequate (low risk) | 11 | 1712 | Risk Ratio (IV, Random, 95% CI) | 1.17 [1.09, 1.26] |
| 5.2 Inadequate (high/unclear risk) | 0 | 0 | Risk Ratio (IV, Random, 95% CI) | 0.0 [0.0, 0.0] |
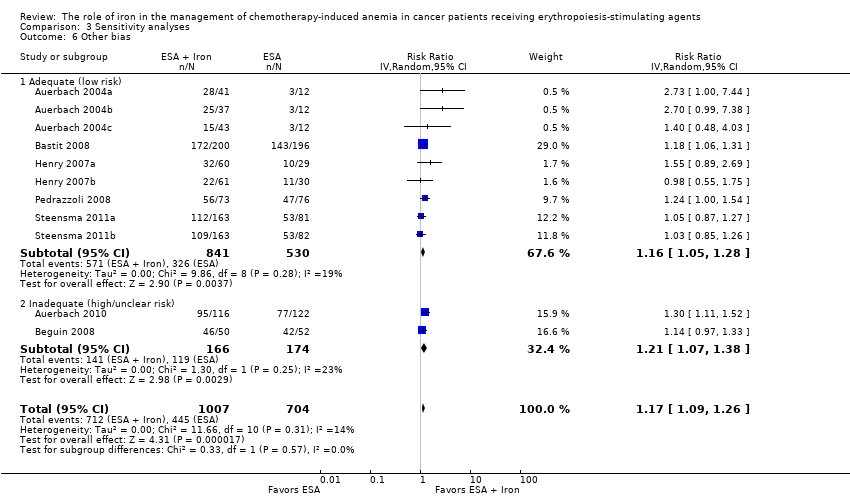
| 6 Other bias Show forest plot | 11 | 1711 | Risk Ratio (IV, Random, 95% CI) | 1.17 [1.09, 1.26] |
| Analysis 3.6  Comparison 3 Sensitivity analyses, Outcome 6 Other bias. | ||||
| 6.1 Adequate (low risk) | 9 | 1371 | Risk Ratio (IV, Random, 95% CI) | 1.16 [1.05, 1.28] |
| 6.2 Inadequate (high/unclear risk) | 2 | 340 | Risk Ratio (IV, Random, 95% CI) | 1.21 [1.07, 1.38] |
| 7 Hematopoietic response by definition(s) Show forest plot | 11 | 1712 | Risk Ratio (IV, Random, 95% CI) | 1.17 [1.09, 1.26] |
| Analysis 3.7  Comparison 3 Sensitivity analyses, Outcome 7 Hematopoietic response by definition(s). | ||||
| 7.1 Hematopoietic response | 8 | 1430 | Risk Ratio (IV, Random, 95% CI) | 1.18 [1.07, 1.30] |
| 7.2 Hematologic response | 2 | 180 | Risk Ratio (IV, Random, 95% CI) | 1.24 [0.80, 1.94] |
| 7.3 Patients reaching Hb > 13 g/dL | 1 | 102 | Risk Ratio (IV, Random, 95% CI) | 1.14 [0.97, 1.33] |

Study flow diagram.

Risk of bias summary: Review authors' judgments about risk of bias in each included study.
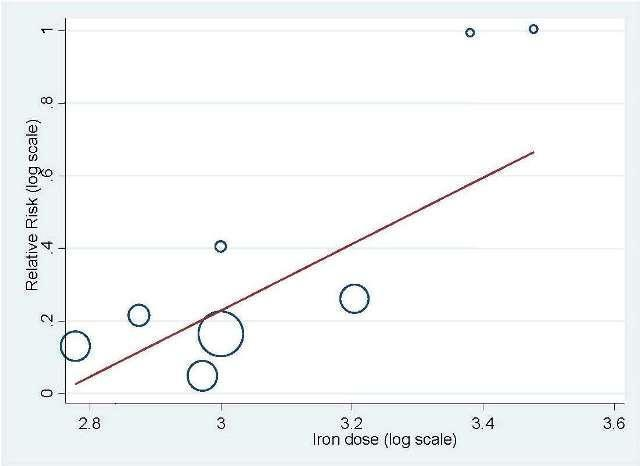
Meta‐regression: total IV iron dose and hematopoietic response

Meta‐regression: baseline serum ferritin and hematopoietic response.
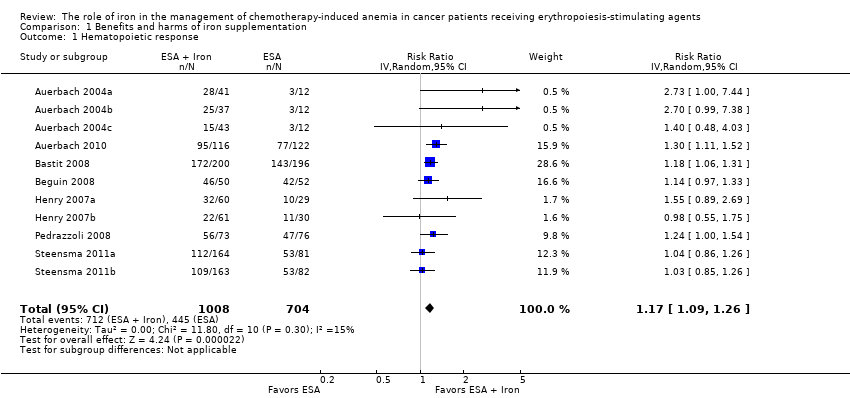
Comparison 1 Benefits and harms of iron supplementation, Outcome 1 Hematopoietic response.
Comparison 1 Benefits and harms of iron supplementation, Outcome 2 RBC transfusion.

Comparison 1 Benefits and harms of iron supplementation, Outcome 3 Time to hematopoietic response.
Comparison 1 Benefits and harms of iron supplementation, Outcome 4 Mean change in Hb.

Comparison 1 Benefits and harms of iron supplementation, Outcome 5 Quality of life.

Comparison 1 Benefits and harms of iron supplementation, Outcome 6 Thromboembolic events.

Comparison 1 Benefits and harms of iron supplementation, Outcome 7 Mean change in serum ferritin.
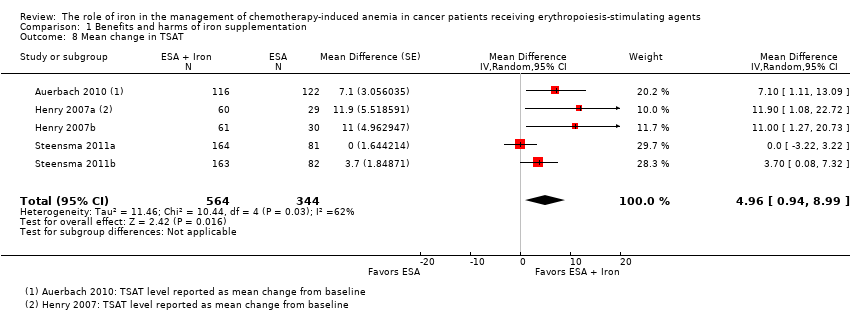
Comparison 1 Benefits and harms of iron supplementation, Outcome 8 Mean change in TSAT.
Comparison 2 Subgroup analyses, Outcome 1 Hematopoietic response by type of iron.

Comparison 2 Subgroup analyses, Outcome 2 Hematopoietic response by route of administration.

Comparison 2 Subgroup analyses, Outcome 3 Hematopoietic response by type of ESA.

Comparison 2 Subgroup analyses, Outcome 4 Time to hematopoietic response by route of administration.
Comparison 2 Subgroup analyses, Outcome 5 Time to hematopoietic response by type of iron.

Comparison 2 Subgroup analyses, Outcome 6 Time to hematopoietic response by type of ESA.

Comparison 2 Subgroup analyses, Outcome 7 Mean change in Hb by route of administration.

Comparison 2 Subgroup analyses, Outcome 8 Mean change in Hb by type of iron.

Comparison 2 Subgroup analyses, Outcome 9 Mean change in Hb by type of ESA.

Comparison 2 Subgroup analyses, Outcome 10 Mean change in serum ferritin by route of administration.
Comparison 2 Subgroup analyses, Outcome 11 Mean change in serum ferritin by type of iron.

Comparison 2 Subgroup analyses, Outcome 12 Mean change in serum ferritin by type of ESA.

Comparison 2 Subgroup analyses, Outcome 13 Mean change in TSAT by route of administration.
Comparison 2 Subgroup analyses, Outcome 14 Mean change in TSAT by type of iron.

Comparison 2 Subgroup analyses, Outcome 15 Mean change in TSAT by type of ESA.

Comparison 3 Sensitivity analyses, Outcome 1 Random sequence generation.

Comparison 3 Sensitivity analyses, Outcome 2 Allocation concealment.

Comparison 3 Sensitivity analyses, Outcome 3 Blinding.
Comparison 3 Sensitivity analyses, Outcome 4 Incomplete outcome data.
Comparison 3 Sensitivity analyses, Outcome 5 Selective reporting.
Comparison 3 Sensitivity analyses, Outcome 6 Other bias.

Comparison 3 Sensitivity analyses, Outcome 7 Hematopoietic response by definition(s).
| Benefits and harms of iron supplementation for chemotherapy‐induced anemia | |||||
| Patient or population: people diagnosed with chemotherapy‐induced anemia Comparison: erythropoiesis‐stimulating agents alone | |||||
| Outcomes | Illustrative comparative risks* (95% CI) | Relative effect | No of Participants | Quality of the evidence | |
| Assumed risk | Corresponding risk | ||||
| Control | Benefits and harms of iron supplementation | ||||
| Overall survival | None of the included studies reported data on overall survival | ||||
| Hematopoietic response | Study population | RR 1.17 | 1712 (7 studies, 11 comparisons) | ⊕⊕⊕⊕ | |
| 632 per 1000 | 740 per 1000 | ||||
| Moderate## | |||||
| 574 per 1000 | 672 per 1000 | ||||
| Red blood cell transfusion | Study population | RR 0.74 | 1719 (7 studies, 11 comparisons) | ⊕⊕⊕⊝ | |
| 195 per 1000 | 144 per 1000 | ||||
| Moderate## | |||||
| 167 per 1000 | 124 per 1000 | ||||
| Median time to hematopoietic response | Not applicable# | HR 0.93 (0.67 to 1.28) | 1042 (5 studies, 7 comparisons) | ⊕⊕⊝⊝ low1,2 | |
| Mean change in hemoglobin (better indicated by higher values) | The mean change in hemoglobin in the intervention groups was 0.48 higher | MD 0.48 (0.10 to 0.86) | 827 (3 studies, 7 comparisons) | ⊕⊕⊝⊝ | |
| Quality of life (better indicated by higher values) | The mean quality of life in the intervention groups was | SMD 0.01 (‐0.10 to 0.12) | 1124 (3 studies, 4 comparisons) | ⊕⊕⊕⊕ | |
| Thromboembolic events | Study population | RR 0.95 | 783 (3 studies) | ⊕⊕⊕⊝ | |
| 62 per 1000 | 58 per 1000 | ||||
| Moderate## | |||||
| 62 per 1000 | 59 per 1000 | ||||
| Treatment‐related mortality | Not applicable** | Zero events** | 997 (4 studies, 6 comparisons) | ⊕⊕⊕⊕ | |
| *The basis for the assumed risk (e.g. the median control group risk across studies) is provided in footnotes. The corresponding risk (and its 95% confidence interval) is based on the assumed risk in the comparison group and the relative effect of the intervention (and its 95% CI). | |||||
| GRADE Working Group grades of evidence | |||||
| 1Downgraded the quality of evidence by one level due to imprecision (the pooled estimate had wider confidence intervals). **Due to zero events we were not able to conduct meta‐analysis of these data. #Data were available as median and range, and hence were converted to log hazard ratio using the cumulative hazard log‐log transform method. ##The moderate control risk was calculated via GRADEpro software based on clinical experience of the review authors working in the field of hematological disorders. | |||||
| Study ID | Morbidities | Rx group 1 N (%) | Rx group 2 N (%) | Rx group 3 N (%) | Treatment‐related mortality |
| Auerbach 2004 | Participants with any AEs
| ESAs + TDI iron N = 41 | ESAs + bolus iron N = 37 | ESAs + oral iron N = 43 | Zero events |
| 3 (7) | 3 (8) | 1 (2) | |||
| Auerbach 2010 | ‐ | ‐ | ESAs + IV iron N = 117 | ESAs alone N = 121 | Zero events |
| Participants with any AEs | ‐ | 104 (89) | 110 (91) | ||
| Participants with serious AEs | ‐ | 41 (35) | 45 (37) | ||
| Participants with treatment‐related AEs | ‐ | 14 (12) | 0 (0) | ||
| Participants with serious treatment‐related AEs | ‐ | 3 (3)a | 0 (0) | ||
| Participants with AEs leading to study discontinuation | ‐ | 12 (10) | 14 (12) | ||
| Cardiovascular and thromboembolic events | ‐ | 18 (15) | 19 (16) | ||
| Embolism/thrombosis | ‐ | 8 (7) | 10 (8) | ||
| Arrhythmias | ‐ | 9 (8) | 7 (6) | ||
| Congestive heart failure | ‐ | 3 (3) | 1 (1) | ||
| Myocardial infarction/artery disorders | ‐ | 2 (2) | 2 (2) | ||
| Cerebrovascular accident | ‐ | 1 (1) | 0 (0) | ||
| Deaths on study (any reason)b | ‐ | 8 (7) | 13 (11) | ||
| Bastit 2008 | ‐ | ‐ | ESAs + IV iron N = 203 | ESAs alone N = 193 | Not reported |
| No. of participants reporting specific AEs | ‐ | 21 (10) | 26 (13) | ||
| Embolism/thrombosis, arterial and venous | ‐ | 12 (6) | 12 (6) | ||
| Myocardial infarction, ischemic and coronary artery disease | ‐ | 3 (1) | 1 (1) | ||
| Hypertension | ‐ | 2 (1) | 5 (3) | ||
| Congestive heart failure | ‐ | 1 (0) | 3 (2) | ||
| Cerebrovascular accident | ‐ | 0 (0) | 0 (0) | ||
| Deaths on study (any reason) | ‐ | 21 (10) | 15 (8) | ||
| Beguin 2008 | Data are not reported. Authors state that there was no difference in rates of thromboembolic events or other complications among the groups | Not reported | |||
| Bellet 2007 | A total of 375 participants were enrolled in this phase III RCT. However, the number of participants randomized to each study arm is not reported. Three serious but non‐life‐threatening iron sucrose‐related AEs were observed, including 1 case of significant, transient hypotension in a female weighing 50 kg | ‐ | IV iron + ESAs | ESAs alone | Not reported |
| Henry 2007c,d | ‐ | ‐ | ESAs + IV iron N = 63 | ESAs + oral iron N = 61 | Not reported |
| Constipation | ‐ | 2 (3.2) | 11 (18) | ||
| Nausea | ‐ | 2 (3.2) | 3 (4.9) | ||
| Dyspepsia | ‐ | 1 (1.6) | 3 (4.9) | ||
| Asthenia | ‐ | 1 (1.6) | 2 (3.3) | ||
| Anorexia | ‐ | 0 | 2 (3.3) | ||
| Abdominal pain | ‐ | 0 | 2 (3.3) | ||
| Diarrhea | ‐ | 1 (1.6) | 0 | ||
| Hypotension | ‐ | 1 (1.6) | 0 | ||
| Vasodilation | ‐ | 1 (1.6) | 0 | ||
| Angina pectoris | ‐ | 1 (1.6) | 0 | ||
| Tremor | ‐ | 1 (1.6) | 0 | ||
| Pain at injection site | ‐ | 1 (1.6) | 0 | ||
| Vomiting | ‐ | 0 | 1 (1.6) | ||
| Back pain | ‐ | 0 | 1 (1.6) | ||
| Dehydration | ‐ | 0 | 1 (1.6) | ||
| Dizziness | ‐ | 0 | 1 (1.6) | ||
| Taste perversion | ‐ | 0 | 1 (1.6) | ||
| Melena | ‐ | 0 | 1 (1.6) | ||
| Tinnitus | ‐ | 0 | 1 (1.6) | ||
| Pedrazzoli 2011e | ‐ | ‐ | ESAs + IV iron N = 73 | ESAs only N = 76 | Zero events |
| Participants with AEs | ‐ | 55 (75.3) | 49 (64.5) | ||
| Participants with serious AEs | ‐ | 8 (11) | 10 (13.2) | ||
| Participants with treatment‐related AEs | ‐ | 7 (9.6) | 6 (7.9) | ||
| Vascular/thromboembolic events | ‐ | 3 (4.1) | 2 (2.6) | ||
| Fatal AEs: all | ‐ | 4 (5.5) | 3 (3.9) | ||
| Fatal AEs: treatment related | ‐ | 0 (0) | 0 (0) | ||
| Steensma 2011f | Worst toxicity reported (toxicities were graded according to the National Cancer Institute Common Terminology Criteria of Adverse Events) | ESAs + IV iron N = 164 | ESAs + oral iron N = 162 | ESAs + placebo N = 163 | Zero events |
| None | 12 (7) | 15 (9) | 22 (13) | ||
| Mild | 28 (17) | 40 (25) | 33 (20) | ||
| Moderate | 35 (21) | 35 (22) | 33 (20) | ||
| Severe | 52 (32) | 42 (26) | 49 (30) | ||
| Life‐threatening | 29 (18) | 24 (15) | 23 (14) | ||
| Lethal (includes participants who died while on study regardless of causality) | 8 (5) | 6 (4) | 3 (2) | ||
| aEpisodes of transient anaphylactoid reactions occurred in two participants soon after initiating IV iron, but these participants recovered uneventfully without hospitalization; one participant in this group had enlarged uvula, lip swelling, and dyspnea (symptoms resolved). AE = adverse event | |||||
| Outcome or subgroup title | No. of studies | No. of participants | Statistical method | Effect size |
| 1 Hematopoietic response Show forest plot | 11 | 1712 | Risk Ratio (IV, Random, 95% CI) | 1.17 [1.09, 1.26] |
| 2 RBC transfusion Show forest plot | 11 | 1719 | Risk Ratio (IV, Random, 95% CI) | 0.74 [0.60, 0.92] |
| 3 Time to hematopoietic response Show forest plot | 7 | 1042 | Hazard Ratio (Random, 95% CI) | 0.93 [0.67, 1.28] |
| 4 Mean change in Hb Show forest plot | 7 | 827 | Mean Difference (Random, 95% CI) | 0.48 [0.10, 0.86] |
| 5 Quality of life Show forest plot | 4 | 1124 | Std. Mean Difference (Random, 95% CI) | 0.01 [‐0.10, 0.12] |
| 6 Thromboembolic events Show forest plot | 3 | 783 | Risk Ratio (IV, Random, 95% CI) | 0.95 [0.54, 1.65] |
| 7 Mean change in serum ferritin Show forest plot | 6 | 1010 | Mean Difference (Random, 95% CI) | 253.02 [84.30, 421.73] |
| 8 Mean change in TSAT Show forest plot | 5 | 908 | Mean Difference (Random, 95% CI) | 4.96 [0.94, 8.99] |
| Outcome or subgroup title | No. of studies | No. of participants | Statistical method | Effect size |
| 1 Hematopoietic response by type of iron Show forest plot | 11 | 1712 | Risk Ratio (IV, Random, 95% CI) | 1.17 [1.09, 1.26] |
| 1.1 Dextran | 3 | 340 | Risk Ratio (IV, Random, 95% CI) | 1.76 [1.01, 3.09] |
| 1.2 Gluconate | 4 | 879 | Risk Ratio (IV, Random, 95% CI) | 1.17 [1.08, 1.27] |
| 1.3 Sucrose | 1 | 102 | Risk Ratio (IV, Random, 95% CI) | 1.14 [0.97, 1.33] |
| 1.4 Sulfate | 3 | 391 | Risk Ratio (IV, Random, 95% CI) | 1.04 [0.87, 1.24] |
| 2 Hematopoietic response by route of administration Show forest plot | 11 | 1712 | Risk Ratio (IV, Random, 95% CI) | 1.17 [1.09, 1.26] |
| 2.1 Intravenous iron | 8 | 1321 | Risk Ratio (IV, Random, 95% CI) | 1.20 [1.10, 1.31] |
| 2.2 Oral iron | 3 | 391 | Risk Ratio (IV, Random, 95% CI) | 1.04 [0.87, 1.24] |
| 3 Hematopoietic response by type of ESA Show forest plot | 11 | 1712 | Risk Ratio (IV, Random, 95% CI) | 1.17 [1.09, 1.26] |
| 3.1 epoetin | 5 | 337 | Risk Ratio (IV, Random, 95% CI) | 1.53 [1.05, 2.22] |
| 3.2 darbepoetin | 6 | 1375 | Risk Ratio (IV, Random, 95% CI) | 1.16 [1.09, 1.24] |
| 4 Time to hematopoietic response by route of administration Show forest plot | 7 | Hazard Ratio (Random, 95% CI) | 0.93 [0.67, 1.28] | |
| 4.1 Intravenous iron | 6 | Hazard Ratio (Random, 95% CI) | 0.88 [0.60, 1.29] | |
| 4.2 Oral iron | 1 | Hazard Ratio (Random, 95% CI) | 1.24 [0.99, 1.56] | |
| 5 Time to hematopoietic response by type of iron Show forest plot | 7 | Hazard Ratio (Random, 95% CI) | 0.93 [0.67, 1.28] | |
| 5.1 Dextran | 3 | Hazard Ratio (Random, 95% CI) | 0.95 [0.36, 2.52] | |
| 5.2 Gluconate | 2 | Hazard Ratio (Random, 95% CI) | 0.78 [0.65, 0.94] | |
| 5.3 Sucrose | 1 | Hazard Ratio (Random, 95% CI) | 1.15 [0.60, 2.21] | |
| 5.4 Sulfate | 1 | Hazard Ratio (Random, 95% CI) | 1.24 [0.99, 1.56] | |
| 6 Time to hematopoietic response by type of ESA Show forest plot | 7 | Hazard Ratio (Random, 95% CI) | 0.93 [0.67, 1.28] | |
| 6.1 epoetin | 4 | Hazard Ratio (Random, 95% CI) | 1.00 [0.58, 1.72] | |
| 6.2 darbepoetin | 3 | Hazard Ratio (Random, 95% CI) | 0.81 [0.67, 0.96] | |
| 7 Mean change in Hb by route of administration Show forest plot | 7 | Mean Difference (Random, 95% CI) | 0.48 [0.10, 0.86] | |
| 7.1 Intravenous iron | 4 | Mean Difference (Random, 95% CI) | 0.84 [0.21, 1.46] | |
| 7.2 Oral iron | 3 | Mean Difference (Random, 95% CI) | 0.07 [‐0.19, 0.34] | |
| 8 Mean change in Hb by type of iron Show forest plot | 7 | Mean Difference (Random, 95% CI) | 0.48 [0.10, 0.86] | |
| 8.1 Dextran | 2 | Mean Difference (Random, 95% CI) | 1.55 [0.62, 2.47] | |
| 8.2 Gluconate | 2 | Mean Difference (Random, 95% CI) | 0.54 [‐0.15, 1.22] | |
| 8.3 Sucrose | 0 | Mean Difference (Random, 95% CI) | 0.0 [0.0, 0.0] | |
| 8.4 Sulfate | 3 | Mean Difference (Random, 95% CI) | 0.07 [‐0.19, 0.34] | |
| 9 Mean change in Hb by type of ESA Show forest plot | 7 | Mean Difference (Random, 95% CI) | 0.48 [0.10, 0.86] | |
| 9.1 epoetin | 5 | Mean Difference (Random, 95% CI) | 0.77 [0.25, 1.29] | |
| 9.2 darbepoetin | 2 | Mean Difference (Random, 95% CI) | 0.10 [‐0.13, 0.33] | |
| 10 Mean change in serum ferritin by route of administration Show forest plot | 6 | Mean Difference (Random, 95% CI) | 253.02 [84.30, 421.73] | |
| 10.1 Intravenous iron | 4 | Mean Difference (Random, 95% CI) | 362.15 [219.69, 504.61] | |
| 10.2 Oral iron | 2 | Mean Difference (Random, 95% CI) | 72.18 [‐6.59, 150.95] | |
| 11 Mean change in serum ferritin by type of iron Show forest plot | 6 | Mean Difference (Random, 95% CI) | 253.02 [84.30, 421.73] | |
| 11.1 Dextran | 1 | Mean Difference (Random, 95% CI) | 489.1 [344.28, 633.92] | |
| 11.2 Gluconate | 2 | Mean Difference (Random, 95% CI) | 420.02 [336.23, 503.81] | |
| 11.3 Sucrose | 1 | Mean Difference (Random, 95% CI) | 86.0 [‐125.67, 297.67] | |
| 11.4 Sulfate | 2 | Mean Difference (Random, 95% CI) | 72.18 [‐6.59, 150.95] | |
| 12 Mean change in serum ferritin by type of ESA Show forest plot | 6 | Mean Difference (Random, 95% CI) | 253.02 [84.30, 421.73] | |
| 12.1 epoetin | 2 | Mean Difference (Random, 95% CI) | 260.88 [‐89.56, 611.32] | |
| 12.2 darbepoetin | 4 | Mean Difference (Random, 95% CI) | 248.35 [26.24, 470.45] | |
| 13 Mean change in TSAT by route of administration Show forest plot | 5 | Mean Difference (Random, 95% CI) | 4.96 [0.94, 8.99] | |
| 13.1 Intravenous iron | 3 | Mean Difference (Random, 95% CI) | 5.07 [‐1.74, 11.87] | |
| 13.2 Oral iron | 2 | Mean Difference (Random, 95% CI) | 5.90 [‐0.67, 12.46] | |
| 14 Mean change in TSAT by type of iron Show forest plot | 5 | Mean Difference (Random, 95% CI) | 4.96 [0.94, 8.99] | |
| 14.1 Dextran | 1 | Mean Difference (Random, 95% CI) | 7.1 [1.11, 13.09] | |
| 14.2 Gluconate | 2 | Mean Difference (Random, 95% CI) | 4.78 [‐6.65, 16.22] | |
| 14.3 Sucrose | 0 | Mean Difference (Random, 95% CI) | 0.0 [0.0, 0.0] | |
| 14.4 Sulfate | 2 | Mean Difference (Random, 95% CI) | 5.90 [‐0.67, 12.46] | |
| 15 Mean change in TSAT by type of ESA Show forest plot | 5 | Mean Difference (Random, 95% CI) | 4.96 [0.94, 8.99] | |
| 15.1 epoetin | 2 | Mean Difference (Random, 95% CI) | 11.40 [4.17, 18.64] | |
| 15.2 darbepoetin | 3 | Mean Difference (Random, 95% CI) | 3.01 [‐0.73, 6.75] | |
| Outcome or subgroup title | No. of studies | No. of participants | Statistical method | Effect size |
| 1 Random sequence generation Show forest plot | 11 | 1712 | Risk Ratio (IV, Random, 95% CI) | 1.17 [1.09, 1.26] |
| 1.1 Adequate (low risk) | 4 | 830 | Risk Ratio (IV, Random, 95% CI) | 1.13 [1.02, 1.26] |
| 1.2 Inadequate (high/unclear risk) | 7 | 882 | Risk Ratio (IV, Random, 95% CI) | 1.23 [1.09, 1.39] |
| 2 Allocation concealment Show forest plot | 11 | 1711 | Risk Ratio (IV, Random, 95% CI) | 1.17 [1.09, 1.26] |
| 2.1 Adequate (low risk) | 11 | 1711 | Risk Ratio (IV, Random, 95% CI) | 1.17 [1.09, 1.26] |
| 2.2 Inadequate (high/unclear risk) | 0 | 0 | Risk Ratio (IV, Random, 95% CI) | 0.0 [0.0, 0.0] |
| 3 Blinding Show forest plot | 11 | 1712 | Risk Ratio (IV, Random, 95% CI) | 1.17 [1.09, 1.26] |
| 3.1 Adequate (low risk) | 1 | 102 | Risk Ratio (IV, Random, 95% CI) | 1.14 [0.97, 1.33] |
| 3.2 Inadequate (high/unclear risk) | 10 | 1610 | Risk Ratio (IV, Random, 95% CI) | 1.18 [1.08, 1.29] |
| 4 Incomplete outcome data Show forest plot | 11 | 1712 | Risk Ratio (IV, Random, 95% CI) | 1.17 [1.09, 1.26] |
| 4.1 Adequate (low risk) | 8 | 1430 | Risk Ratio (IV, Random, 95% CI) | 1.18 [1.07, 1.30] |
| 4.2 Inadequate (high/unclear risk) | 3 | 282 | Risk Ratio (IV, Random, 95% CI) | 1.15 [1.00, 1.33] |
| 5 Selective reporting Show forest plot | 11 | 1712 | Risk Ratio (IV, Random, 95% CI) | 1.17 [1.09, 1.26] |
| 5.1 Adequate (low risk) | 11 | 1712 | Risk Ratio (IV, Random, 95% CI) | 1.17 [1.09, 1.26] |
| 5.2 Inadequate (high/unclear risk) | 0 | 0 | Risk Ratio (IV, Random, 95% CI) | 0.0 [0.0, 0.0] |
| 6 Other bias Show forest plot | 11 | 1711 | Risk Ratio (IV, Random, 95% CI) | 1.17 [1.09, 1.26] |
| 6.1 Adequate (low risk) | 9 | 1371 | Risk Ratio (IV, Random, 95% CI) | 1.16 [1.05, 1.28] |
| 6.2 Inadequate (high/unclear risk) | 2 | 340 | Risk Ratio (IV, Random, 95% CI) | 1.21 [1.07, 1.38] |
| 7 Hematopoietic response by definition(s) Show forest plot | 11 | 1712 | Risk Ratio (IV, Random, 95% CI) | 1.17 [1.09, 1.26] |
| 7.1 Hematopoietic response | 8 | 1430 | Risk Ratio (IV, Random, 95% CI) | 1.18 [1.07, 1.30] |
| 7.2 Hematologic response | 2 | 180 | Risk Ratio (IV, Random, 95% CI) | 1.24 [0.80, 1.94] |
| 7.3 Patients reaching Hb > 13 g/dL | 1 | 102 | Risk Ratio (IV, Random, 95% CI) | 1.14 [0.97, 1.33] |