Gases para el establecimiento del neumoperitoneo durante la cirugía abdominal laparoscópica
Información
- DOI:
- https://doi.org/10.1002/14651858.CD009569.pub3Copiar DOI

- Base de datos:
-
- Cochrane Database of Systematic Reviews
- Versión publicada:
-
- 21 junio 2017see what's new
- Tipo:
-
- Intervention
- Etapa:
-
- Review
- Grupo Editorial Cochrane:
-
Grupo Cochrane de Colorrectal
- Copyright:
-
- Copyright © 2017 The Cochrane Collaboration. Published by John Wiley & Sons, Ltd.
Cifras del artículo
Altmetric:
Citado por:
Autores
Contributions of authors
YC: drafted the protocol and drafted the final review.
XW: study selection; risk of bias assessment of the included trials.
BT: study selection; risk of bias assessment of the included trials.
NC: data extraction; entered data into Review Manager 5; carried out the analysis.
JG: data extraction; entered data into Review Manager 5, and revised the final review.
YT: drafted and revised the final review; study selection; data extraction.
LB: revised the final review; data extraction; secured funding for the review.
Sources of support
Internal sources
-
The Second Affiliated Hospital, Chongqing Medical University, China.
-
West China Hospital, Sichuan University, China.
External sources
-
No sources of support supplied
Declarations of interest
None declared.
Acknowledgements
We would like to thank the Cochrane Colorectal Cancer Group, including Dr Henning Keinke Andersen and Dr Sara Hallum, who assisted in the development and evaluation of the review, and Dr Sys Johnsen, who developed the searching strategy and conducted the literature searches.
Version history
| Published | Title | Stage | Authors | Version |
| 2022 Mar 15 | Gases for establishing pneumoperitoneum during laparoscopic abdominal surgery | Review | Xudong Yang, Yao Cheng, Nansheng Cheng, Jianping Gong, Lian Bai, Longshuan Zhao, Yilei Deng | |
| 2017 Jun 21 | Gases for establishing pneumoperitoneum during laparoscopic abdominal surgery | Review | Tianwu Yu, Yao Cheng, Xiaomei Wang, Bing Tu, Nansheng Cheng, Jianping Gong, Lian Bai | |
| 2013 Jan 31 | Gases for establishing pneumoperitoneum during laparoscopic abdominal surgery | Review | Yao Cheng, Jiong Lu, Xianze Xiong, Sijia Wu, Yixin Lin, Taixiang Wu, Nansheng Cheng | |
| 2012 Jan 18 | Gases for establishing pneumoperitoneum during laparoscopic abdominal surgery | Protocol | Jiong Lu, Yao Cheng, Xianze Xiong, Sijia Wu, Yixin Lin, Taixiang Wu, Nansheng Cheng | |
Differences between protocol and review
We applied the trial sequential analysis (TSA) approach for improving the reliability of conclusions, which we had not stated in the protocol.
Notes
None.
Keywords
MeSH
Medical Subject Headings (MeSH) Keywords
Medical Subject Headings Check Words
Humans;
PICO

Study flow diagram.

Risk of bias graph: review authors' judgements about each risk of bias item presented as percentages across all included studies.
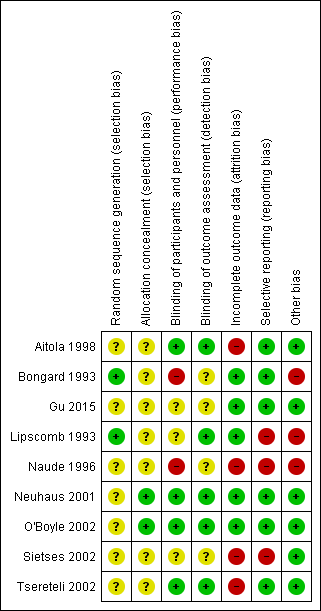
Risk of bias summary: review authors' judgements about each risk of bias item for each included study.

Trial sequential analysis of nitrous oxide pneumoperitoneum versus carbon dioxide pneumoperitoneum for cardiopulmonary complications. Analysis was performed with an event rate of 2.9% (Pc) in the control group, a risk ratio reduction of 20%, alpha 5%, beta 20%, and observed diversity 0%. The accrued sample size was so small that the trial sequential boundaries could not be drawn. The cumulative Z‐curve did not cross the naive 5% statistical boundaries (red horizontal lines). The results showed that the observed diversity‐adjusted required information size was 3781 participants, corresponding to 3.7% of the total sample size in the included trials. Accordingly, the meta‐analysis did not support or refute an intervention effect as data were too few.

Trial sequential analysis of nitrous oxide pneumoperitoneum versus carbon dioxide pneumoperitoneum for surgical morbidity. Analysis was performed with an event rate of 2.8% (Pc) in the control group, a risk ratio reduction of 20%, alpha 5%, beta 20%, and observed diversity 0%. The cumulative Z‐curve did not cross the naive 5% statistical boundaries (red horizontal lines). The results showed that the observed diversity adjusted required information size was 3919 participants, corresponding to 3.6% of the total sample size in the included trials. Accordingly, the meta‐analysis did not support or refute an intervention effect as data were too few.

Trial sequential analysis of helium pneumoperitoneum versus carbon dioxide pneumoperitoneum for cardiopulmonary complications. Analysis was performed with an event rate of 3.0% (Pc) in the control group, a risk ratio reduction of 20%, alpha 5%, beta 20%, and observed diversity 0%. The cumulative Z‐curve did not cross the naive 5% statistical boundaries (red horizontal lines). The results showed that the observed diversity adjusted required information size was 3651 participants, corresponding to 3.5% of the total sample size in the included trials. Accordingly, the meta‐analysis did not support or refute an intervention effect as data were too few.

Trial sequential analysis of helium pneumoperitoneum versus carbon dioxide pneumoperitoneum for serious adverse events. Analysis was performed with an event rate of 2.3% (Pc) in the control group, a risk ratio reduction of 20%, alpha 5%, beta 20%, and observed diversity 0%. The cumulative Z‐curve did not cross the naive 5% statistical boundaries (red horizontal lines). The results showed that the observed diversity adjusted required information size was 4793 participants, corresponding to 2.7% of the total sample size in the included trials. Accordingly, the meta‐analysis did not support or refute an intervention effect as data were too few.

Comparison 1 Nitrous oxide pneumoperitoneum versus carbon dioxide pneumoperitoneum, Outcome 1 Cardiopulmonary complications.

Comparison 1 Nitrous oxide pneumoperitoneum versus carbon dioxide pneumoperitoneum, Outcome 2 Procedure‐related general complications.
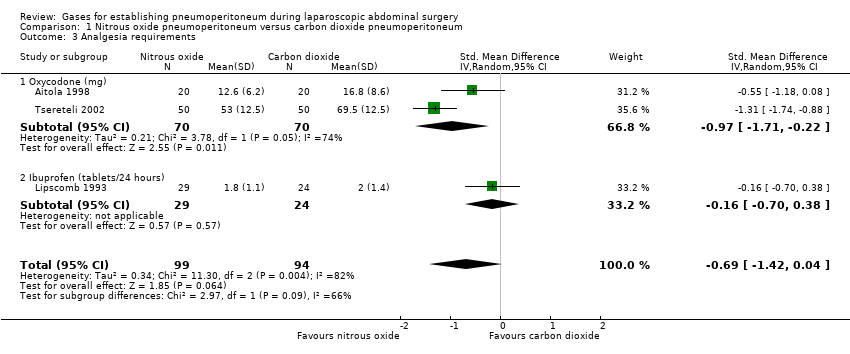
Comparison 1 Nitrous oxide pneumoperitoneum versus carbon dioxide pneumoperitoneum, Outcome 3 Analgesia requirements.

Comparison 1 Nitrous oxide pneumoperitoneum versus carbon dioxide pneumoperitoneum, Outcome 4 Cardiopulmonary changes.

Comparison 2 Helium pneumoperitoneum versus carbon dioxide pneumoperitoneum, Outcome 1 Cardiopulmonary complications.

Comparison 2 Helium pneumoperitoneum versus carbon dioxide pneumoperitoneum, Outcome 2 Pneumoperitoneum‐related serious adverse events.

Comparison 2 Helium pneumoperitoneum versus carbon dioxide pneumoperitoneum, Outcome 3 Pain scores (cm) (first postoperative day).

Comparison 2 Helium pneumoperitoneum versus carbon dioxide pneumoperitoneum, Outcome 4 Analgesia requirements (morphine mg).

Comparison 2 Helium pneumoperitoneum versus carbon dioxide pneumoperitoneum, Outcome 5 Number of participants requiring analgesia.

Comparison 2 Helium pneumoperitoneum versus carbon dioxide pneumoperitoneum, Outcome 6 Cardiopulmonary parameters.

Comparison 3 Room air pneumoperitoneum versus carbon dioxide pneumoperitoneum, Outcome 1 Cardiopulmonary complications.

Comparison 3 Room air pneumoperitoneum versus carbon dioxide pneumoperitoneum, Outcome 2 Pneumoperitoneum‐related serious adverse events.

Comparison 3 Room air pneumoperitoneum versus carbon dioxide pneumoperitoneum, Outcome 3 Pain scores (cm) (first postoperative day).

Comparison 3 Room air pneumoperitoneum versus carbon dioxide pneumoperitoneum, Outcome 4 Hospital costs (CNY).

Comparison 3 Room air pneumoperitoneum versus carbon dioxide pneumoperitoneum, Outcome 5 Cardiopulmonary parameters.
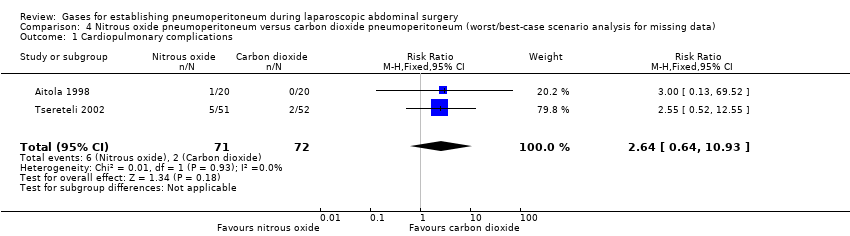
Comparison 4 Nitrous oxide pneumoperitoneum versus carbon dioxide pneumoperitoneum (worst/best‐case scenario analysis for missing data), Outcome 1 Cardiopulmonary complications.
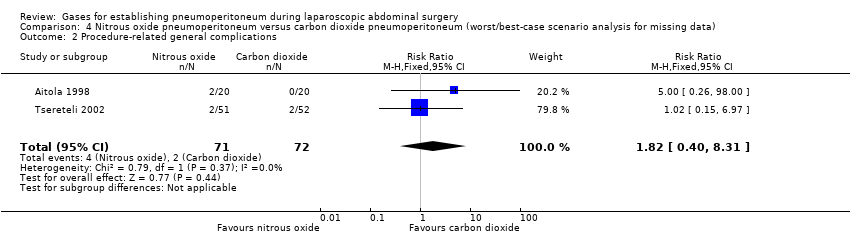
Comparison 4 Nitrous oxide pneumoperitoneum versus carbon dioxide pneumoperitoneum (worst/best‐case scenario analysis for missing data), Outcome 2 Procedure‐related general complications.
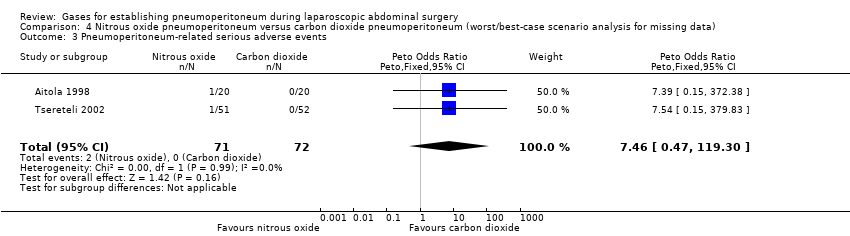
Comparison 4 Nitrous oxide pneumoperitoneum versus carbon dioxide pneumoperitoneum (worst/best‐case scenario analysis for missing data), Outcome 3 Pneumoperitoneum‐related serious adverse events.
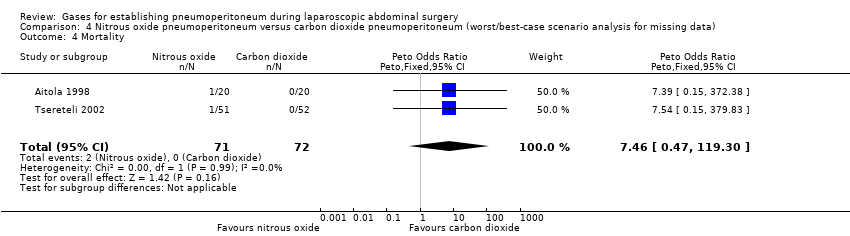
Comparison 4 Nitrous oxide pneumoperitoneum versus carbon dioxide pneumoperitoneum (worst/best‐case scenario analysis for missing data), Outcome 4 Mortality.
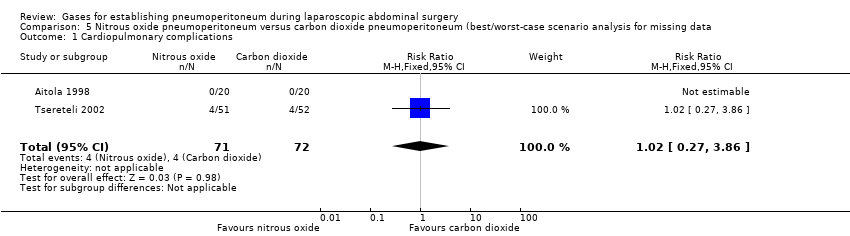
Comparison 5 Nitrous oxide pneumoperitoneum versus carbon dioxide pneumoperitoneum (best/worst‐case scenario analysis for missing data, Outcome 1 Cardiopulmonary complications.
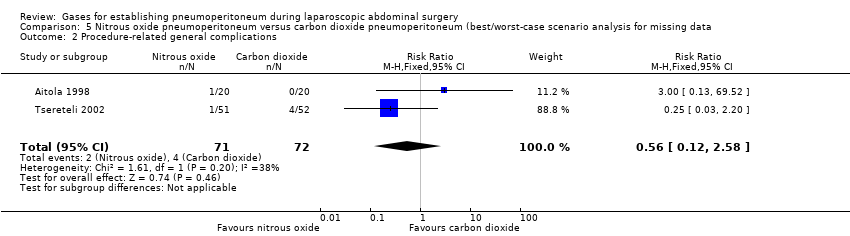
Comparison 5 Nitrous oxide pneumoperitoneum versus carbon dioxide pneumoperitoneum (best/worst‐case scenario analysis for missing data, Outcome 2 Procedure‐related general complications.

Comparison 5 Nitrous oxide pneumoperitoneum versus carbon dioxide pneumoperitoneum (best/worst‐case scenario analysis for missing data, Outcome 3 Pneumoperitoneum‐related serious adverse events.

Comparison 5 Nitrous oxide pneumoperitoneum versus carbon dioxide pneumoperitoneum (best/worst‐case scenario analysis for missing data, Outcome 4 Mortality.

Comparison 6 Helium pneumoperitoneum versus carbon dioxide pneumoperitoneum (worst/best‐case scenario analysis for missing data), Outcome 1 Cardiopulmonary complications.

Comparison 6 Helium pneumoperitoneum versus carbon dioxide pneumoperitoneum (worst/best‐case scenario analysis for missing data), Outcome 2 Procedure‐related general complications.

Comparison 6 Helium pneumoperitoneum versus carbon dioxide pneumoperitoneum (worst/best‐case scenario analysis for missing data), Outcome 3 Pneumoperitoneum‐related serious adverse events.

Comparison 6 Helium pneumoperitoneum versus carbon dioxide pneumoperitoneum (worst/best‐case scenario analysis for missing data), Outcome 4 Mortality.

Comparison 7 Helium pneumoperitoneum versus carbon dioxide pneumoperitoneum (best/worst‐case scenario analysis for missing data, Outcome 1 Cardiopulmonary complications.
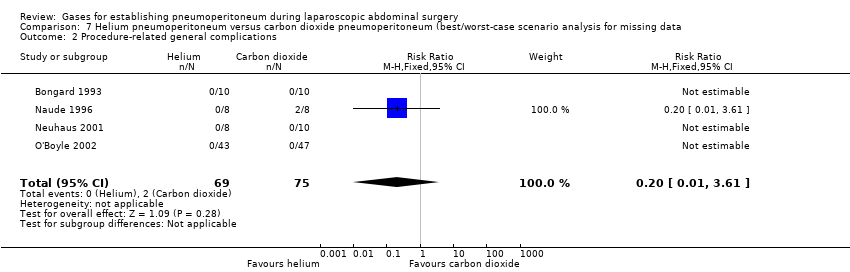
Comparison 7 Helium pneumoperitoneum versus carbon dioxide pneumoperitoneum (best/worst‐case scenario analysis for missing data, Outcome 2 Procedure‐related general complications.

Comparison 7 Helium pneumoperitoneum versus carbon dioxide pneumoperitoneum (best/worst‐case scenario analysis for missing data, Outcome 3 Pneumoperitoneum‐related serious adverse events.

Comparison 7 Helium pneumoperitoneum versus carbon dioxide pneumoperitoneum (best/worst‐case scenario analysis for missing data, Outcome 4 Mortality.
| Nitrous oxide versus carbon dioxide for establishing pneumoperitoneum during laparoscopic abdominal surgery | ||||||
| Patient or population: people undergoing laparoscopic general abdominal or gynaecological pelvic surgery under general anaesthesia Setting: secondary and tertiary care Intervention: nitrous oxide pneumoperitoneum Comparison: carbon dioxide pneumoperitoneum | ||||||
| Outcomes | Anticipated absolute effects* (95% CI) | Relative effect | No of participants | Quality of the evidence | Comments | |
| Risk with carbon dioxide pneumoperitoneum | Risk with nitrous oxide pneumoperitoneum | |||||
| Cardiopulmonary complications Follow‐up: 0 to 1 month | 29 per 1000 | 57 per 1000 | RR 2.00 | 140 | ⊕⊝⊝⊝ | Trial sequential analysis showed a diversity‐adjusted required information size of 3781 participants to support or refute nitrous oxide pneumoperitoneum. |
| Procedure‐related general complications Follow‐up: 0 to 1 month | 28 per 1000 | 28 per 1000 | RR 1.01 | 143 | ⊕⊝⊝⊝ | Trial sequential analysis showed a diversity‐adjusted required information size of 3919 participants to support or refute nitrous oxide pneumoperitoneum. |
| Pneumoperitoneum‐related serious adverse events Follow‐up: 0 to 1 month | See comment | See comment | Not estimable | 196 | ⊕⊕⊝⊝ | None of the studies reported any pneumoperitoneum‐related serious adverse events. |
| Mortality Follow‐up: 0 to 1 month | See comment | See comment | Not estimable | 196 | ⊕⊕⊝⊝ | None of the studies reported any deaths. |
| Quality of life | None of the studies reported quality of life. | |||||
| Pain scores (first postoperative day) VAS, lower score indicates less pain. Follow‐up: 1 day | See comment | See comment | Not estimable | 140 | ⊕⊝⊝⊝ | Neither trials reported the standard deviation for pain scores on the VAS scale. Substantial clinical heterogeneity in between the 2 studies. |
| Analgesia requirements Follow‐up: 1 week | The mean analgesia requirement in the carbon dioxide pneumoperitoneum was 54.4 mg of oxycodone and 2.0 tablets/24 hours of ibuprofen | The mean analgesia requirement in the nitrous oxide pneumoperitoneum was 0.69 standard deviations lower | SMD ‐0.69 | 193 | ⊕⊝⊝⊝ | ‐ |
| Hospital costs | None of the studies reported costs. | |||||
| *The basis for the assumed risk is the mean comparison group proportion in the studies. The risk in the intervention group (and its 95% confidence interval) is based on the assumed risk in the comparison group and the relative effect of the intervention (and its 95% CI). CI: confidence interval; RR: risk ratio; SMD: standardised mean difference; VAS: visual analogue scale. | ||||||
| GRADE Working Group grades of evidence | ||||||
| 1 Downgraded two levels for very serious risk of bias. 2 Downgraded one level for serious imprecision (the confidence interval of risk ratio overlapped 0.75 and 1.25, and small sample size). 3 Downgraded one level for serious imprecision (small sample size). 4 Downgraded one level for serious risk of bias. 5 Downgraded one level for indirectness. 6 Downgraded one level for severe inconsistency (substantial heterogeneity as indicated by the I2 statistic). | ||||||
| Helium versus carbon dioxide for establishing pneumoperitoneum during laparoscopic abdominal surgery | ||||||
| Patient or population: people undergoing laparoscopic general abdominal or gynaecological pelvic surgery under general anaesthesia Setting: secondary and tertiary care Intervention: helium pneumoperitoneum Comparison: carbon dioxide pneumoperitoneum | ||||||
| Outcomes | Anticipated absolute effects* (95% CI) | Relative effect | No of participants | Quality of the evidence | Comments | |
| Risk with carbon dioxide pneumoperitoneum | Risk with helium pneumoperitoneum | |||||
| Cardiopulmonary complications Follow‐up: 0 to 1 month | 30 per 1000 | 44 per 1000 | RR 1.46 | 128 | ⊕⊝⊝⊝ | Trial sequential analysis showed a diversity‐adjusted required information size of 3651 participants to support or refute helium pneumoperitoneum. |
| Procedure‐related general complications Follow‐up: 0 to 1 month | See comment | See comment | Not estimable | 144 | ⊕⊝⊝⊝ Very low3,4 | None of the studies reported any significant procedure‐related general complications in either group. |
| Pneumoperitoneum‐related serious adverse events Follow‐up: 0 to 1 month | 0 per 1000 | 44 per 1000 | Peto OR 8.28 | 128 | ⊕⊝⊝⊝ | Trial sequential analysis showed a diversity‐adjusted required information size of 4793 participants to support or refute helium pneumoperitoneum. |
| Mortality Follow‐up: 0 to 1 month | See comment | See comment | Not estimable | 144 | ⊕⊕⊝⊝ | None of the studies reported any deaths. |
| Quality of life | None of the studies reported quality of life. | |||||
| Pain scores (first postoperative day) Visual analogue scale, lower score indicates less pain. Follow‐up: 1 day | The mean pain scores (first postoperative day) in the carbon dioxide pneumoperitoneum was 3.01 cm | The mean pain scores (first postoperative day) in the helium pneumoperitoneum was | MD 0.49 (‐0.28 to 1.26) | 108 | ⊕⊝⊝⊝ | ‐ |
| Analgesia requirements (morphine mg) Follow‐up: 2 days | The mean analgesia requirements (morphine) in the carbon dioxide pneumoperitoneum was 36.6 mg | The mean analgesia requirements (morphine) in the helium pneumoperitoneum was 12 mg higher | MD 12.00 (4.44 to 19.56) | 90 | ⊕⊝⊝⊝ | ‐ |
| Hospital costs | None of the studies reported costs. | |||||
| *The basis for the assumed risk is the mean comparison group proportion in the studies. The risk in the intervention group (and its 95% confidence interval) is based on the assumed risk in the comparison group and the relative effect of the intervention (and its 95% CI). CI: confidence interval; MD: mean difference; OR: odds ratio; RR: risk ratio. | ||||||
| GRADE Working Group grades of evidence | ||||||
| 1 Downgraded one level for serious risk of bias. 2 Downgraded two levels for very serious imprecision (the confidence interval of risk ratio overlapped 0.75 and 1.25, and small sample size). 3 Downgraded one level for serious imprecision (small sample size). 4 Downgraded two levels for very serious risk of bias. 5 Downgraded one level for indirectness. | ||||||
| Room air versus carbon dioxide for establishing pneumoperitoneum during laparoscopic abdominal surgery | ||||||
| Patient or population: people undergoing laparoscopic general abdominal or gynaecological pelvic surgery under general anaesthesia Setting: secondary and tertiary care Intervention: room air pneumoperitoneum Comparison: carbon dioxide pneumoperitoneum | ||||||
| Outcomes | Anticipated absolute effects* (95% CI) | Relative effect | No of participants | Quality of the evidence | Comments | |
| Risk with carbon dioxide pneumoperitoneum | Risk with room air pneumoperitoneum | |||||
| Cardiopulmonary complications Follow‐up: 1 month | See comment | See comment | Not estimable | 146 | ⊕⊝⊝⊝ | Trial did not report any cardiopulmonary complications. |
| Procedure‐related general complications | The study did not report procedure‐related general complications. | |||||
| Pneumoperitoneum‐related serious adverse events Follow‐up: 1 month | See comment | See comment | Not estimable | 146 | ⊕⊝⊝⊝ | Trial did not report any pneumoperitoneum‐related serious adverse events. |
| Mortality Follow‐up: 1 month | See comment | See comment | Not estimable | 146 | ⊕⊕⊝⊝ | The study did not report any deaths. |
| Quality of life | The study did not report quality of life. | |||||
| Pain scores (first postoperative day) Visual analogue scale, lower score indicates less pain. Follow‐up: 1 day | The mean pain scores (first postoperative day) in the carbon dioxide pneumoperitoneum was 2.60 cm | The mean pain scores (first postoperative day) in the room air pneumoperitoneum was | MD ‐0.80 (‐1.15 to ‐0.45) | 146 | ⊕⊝⊝⊝ | ‐ |
| Analgesia requirements | The study did not report analgesia requirements. | |||||
| Hospital costs (CNY) Follow‐up: 1 month | The mean hospital costs in the carbon dioxide pneumoperitoneum was CNY12,012.00 | The mean hospital costs in the room air pneumoperitoneum was CNY2667.00 lower | MD ‐2667.00 (‐3275.68 to ‐2058.32) | 146 | ⊕⊝⊝⊝ | ‐ |
| *The basis for the assumed risk is the mean comparison group proportion in the studies. The risk in the intervention group (and its 95% confidence interval) is based on the assumed risk in the comparison group and the relative effect of the intervention (and its 95% CI). CI: confidence interval; MD: mean difference. | ||||||
| GRADE Working Group grades of evidence | ||||||
| 1 Downgraded two levels for very serious risk of bias. 2 Downgraded one level for serious imprecision (small sample size). 3 Downgraded one level for serious risk of bias. | ||||||
| Changing between worst‐case scenario analysis and best‐case scenario analysis for missing data | |||
| Outcomes | Risk ratio (95% CI) | ||
| Main analysis | Worst/best‐case | Best/worst‐case | |
| Cardiopulmonary complications (nitrous oxide vs carbon dioxide) | 2.00 (0.38, 10.43) | 2.64 (0.64, 10.93) | 1.02 (0.27, 3.86) |
| Procedure‐related general complications/surgical morbidity (nitrous oxide vs carbon dioxide) | 1.01 (0.18, 5.71) | 1.82 (0.40, 8.31) | 0.56 (0.12, 2.58) |
| Pneumoperitoneum‐related serious adverse events (nitrous oxide vs carbon dioxide) | No events | Peto OR 7.46 (0.47, 119.30) | Peto OR 0.14 (0.01, 2.19) |
| Mortality (nitrous oxide vs carbon dioxide) | No events | Peto OR 7.46 (0.47, 119.30) | Peto OR 0.14 (0.01, 2.19) |
| Cardiopulmonary complications (helium vs carbon dioxide) | 1.46 (0.35, 6.12) | 4.58 (1.21, 17.36) | 1.46 (0.35, 6.12) |
| Procedure‐related general complications/surgical morbidity (helium vs carbon dioxide) | No events | 8.47 (1.11, 64.60) | 0.20 (0.01, 3.61) |
| Pneumoperitoneum‐related serious adverse events (helium vs carbon dioxide) | Peto OR 8.28 (0.86, 80.03) | Peto OR 9.19 (2.56, 33.01) | Peto OR 8.28 (0.86, 80.03) |
| Mortality (helium vs carbon dioxide) | No events | Peto OR 8.89 (1.94, 40.64) | Peto OR 0.12 (0.01, 2.07) |
| Peto OR: Peto odds ratio, which was calculated for rare events (mortality, serious adverse events). | |||
| Outcome or subgroup title | No. of studies | No. of participants | Statistical method | Effect size |
| 1 Cardiopulmonary complications Show forest plot | 2 | 140 | Risk Ratio (M‐H, Fixed, 95% CI) | 2.0 [0.38, 10.43] |
| 2 Procedure‐related general complications Show forest plot | 2 | 143 | Risk Ratio (M‐H, Fixed, 95% CI) | 1.01 [0.18, 5.71] |
| 3 Analgesia requirements Show forest plot | 3 | 193 | Std. Mean Difference (IV, Random, 95% CI) | ‐0.69 [‐1.42, 0.04] |
| 3.1 Oxycodone (mg) | 2 | 140 | Std. Mean Difference (IV, Random, 95% CI) | ‐0.97 [‐1.71, ‐0.22] |
| 3.2 Ibuprofen (tablets/24 hours) | 1 | 53 | Std. Mean Difference (IV, Random, 95% CI) | ‐0.16 [‐0.70, 0.38] |
| 4 Cardiopulmonary changes Show forest plot | 1 | Mean Difference (IV, Fixed, 95% CI) | Subtotals only | |
| 4.1 Heart rate (beats/minute) | 1 | 100 | Mean Difference (IV, Fixed, 95% CI) | ‐0.60 [‐4.13, 2.93] |
| 4.2 Mean arterial pressure (mmHg) | 1 | 100 | Mean Difference (IV, Fixed, 95% CI) | ‐3.80 [‐7.90, 0.30] |
| 4.3 Oxygen saturation (%) | 1 | 100 | Mean Difference (IV, Fixed, 95% CI) | 0.0 [‐0.39, 0.39] |
| 4.4 Peak airway pressure (cm H2O) | 1 | 100 | Mean Difference (IV, Fixed, 95% CI) | ‐0.30 [‐2.17, 1.57] |
| Outcome or subgroup title | No. of studies | No. of participants | Statistical method | Effect size |
| 1 Cardiopulmonary complications Show forest plot | 3 | 128 | Risk Ratio (M‐H, Fixed, 95% CI) | 1.46 [0.35, 6.12] |
| 2 Pneumoperitoneum‐related serious adverse events Show forest plot | 3 | 128 | Peto Odds Ratio (Peto, Fixed, 95% CI) | 8.28 [0.86, 80.03] |
| 3 Pain scores (cm) (first postoperative day) Show forest plot | 2 | 108 | Mean Difference (IV, Fixed, 95% CI) | 0.49 [‐0.28, 1.26] |
| 4 Analgesia requirements (morphine mg) Show forest plot | 1 | 90 | Mean Difference (IV, Fixed, 95% CI) | 12.0 [4.44, 19.56] |
| 5 Number of participants requiring analgesia Show forest plot | 1 | 18 | Risk Ratio (M‐H, Fixed, 95% CI) | 0.42 [0.17, 1.04] |
| 6 Cardiopulmonary parameters Show forest plot | 3 | Mean Difference (IV, Fixed, 95% CI) | Subtotals only | |
| 6.1 Blood pH (start) | 2 | 34 | Mean Difference (IV, Fixed, 95% CI) | 0.01 [‐0.01, 0.04] |
| 6.2 Blood pH (middle) | 3 | 52 | Mean Difference (IV, Fixed, 95% CI) | ‐0.00 [‐0.03, 0.02] |
| 6.3 Blood pH (end) | 2 | 34 | Mean Difference (IV, Fixed, 95% CI) | 0.10 [0.06, 0.14] |
| 6.4 Partial pressure of carbon dioxide (mmHg) (start) | 2 | 34 | Mean Difference (IV, Fixed, 95% CI) | 0.31 [‐1.79, 2.40] |
| 6.5 Partial pressure of carbon dioxide (mmHg) (middle) | 3 | 52 | Mean Difference (IV, Fixed, 95% CI) | ‐0.84 [‐3.70, 2.02] |
| 6.6 Partial pressure of carbon dioxide (mmHg) (end) | 2 | 34 | Mean Difference (IV, Fixed, 95% CI) | ‐12.78 [‐16.78, ‐8.77] |
| Outcome or subgroup title | No. of studies | No. of participants | Statistical method | Effect size |
| 1 Cardiopulmonary complications Show forest plot | 1 | 146 | Risk Ratio (M‐H, Fixed, 95% CI) | 0.0 [0.0, 0.0] |
| 2 Pneumoperitoneum‐related serious adverse events Show forest plot | 1 | 146 | Peto Odds Ratio (Peto, Fixed, 95% CI) | 0.0 [0.0, 0.0] |
| 3 Pain scores (cm) (first postoperative day) Show forest plot | 1 | 146 | Mean Difference (IV, Fixed, 95% CI) | ‐0.8 [‐1.15, ‐0.45] |
| 4 Hospital costs (CNY) Show forest plot | 1 | 146 | Mean Difference (IV, Fixed, 95% CI) | ‐2667.0 [‐3275.68, ‐2058.32] |
| 5 Cardiopulmonary parameters Show forest plot | 1 | Mean Difference (IV, Fixed, 95% CI) | Subtotals only | |
| 5.1 Heart rate (beats/minute) (start) | 1 | 146 | Mean Difference (IV, Fixed, 95% CI) | ‐0.10 [‐3.11, 2.91] |
| 5.2 Heart rate (beats/minute) (middle) | 1 | 146 | Mean Difference (IV, Fixed, 95% CI) | ‐7.30 [‐9.78, ‐4.82] |
| 5.3 Heart rate (beats/minute) (end) | 1 | 146 | Mean Difference (IV, Fixed, 95% CI) | ‐8.70 [‐11.72, ‐5.68] |
| 5.4 Blood systolic pressure (mmHg) (start) | 1 | 146 | Mean Difference (IV, Fixed, 95% CI) | ‐1.0 [‐5.12, 3.12] |
| 5.5 Blood systolic pressure (mmHg) (middle) | 1 | 146 | Mean Difference (IV, Fixed, 95% CI) | 2.80 [‐0.44, 6.04] |
| 5.6 Blood systolic pressure (mmHg) (end) | 1 | 146 | Mean Difference (IV, Fixed, 95% CI) | ‐2.0 [‐5.42, 1.42] |
| 5.7 Partial pressure of carbon dioxide (mmHg) (start) | 1 | 146 | Mean Difference (IV, Fixed, 95% CI) | ‐0.20 [‐1.39, 0.99] |
| 5.8 Partial pressure of carbon dioxide (mmHg) (middle) | 1 | 146 | Mean Difference (IV, Fixed, 95% CI) | ‐0.30 [‐1.37, 0.77] |
| 5.9 Partial pressure of carbon dioxide (mmHg) (end) | 1 | 146 | Mean Difference (IV, Fixed, 95% CI) | 0.10 [‐1.43, 1.63] |
| Outcome or subgroup title | No. of studies | No. of participants | Statistical method | Effect size |
| 1 Cardiopulmonary complications Show forest plot | 2 | 143 | Risk Ratio (M‐H, Fixed, 95% CI) | 2.64 [0.64, 10.93] |
| 2 Procedure‐related general complications Show forest plot | 2 | 143 | Risk Ratio (M‐H, Fixed, 95% CI) | 1.82 [0.40, 8.31] |
| 3 Pneumoperitoneum‐related serious adverse events Show forest plot | 2 | 143 | Peto Odds Ratio (Peto, Fixed, 95% CI) | 7.46 [0.47, 119.30] |
| 4 Mortality Show forest plot | 2 | 143 | Peto Odds Ratio (Peto, Fixed, 95% CI) | 7.46 [0.47, 119.30] |
| Outcome or subgroup title | No. of studies | No. of participants | Statistical method | Effect size |
| 1 Cardiopulmonary complications Show forest plot | 2 | 143 | Risk Ratio (M‐H, Fixed, 95% CI) | 1.02 [0.27, 3.86] |
| 2 Procedure‐related general complications Show forest plot | 2 | 143 | Risk Ratio (M‐H, Fixed, 95% CI) | 0.56 [0.12, 2.58] |
| 3 Pneumoperitoneum‐related serious adverse events Show forest plot | 2 | 143 | Peto Odds Ratio (Peto, Fixed, 95% CI) | 0.14 [0.01, 2.19] |
| 4 Mortality Show forest plot | 2 | 143 | Peto Odds Ratio (Peto, Fixed, 95% CI) | 0.14 [0.01, 2.19] |
| Outcome or subgroup title | No. of studies | No. of participants | Statistical method | Effect size |
| 1 Cardiopulmonary complications Show forest plot | 3 | 128 | Risk Ratio (M‐H, Fixed, 95% CI) | 4.58 [1.21, 17.36] |
| 2 Procedure‐related general complications Show forest plot | 4 | 144 | Risk Ratio (M‐H, Fixed, 95% CI) | 8.47 [1.11, 64.60] |
| 3 Pneumoperitoneum‐related serious adverse events Show forest plot | 3 | 128 | Peto Odds Ratio (Peto, Fixed, 95% CI) | 9.19 [2.56, 33.01] |
| 4 Mortality Show forest plot | 4 | 144 | Peto Odds Ratio (Peto, Fixed, 95% CI) | 8.89 [1.94, 40.64] |
| Outcome or subgroup title | No. of studies | No. of participants | Statistical method | Effect size |
| 1 Cardiopulmonary complications Show forest plot | 3 | 128 | Risk Ratio (M‐H, Fixed, 95% CI) | 1.46 [0.35, 6.12] |
| 2 Procedure‐related general complications Show forest plot | 4 | 144 | Risk Ratio (M‐H, Fixed, 95% CI) | 0.2 [0.01, 3.61] |
| 3 Pneumoperitoneum‐related serious adverse events Show forest plot | 3 | 128 | Peto Odds Ratio (Peto, Fixed, 95% CI) | 8.28 [0.86, 80.03] |
| 4 Mortality Show forest plot | 4 | 144 | Peto Odds Ratio (Peto, Fixed, 95% CI) | 0.12 [0.01, 2.07] |