Gases para el establecimiento del neumoperitoneo durante la cirugía abdominal laparoscópica
Resumen
Antecedentes
Esta es la segunda actualización de una revisión Cochrane publicada por primera vez en 2013 y actualizada por última vez en 2017.
Actualmente la cirugía laparoscópica se utiliza ampliamente para tratar diversas enfermedades abdominales. Actualmente, el dióxido de carbono es el gas utilizado con mayor frecuencia para la insuflación de la cavidad abdominal (neumoperitoneo). Aunque el dióxido de carbono cumple la mayoría de los requisitos para el neumoperitoneo, la absorción de dióxido de carbono puede estar asociada con eventos adversos. Por lo tanto, se han introducido otros gases como alternativas al dióxido de carbono para el establecimiento del neumoperitoneo.
Objetivos
Evaluar la seguridad y los efectos beneficiosos y perjudiciales de diferentes gases (p. ej., dióxido de carbono, helio, argón, nitrógeno, óxido nitroso y aire ambiental) para el establecimiento del neumoperitoneo en participantes sometidos a cirugía laparoscópica abdominal o cirugía pélvica ginecológica.
Métodos de búsqueda
Se hicieron búsquedas en CENTRAL, Ovid MEDLINE, Ovid Embase, en otras cuatro bases de datos y tres registros de ensayos el 15 de octubre de 2021, junto con la comprobación de referencias, búsqueda de citas y contacto con autores de estudios para identificar estudios adicionales.
Criterios de selección
Se incluyeron ensayos controlados aleatorizados (ECA) que compararan diferentes gases para el establecimiento del neumoperitoneo en participantes (independientemente de la edad, el sexo o la raza) sometidos a cirugía abdominal laparoscópica o cirugía pélvica ginecológica bajo anestesia general.
Obtención y análisis de los datos
Se utilizaron los procedimientos metodológicos estándar previstos por Cochrane.
Resultados principales
Se incluyeron diez ECA que asignaron al azar a 583 participantes y que compararon diferentes gases para establecer el neumoperitoneo: el óxido nitroso (cuatro ensayos), el helio (cinco ensayos) o el aire ambiental (un ensayo) se compararon con el dióxido de carbono. Todos los ECA fueron estudios realizados en un solo centro. Cuatro ECA se realizaron en EE. UU., dos en Australia, uno en China, uno en Finlandia, uno en Irán y uno en los Países Bajos. La media de edad de los participantes varió entre 27,6 y 49,0 años.
Cuatro ensayos asignaron al azar a los participantes a neumoperitoneo con óxido nitroso (132 participantes) o a neumoperitoneo con dióxido de carbono (128 participantes). Ninguno de los ensayos tuvo bajo riesgo de sesgo. La evidencia es muy incierta con respecto a los efectos del neumoperitoneo con óxido nitroso comparado con el neumoperitoneo con dióxido de carbono sobre las complicaciones cardiopulmonares (odds ratio [OR] de Peto 2,62; IC del 95%: 0,78 a 8,85; tres estudios; 204 participantes; evidencia de calidad muy baja) o la morbilidad quirúrgica (OR de Peto 1,01; IC del 95%: 0,14 7,31; tres estudios; 207 participantes; evidencia de calidad muy baja). No hubo eventos adversos graves relacionados con el neumoperitoneo con dióxido de carbono ni con óxido nitroso (cuatro estudios; 260 participantes; evidencia de certeza muy baja).
Cuatro ensayos asignaron al azar a los participantes a neumoperitoneo con helio (69 participantes) o a neumoperitoneo con dióxido de carbono (75 participantes) y un ensayo con 33 participantes no proporcionó el número de participantes en cada grupo. Ninguno de los ensayos tuvo bajo riesgo de sesgo. La evidencia es muy incierta con respecto a los efectos del neumoperitoneo con helio comparado con el neumoperitoneo con dióxido de carbono sobre las complicaciones cardiopulmonares (OR de Peto 1,66; IC del 95%: 0,28 a 9,72; tres estudios; 128 participantes; evidencia de calidad muy baja) o la morbilidad quirúrgica (cinco estudios; 177 participantes; evidencia de certeza muy baja). Hubo tres eventos adversos graves (enfisema subcutáneo) relacionados con el neumoperitoneo con helio (tres estudios; 128 participantes; evidencia de certeza muy baja).
Un ensayo asignó al azar a los participantes a neumoperitoneo con aire ambiental (70 participantes) o a neumoperitoneo con dióxido de carbono (76 participantes). El riesgo de sesgo del ensayo fue alto. No se observaron complicaciones cardiopulmonares, eventos adversos graves ni muertes relacionados con el neumoperitoneo con dióxido de carbono o con aire ambiental.
Conclusiones de los autores
La evidencia es muy incierta con respecto a los efectos del neumoperitoneo con óxido nitroso, helio y aire ambiental comparados con el neumoperitoneo con dióxido de carbono sobre cualquiera de los desenlaces principales, incluidas las complicaciones cardiopulmonares, la morbilidad quirúrgica y los eventos adversos graves. Aún debe establecerse la seguridad del neumoperitoneo con óxido nitroso, con helio y con aire ambiental, especialmente en personas con riesgo anestésico alto.
PICO
Resumen en términos sencillos
Diferentes gases para la insuflación de la cavidad abdominal durante la cirugía abdominal laparoscópica
Pregunta de la revisión
¿Cuáles son los beneficios y los daños de varios gases para la insuflación (inflación con gas) de la cavidad abdominal (barriga) para permitir un acceso más fácil a los órganos durante la cirugía abdominal laparoscópica (mínimo acceso)?
Antecedentes
Actualmente la cirugía laparoscópica se utiliza ampliamente para tratar diversas enfermedades abdominales. Un gas ideal para la insuflación de la cavidad abdominal, que aumenta el espacio de trabajo y de visión, debe ser barato, incoloro, no inflamable, no explosivo, fácilmente eliminable por el cuerpo y completamente inocuo para los participantes. Actualmente, el dióxido de carbono es el gas utilizado con mayor frecuencia para este propósito. Sin embargo, el uso de dióxido de carbono puede causar complicaciones cardíacas o pulmonares. Por lo tanto, otros gases se han sugerido como alternativas al dióxido de carbono.
Características de los estudios
Se buscaron todos los estudios relevantes hasta octubre de 2021.
Se identificaron diez ensayos clínicos con 583 participantes, de los cuales tres ensayos (260 participantes) compararon el óxido nitroso (gas de la risa) con el dióxido de carbono, cinco ensayos (177 participantes) compararon el helio con el dióxido de carbono y un ensayo (146 participantes) comparó el aire ambiental con el dióxido de carbono. Los estudios se realizaron en los EE.UU., Australia, China, Finlandia Irán y Países Bajos. La media de edad de los participantes en los ensayos varió de 19 a 62 años.
Fuentes de financiación de los estudios
Dos de diez estudios incluidos fueron patrocinados por becas no comerciales. Los otros ocho estudios no informaron acerca de sus fuentes de financiación.
Resultados clave
No se sabe si el óxido nitroso, el helio o el aire ambiental son superiores, inferiores o iguales al dióxido de carbono en cuanto al número de personas con complicaciones cardiopulmonares, quirúrgicas o episodios graves no deseados.
Debido a los pocos participantes incluidos en la revisión, se desconoce la seguridad del uso de óxido nitroso, helio o aire ambiental.
Calidad de la evidencia
En general, la calidad de la evidencia para los resultados es muy baja. Por lo tanto, se necesitan urgentemente futuros ensayos bien diseñados que examinen las complicaciones, los daños, la calidad de vida y el dolor.
Authors' conclusions
Summary of findings
| Nitrous oxide versus carbon dioxide for establishing pneumoperitoneum during laparoscopic abdominal surgery | ||||||
| Patient or population: people undergoing laparoscopic general abdominal or gynaecological pelvic surgery under general anaesthesia Setting: secondary and tertiary care Intervention: nitrous oxide pneumoperitoneum Comparison: carbon dioxide pneumoperitoneum | ||||||
| Outcomes | Anticipated absolute effects* (95% CI) | Relative effect | No of participants | Certainty of the evidence | Comments | |
|---|---|---|---|---|---|---|
| Risk with carbon dioxide pneumoperitoneum | Risk with nitrous oxide pneumoperitoneum | |||||
| Cardiopulmonary complications Follow‐up: 0–1 month | 29 per 1000 | 79 per 1000 | Peto OR 2.62 | 204 | ⊕⊝⊝⊝ | — |
| Procedure‐related general complications (surgical morbidity) Follow‐up: 0–1 month | 19 per 1000 | 19 per 1000 | Peto OR 1.01 | 207 | ⊕⊝⊝⊝ | — |
| Pneumoperitoneum‐related serious adverse events Follow‐up: 0–1 month | See comment | See comment | Not estimable | 260 | ⊕⊝⊝⊝ | None of the studies reported any pneumoperitoneum‐related serious adverse events. |
| Mortality Follow‐up: 0–1 month | See comment | See comment | Not estimable | 260 | ⊕⊝⊝⊝ | None of the studies reported any deaths. |
| Quality of life | None of the studies reported quality of life. | |||||
| Pain scores (first postoperative day) VAS, lower score indicates less pain. Follow‐up: 1 day | The mean pain scores (first postoperative day) in the carbon dioxide pneumoperitoneum group was 3.50 cm | The mean pain scores (first postoperative day) in the nitrous oxide pneumoperitoneum group was | MD −0.90 (−2.10 to 0.30) | 64 | ⊕⊝⊝⊝ | 2 studies reported lower pain scores in the nitrous oxide group compared with the carbon dioxide group at various time points on the first postoperative day (Aitola 1998; Tsereteli 2002). Neither trial reported the standard deviation for pain scores on the VAS scale. The other study reported no difference in the pain scores using McGill pain questionnaire between groups (Lipscomb 1993). We were unable to use the data from these 3 studies in meta‐analysis for the reasons given above. |
| Analgesia requirements Follow‐up: 1 week | The mean analgesia requirement in the carbon dioxide pneumoperitoneum was 54.4 mg of oxycodone and 2.0 tablets/24 hours of ibuprofen | The mean analgesia requirement in the nitrous oxide pneumoperitoneum was 0.65 standard deviations (moderate effect) lower | SMD −0.65 (moderate effect) | 257 | ⊕⊝⊝⊝ | — |
| Costs | None of the studies reported costs. | |||||
| *The basis for the assumed risk is the mean comparison group proportion in the studies. The risk in the intervention group (and its 95% confidence interval) is based on the assumed risk in the comparison group and the relative effect of the intervention (and its 95% CI). CI: confidence interval; MD: mean difference; OR: odds ratio; RR: risk ratio; SMD: standardised mean difference; VAS: visual analogue scale. | ||||||
| GRADE Working Group grades of evidence | ||||||
| aDowngraded two levels for very serious risk of bias: all included studies with unclear risk of bias for random sequence generation and allocation concealment; one study with high risk of bias for blinding of participants and personnel. | ||||||
| Helium versus carbon dioxide for establishing pneumoperitoneum during laparoscopic abdominal surgery | ||||||
| Patient or population: people undergoing laparoscopic general abdominal or gynaecological pelvic surgery under general anaesthesia Setting: secondary and tertiary care Intervention: helium pneumoperitoneum Comparison: carbon dioxide pneumoperitoneum | ||||||
| Outcomes | Anticipated absolute effects* (95% CI) | Relative effect | No of participants | Certainty of the evidence | Comments | |
|---|---|---|---|---|---|---|
| Risk with carbon dioxide pneumoperitoneum | Risk with helium pneumoperitoneum | |||||
| Cardiopulmonary complications Follow‐up: 0–1 month | 30 per 1000 | 44 per 1000 | Peto OR 1.66 | 128 | ⊕⊝⊝⊝ | — |
| Procedure‐related general complications (surgical morbidity) Follow‐up: 0–1 month | See comment | See comment | Not estimable | 177 | ⊕⊝⊝⊝ Very lowb,c | None of the studies reported any significant procedure‐related general complications in either group. |
| Pneumoperitoneum‐related serious adverse events Follow‐up: 0–1 month | 0 per 1000 | 44 per 1000 | Peto OR 8.28 | 128 | ⊕⊝⊝⊝ | — |
| Mortality Follow‐up: 0–1 month | See comment | See comment | Not estimable | 177 | ⊕⊝⊝⊝ | None of the studies reported any deaths. |
| Quality of life | None of the studies reported quality of life. | |||||
| Pain scores (first postoperative day) Visual analogue scale, lower score indicates less pain. Follow‐up: 1 day | The mean pain scores (first postoperative day) in the carbon dioxide pneumoperitoneum was 3.01 cm | The mean pain scores (first postoperative day) in the helium pneumoperitoneum was | MD 0.49 (−0.28 to 1.26) | 108 | ⊕⊕⊝⊝ | — |
| Analgesia requirements (morphine mg) Follow‐up: 2 days | The mean analgesia requirements (morphine) in the carbon dioxide pneumoperitoneum was 36.6 mg | The mean analgesia requirements (morphine) in the helium pneumoperitoneum was 12 mg higher | MD 12.00 (4.44 to 19.56) | 90 | ⊕⊝⊝⊝ | 2 trials (108 participants) reported analgesia requirements (Neuhaus 2001; O'Boyle 2002). Results of O'Boyle 2002 presented here. The other study including 18 participants reported no difference in the number of participants requiring analgesia (morphine) between the groups (Neuhaus 2001). |
| Costs | None of the studies reported costs. | |||||
| *The basis for the assumed risk is the mean comparison group proportion in the studies. The risk in the intervention group (and its 95% confidence interval) is based on the assumed risk in the comparison group and the relative effect of the intervention (and its 95% CI). CI: confidence interval; MD: mean difference; OR: odds ratio; RR: risk ratio. | ||||||
| GRADE Working Group grades of evidence | ||||||
| aDowngraded two levels for very serious risk of bias: two studies with unclear risk of bias for random sequence generation and allocation concealment; one study with high risk of bias for blinding of participants and personnel and baseline imbalance. | ||||||
| Room air versus carbon dioxide for establishing pneumoperitoneum during laparoscopic abdominal surgery | ||||||
| Patient or population: people undergoing laparoscopic general abdominal or gynaecological pelvic surgery under general anaesthesia Setting: secondary and tertiary care Intervention: room air pneumoperitoneum Comparison: carbon dioxide pneumoperitoneum | ||||||
| Outcomes | Anticipated absolute effects* (95% CI) | Relative effect | No of participants | Certainty of the evidence | Comments | |
|---|---|---|---|---|---|---|
| Risk with carbon dioxide pneumoperitoneum | Risk with room air pneumoperitoneum | |||||
| Cardiopulmonary complications Follow‐up: 1 month | See comment | See comment | Not estimable | 146 | ⊕⊝⊝⊝ | Trial did not report any cardiopulmonary complications. |
| Procedure‐related general complications (surgical morbidity) | The study did not report procedure‐related general complications. | |||||
| Pneumoperitoneum‐related serious adverse events Follow‐up: 1 month | See comment | See comment | Not estimable | 146 | ⊕⊝⊝⊝ | Trial did not report any pneumoperitoneum‐related serious adverse events. |
| Mortality Follow‐up: 1 month | See comment | See comment | Not estimable | 146 | ⊕⊝⊝⊝ | The study did not report any deaths. |
| Quality of life | The study did not report quality of life. | |||||
| Pain scores (first postoperative day) Visual analogue scale, lower score indicates less pain. Follow‐up: 1 day | The mean pain scores (first postoperative day) in the carbon dioxide pneumoperitoneum was 2.60 cm | The mean pain scores (first postoperative day) in the room air pneumoperitoneum was | MD −0.80 (−1.15 to −0.45) | 146 | ⊕⊝⊝⊝ | — |
| Analgesia requirements | The study did not report analgesia requirements. | |||||
| Hospital costs (CNY) Follow‐up: 1 month | The mean hospital costs in the carbon dioxide pneumoperitoneum was CNY 12,012.00 | The mean hospital costs in the room air pneumoperitoneum was CNY 2667.00 lower | MD −2667.00 (−3275.68 to −2058.32) | 146 | ⊕⊝⊝⊝ | — |
| *The basis for the assumed risk is the mean comparison group proportion in the studies. The risk in the intervention group (and its 95% confidence interval) is based on the assumed risk in the comparison group and the relative effect of the intervention (and its 95% CI). CI: confidence interval; CNY: Chinese Yuan; MD: mean difference. | ||||||
| GRADE Working Group grades of evidence | ||||||
| aDowngraded two levels for very serious risk of bias: unclear risk of bias for random sequence generation, allocation concealment, blinding of participants and personnel, and blinding of outcome assessment; high risk of bias for selective reporting. | ||||||
Background
This is the second update of a Cochrane Review first published in 2013 (Cheng 2013) and last updated in 2017 (Yu 2017).
Description of the condition
Laparoscopic surgery, which was originally developed in the 1910s, is now widely performed by general surgeons to treat various abdominal diseases (Ahmad 2019; Antoniou 2015; Birch 2016; Yu 2017), including diseases of the stomach, gallbladder, liver, pancreas, spleen, intestine, and kidney (Best 2016; Cheng 2012a; Dasari 2011; Deng 2020; Jaschinski 2018; Keus 2006; Kuhry 2008; Li 2018; Nabi 2016; Rao 2013; Riviere 2016; Sanabria 2013; Shin 2019).
The exact number of people undergoing laparoscopic surgery each year worldwide is unknown. Laparoscopic surgery offers various advantages over conventional open surgery, including less postoperative pain, smaller scars, shorter hospital stay, and a quicker recovery (Ahmad 2019; Antoniou 2015; Birch 2016). This method has become the gold standard for some abdominal procedures (e.g. laparoscopic cholecystectomy) (Gurusamy 2014; Keus 2006).
Description of the intervention
The first step in laparoscopic surgery is the establishment of pneumoperitoneum, including entry into the abdominal cavity and then insufflation of air or gas (Ahmad 2019; Birch 2016; Gurusamy 2014; Vilos 2017; Yu 2017), for facilitating adequate working and viewing space. Two common entry techniques are used: an open method (all layers of the abdominal wall are incised, and a trocar is inserted under direct vision), and a closed method (only the skin is incised, and a Veress needle is then inserted blindly into the abdominal cavity) (Ahmad 2019; la Chapelle 2015; Vilos 2017; Yu 2017). After entry into the abdominal cavity, gas is insufflated through the trocar (open method) or the Veress needle (closed method) to separate the abdominal wall from the internal organs (Ahmad 2019; Gurusamy 2014; Vilos 2017; Yu 2017). The pneumoperitoneum provides sufficient operating space to ensure adequate visualisation of camera and manipulation of instruments in the abdominal cavity (Gurusamy 2014; Vilos 2017; Yu 2017).
How the intervention might work
A pneumoperitoneum of 8 mmHg to 20 mmHg is created and pressure is maintained during laparoscopic surgery (Ahmad 2019; Gurusamy 2014; Vilos 2017). The ideal gas for establishing pneumoperitoneum should be cheap, colourless, non‐flammable, non‐explosive, easily excreted, and completely non‐toxic to participants (Peng 2018; Scott 2020). Carbon dioxide, which was introduced to create pneumoperitoneum in 1920s, is the most common gas used for insufflation currently (Cheng 2012b; Vilos 2017). Carbon dioxide is absorbed by the peritoneum, delivered directly to the lungs by the circulation (Eaton 2009; Sidler 2020), and is excreted by the lungs during respiratory exchange (Eaton 2009; Sidler 2020). Although carbon dioxide meets most of the requirements (e.g. low cost, non‐flammable, chemically stabile, and with high diffusion capacity with subsequent rapid absorption and excretion), it is not a perfect gas. The absorption of carbon dioxide causes hypercapnia and acidosis, which has to be avoided by hyperventilation (Gurusamy 2014; Sidler 2020; Vilos 2017). It is associated with various cardiopulmonary (heart and lung) complications, such as tachycardia, cardiac arrhythmias, and pulmonary oedema (Gurusamy 2014; Kabakchiev 2020; Vilos 2017). In addition, it may cause postoperative pain due to peritoneal irritation, and its use is associated with immunological impairment (Neuhaus 2001; Sidler 2020). Elderly people with cardiopulmonary diseases are more likely to experience these adverse events (Chen 2017; Vilos 2017).
Identifying an ideal insufflation gas to replace carbon dioxide has attracted the attention of some researchers in the era of laparoscopic surgery (Roberto Rodrigues Bicalho 2020; Scott 2020; Ypsilantis 2016). Various gases, such as helium, argon, nitrogen, nitrous oxide, and room air, have been introduced as alternatives to carbon dioxide to establish pneumoperitoneum (Rammohan 2011; Roberto Rodrigues Bicalho 2020; Scott 2020; Ypsilantis 2016). However, their uses are controversial. Helium and argon are inert gases that may offer some advantages over carbon dioxide (Roberto Rodrigues Bicalho 2020; Scott 2020). Nevertheless, they are less soluble than carbon dioxide, which might increase the risk of venous gas embolism (Richter 2012; Scott 2020). Nitrous oxide, also known as laughing gas, is a mild anaesthetic (Aboumarzouk 2011). It may reduce postoperative pain theoretically because of its anaesthetic and analgesic properties (Aboumarzouk 2011; Rammohan 2011). However, there have been some cases of explosion using electrocautery during laparoscopy, and the risk of explosion when using nitrous oxide insufflation remains controversial (Rammohan 2011; Scott 2020).
Why it is important to do this review
The use of other gases as alternatives to carbon dioxide for establishing pneumoperitoneum is controversial. Other gases (e.g. helium, argon, nitrogen, nitrous oxide, room air) may potentially offer some advantages over carbon dioxide, but it is also possible that they may have no benefit and may be associated with adverse events (Richter 2012; Scott 2020). Up to now, we have not been able to identify any systematic review or meta‐analysis assessing the different gases used to establish pneumoperitoneum during laparoscopic abdominal surgery. The last version of this review was published in 2017 (Yu 2017). Further randomised controlled trials (RCTs) evaluating different gases for establishing pneumoperitoneum during laparoscopic abdominal surgery have been published since the review, and these studies have now been assessed for inclusion and presented in this update.
Objectives
To assess the safety, benefits, and harms of different gases (e.g. carbon dioxide, helium, argon, nitrogen, nitrous oxide, room air) used for establishing pneumoperitoneum in participants undergoing laparoscopic general abdominal or gynaecological pelvic surgery.
Methods
Criteria for considering studies for this review
Types of studies
We included all RCTs (irrespective of sample size, language, or publication status) comparing different gases used for establishing pneumoperitoneum in participants undergoing laparoscopic abdominal surgery under general anaesthesia. We excluded studies on participants undergoing laparoscopic abdominal surgery under local/regional anaesthesia. We excluded quasi‐randomised trials (in which the allocation was performed on the basis of a pseudo‐random sequence, e.g. odd/even hospital number or date of birth, alternation), cluster randomised trials, and non‐randomised studies.
Types of participants
Participants (irrespective of age, sex, or race) who had undergone laparoscopic abdominal or gynaecological pelvic surgery (irrespective of elective or emergency procedure) under general anaesthesia.
Types of interventions
We included laparoscopic abdominal surgeries performed under standard pressure (12 mmHg to 16 mmHg) pneumoperitoneum with cold gas insufflation (Gurusamy 2014). We planned to assess the following gases for establishing pneumoperitoneum.
-
Nitrous oxide versus carbon dioxide.
-
Helium versus carbon dioxide.
-
Room (ambient) air versus carbon dioxide.
-
Argon versus carbon dioxide.
-
Nitrogen versus carbon dioxide.
-
Any other gas versus carbon dioxide.
-
Any other gas (except carbon dioxide) versus any other gas (except carbon dioxide).
Types of outcome measures
Primary outcomes
-
Complications (30 days; defined and graded by the Clavien‐Dindo complications classification system) (Clavien 2009).
-
Cardiopulmonary complications (defined by authors, e.g. arrhythmia, ischaemias, atelectasis, hypoxaemia, pneumothorax, pulmonary oedema).
-
Procedure‐related general complications (surgical morbidity).
-
-
Pneumoperitoneum‐related serious adverse events (30 days; defined by authors, e.g. gas embolism, subcutaneous emphysema, abdominal explosion).
Secondary outcomes
-
Mortality (30 days postoperatively).
-
Quality of life (30 days; any validated score).
-
Pain scores (seven days; graded by visual analogue scale (VAS) score (e.g. 0 cm to 10 cm).
-
Analgesia requirements (seven days).
-
Costs (30 days; e.g. costs of gases, hospital costs).
-
Cardiopulmonary changes (seven days; defined by authors, e.g. heart rate, blood pressure, blood pH, cardiac output, pulmonary compliance, peak airway pressure).
Reporting of the outcomes listed here was not an inclusion criterion for the review.
Search methods for identification of studies
We designed the search strategy with the help of Sys Johnsen (former Cochrane Information Specialist of the Cochrane Colorectal Cancer Group). Searches were conducted in October 2021 irrespective of language, year, or publication status.
Electronic searches
We searched the following electronic databases with no language or date of publication restrictions:
-
Cochrane Central Register of Controlled Trials (CENTRAL) (the Cochrane Library; 2021, Issue 10) (Appendix 1);
-
MEDLINE (Ovid) (1950 to October 2021) (Appendix 2);
-
Embase (Ovid) (1974 to October 2021) (Appendix 3);
-
Science Citation Index Expanded (Web of Science) (1970 to October 2021) (Appendix 4);
-
World Health Organization International Trials Registry Platform search portal (apps.who.int/trialsearch/) (October 2021);
-
ClinicalTrials.gov (www.clinicaltrials.gov/) (October 2021);
-
Chinese Biomedical Literature Database (CBM) (1978 to October 2021).
Searching other resources
Furthermore, we searched the following databases in October 2021:
-
Current Controlled Trials (www.controlled-trials.com/);
-
Chinese Clinical Trial Register (www.chictr.org/);
-
EU Clinical Trials Register (www.clinicaltrialsregister.eu/).
We searched the reference lists of identified studies and meeting abstracts via the Society of American Gastrointestinal and Endoscopic Surgeons (SAGES) (www.sages.org/), European Association for Endoscopic Surgery (EAES) (www.eaes-eur.org/), and Conference Proceedings Citation Index to explore further relevant clinical trials. We planned to communicate with the authors of included RCTs for further information in the review.
Data collection and analysis
We conducted the systematic review according to guidelines of the Cochrane Handbook for Systematic Reviews of Intervention (Higgins 2021) and Methodological Expectations of Cochrane Intervention Reviews (Chandler 2020).
Selection of studies
After completing the searches, we merged the search results using the software package Endnote X7 (reference management software) and removed duplicate records. Two review authors (YX, CY) independently scanned the title and abstract of every record identified by the search for inclusion. We retrieved the full text for further assessment if the inclusion criteria were unclear from the abstract. We included eligible studies irrespective of whether they reported the measured outcome data. We detected duplicate publications by identifying common authors, centres, details of the interventions, numbers of participants, and baseline data (Lefebvre 2021). We excluded papers that did not meet the inclusion criteria and listed the reasons for their exclusion. A third review author (DY) resolved any discrepancy between the two review authors by discussion.
Data extraction and management
We used a standard data collection form to record study characteristics and outcome data, which had been piloted on at least one study in the review. Two review authors (CN, GJ) extracted the following study characteristics from included studies.
-
Methods: study design, total duration of study and run in, number of study centres and location, study setting, withdrawals, date of study.
-
Participants: number of participants, mean age, age range, gender, severity of condition, diagnostic criteria, inclusion criteria, exclusion criteria.
-
Interventions: intervention, comparison.
-
Outcomes: primary and secondary outcomes specified and collected, time points reported.
-
Notes: funding for trial, notable conflicts of interest of trial authors.
Two review authors (CN, GJ) independently extracted outcome data from included studies. We resolved disagreements by consensus or by involving a third review author (DY). One review author (CN) copied the data from the data collection form into Review Manager 5 (Review Manager 2020). We double‐checked that the data were entered correctly by comparing the study reports with the data presented in the systematic review. A second review author (GJ) cross‐checked study characteristics for accuracy against the trial reports.
Assessment of risk of bias in included studies
Two review authors (BL, ZL) independently assessed the risk of bias in the included trials, using the Cochrane's RoB 1 for randomised trials (Chapter 8, Higgins 2017). We assessed risk of bias for the following domains:
-
random sequence generation;
-
allocation concealment;
-
blinding of participants and personnel;
-
blinding of outcome assessment;
-
incomplete outcome data;
-
selective reporting bias;
-
other sources of bias (baseline imbalances).
We judged each domain as low risk, high risk, or unclear risk of bias according to the criteria used in Cochrane's RoB 1 (see Appendix 5) (Chapter 8.5.d, Higgins 2017). We considered a trial at low risk of bias if we assessed the trial at low risk of bias across all domains. Otherwise, we considered trials at unclear risk of bias or at high risk of bias regarding one or more domains at high risk of bias. We resolved any difference in opinion by discussion. In case of disagreements, consensus was reached by discussion with a third review author (CY).
We presented the results of the risk of bias in two figures (a risk of bias graph and a risk of bias summary) generated by Review Manager 5 (Review Manager 2020).
Assessment of bias in conducting the systematic review
We conducted the review according to the published protocol (Lu 2012), and reported any deviations from that protocol in the Differences between protocol and review section of the review.
Measures of treatment effect
We performed the meta‐analysis using Review Manager 5 (Review Manager 2020). For dichotomous outcomes, we calculated risk ratio (RR) with 95% confidence interval (CI) (Deeks 2021). In case of rare events (e.g. mortality, serious adverse events), we calculated the Peto odds ratio (Peto OR) (Deeks 2021). For continuous outcomes, we calculated the mean difference (MD) with 95% CI (Deeks 2021). For continuous outcomes with different measurement scales in different RCTs, we calculated the standardised mean difference (SMD) with 95% CI (Deeks 2021).
Where a trial reported multiple arms, we included only the relevant arms. If two comparisons (e.g. drug A versus placebo and drug B versus placebo) had to be entered into the same meta‐analysis, we halved the control group to avoid double counting.
Unit of analysis issues
The unit of analysis was the individual participant. We excluded cluster RCTs in this review. We identified no relevant cross‐over trials for inclusion in this review. For review updates, we planned to only include data from the first period of treatment (e.g. before crossover).
Dealing with missing data
We contacted the original investigators to request further information in case of missing data. If there was no reply, we used only the available data in the analyses. We also performed 'best‐case'/'worst‐case' scenario analyses to take into account missing data. We did this by changing missing data to having an event ('worst/best‐case' scenario) and then to not having an event ('best/worst‐case' scenario) in a sensitivity analysis to investigate the impact of missing data on meta‐analysis results.
Assessment of heterogeneity
We described heterogeneity in the data using the Chi2 test (Deeks 2021). We considered a P value less than 0.05 to be statistically significant heterogeneity (Deeks 2021). We also used the I2 statistic to measure the quantity of heterogeneity. In case of statistical heterogeneity or clinical heterogeneity (or both), we performed the meta‐analysis but interpreted the result cautiously and planned to investigate potential sources to the heterogeneity.
Assessment of reporting biases
We planned to perform and examine a funnel plot to explore possible publication biases. However, as the number of trials included in each comparison was fewer than 10, we did not produce any funnel plots (Sterne 2017).
Data synthesis
We performed the meta‐analysis using Review Manager 5 (Review Manager 2020). For all analyses, we examined both fixed‐effect and random‐effects models. We reported only the fixed‐effect model results according to the protocol when there was no discrepancy between the two models. In case of discrepancy between the two models, we reported both results.
Subgroup analysis and investigation of heterogeneity
We planned to perform the following subgroup analysis; however, due to too few included trials for each outcome analysis, these were not conducted.
-
Trials with low risk of bias versus trials with high risk of bias.
-
The type of operation (laparoscopic surgery of stomach, gallbladder, liver, pancreas, spleen, intestine, kidney, etc.).
-
People with high anaesthetic risk (e.g. people with cardiopulmonary disease; American Society of Anesthesiologists (ASA) status III or IV) versus people with low anaesthetic risk (e.g. people without cardiopulmonary disease; ASA status I or II).
Sensitivity analysis
We performed the following sensitivity analysis.
-
Changing between worst/best‐case scenario analysis (the events happened in the experimental group but did not happen in the control group for missing participants) and best/worst‐case scenario analysis (the events happened in the control group but did not happen in the experimental group for missing participants) for missing data.
If the results did not change, they were considered robust.
We also planned to perform the following two sensitivity analyses; however, as all included trials had a high or unclear risk of bias and low numbers of participants, these could not be conducted.
-
Excluding trials with a high or unclear risk of bias.
-
Excluding RCTs with small sample sizes.
Trial sequential analysis
We performed trial sequential analysis (TSA) for the primary outcomes if possible. TSA aims to reduce the risk of random error in the setting of repetitive testing of accumulating data, thereby improving the reliability of conclusions (Brok 2008; Wetterslev 2008; Wetterslev 2009). The required information size was calculated on the basis of a risk ratio reduction (RRR) of 20% (Brok 2008; Wetterslev 2008; Wetterslev 2009). The results of the trials were presented as a cumulative Z‐curve. The trial sequential monitoring boundaries were constructed and the diversity‐adjusted required information size calculated with a type 1 error of 5% and a type 2 error of 20% (Brok 2008; Wetterslev 2008; Wetterslev 2009). TSA was not adjusted for heterogeneity because the estimate of the heterogeneity parameter may be unreliable. The results were presented as a graph with the cumulative meta‐analysis results entered. The TSA shows firm evidence of intervention effects (or no intervention effects) if the cumulative Z‐curve crosses the monitoring boundaries; it also shows that additional trials may be needed if the boundaries are not crossed (Brok 2008; Wetterslev 2008; Wetterslev 2009). TSA was performed using Trial Sequential Analysis software (TSA 2011).
Summary of findings and assessment of the certainty of the evidence
We evaluated the certainty of the evidence using the GRADE approach for the following outcomes (Schünemann 2009): cardiopulmonary complications, procedure‐related general complications (surgical morbidity), pneumoperitoneum‐related serious adverse events, mortality, quality of life, pain scores, analgesia requirements, and costs.
We presented the certainty of the evidence in summary of findings tables for the following comparisons.
-
Nitrous oxide pneumoperitoneum versus carbon dioxide pneumoperitoneum.
-
Helium pneumoperitoneum versus carbon dioxide pneumoperitoneum.
-
Room air pneumoperitoneum versus carbon dioxide pneumoperitoneum.
Judgements about the certainty of the evidence (high, moderate, low, or very low) were justified, documented, and incorporated into the reporting of results for each outcome. The certainty of the evidence was downgraded by one level (serious concern) or two levels (very serious concerns) applying to each of the following five reasons listed: risk of bias; inconsistency (unexplained heterogeneity, inconsistency of results); indirectness (indirect population, intervention, control, outcomes); imprecision (wide CIs, single trials); and publication bias.
Results
Description of studies
See: Characteristics of included studies; Characteristics of excluded studies; and Characteristics of studies awaiting classification tables.
Results of the search
In this updated review, we identified 3644 records through the electronic searches of CENTRAL (797 records), MEDLINE (Ovid) (436 records), Embase (Ovid) (832 records), Science Citation Index Expanded (Web of Science) (1514 records), and Chinese Biomedical Literature Database (CBM) (65 records). Of the 3644 records, 2269 records had already been assessed for the second version of this updated review (2269 records prior to 2016 and 336 duplicates). Of the remaining 1039 records, we excluded 1037 clearly irrelevant records through reading titles and abstracts. We retrieved the remaining two records for further assessment (Asgari 2011; Bergstrom 2015). We included Asgari 2011. Bergstrom 2015 was a conference abstract. We contacted the original investigators for further information necessary for assessment, but received no feedback. Therefore, this study is awaiting classification.
In total, this updated review included 10 RCTs. The study flow diagram is shown in Figure 1.

Study flow diagram.
Included studies
In the last published version of this review from 2017, we included nine RCTs, published between 1993 and 2015 (Aitola 1998; Bongard 1993; Gu 2015; Lipscomb 1993; Naude 1996; Neuhaus 2001; O'Boyle 2002; Sietses 2002; Tsereteli 2002). In this update, we identified one additional RCT (Asgari 2011), giving 10 included RCTs (including 583 participants). Details of the RCTs are shown in the Characteristics of included studies table. Four RCTs compared nitrous oxide pneumoperitoneum with carbon dioxide pneumoperitoneum (Aitola 1998; Asgari 2011; Lipscomb 1993; Tsereteli 2002). Five RCTs compared helium pneumoperitoneum with carbon dioxide pneumoperitoneum (Bongard 1993; Naude 1996; Neuhaus 2001; O'Boyle 2002; Sietses 2002). One RCT compared room (ambient) air pneumoperitoneum with carbon dioxide pneumoperitoneum (Gu 2015). All the RCTs were single‐centre studies. Studies were conducted in the USA (Bongard 1993; Lipscomb 1993; Naude 1996; Tsereteli 2002), Australia (Neuhaus 2001; O'Boyle 2002), China (Gu 2015), Finland (Aitola 1998), Iran (Asgari 2011), and the Netherlands (Sietses 2002). Three RCTs reported the number of surgeons, which was one or two in those studies (Aitola 1998; Lipscomb 1993; Tsereteli 2002). Nine RCTs reported the mean age of the included participants (Aitola 1998; Asgari 2011; Bongard 1993; Gu 2015; Lipscomb 1993; Naude 1996; O'Boyle 2002; Sietses 2002; Tsereteli 2002). The mean age of the participants ranged from 27.6 years to 49.0 years. Eight RCTs reported the sex distribution of the included participants (Aitola 1998; Asgari 2011; Bongard 1993; Gu 2015; Lipscomb 1993; Naude 1996; O'Boyle 2002; Tsereteli 2002). The mean proportion of women varied between 45.5% and 100%. Participants underwent various elective laparoscopic general abdominal or gynaecological pelvic procedures (e.g. cholecystectomy, fundoplication (antireflux surgery), hernia repair, tubal ligation). The outcomes measured were complications, pneumoperitoneum‐related serious adverse events, cardiopulmonary changes, pain scores, hospital costs, and mortality. Two RCTs were funded by non‐commercial grants. The other eight RCTs did not report funding sources. None of the RCTs reported the conflicts of interest.
Excluded studies
We excluded 10 studies. One RCT included participants who underwent laparoscopic pelvic surgery performed by gynaecology surgeons under local anaesthesia (Lipscomb 1994). Two RCTs focused on diagnostic laparoscopy performed under local anaesthesia (Minoli 1982; Sharp 1982). None of the other excluded studies were RCTs (Fernández‐Cruz 1998; McMahon 1994; Neuberger 1996; O'Connor 2017; Ooka 1993; Rammohan 2011; Zheng 2014).
Studies awaiting classification
One study was reported in a conference abstract (Bergstrom 2015). The study did not report further information on the study design, inclusion criteria, or exclusion criteria. We received no reply from the authors on email contact. Therefore, we assessed this study as awaiting classification (see Characteristics of studies awaiting classification table).
Risk of bias in included studies
The risk of bias of the included studies is shown in Figure 2 and Figure 3. None of the included trials was at low risk of bias.

Risk of bias graph: review authors' judgements about each risk of bias item presented as percentages across all included studies.

Risk of bias summary: review authors' judgements about each risk of bias item for each included study.
Allocation
Random sequence generation was at low risk of bias in two trials where participants were randomised using computer‐generated numbers (Bongard 1993; Lipscomb 1993), and unclear risk of bias in eight trials (Aitola 1998; Asgari 2011; Gu 2015; Naude 1996; Neuhaus 2001; O'Boyle 2002; Sietses 2002; Tsereteli 2002). Allocation concealment was at low risk of bias in two trials that used sealed opaque envelopes to conceal the allocations (Neuhaus 2001; O'Boyle 2002), and unclear risk of bias in the remaining eight studies (Aitola 1998; Asgari 2011; Bongard 1993; Gu 2015; Lipscomb 1993; Naude 1996; Sietses 2002; Tsereteli 2002).
Blinding
Blinding of participants and personnel was at low risk of bias in one trial (Asgari 2011), unclear risk of bias in six trials (Aitola 1998; Gu 2015; Lipscomb 1993; Neuhaus 2001; O'Boyle 2002; Sietses 2002), and high risk of bias in three trials (Bongard 1993; Naude 1996; Tsereteli 2002). Blinding of outcome assessment was at low risk of bias in six trials (Aitola 1998; Asgari 2011; Lipscomb 1993; Neuhaus 2001; O'Boyle 2002; Tsereteli 2002), and unclear risk of bias in four trials (Bongard 1993; Gu 2015; Naude 1996; Sietses 2002).
Incomplete outcome data
There were no postrandomisation dropouts in four trials (Asgari 2011; Gu 2015; Lipscomb 1993; Neuhaus 2001). Although there were seven dropouts (6.4%) in two trials, the data were analysed on an intention‐to‐treat basis (Bongard 1993; O'Boyle 2002). There were three dropouts (2.1%) in two trials (Aitola 1998; Tsereteli 2002). The attrition rate may be too low to represent a source of bias in both trials (Aitola 1998; Tsereteli 2002). These eight trials were considered at low risk of attrition bias. There were eight dropouts (16.3%) in the other two trials (Naude 1996; Sietses 2002), but the data were not analysed on an intention‐to‐treat basis. Thus, both trials were at high risk of attrition bias (Naude 1996; Sietses 2002). The reasons for the dropouts were reported in the Characteristics of included studies table.
Selective reporting
None of the studies provided a study protocol. There was a study registration for one trial (Asgari 2011), but this registration was done retrospectively after trial conduct. Selective reporting was at low risk of bias in six trials where the published reports included all expected outcomes (e.g. cardiopulmonary complications, surgical morbidity, serious adverse events) (Aitola 1998; Asgari 2011; Bongard 1993; Neuhaus 2001; O'Boyle 2002; Tsereteli 2002). The other four trials failed to include results for key outcomes (e.g. cardiopulmonary complications, surgical morbidity, serious adverse events) that would be expected to have been reported for such studies (Gu 2015; Lipscomb 1993; Naude 1996; Sietses 2002). Thus, we considered these four trials to be high risk of selective reporting (Gu 2015; Lipscomb 1993; Naude 1996; Sietses 2002).
Other potential sources of bias
Three trials presented considerable baseline imbalance, thus we considered these at high risk of bias (Bongard 1993; Lipscomb 1993; Naude 1996).
Effects of interventions
See: Summary of findings 1 Nitrous oxide versus carbon dioxide for establishing pneumoperitoneum during laparoscopic abdominal surgery; Summary of findings 2 Helium versus carbon dioxide for establishing pneumoperitoneum during laparoscopic abdominal surgery; Summary of findings 3 Room air versus carbon dioxide for establishing pneumoperitoneum during laparoscopic abdominal surgery
1. Nitrous oxide pneumoperitoneum versus carbon dioxide pneumoperitoneum
Four trials with 260 participants compared nitrous oxide pneumoperitoneum versus carbon dioxide pneumoperitoneum (Aitola 1998; Asgari 2011; Lipscomb 1993; Tsereteli 2002). See summary of findings Table 1.
1.1. Primary outcomes
1.1.1. Cardiopulmonary complications (Analysis 1.1)
Three trials (204 participants) reported cardiopulmonary complications (Aitola 1998; Asgari 2011; Tsereteli 2002). Overall, there were 11 cases of cardiopulmonary complications: eight in the nitrous oxide group and three in the carbon dioxide group. The evidence is very uncertain about the effect of nitrous oxide pneumoperitoneum compared to carbon dioxide pneumoperitoneum on cardiopulmonary complications (Peto OR 2.62, 95% CI 0.78 to 8.85; P = 0.12; Analysis 1.1). There was clinical heterogeneity because the three trials performed quite different laparoscopic operations (cholecystectomy versus foregut surgery). This finding was downgraded to very low certainty due to very serious risk of bias (all included studies with unclear risk of bias for random sequence generation and allocation concealment; one study with high risk of bias for blinding of participants and personnel) and very serious imprecision (small sample size, few events, and wide CIs that included both potential benefit and potential harm from the intervention).
1.1.2. Procedure‐related general complications (surgical morbidity) (Analysis 1.2)
Three trials (207 participants) reported surgical morbidity (Aitola 1998; Asgari 2011; Tsereteli 2002). Overall, there were four cases of procedure‐related general complications: two in the nitrous oxide group versus two in the carbon dioxide group. The evidence is very uncertain about the effect of nitrous oxide pneumoperitoneum compared to carbon dioxide pneumoperitoneum on surgical morbidity (Peto OR 1.01, 95% 0.14 to 7.31; P = 0.99; Analysis 1.2). There was clinical heterogeneity because the three trials performed quite different laparoscopic operations (cholecystectomy versus foregut surgery). This finding was downgraded to very low certainty due to very serious risk of bias (all included studies with unclear risk of bias for random sequence generation and allocation concealment; one study with high risk of bias for blinding of participants and personnel) and serious imprecision (small sample size, few events, and wide confidence CIs that included both potential benefit and potential harm from the intervention).
1.1.3. Pneumoperitoneum‐related serious adverse events
None of the trials reported any pneumoperitoneum‐related serious adverse events. This finding was downgraded to very low‐certainty evidence due to very serious risk of bias (three studies with unclear risk of bias for random sequence generation; all included studies with unclear risk of bias for allocation concealment; one study with high risk of bias for blinding of participants and personnel; one study with high risk of bias for selective reporting and baseline imbalance) and very serious imprecision (small sample size and few events).
1.2. Secondary outcomes
1.2.1. Mortality
None of the trials reported any deaths. This finding was downgraded to very low‐certainty evidence due to very serious risk of bias (three studies with unclear risk of bias for random sequence generation; all included studies with unclear risk of bias for allocation concealment; one study with high risk of bias for blinding of participants and personnel; one study with high risk of bias for selective reporting and baseline imbalance) and very serious imprecision (small sample size and few events).
1.2.2. Quality of life
None of the trials reported quality of life.
1.2.3. Pain scores (Analysis 1.3)
One trial (64 participants undergoing laparoscopic cholecystectomy) reported pain scores on the first postoperative day (Asgari 2011). The pain scores (VAS scale of 1 cm to 10 cm with lower numbers indicating less pain) was 2.6 cm in the nitrous oxide group versus 3.5 cm in the carbon dioxide group. The evidence is very uncertain about the effect of nitrous oxide pneumoperitoneum compared to carbon dioxide pneumoperitoneum on the pain scores (MD −0.90 cm, 95% −2.10 to 0.30; P = 0.30; Analysis 1.3). Two trials (140 participants undergoing laparoscopic cholecystectomy or foregut surgery) reported pain scores at various time points on the first postoperative day (Aitola 1998; Tsereteli 2002). Both trials reported lower pain scores (about 1 cm on a VAS scale of 0 cm to 10 cm with lower numbers indicating less pain) in the nitrous oxide group compared with the carbon dioxide group at various time points on the first postoperative day (Aitola 1998; Tsereteli 2002). However, as neither trial reported the standard deviation (SD) for pain scores, we did not perform a meta‐analysis (Aitola 1998; Tsereteli 2002). Another trial (53 participants undergoing laparoscopic tubal ligation) reported pain scores on the first postoperative day using the McGill Pain Questionnaire (0 cm to 5 cm with lower numbers indicating less pain). The pain scores was 1.4 cm in the nitrous oxide group versus 1.0 cm in the carbon dioxide group (Lipscomb 1993). There was clinical heterogeneity because the trials performed quite different laparoscopic operations (cholecystectomy, foregut surgery, and tubal ligation). This finding was downgraded to very low‐certainty evidence due to very serious risk of bias (three studies with unclear risk of bias for random sequence generation; all included studies with unclear risk of bias for allocation concealment; one study with high risk of bias for blinding of participants and personnel; one study with high risk of bias for selective reporting and baseline imbalance), serious inconsistency (three different laparoscopic operations and results of one study are not in agreement with the other three studies) and serious imprecision (small sample size).
1.2.4. Analgesia requirements (Analysis 1.4)
Four trials (257 participants) reported analgesia requirements. The trials used different measurement scales (milligrams versus tablets per 24 hours); therefore we calculated an SMD. Analgesia requirements (oxycodone or ibuprofen) in the nitrous oxide group was less compared to the carbon dioxide group, but the evidence is very uncertain (SMD −0.65, 95% CI −0.90 to −0.39; P < 0.00001; Analysis 1.4). In addition, there was clinical heterogeneity because the four trials performed quite different laparoscopic operations (cholecystectomy, foregut surgery, and tubal ligation). Consequently, this finding was downgraded to very low‐certainty evidence due to very serious risk of bias (three studies with unclear risk of bias for random sequence generation; all included studies with unclear risk of bias for allocation concealment; one study with high risk of bias for blinding of participants and personnel; and one study with high risk of bias for selective reporting and baseline imbalance), serious imprecision (small sample size), and serious inconsistency (substantial heterogeneity I2 = 80%).
1.2.5. Costs
None of the trials reported costs.
1.2.6. Cardiopulmonary changes (Analysis 1.5; Analysis 1.6)
One trial (100 participants) reported cardiopulmonary changes (Tsereteli 2002). The evidence is very uncertain about the effect of nitrous oxide pneumoperitoneum compared to carbon dioxide pneumoperitoneum on the following cardiopulmonary parameter changes (the differences between the start of pneumoperitoneum and the end of pneumoperitoneum) between the groups: heart rate change (MD −0.60 beats/minute, 95% CI −4.13 to 2.93; P = 0.74), mean arterial pressure change (MD −3.80 mmHg, 95% CI −7.90 to 0.30; P = 0.07), oxygen saturation change (MD 0%, 95% CI −0.39 to 0.39; P = 1.00), and peak airway pressure change (MD −0.30 cmH2O, 95% CI −2.17 to 1.57; P = 0.75) (Analysis 1.5). There were no other cardiopulmonary changes reported.
One trial (64 participants) reported cardiopulmonary parameters (Asgari 2011). The evidence is very uncertain about the effect of nitrous oxide pneumoperitoneum compared to carbon dioxide pneumoperitoneum on heart rate, mean arterial pressure, or oxygen saturation at the start or end of pneumoperitoneum (Analysis 1.6).
These findings were downgraded to very low‐certainty evidence due to very serious risk of bias (all included studies with unclear risk of bias for random sequence generation and allocation concealment; one study with high risk of bias for performance bias), serious imprecision (small sample size), and indirectness of the outcome (surrogate outcome).
2. Helium pneumoperitoneum versus carbon dioxide pneumoperitoneum
Five trials (177 participants) reported helium pneumoperitoneum versus carbon dioxide pneumoperitoneum (Bongard 1993; Naude 1996; Neuhaus 2001; O'Boyle 2002; Sietses 2002). Four trials randomised participants to helium pneumoperitoneum (69 participants) or carbon dioxide pneumoperitoneum (75 participants) (Bongard 1993; Naude 1996; Neuhaus 2001; O'Boyle 2002; Sietses 2002), and one trial involving 33 participants did not state the number of participants in each group (Sietses 2002). See summary of findings Table 2.
2.1. Primary outcomes
2.1.1. Cardiopulmonary complications (Analysis 2.1)
Three trials (128 participants) reported cardiopulmonary complications (Bongard 1993; Neuhaus 2001; O'Boyle 2002). Overall, there were five cases of cardiopulmonary complications: three in the helium group and two in the carbon dioxide group. The evidence is very uncertain about the effect of helium pneumoperitoneum compared to carbon dioxide pneumoperitoneum on cardiopulmonary complications (Peto OR 1.66, 95% CI 0.28 to 9.72; P = 0.57; Analysis 2.1). There was clinical heterogeneity because the three trials performed quite different laparoscopic operations (cholecystectomy, fundoplication, and gastrointestinal surgery). This finding was downgraded to very low‐certainty evidence due to very serious risk of bias (two studies with unclear risk of bias for random sequence generation and allocation concealment; one study with high risk of bias for blinding of participants and personnel and baseline imbalance) and very serious imprecision (small sample size, few events, and wide CIs that included both potential benefit and potential harm from the intervention).
2.1.2. Procedure‐related general complications (surgical morbidity)
None of the trials reported any significant procedure‐related general complications. This finding was downgraded to very low‐certainty evidence due to very serious risk of bias (four studies with unclear risk of bias for random sequence generation; three studies with unclear risk of bias for allocation concealment; two studies with high risk of bias for blinding of participants and personnel, incomplete outcome data, selective reporting, and baseline imbalance) and serious imprecision (small sample size and few events).
2.1.3. Pneumoperitoneum‐related serious adverse events (Analysis 2.2)
Three trials (128 participants) reported serious adverse events (Bongard 1993; Neuhaus 2001; O'Boyle 2002). There were three serious adverse events (subcutaneous emphysema) related to pneumoperitoneum; three in the helium group and none in the carbon dioxide group. The evidence is very uncertain about the effect of helium pneumoperitoneum compared to carbon dioxide pneumoperitoneum on the Peto OR for pneumoperitoneum‐related serious adverse events (Peto OR 8.28, 95% CI 0.86 to 80.03; P = 0.07; Analysis 2.2). There was clinical heterogeneity because the three trials performed quite different laparoscopic operations. This finding was downgraded to very low‐certainty evidence due to very serious risk of bias (two studies with unclear risk of bias for random sequence generation and allocation concealment; one study with high risk of bias for blinding of participants and personnel and baseline imbalance) and very serious imprecision (small sample size, few events, and wide CIs that included both potential benefit and potential harm from the intervention).
2.2. Secondary outcomes
2.2.1. Mortality
None of the trials reported any deaths. This finding was downgraded to very low‐certainty evidence due to serious risk of bias (four studies with unclear risk of bias for random sequence generation; three studies with unclear risk of bias for allocation concealment; two studies with high risk of bias for blinding of participants and personnel, incomplete outcome data, selective reporting, and baseline imbalance) and serious imprecision (small sample size and few events).
2.2.2. Quality of life
None of the trials reported quality of life.
2.2.3. Pain scores (shoulder or abdominal pain) (Analysis 2.3)
Two trials (108 participants) reported pain scores (Neuhaus 2001; O'Boyle 2002). The evidence suggests that helium pneumoperitoneum results in little to no difference in the first postoperative day pain scores (graded by VAS on a scale of 0 cm to 10 cm, with lower numbers indicating less pain) compared to carbon dioxide pneumoperitoneum (MD 0.49 cm, 95% CI −0.28 to 1.26; P = 0.21; Analysis 2.3). There was clinical heterogeneity because the two trials performed quite different laparoscopic operations. This finding was downgraded to low‐certainty evidence due to serious risk of bias (two studies with unclear risk of bias for random sequence generation and blinding of participants and personnel) and serious imprecision (small sample size).
2.2.4. Analgesia requirements (Analysis 2.4; Analysis 2.5)
Two trials (108 participants) reported analgesia requirements (Neuhaus 2001; O'Boyle 2002). One trial reported the amount of analgesia consumed (O'Boyle 2002). The overall analgesic (morphine) consumption was higher in the helium group than the carbon dioxide group (MD 12.00 mg, 95% CI 4.44 to 19.56; P = 0.002; Analysis 2.4). One trial reported the number of participants requiring analgesia (Neuhaus 2001). There was no difference in analgesia (morphine) requirements between the helium group (3/8; 37.5%) and carbon dioxide group (9/10; 90%) (Analysis 2.5). However, the trial was underpowered with only 18 participants (very low‐certainty evidence). There was clinical heterogeneity because the two trials performed quite different laparoscopic operations. This finding was downgraded to very low‐certainty evidence due to serious risk of bias (two studies with unclear risk of bias for random sequence generation and blinding of participants and personnel), serious inconsistency (two different laparoscopic operations and results of one study are not in agreement with the other study), and serious imprecision (small sample size).
2.2.5. Costs
None of the trials reported costs.
2.2.6. Cardiopulmonary changes (Analysis 2.6)
Two trials (34 participants) reported blood pH (Bongard 1993; Naude 1996). There was no difference between the groups in blood pH at the start of pneumoperitoneum (MD 0.01, 95% CI −0.01 to 0.04; P = 0.30). However, the blood pH was higher in the helium group compared with the carbon dioxide group at the middle of pneumoperitoneum (MD 0.08, 95% CI 0.06 to 0.11; P < 0.00001) and the end of pneumoperitoneum (MD 0.10, 95% CI 0.06 to 0.14; P < 0.00001). Three trials (52 participants) reported partial pressure of carbon dioxide (Bongard 1993; Naude 1996; Neuhaus 2001). There was no difference between the groups in partial pressure of carbon dioxide at the start of pneumoperitoneum (MD 0.31 mmHg, 95% CI −1.79 to 2.40; P = 0.78) or the middle of pneumoperitoneum (MD −0.84 mmHg, 95% CI −3.70 to 2.02; P = 0.56). However, the partial pressure of carbon dioxide was lower in the helium group than the carbon dioxide group at the end of pneumoperitoneum (MD −12.78 mmHg, 95% CI −16.78 to −8.77; P < 0.00001). There was clinical heterogeneity because the included trials performed quite different laparoscopic operations. These findings were downgraded to very low‐certainty evidence due to very serious risk of bias (two studies with unclear risk of bias for random sequence generation and allocation concealment; two studies with high risk of bias for blinding of participants and personnel and baseline imbalance; one study with high risk of bias for incomplete outcome data and selective reporting), serious imprecision (small sample size), and indirectness of the outcome (surrogate outcome).
3. Room (ambient) air pneumoperitoneum versus carbon dioxide pneumoperitoneum
One trial (146 participants) reported room (ambient) air pneumoperitoneum versus carbon dioxide pneumoperitoneum (Gu 2015). See summary of findings Table 3.
3.1. Primary outcomes
3.1.1. Cardiopulmonary complications
The trial did not report any cardiopulmonary complications. This finding was downgraded to very low‐certainty evidence due to very serious risk of bias (unclear risk of bias for random sequence generation, allocation concealment, blinding of participants and personnel, and blinding of outcome assessment; high risk of bias for selective reporting) and serious imprecision (small sample size).
3.1.2. Procedure‐related general complications (surgical morbidity)
The trial did not report surgical morbidity.
3.1.3. Pneumoperitoneum‐related serious adverse events
The trial did not report any pneumoperitoneum‐related serious adverse events. This finding was downgraded to very low‐certainty evidence due to very serious risk of bias (unclear risk of bias for random sequence generation, allocation concealment, blinding of participants and personnel, and blinding of outcome assessment; high risk of bias for selective reporting) and serious imprecision (small sample size for such a rare outcome).
3.2. Secondary outcomes
3.2.1. Mortality
The trial did not report any deaths. This finding was downgraded to very low‐certainty evidence due to very serious risk of bias (unclear risk of bias for random sequence generation, allocation concealment, blinding of participants and personnel, and blinding of outcome assessment; high risk of bias for selective reporting) and serious imprecision (small sample size for such a rare outcome).
3.2.2. Quality of life
The trial did not report quality of life.
3.2.3. Pain scores (Analysis 3.3)
Room air pneumoperitoneum may reduce the first postoperative day pain scores (graded by VAS on a scale of 0 cm to 10 cm with lower numbers indicating less pain) compared to carbon dioxide pneumoperitoneum, but the evidence is very uncertain (MD −0.80 cm, 95% CI −1.15 to −0.45; P < 0.00001). This finding was downgraded to very low‐certainty evidence due to very serious risk of bias (unclear risk of bias for random sequence generation, allocation concealment, blinding of participants and personnel, and blinding of outcome assessment; high risk of bias for selective reporting) and serious imprecision (small sample size).
3.2.4. Analgesia requirements
The trial did not report analgesia requirements.
3.2.5. Costs (Analysis 3.4)
Room air pneumoperitoneum may reduce the total hospital costs compared to carbon dioxide pneumoperitoneum, but the evidence is very uncertain (MD −CNY 2667.00, 95% CI −3275.68 to −2058.32; equivalent to approximately USD 308 to USD 490 in November 2020; P < 0.00001). This finding was downgraded to very low‐certainty evidence due to very serious risk of bias (unclear risk of bias for random sequence generation, allocation concealment, blinding of participants and personnel, and blinding of outcome assessment; high risk of bias for selective reporting) and serious imprecision (small sample size).
3.2.6. Cardiopulmonary changes (Analysis 3.5)
There was no difference between groups in heart rate at the start of pneumoperitoneum (MD −0.10 beats/minute, 95% CI −3.11 to 2.91; P = 0.95). However, heart rate was lower in the room air group compared with the carbon dioxide group in the middle of pneumoperitoneum (MD −7.30 beats/minute, 95% CI −9.78 to −4.82; P < 0.00001) and the end of pneumoperitoneum (MD −8.70 beats/minutes, 95% CI −11.72 to −5.68; P < 0.00001) (Analysis 3.5).
There was no difference between groups in blood systolic pressure or partial pressure of carbon dioxide at the start, middle, or end of pneumoperitoneum (all very low‐certainty evidence).
All these findings were downgraded to very low‐certainty evidence due to very serious risk of bias (unclear risk of bias for random sequence generation, allocation concealment, blinding of participants and personnel, and blinding of outcome assessment; high risk of bias for selective reporting), serious imprecision (small sample size), and indirectness of the outcome (surrogate outcome).
4. Reporting bias
We did not perform funnel plots to assess reporting biases because the number of included studies in each comparison was fewer than 10. The study by Bergstrom 2015 could not be included in the present review, as results were published only as a conference abstract. However, as this study had only 30 participants, the unavailability of full study results was not considered a source of potential publication bias.
5. Subgroup analysis
None of the planned subgroup analyses was performed due to the limited number of included trials for each outcome.
6. Sensitivity analysis
We performed worst/best‐case scenario and best/worst‐case scenario analyses for the outcomes cardiopulmonary complications, procedure‐related general complications (surgical morbidity), pneumoperitoneum‐related serious adverse events, and mortality to assess the impact of missing data for 13 postrandomisation dropouts across five trials (Analysis 4.1; Analysis 4.2; Analysis 4.3; Analysis 4.4; Analysis 5.1; Analysis 5.2; Analysis 5.3; Analysis 5.4; Analysis 6.1; Analysis 6.2; Analysis 6.3; Analysis 6.4; Analysis 7.1; Analysis 7.2; Analysis 7.3; Analysis 7.4). Results are presented in Table 1. Assigning death or no death to all missing participants in the helium versus carbon dioxide pneumoperitoneum comparison altered the conclusion drawn, confirming that the low mortality rate and small numbers of participants were insufficient to reliably assess this outcome. The other three outcomes (cardiopulmonary complications, procedure‐related general complications, and pneumoperitoneum‐related serious adverse events) also changed by assigning event or no event to all missing participants in the helium versus carbon dioxide pneumoperitoneum comparison.
| Changing between worst‐case scenario analysis and best‐case scenario analysis for missing data | |||
|---|---|---|---|
| Outcomes | Risk ratio (95% CI) | ||
| Main analysis | Worst/best‐case | Best/worst‐case | |
| Nitrous oxide vs carbon dioxide | |||
| Cardiopulmonary complications | Peto OR 2.62 (0.78 to 8.85) | Peto OR 3.16 (1.03 to 9.69) | Peto OR 1.66 (0.54 to 5.12) |
| Procedure‐related general complications (surgical morbidity) | Peto OR 1.01 (0.14 to 7.31) | Peto OR 2.01 (0.40 to 10.20) | Peto OR 0.51 (0.10 to 2.60) |
| Pneumoperitoneum‐related serious adverse events | No events | Peto OR 7.46 (0.47 to 119.30) | Peto OR 0.14 (0.01 to 2.19) |
| Mortality | No events | Peto OR 7.46 (0.47 to 119.30) | Peto OR 0.14 (0.01 to 2.19) |
| Helium vs carbon dioxide | |||
| Cardiopulmonary complications | Peto OR 1.66 (0.28 to 9.72) | Peto OR 4.66 (1.43 to 15.15) | Peto OR 1.66 (0.28 to 9.72) |
| Procedure‐related general complications/surgical morbidity | No events | Peto OR 8.89 (1.94 to 40.64) | Peto OR 0.12 (0.01 to 2.07) |
| Pneumoperitoneum‐related serious adverse events | Peto OR 8.28 (0.86 to 80.03) | Peto OR 9.19 (2.56 to 33.01) | Peto OR 8.28 (0.86 to 80.03) |
| Mortality | No events | Peto OR 8.89 (1.94 to 40.64) | Peto OR 0.12 (0.01 to 2.07) |
CI: confidence interval; Peto OR: Peto odds ratio, which was calculated for rare events (mortality, serious adverse events).
TSA of nitrous oxide pneumoperitoneum versus carbon dioxide pneumoperitoneum for cardiopulmonary complications is shown in Figure 4. The TSA graph showed that the cumulative Z‐curve did not cross the naive 5% statistical boundaries. The analysis showed a diversity‐adjusted required information size of 3781 participants (the number of participants needed to reach firm evidence of an intervention effect of 20% RRR). The number of participants included corresponded to only a small fraction (5.4%) of the diversity‐adjusted required information size; therefore, the trial sequential boundaries could not be drawn. TSA of nitrous oxide pneumoperitoneum versus carbon dioxide pneumoperitoneum for surgical morbidity is shown in Figure 5. The TSA graph showed that the cumulative Z‐curve did not cross the naive 5% statistical boundaries. The analysis showed a required information size of 3919 participants (the number of participants needed to reach firm evidence of an intervention effect of 20% RRR). The number of participants included corresponded to only a small fraction (5.3%) of the diversity‐adjusted required information size; therefore, the trial sequential boundaries could not be drawn. Accordingly, we lack evidence to conclude equivalence of nitrous oxide and carbon dioxide pneumoperitoneum.

Trial sequential analysis of nitrous oxide pneumoperitoneum versus carbon dioxide pneumoperitoneum for cardiopulmonary complications. Analysis was performed with an event rate of 2.9% (Pc) in the control group, a risk ratio reduction of 20%, alpha 5%, beta 20%, and observed diversity 0%. The accrued sample size was so small that the trial sequential boundaries could not be drawn. The cumulative Z‐curve did not cross the naive 5% statistical boundaries (red horizontal lines). The results showed that the observed diversity‐adjusted required information size was 3781 participants, corresponding to 5.4% of the total sample size in the included trials. Accordingly, the meta‐analysis did not support or refute an intervention effect as data were too few.

Trial sequential analysis of nitrous oxide pneumoperitoneum versus carbon dioxide pneumoperitoneum for surgical morbidity. Analysis was performed with an event rate of 2.8% (Pc) in the control group, a risk ratio reduction of 20%, alpha 5%, beta 20%, and observed diversity 0%. The cumulative Z‐curve did not cross the naive 5% statistical boundaries (red horizontal lines). The results showed that the observed diversity adjusted required information size was 3919 participants, corresponding to 5.3% of the total sample size in the included trials. Accordingly, the meta‐analysis did not support or refute an intervention effect as data were too few.
TSA of helium pneumoperitoneum versus carbon dioxide pneumoperitoneum for cardiopulmonary complications is shown in Figure 6. The TSA graph showed that the cumulative Z‐curve did not cross the naive 5% statistical boundaries. The analysis showed a diversity‐adjusted required information size of 3651 participants (the number of participants needed to reach firm evidence of an intervention effect of 20% RRR). The number of participants included corresponded to only a small fraction (3.5%) of the diversity‐adjusted required information size; therefore, the trial sequential boundaries could not be drawn. TSA of helium pneumoperitoneum versus carbon dioxide pneumoperitoneum for serious adverse events is shown in Figure 7. The TSA graph showed that the cumulative Z‐curve did not cross the naive 5% statistical boundaries. The analysis showed a diversity‐adjusted required information size of 4793 participants (the number of participants needed to reach firm evidence of an intervention effect of 20% RRR). The number of participants included corresponded to only 2.7% of the diversity‐adjusted required information size; therefore, the trial sequential boundaries could not be drawn. Accordingly, we lack evidence to conclude equivalence of helium and carbon dioxide pneumoperitoneum.

Trial sequential analysis of helium pneumoperitoneum versus carbon dioxide pneumoperitoneum for cardiopulmonary complications. Analysis was performed with an event rate of 3.0% (Pc) in the control group, a risk ratio reduction of 20%, alpha 5%, beta 20%, and observed diversity 0%. The cumulative Z‐curve did not cross the naive 5% statistical boundaries (red horizontal lines). The results showed that the observed diversity adjusted required information size was 3651 participants, corresponding to 3.5% of the total sample size in the included trials. Accordingly, the meta‐analysis did not support or refute an intervention effect as data were too few.

Trial sequential analysis of helium pneumoperitoneum versus carbon dioxide pneumoperitoneum for serious adverse events. Analysis was performed with an event rate of 2.3% (Pc) in the control group, a risk ratio reduction of 20%, alpha 5%, beta 20%, and observed diversity 0%. The cumulative Z‐curve did not cross the naive 5% statistical boundaries (red horizontal lines). The results showed that the observed diversity adjusted required information size was 4793 participants, corresponding to 2.7% of the total sample size in the included trials. Accordingly, the meta‐analysis did not support or refute an intervention effect as data were too few.
Discussion
Summary of main results
Nitrous oxide pneumoperitoneum versus carbon dioxide pneumoperitoneum
Four studies with 260 participants contributed data to the primary outcomes of this review. The evidence is very uncertain about the effects of nitrous oxide pneumoperitoneum compared to carbon dioxide pneumoperitoneum on any of the primary outcomes, such as cardiopulmonary complications or surgical morbidity. There were no serious adverse events or deaths related to the use of nitrous oxide or carbon dioxide pneumoperitoneum. Three trials showed lower pain scores (a difference of about 1 cm on a VAS scale of 1 cm to 10 cm with lower numbers indicating less pain) in nitrous oxide pneumoperitoneum at various time points on the first postoperative day. However, we do not consider 1 cm on a VAS scale to be clinically significant as this difference is less than the minimum important clinical difference (Katz 2015; Parker 2013; Todd 1996). The benefits for nitrous oxide pneumoperitoneum were lower analgesia requirements, but the evidence was very uncertain.
The safety of nitrous oxide pneumoperitoneum is another major concern for patients, laparoscopic surgeons, and healthcare funders. Exposure to nitrous oxide may be harmful to laparoscopic surgeons because nitrous oxide has an anaesthetic effect. This review included four trials with 132 participants undergoing nitrous oxide pneumoperitoneum. Although none of the trials reported any serious adverse events in the nitrous oxide group, they did not have the statistical power to establish the safety of nitrous oxide pneumoperitoneum. The TSA showed an information size of more than 3700 participants is needed to reach firm evidence for primary outcomes. As this review included only four trials with 260 participants for this comparison, there is lack of evidence to support or refute the effectiveness or safety of nitrous oxide pneumoperitoneum compared with carbon dioxide pneumoperitoneum.
Helium pneumoperitoneum versus carbon dioxide pneumoperitoneum
Four studies with 144 people contributed data to the primary outcomes of this review. The evidence is very uncertain about the effects of helium pneumoperitoneum compared to carbon dioxide pneumoperitoneum on any of the primary outcomes, such as cardiopulmonary complications or surgical morbidity. There were three serious adverse events related to helium pneumoperitoneum. Although there were fewer cardiopulmonary changes in the helium pneumoperitoneum group, this did not translate into any clinical benefit.
In contrast to other gases used for creating a pneumoperitoneum, helium is an inert gas that has extremely low reactivity with other substances. The safety of helium pneumoperitoneum is also an important outcome for patients, laparoscopic surgeons, and healthcare funders. This review included four trials with 69 participants undergoing helium pneumoperitoneum. Three of the four trials reported a total of three serious adverse events related to pneumoperitoneum in the helium group. The adverse events were various subcutaneous emphysemas (e.g. scrotal, facial, and cervical emphysema). Although the meta‐analysis did not demonstrate any evidence of differences in pneumoperitoneum‐related serious adverse events between helium and carbon dioxide pneumoperitoneum, it also did not have the statistical power to establish the safety of helium pneumoperitoneum. The TSA showed an information size of more than 3600 participants needed to reach firm evidence for primary outcomes. As this review included only four trials with 144 participants in this comparison, there is a lack of evidence to support or refute the effectiveness or safety of helium pneumoperitoneum compared with carbon dioxide pneumoperitoneum.
Room air pneumoperitoneum versus carbon dioxide pneumoperitoneum
One study with 146 people contributed data to the primary outcomes of this review. There were no cardiopulmonary complications or serious adverse events related to either room air or carbon dioxide pneumoperitoneum. The study showed lower pain scores (a difference of about 1 cm on a VAS scale of 1 cm to 10 cm with lower numbers indicating less pain) in room air pneumoperitoneum during the first postoperative day. However, we do not consider 1 cm on a VAS scale to be clinically significant as this difference is less than the minimum important clinical difference (Katz 2015; Parker 2013; Todd 1996). The benefits for room air pneumoperitoneum were fewer total hospital costs (about USD 380) but the evidence is very uncertain.
Hospital cost is an important outcome for healthcare funders. The trial showed decreased total hospital costs in the room air group; this could be due to a shorter duration of hospitalisation in the room air group (2.5 days) than in the carbon dioxide group (3.2 days), less analgesia requirements in the room air group, or both. In addition, the cost of carbon dioxide cylinders and carbon dioxide insufflators may be higher than the cost of room air insufflators.
The safety of room air pneumoperitoneum is another major concern for patients, laparoscopic surgeons, and healthcare funders because of the risk of air embolism (Ikechebelu 2005). This review included one trial with 70 participants undergoing room air pneumoperitoneum. Although the trial did not report any serious adverse events in the room air group, it did not have the statistical power to establish the safety of room air pneumoperitoneum. Accordingly, there is a lack evidence to support or refute the effectiveness or safety of room air pneumoperitoneum compared with carbon dioxide pneumoperitoneum.
Overall completeness and applicability of evidence
Only 24 participants in two trials (12.6%) had high anaesthetic risk (ASA III or IV) (O'Boyle 2002; Tsereteli 2002). Of the remaining trials, three trials excluded participants with ASA III or IV (Aitola 1998; Bongard 1993; Sietses 2002); and five trials did not report ASA status (Asgari 2011; Gu 2015; Lipscomb 1993; Naude 1996; Neuhaus 2001). Thus, the results of this review are primarily applicable in ASA I or ASA II patients undergoing various laparoscopic abdominal surgeries under general anaesthesia. However, this review involved only 583 participants and lacked sufficient power to support or refute any gas for establishing pneumoperitoneum. Thus, further trials on this topic are urgently needed.
Quality of the evidence
Overall, the certainty of the evidence was very low for the outcomes for which we could assess the certainty of evidence (summary of findings Table 1; summary of findings Table 2; summary of findings Table 3). The major reason for downgrading the certainty of evidence was serious or very serious risk of bias in the trials. One of the major sources of bias was lack of blinding. Lack of blinding might introduce detection bias and performance bias. Blinding of healthcare providers, participants, and outcome assessors can be achieved with appropriate study design. Another major source of bias was incomplete outcome data. A total of 13/269 (4.8%) participants were excluded from the analysis for various reasons in five trials (Aitola 1998; Bongard 1993; Naude 1996; O'Boyle 2002; Tsereteli 2002). Only two trials analysed the data on an intention‐to‐treat basis (Bongard 1993; O'Boyle 2002). In addition, sensitivity analysis by changing between worst‐case scenario analysis and best‐case scenario analysis for missing data revealed that some results changed in the helium pneumoperitoneum versus carbon dioxide pneumoperitoneum comparison.
We further downgraded the certainty of evidence due to indirectness of the outcomes in trials (e.g. surrogate outcomes such as cardiopulmonary changes). We also downgraded the certainty of evidence due to imprecision; the review included only 583 participants in total, with the actual number included in specific outcomes being less than this since not all studies reported all the outcomes in each comparison; the number of participants included corresponded to only a small fraction of the required information size in all TSAs. There was also clinical heterogeneity among the included trials. As a result of these factors, the CIs for the majority of outcomes were wide, indicating that the estimates of effects obtained were based on an insufficient amount of information, reducing the certainty of the evidence. The trials included under each comparison were too few to assess publication bias.
Potential biases in the review process
There were several unavoidable potential biases of note in the review process.
First, this review involved only 583 participants and therefore, was too underpowered to detect differences reliably for the rarer outcomes, such as serious adverse events (e.g. gas embolism, abdominal explosion).
Second, when we contacted the original investigators to request further information, there were no replies.
Third, we were unable to explore publication bias because of the few trials included in each comparison.
Agreements and disagreements with other studies or reviews
The systematic review (a clinical practice guideline) by Neudecker and colleagues (Neudecker 2002) included two trials (Aitola 1998; Bongard 1993), which were included in this review. Neudecker and colleagues concluded that using insufflation gases such as nitrous oxide, helium, or argon appears to reduce pain, but they did not feel that this justified a general recommendation for the use of these gases. Our review agrees with their conclusion on nitrous oxide pneumoperitoneum, that the effectiveness or safety (or both) of nitrous oxide pneumoperitoneum have not been established. However, our review did not observe a reduction in pain with helium pneumoperitoneum. Furthermore, the authors of two trials comparing nitrous oxide pneumoperitoneum with carbon dioxide pneumoperitoneum recommended nitrous oxide pneumoperitoneum for prolonged laparoscopic surgery in people with chronic cardiopulmonary diseases (Aitola 1998; Tsereteli 2002); our review did not agree with the conclusions of the trial authors. Due to the lack of evidence, we conclude that further assessment for ASA III or ASA IV patients is required.

Study flow diagram.

Risk of bias graph: review authors' judgements about each risk of bias item presented as percentages across all included studies.

Risk of bias summary: review authors' judgements about each risk of bias item for each included study.

Trial sequential analysis of nitrous oxide pneumoperitoneum versus carbon dioxide pneumoperitoneum for cardiopulmonary complications. Analysis was performed with an event rate of 2.9% (Pc) in the control group, a risk ratio reduction of 20%, alpha 5%, beta 20%, and observed diversity 0%. The accrued sample size was so small that the trial sequential boundaries could not be drawn. The cumulative Z‐curve did not cross the naive 5% statistical boundaries (red horizontal lines). The results showed that the observed diversity‐adjusted required information size was 3781 participants, corresponding to 5.4% of the total sample size in the included trials. Accordingly, the meta‐analysis did not support or refute an intervention effect as data were too few.

Trial sequential analysis of nitrous oxide pneumoperitoneum versus carbon dioxide pneumoperitoneum for surgical morbidity. Analysis was performed with an event rate of 2.8% (Pc) in the control group, a risk ratio reduction of 20%, alpha 5%, beta 20%, and observed diversity 0%. The cumulative Z‐curve did not cross the naive 5% statistical boundaries (red horizontal lines). The results showed that the observed diversity adjusted required information size was 3919 participants, corresponding to 5.3% of the total sample size in the included trials. Accordingly, the meta‐analysis did not support or refute an intervention effect as data were too few.
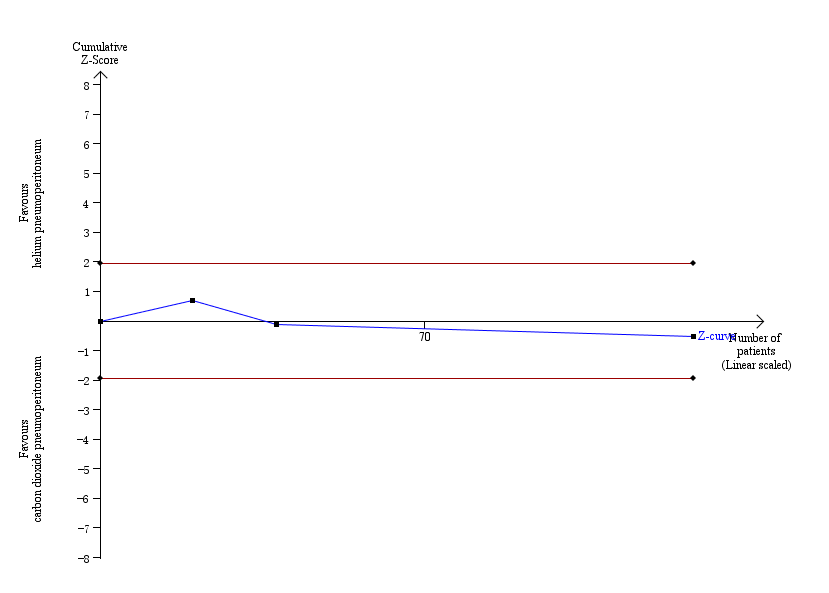
Trial sequential analysis of helium pneumoperitoneum versus carbon dioxide pneumoperitoneum for cardiopulmonary complications. Analysis was performed with an event rate of 3.0% (Pc) in the control group, a risk ratio reduction of 20%, alpha 5%, beta 20%, and observed diversity 0%. The cumulative Z‐curve did not cross the naive 5% statistical boundaries (red horizontal lines). The results showed that the observed diversity adjusted required information size was 3651 participants, corresponding to 3.5% of the total sample size in the included trials. Accordingly, the meta‐analysis did not support or refute an intervention effect as data were too few.

Trial sequential analysis of helium pneumoperitoneum versus carbon dioxide pneumoperitoneum for serious adverse events. Analysis was performed with an event rate of 2.3% (Pc) in the control group, a risk ratio reduction of 20%, alpha 5%, beta 20%, and observed diversity 0%. The cumulative Z‐curve did not cross the naive 5% statistical boundaries (red horizontal lines). The results showed that the observed diversity adjusted required information size was 4793 participants, corresponding to 2.7% of the total sample size in the included trials. Accordingly, the meta‐analysis did not support or refute an intervention effect as data were too few.

Comparison 1: Nitrous oxide pneumoperitoneum versus carbon dioxide pneumoperitoneum, Outcome 1: Cardiopulmonary complications

Comparison 1: Nitrous oxide pneumoperitoneum versus carbon dioxide pneumoperitoneum, Outcome 2: Procedure‐related general complications

Comparison 1: Nitrous oxide pneumoperitoneum versus carbon dioxide pneumoperitoneum, Outcome 3: Pain scores (cm) (first postoperative day)

Comparison 1: Nitrous oxide pneumoperitoneum versus carbon dioxide pneumoperitoneum, Outcome 4: Analgesia requirements

Comparison 1: Nitrous oxide pneumoperitoneum versus carbon dioxide pneumoperitoneum, Outcome 5: Cardiopulmonary changes

Comparison 1: Nitrous oxide pneumoperitoneum versus carbon dioxide pneumoperitoneum, Outcome 6: Cardiopulmonary parameters

Comparison 2: Helium pneumoperitoneum versus carbon dioxide pneumoperitoneum, Outcome 1: Cardiopulmonary complications

Comparison 2: Helium pneumoperitoneum versus carbon dioxide pneumoperitoneum, Outcome 2: Pneumoperitoneum‐related serious adverse events

Comparison 2: Helium pneumoperitoneum versus carbon dioxide pneumoperitoneum, Outcome 3: Pain scores (cm) (first postoperative day)

Comparison 2: Helium pneumoperitoneum versus carbon dioxide pneumoperitoneum, Outcome 4: Analgesia requirements (morphine mg)

Comparison 2: Helium pneumoperitoneum versus carbon dioxide pneumoperitoneum, Outcome 5: Number of participants requiring analgesia

Comparison 2: Helium pneumoperitoneum versus carbon dioxide pneumoperitoneum, Outcome 6: Cardiopulmonary parameters

Comparison 3: Room air pneumoperitoneum versus carbon dioxide pneumoperitoneum, Outcome 1: Cardiopulmonary complications

Comparison 3: Room air pneumoperitoneum versus carbon dioxide pneumoperitoneum, Outcome 2: Pneumoperitoneum‐related serious adverse events

Comparison 3: Room air pneumoperitoneum versus carbon dioxide pneumoperitoneum, Outcome 3: Pain scores (cm) (first postoperative day)

Comparison 3: Room air pneumoperitoneum versus carbon dioxide pneumoperitoneum, Outcome 4: Hospital costs (CNY)

Comparison 3: Room air pneumoperitoneum versus carbon dioxide pneumoperitoneum, Outcome 5: Cardiopulmonary parameters

Comparison 4: Nitrous oxide pneumoperitoneum versus carbon dioxide pneumoperitoneum (worst/best‐case scenario analysis for missing data), Outcome 1: Cardiopulmonary complications

Comparison 4: Nitrous oxide pneumoperitoneum versus carbon dioxide pneumoperitoneum (worst/best‐case scenario analysis for missing data), Outcome 2: Procedure‐related general complications

Comparison 4: Nitrous oxide pneumoperitoneum versus carbon dioxide pneumoperitoneum (worst/best‐case scenario analysis for missing data), Outcome 3: Pneumoperitoneum‐related serious adverse events

Comparison 4: Nitrous oxide pneumoperitoneum versus carbon dioxide pneumoperitoneum (worst/best‐case scenario analysis for missing data), Outcome 4: Mortality

Comparison 5: Nitrous oxide pneumoperitoneum versus carbon dioxide pneumoperitoneum (best/worst‐case scenario analysis for missing data, Outcome 1: Cardiopulmonary complications

Comparison 5: Nitrous oxide pneumoperitoneum versus carbon dioxide pneumoperitoneum (best/worst‐case scenario analysis for missing data, Outcome 2: Procedure‐related general complications

Comparison 5: Nitrous oxide pneumoperitoneum versus carbon dioxide pneumoperitoneum (best/worst‐case scenario analysis for missing data, Outcome 3: Pneumoperitoneum‐related serious adverse events

Comparison 5: Nitrous oxide pneumoperitoneum versus carbon dioxide pneumoperitoneum (best/worst‐case scenario analysis for missing data, Outcome 4: Mortality

Comparison 6: Helium pneumoperitoneum versus carbon dioxide pneumoperitoneum (worst/best‐case scenario analysis for missing data), Outcome 1: Cardiopulmonary complications

Comparison 6: Helium pneumoperitoneum versus carbon dioxide pneumoperitoneum (worst/best‐case scenario analysis for missing data), Outcome 2: Procedure‐related general complications

Comparison 6: Helium pneumoperitoneum versus carbon dioxide pneumoperitoneum (worst/best‐case scenario analysis for missing data), Outcome 3: Pneumoperitoneum‐related serious adverse events

Comparison 6: Helium pneumoperitoneum versus carbon dioxide pneumoperitoneum (worst/best‐case scenario analysis for missing data), Outcome 4: Mortality

Comparison 7: Helium pneumoperitoneum versus carbon dioxide pneumoperitoneum (best/worst‐case scenario analysis for missing data, Outcome 1: Cardiopulmonary complications

Comparison 7: Helium pneumoperitoneum versus carbon dioxide pneumoperitoneum (best/worst‐case scenario analysis for missing data, Outcome 2: Procedure‐related general complications

Comparison 7: Helium pneumoperitoneum versus carbon dioxide pneumoperitoneum (best/worst‐case scenario analysis for missing data, Outcome 3: Pneumoperitoneum‐related serious adverse events

Comparison 7: Helium pneumoperitoneum versus carbon dioxide pneumoperitoneum (best/worst‐case scenario analysis for missing data, Outcome 4: Mortality
| Nitrous oxide versus carbon dioxide for establishing pneumoperitoneum during laparoscopic abdominal surgery | ||||||
| Patient or population: people undergoing laparoscopic general abdominal or gynaecological pelvic surgery under general anaesthesia Setting: secondary and tertiary care Intervention: nitrous oxide pneumoperitoneum Comparison: carbon dioxide pneumoperitoneum | ||||||
| Outcomes | Anticipated absolute effects* (95% CI) | Relative effect | No of participants | Certainty of the evidence | Comments | |
|---|---|---|---|---|---|---|
| Risk with carbon dioxide pneumoperitoneum | Risk with nitrous oxide pneumoperitoneum | |||||
| Cardiopulmonary complications Follow‐up: 0–1 month | 29 per 1000 | 79 per 1000 | Peto OR 2.62 | 204 | ⊕⊝⊝⊝ | — |
| Procedure‐related general complications (surgical morbidity) Follow‐up: 0–1 month | 19 per 1000 | 19 per 1000 | Peto OR 1.01 | 207 | ⊕⊝⊝⊝ | — |
| Pneumoperitoneum‐related serious adverse events Follow‐up: 0–1 month | See comment | See comment | Not estimable | 260 | ⊕⊝⊝⊝ | None of the studies reported any pneumoperitoneum‐related serious adverse events. |
| Mortality Follow‐up: 0–1 month | See comment | See comment | Not estimable | 260 | ⊕⊝⊝⊝ | None of the studies reported any deaths. |
| Quality of life | None of the studies reported quality of life. | |||||
| Pain scores (first postoperative day) VAS, lower score indicates less pain. Follow‐up: 1 day | The mean pain scores (first postoperative day) in the carbon dioxide pneumoperitoneum group was 3.50 cm | The mean pain scores (first postoperative day) in the nitrous oxide pneumoperitoneum group was | MD −0.90 (−2.10 to 0.30) | 64 | ⊕⊝⊝⊝ | 2 studies reported lower pain scores in the nitrous oxide group compared with the carbon dioxide group at various time points on the first postoperative day (Aitola 1998; Tsereteli 2002). Neither trial reported the standard deviation for pain scores on the VAS scale. The other study reported no difference in the pain scores using McGill pain questionnaire between groups (Lipscomb 1993). We were unable to use the data from these 3 studies in meta‐analysis for the reasons given above. |
| Analgesia requirements Follow‐up: 1 week | The mean analgesia requirement in the carbon dioxide pneumoperitoneum was 54.4 mg of oxycodone and 2.0 tablets/24 hours of ibuprofen | The mean analgesia requirement in the nitrous oxide pneumoperitoneum was 0.65 standard deviations (moderate effect) lower | SMD −0.65 (moderate effect) | 257 | ⊕⊝⊝⊝ | — |
| Costs | None of the studies reported costs. | |||||
| *The basis for the assumed risk is the mean comparison group proportion in the studies. The risk in the intervention group (and its 95% confidence interval) is based on the assumed risk in the comparison group and the relative effect of the intervention (and its 95% CI). CI: confidence interval; MD: mean difference; OR: odds ratio; RR: risk ratio; SMD: standardised mean difference; VAS: visual analogue scale. | ||||||
| GRADE Working Group grades of evidence | ||||||
| aDowngraded two levels for very serious risk of bias: all included studies with unclear risk of bias for random sequence generation and allocation concealment; one study with high risk of bias for blinding of participants and personnel. | ||||||
| Helium versus carbon dioxide for establishing pneumoperitoneum during laparoscopic abdominal surgery | ||||||
| Patient or population: people undergoing laparoscopic general abdominal or gynaecological pelvic surgery under general anaesthesia Setting: secondary and tertiary care Intervention: helium pneumoperitoneum Comparison: carbon dioxide pneumoperitoneum | ||||||
| Outcomes | Anticipated absolute effects* (95% CI) | Relative effect | No of participants | Certainty of the evidence | Comments | |
|---|---|---|---|---|---|---|
| Risk with carbon dioxide pneumoperitoneum | Risk with helium pneumoperitoneum | |||||
| Cardiopulmonary complications Follow‐up: 0–1 month | 30 per 1000 | 44 per 1000 | Peto OR 1.66 | 128 | ⊕⊝⊝⊝ | — |
| Procedure‐related general complications (surgical morbidity) Follow‐up: 0–1 month | See comment | See comment | Not estimable | 177 | ⊕⊝⊝⊝ Very lowb,c | None of the studies reported any significant procedure‐related general complications in either group. |
| Pneumoperitoneum‐related serious adverse events Follow‐up: 0–1 month | 0 per 1000 | 44 per 1000 | Peto OR 8.28 | 128 | ⊕⊝⊝⊝ | — |
| Mortality Follow‐up: 0–1 month | See comment | See comment | Not estimable | 177 | ⊕⊝⊝⊝ | None of the studies reported any deaths. |
| Quality of life | None of the studies reported quality of life. | |||||
| Pain scores (first postoperative day) Visual analogue scale, lower score indicates less pain. Follow‐up: 1 day | The mean pain scores (first postoperative day) in the carbon dioxide pneumoperitoneum was 3.01 cm | The mean pain scores (first postoperative day) in the helium pneumoperitoneum was | MD 0.49 (−0.28 to 1.26) | 108 | ⊕⊕⊝⊝ | — |
| Analgesia requirements (morphine mg) Follow‐up: 2 days | The mean analgesia requirements (morphine) in the carbon dioxide pneumoperitoneum was 36.6 mg | The mean analgesia requirements (morphine) in the helium pneumoperitoneum was 12 mg higher | MD 12.00 (4.44 to 19.56) | 90 | ⊕⊝⊝⊝ | 2 trials (108 participants) reported analgesia requirements (Neuhaus 2001; O'Boyle 2002). Results of O'Boyle 2002 presented here. The other study including 18 participants reported no difference in the number of participants requiring analgesia (morphine) between the groups (Neuhaus 2001). |
| Costs | None of the studies reported costs. | |||||
| *The basis for the assumed risk is the mean comparison group proportion in the studies. The risk in the intervention group (and its 95% confidence interval) is based on the assumed risk in the comparison group and the relative effect of the intervention (and its 95% CI). CI: confidence interval; MD: mean difference; OR: odds ratio; RR: risk ratio. | ||||||
| GRADE Working Group grades of evidence | ||||||
| aDowngraded two levels for very serious risk of bias: two studies with unclear risk of bias for random sequence generation and allocation concealment; one study with high risk of bias for blinding of participants and personnel and baseline imbalance. | ||||||
| Room air versus carbon dioxide for establishing pneumoperitoneum during laparoscopic abdominal surgery | ||||||
| Patient or population: people undergoing laparoscopic general abdominal or gynaecological pelvic surgery under general anaesthesia Setting: secondary and tertiary care Intervention: room air pneumoperitoneum Comparison: carbon dioxide pneumoperitoneum | ||||||
| Outcomes | Anticipated absolute effects* (95% CI) | Relative effect | No of participants | Certainty of the evidence | Comments | |
|---|---|---|---|---|---|---|
| Risk with carbon dioxide pneumoperitoneum | Risk with room air pneumoperitoneum | |||||
| Cardiopulmonary complications Follow‐up: 1 month | See comment | See comment | Not estimable | 146 | ⊕⊝⊝⊝ | Trial did not report any cardiopulmonary complications. |
| Procedure‐related general complications (surgical morbidity) | The study did not report procedure‐related general complications. | |||||
| Pneumoperitoneum‐related serious adverse events Follow‐up: 1 month | See comment | See comment | Not estimable | 146 | ⊕⊝⊝⊝ | Trial did not report any pneumoperitoneum‐related serious adverse events. |
| Mortality Follow‐up: 1 month | See comment | See comment | Not estimable | 146 | ⊕⊝⊝⊝ | The study did not report any deaths. |
| Quality of life | The study did not report quality of life. | |||||
| Pain scores (first postoperative day) Visual analogue scale, lower score indicates less pain. Follow‐up: 1 day | The mean pain scores (first postoperative day) in the carbon dioxide pneumoperitoneum was 2.60 cm | The mean pain scores (first postoperative day) in the room air pneumoperitoneum was | MD −0.80 (−1.15 to −0.45) | 146 | ⊕⊝⊝⊝ | — |
| Analgesia requirements | The study did not report analgesia requirements. | |||||
| Hospital costs (CNY) Follow‐up: 1 month | The mean hospital costs in the carbon dioxide pneumoperitoneum was CNY 12,012.00 | The mean hospital costs in the room air pneumoperitoneum was CNY 2667.00 lower | MD −2667.00 (−3275.68 to −2058.32) | 146 | ⊕⊝⊝⊝ | — |
| *The basis for the assumed risk is the mean comparison group proportion in the studies. The risk in the intervention group (and its 95% confidence interval) is based on the assumed risk in the comparison group and the relative effect of the intervention (and its 95% CI). CI: confidence interval; CNY: Chinese Yuan; MD: mean difference. | ||||||
| GRADE Working Group grades of evidence | ||||||
| aDowngraded two levels for very serious risk of bias: unclear risk of bias for random sequence generation, allocation concealment, blinding of participants and personnel, and blinding of outcome assessment; high risk of bias for selective reporting. | ||||||
| Changing between worst‐case scenario analysis and best‐case scenario analysis for missing data | |||
|---|---|---|---|
| Outcomes | Risk ratio (95% CI) | ||
| Main analysis | Worst/best‐case | Best/worst‐case | |
| Nitrous oxide vs carbon dioxide | |||
| Cardiopulmonary complications | Peto OR 2.62 (0.78 to 8.85) | Peto OR 3.16 (1.03 to 9.69) | Peto OR 1.66 (0.54 to 5.12) |
| Procedure‐related general complications (surgical morbidity) | Peto OR 1.01 (0.14 to 7.31) | Peto OR 2.01 (0.40 to 10.20) | Peto OR 0.51 (0.10 to 2.60) |
| Pneumoperitoneum‐related serious adverse events | No events | Peto OR 7.46 (0.47 to 119.30) | Peto OR 0.14 (0.01 to 2.19) |
| Mortality | No events | Peto OR 7.46 (0.47 to 119.30) | Peto OR 0.14 (0.01 to 2.19) |
| Helium vs carbon dioxide | |||
| Cardiopulmonary complications | Peto OR 1.66 (0.28 to 9.72) | Peto OR 4.66 (1.43 to 15.15) | Peto OR 1.66 (0.28 to 9.72) |
| Procedure‐related general complications/surgical morbidity | No events | Peto OR 8.89 (1.94 to 40.64) | Peto OR 0.12 (0.01 to 2.07) |
| Pneumoperitoneum‐related serious adverse events | Peto OR 8.28 (0.86 to 80.03) | Peto OR 9.19 (2.56 to 33.01) | Peto OR 8.28 (0.86 to 80.03) |
| Mortality | No events | Peto OR 8.89 (1.94 to 40.64) | Peto OR 0.12 (0.01 to 2.07) |
| CI: confidence interval; Peto OR: Peto odds ratio, which was calculated for rare events (mortality, serious adverse events). | |||
| Outcome or subgroup title | No. of studies | No. of participants | Statistical method | Effect size |
| 1.1 Cardiopulmonary complications Show forest plot | 3 | 204 | Peto Odds Ratio (Peto, Fixed, 95% CI) | 2.62 [0.78, 8.85] |
| 1.2 Procedure‐related general complications Show forest plot | 3 | 207 | Peto Odds Ratio (Peto, Fixed, 95% CI) | 1.01 [0.14, 7.31] |
| 1.3 Pain scores (cm) (first postoperative day) Show forest plot | 1 | 64 | Mean Difference (IV, Fixed, 95% CI) | ‐0.90 [‐2.10, 0.30] |
| 1.4 Analgesia requirements Show forest plot | 4 | 257 | Std. Mean Difference (IV, Fixed, 95% CI) | ‐0.65 [‐0.90, ‐0.39] |
| 1.4.1 Oxycodone (mg) | 2 | 140 | Std. Mean Difference (IV, Fixed, 95% CI) | ‐1.07 [‐1.42, ‐0.71] |
| 1.4.2 Ibuprofen (tablets/24 hours) | 1 | 53 | Std. Mean Difference (IV, Fixed, 95% CI) | ‐0.16 [‐0.70, 0.38] |
| 1.4.3 Analgesia use (mg/kg) | 1 | 64 | Std. Mean Difference (IV, Fixed, 95% CI) | ‐0.25 [‐0.74, 0.24] |
| 1.5 Cardiopulmonary changes Show forest plot | 1 | Mean Difference (IV, Fixed, 95% CI) | Subtotals only | |
| 1.5.1 Heart rate change (beats/minute) | 1 | 100 | Mean Difference (IV, Fixed, 95% CI) | ‐0.60 [‐4.13, 2.93] |
| 1.5.2 Mean arterial pressure change (mmHg) | 1 | 100 | Mean Difference (IV, Fixed, 95% CI) | ‐3.80 [‐7.90, 0.30] |
| 1.5.3 Oxygen saturation change (%) | 1 | 100 | Mean Difference (IV, Fixed, 95% CI) | 0.00 [‐0.39, 0.39] |
| 1.5.4 Peak airway pressure change (cmH2O) | 1 | 100 | Mean Difference (IV, Fixed, 95% CI) | ‐0.30 [‐2.17, 1.57] |
| 1.6 Cardiopulmonary parameters Show forest plot | 1 | Mean Difference (IV, Fixed, 95% CI) | Subtotals only | |
| 1.6.1 Heart rate (beats/minute) (start) | 1 | 64 | Mean Difference (IV, Fixed, 95% CI) | ‐0.50 [‐7.55, 6.55] |
| 1.6.2 Heart rate (beats/minute) (end) | 1 | 64 | Mean Difference (IV, Fixed, 95% CI) | 1.30 [‐7.14, 9.74] |
| 1.6.3 Mean arterial pressure (mmHg) (start) | 1 | 64 | Mean Difference (IV, Fixed, 95% CI) | ‐5.50 [‐13.46, 2.46] |
| 1.6.4 Mean arterial pressure (mmHg) (end) | 1 | 64 | Mean Difference (IV, Fixed, 95% CI) | 2.90 [‐4.24, 10.04] |
| 1.6.5 Oxygen saturation (%) (start) | 1 | 64 | Mean Difference (IV, Fixed, 95% CI) | 0.10 [‐0.60, 0.80] |
| 1.6.6 Oxygen saturation (%) (end) | 1 | 64 | Mean Difference (IV, Fixed, 95% CI) | ‐0.30 [‐1.52, 0.92] |
| Outcome or subgroup title | No. of studies | No. of participants | Statistical method | Effect size |
| 2.1 Cardiopulmonary complications Show forest plot | 3 | 128 | Peto Odds Ratio (Peto, Fixed, 95% CI) | 1.66 [0.28, 9.72] |
| 2.2 Pneumoperitoneum‐related serious adverse events Show forest plot | 3 | 128 | Peto Odds Ratio (Peto, Fixed, 95% CI) | 8.28 [0.86, 80.03] |
| 2.3 Pain scores (cm) (first postoperative day) Show forest plot | 2 | 108 | Mean Difference (IV, Fixed, 95% CI) | 0.49 [‐0.28, 1.26] |
| 2.4 Analgesia requirements (morphine mg) Show forest plot | 1 | 90 | Mean Difference (IV, Fixed, 95% CI) | 12.00 [4.44, 19.56] |
| 2.5 Number of participants requiring analgesia Show forest plot | 1 | 18 | Risk Ratio (M‐H, Fixed, 95% CI) | 0.42 [0.17, 1.04] |
| 2.6 Cardiopulmonary parameters Show forest plot | 3 | Mean Difference (IV, Fixed, 95% CI) | Subtotals only | |
| 2.6.1 Blood pH (start) | 2 | 34 | Mean Difference (IV, Fixed, 95% CI) | 0.01 [‐0.01, 0.04] |
| 2.6.2 Blood pH (middle) | 3 | 52 | Mean Difference (IV, Fixed, 95% CI) | 0.08 [0.06, 0.11] |
| 2.6.3 Blood pH (end) | 2 | 34 | Mean Difference (IV, Fixed, 95% CI) | 0.10 [0.06, 0.14] |
| 2.6.4 Partial pressure of carbon dioxide (mmHg) (start) | 2 | 34 | Mean Difference (IV, Fixed, 95% CI) | 0.31 [‐1.79, 2.40] |
| 2.6.5 Partial pressure of carbon dioxide (mmHg) (middle) | 3 | 52 | Mean Difference (IV, Fixed, 95% CI) | ‐0.84 [‐3.70, 2.02] |
| 2.6.6 Partial pressure of carbon dioxide (mmHg) (end) | 2 | 34 | Mean Difference (IV, Fixed, 95% CI) | ‐12.78 [‐16.78, ‐8.77] |
| Outcome or subgroup title | No. of studies | No. of participants | Statistical method | Effect size |
| 3.1 Cardiopulmonary complications Show forest plot | 1 | 146 | Risk Ratio (M‐H, Fixed, 95% CI) | Not estimable |
| 3.2 Pneumoperitoneum‐related serious adverse events Show forest plot | 1 | 146 | Peto Odds Ratio (Peto, Fixed, 95% CI) | Not estimable |
| 3.3 Pain scores (cm) (first postoperative day) Show forest plot | 1 | 146 | Mean Difference (IV, Fixed, 95% CI) | ‐0.80 [‐1.15, ‐0.45] |
| 3.4 Hospital costs (CNY) Show forest plot | 1 | 146 | Mean Difference (IV, Fixed, 95% CI) | ‐2667.00 [‐3275.68, ‐2058.32] |
| 3.5 Cardiopulmonary parameters Show forest plot | 1 | Mean Difference (IV, Fixed, 95% CI) | Subtotals only | |
| 3.5.1 Heart rate (beats/minute) (start) | 1 | 146 | Mean Difference (IV, Fixed, 95% CI) | ‐0.10 [‐3.11, 2.91] |
| 3.5.2 Heart rate (beats/minute) (middle) | 1 | 146 | Mean Difference (IV, Fixed, 95% CI) | ‐7.30 [‐9.78, ‐4.82] |
| 3.5.3 Heart rate (beats/minute) (end) | 1 | 146 | Mean Difference (IV, Fixed, 95% CI) | ‐8.70 [‐11.72, ‐5.68] |
| 3.5.4 Blood systolic pressure (mmHg) (start) | 1 | 146 | Mean Difference (IV, Fixed, 95% CI) | ‐1.00 [‐5.12, 3.12] |
| 3.5.5 Blood systolic pressure (mmHg) (middle) | 1 | 146 | Mean Difference (IV, Fixed, 95% CI) | 2.80 [‐0.44, 6.04] |
| 3.5.6 Blood systolic pressure (mmHg) (end) | 1 | 146 | Mean Difference (IV, Fixed, 95% CI) | ‐2.00 [‐5.42, 1.42] |
| 3.5.7 Partial pressure of carbon dioxide (mmHg) (start) | 1 | 146 | Mean Difference (IV, Fixed, 95% CI) | ‐0.20 [‐1.39, 0.99] |
| 3.5.8 Partial pressure of carbon dioxide (mmHg) (middle) | 1 | 146 | Mean Difference (IV, Fixed, 95% CI) | ‐0.30 [‐1.37, 0.77] |
| 3.5.9 Partial pressure of carbon dioxide (mmHg) (end) | 1 | 146 | Mean Difference (IV, Fixed, 95% CI) | 0.10 [‐1.43, 1.63] |
| Outcome or subgroup title | No. of studies | No. of participants | Statistical method | Effect size |
| 4.1 Cardiopulmonary complications Show forest plot | 3 | 207 | Peto Odds Ratio (Peto, Fixed, 95% CI) | 3.16 [1.03, 9.69] |
| 4.2 Procedure‐related general complications Show forest plot | 3 | 207 | Peto Odds Ratio (Peto, Fixed, 95% CI) | 2.01 [0.40, 10.20] |
| 4.3 Pneumoperitoneum‐related serious adverse events Show forest plot | 3 | 207 | Peto Odds Ratio (Peto, Fixed, 95% CI) | 7.46 [0.47, 119.30] |
| 4.4 Mortality Show forest plot | 3 | 207 | Peto Odds Ratio (Peto, Fixed, 95% CI) | 7.46 [0.47, 119.30] |
| Outcome or subgroup title | No. of studies | No. of participants | Statistical method | Effect size |
| 5.1 Cardiopulmonary complications Show forest plot | 3 | 207 | Peto Odds Ratio (Peto, Fixed, 95% CI) | 1.66 [0.54, 5.12] |
| 5.2 Procedure‐related general complications Show forest plot | 3 | 207 | Peto Odds Ratio (Peto, Fixed, 95% CI) | 0.51 [0.10, 2.60] |
| 5.3 Pneumoperitoneum‐related serious adverse events Show forest plot | 3 | 207 | Peto Odds Ratio (Peto, Fixed, 95% CI) | 0.14 [0.01, 2.19] |
| 5.4 Mortality Show forest plot | 3 | 207 | Peto Odds Ratio (Peto, Fixed, 95% CI) | 0.14 [0.01, 2.19] |
| Outcome or subgroup title | No. of studies | No. of participants | Statistical method | Effect size |
| 6.1 Cardiopulmonary complications Show forest plot | 3 | 128 | Peto Odds Ratio (Peto, Fixed, 95% CI) | 4.66 [1.43, 15.15] |
| 6.2 Procedure‐related general complications Show forest plot | 4 | 144 | Peto Odds Ratio (Peto, Fixed, 95% CI) | 8.89 [1.94, 40.64] |
| 6.3 Pneumoperitoneum‐related serious adverse events Show forest plot | 3 | 128 | Peto Odds Ratio (Peto, Fixed, 95% CI) | 9.19 [2.56, 33.01] |
| 6.4 Mortality Show forest plot | 4 | 144 | Peto Odds Ratio (Peto, Fixed, 95% CI) | 8.89 [1.94, 40.64] |
| Outcome or subgroup title | No. of studies | No. of participants | Statistical method | Effect size |
| 7.1 Cardiopulmonary complications Show forest plot | 3 | 128 | Peto Odds Ratio (Peto, Fixed, 95% CI) | 1.66 [0.28, 9.72] |
| 7.2 Procedure‐related general complications Show forest plot | 4 | 144 | Peto Odds Ratio (Peto, Fixed, 95% CI) | 0.12 [0.01, 2.07] |
| 7.3 Pneumoperitoneum‐related serious adverse events Show forest plot | 3 | 128 | Peto Odds Ratio (Peto, Fixed, 95% CI) | 8.28 [0.86, 80.03] |
| 7.4 Mortality Show forest plot | 4 | 144 | Peto Odds Ratio (Peto, Fixed, 95% CI) | 0.12 [0.01, 2.07] |