Gases para el establecimiento del neumoperitoneo durante la cirugía abdominal laparoscópica
Referencias
Referencias de los estudios incluidos en esta revisión
Referencias de los estudios excluidos de esta revisión
Referencias de los estudios en espera de evaluación
Referencias adicionales
Referencias de otras versiones publicadas de esta revisión
Characteristics of studies
Characteristics of included studies [ordered by study ID]
| Study characteristics | ||
| Methods | Randomised controlled trial | |
| Participants | Country: Finland, single‐centre Study dates: not reported Number of operating surgeons: 2 Number randomised: 40 Postrandomisation dropout: 1 (2.5%) Intention‐to‐treat‐analysis: no Description of sample size calculation: no Mean age: 48.0 years Females: 32 (66.7%) ASA I or II: 40 (100%) ASA III or IV: 0 (0%) Inclusion criteria:
Exclusion criteria:
| |
| Interventions | Pneumoperitoneum: 12–14 mmHg Participants randomly assigned to 2 groups Group 1: nitrous oxide pneumoperitoneum (n = 20) Group 2: carbon dioxide pneumoperitoneum (n = 20) | |
| Outcomes | Complications, adverse events, cardiopulmonary changes (heart rate, blood pressure, blood pH, partial pressure of carbon dioxide, and mean end‐tidal carbon dioxide), pain, analgesia requirements, operative time, and total gas volume. | |
| Notes | 1 postrandomisation dropout in nitrous oxide group. Reason for postrandomisation dropout: 1 participant developed a painful port‐site rectus sheath haematoma. Funding source: not reported. Declarations of interest: not reported. | |
| Risk of bias | ||
| Bias | Authors' judgement | Support for judgement |
| Random sequence generation (selection bias) | Unclear risk | Comment: no information provided. |
| Allocation concealment (selection bias) | Unclear risk | Comment: no information provided. |
| Blinding of participants and personnel (performance bias) | Unclear risk | Quote: "Neither the nurse nor the patient knew which gas was used". Comment: it was not clear that the surgeon and other clinical staff were adequately blinded. |
| Blinding of outcome assessment (detection bias) | Low risk | Quote: "The same anesthesiologist, who was blinded to the pneumoperitoneum gas used, took care of the anaesthesia of all the patients. The evaluation of postoperative pain was made on a double‐blind, controlled basis by a trained nurse". |
| Incomplete outcome data (attrition bias) | Low risk | Quote: "The only patient who developed a postoperative complication was excluded from the pain analysis". Comment: 1 postrandomisation dropout may be too low an attrition rate to represent a source of bias. |
| Selective reporting (reporting bias) | Low risk | Comment: the study protocol was not available, but it was clear that the published reports included all expected outcomes (e.g. cardiopulmonary complications, surgical morbidity, serious adverse events). |
| Other bias | Low risk | Comment: study appeared free of other sources of bias. |
| Study characteristics | ||
| Methods | Randomised controlled trial | |
| Participants | Country: Iran, single‐centre Study dates: not reported Number of operating surgeons: not reported Number randomised: 64 Postrandomisation dropout: 0 (0%) Intention‐to‐treat‐analysis: yes Description of sample size calculation: no Mean age: 40 years Females: 57 (89.1%) ASA I or II: 64 (100%) ASA III or IV: 0 (0%) Inclusion criteria:
Exclusion criteria:
| |
| Interventions | Pneumoperitoneum: 12–14 mmHg Participants randomly assigned to 2 groups Group 1: nitrous oxide pneumoperitoneum (n = 32) Group 2: carbon dioxide pneumoperitoneum (n = 32) | |
| Outcomes | Complications, cardiopulmonary changes (heart rate, blood pressure, oxygen saturation, mean end‐tidal carbon dioxide, and mean minute ventilation), pain, analgesia requirements | |
| Notes | Funding source: not reported Declarations of interest: not reported | |
| Risk of bias | ||
| Bias | Authors' judgement | Support for judgement |
| Random sequence generation (selection bias) | Unclear risk | Comment: no information provided. |
| Allocation concealment (selection bias) | Unclear risk | Comment: no information provided. |
| Blinding of participants and personnel (performance bias) | Low risk | Quote: "Masking: Quadruple (Participant, Care Provider, Investigator, Outcomes Assessor)". |
| Blinding of outcome assessment (detection bias) | Low risk | Quote: "Masking: Quadruple (Participant, Care Provider, Investigator, Outcomes Assessor)". |
| Incomplete outcome data (attrition bias) | Low risk | Comment: no postrandomisation dropouts. |
| Selective reporting (reporting bias) | Low risk | Comment: a study registration was available for 1 study (Asgari 2011), but this registration was done retrospectively after trial conduct. It was clear that the published reports included all expected outcomes (e.g. cardiopulmonary complications, surgical morbidity, serious adverse events). |
| Other bias | Low risk | Comment: study appeared free of other sources of bias. |
| Study characteristics | ||
| Methods | Randomised controlled trial | |
| Participants | Country: USA, single‐centre Study dates: August 1991 to October 1991 Number of operating surgeons: not reported Number randomised: 20 Postrandomisation dropout: 1 (5%) Intention‐to‐treat‐analysis: yes Description of sample size calculation: yes Mean age: 34.4 years Females: 17 (85%) ASA I or II: 20 (100%) ASA III or IV: 0 (0%) Inclusion criteria:
Exclusion criteria:
| |
| Interventions | Pneumoperitoneum: 15 mmHg Participants randomly assigned to 2 groups Group 1: helium pneumoperitoneum (n = 10) Group 2: carbon dioxide pneumoperitoneum (n = 10) | |
| Outcomes | Complications, adverse events, cardiopulmonary changes (heart rate, blood pressure, blood pH, partial pressure of carbon dioxide, bicarbonate concentration, and end‐tidal carbon dioxide), and duration of pneumoperitoneum | |
| Notes | 1 postrandomisation dropout in helium group. Reason for postrandomisation dropout: conversion to open surgery. Funding source: not reported. Declarations of interest: not reported. | |
| Risk of bias | ||
| Bias | Authors' judgement | Support for judgement |
| Random sequence generation (selection bias) | Low risk | Quote: "A computer‐generated code was used to randomise the insufflating agent used". |
| Allocation concealment (selection bias) | Unclear risk | Comment: no information provided. |
| Blinding of participants and personnel (performance bias) | High risk | Quote: "The operating surgeon and anesthesiologist were informed of the randomisation result preoperatively". |
| Blinding of outcome assessment (detection bias) | Unclear risk | Comment: no information provided. |
| Incomplete outcome data (attrition bias) | Low risk | Quote: "Patient No. 9 (helium) was converted to an open procedure when the intraoperative cholangiogram showed multiple stones in a dilated common bile duct. The end values for this patient were recorded immediately before celiotomy incision at 110 minutes". |
| Selective reporting (reporting bias) | Low risk | Comment: the study protocol was not available, but it was clear that the published reports included all expected outcomes (e.g. cardiopulmonary complications, surgical morbidity, serious adverse events). |
| Other bias | High risk | Quote: "The average weight of the helium group was significantly greater (P<0.02)". |
| Study characteristics | ||
| Methods | Randomised controlled trial | |
| Participants | Country: China, single‐centre Study dates: February 2012 to February 2014 Number of operating surgeons: not reported Number randomised: 146 Postrandomisation dropout: 0 (0%) Intention‐to‐treat‐analysis: yes Description of sample size calculation: no Mean age: 44.7 years Females: 83 (56.8%) ASA I or II: not reported ASA III or IV: not reported Inclusion criteria:
Exclusion criteria:
| |
| Interventions | Pneumoperitoneum: 12–14 mmHg Participants randomly assigned to 2 groups Group 1: room air pneumoperitoneum (n = 70) Group 2: carbon dioxide pneumoperitoneum (n = 76) | |
| Outcomes | Complications, adverse events, cardiopulmonary changes (heart rate, blood pressure, partial pressure of carbon dioxide), pain, hospital costs, and duration of hospitalisation | |
| Notes | Funding source: not reported. Declarations of interest: not reported. | |
| Risk of bias | ||
| Bias | Authors' judgement | Support for judgement |
| Random sequence generation (selection bias) | Unclear risk | Comment: no information provided. |
| Allocation concealment (selection bias) | Unclear risk | Comment: no information provided. |
| Blinding of participants and personnel (performance bias) | Unclear risk | Comment: no information provided. |
| Blinding of outcome assessment (detection bias) | Unclear risk | Comment: no information provided. |
| Incomplete outcome data (attrition bias) | Low risk | Comment: no postrandomisation dropouts. |
| Selective reporting (reporting bias) | High risk | Comment: the study protocol was not available, and the study report failed to include results for a key outcome (surgical morbidity) that would be expected to have been reported for such a study. |
| Other bias | Low risk | Comment: study appeared free of other sources of bias. |
| Study characteristics | ||
| Methods | Randomised controlled trial | |
| Participants | Country: USA, single‐centre Study dates: not reported Number of operating surgeons: 0 Number randomised: 53 Postrandomisation dropout: 0 (0%) Intention‐to‐treat‐analysis: yes Description of sample size calculation: no Mean age: 27.6 years Females: 53 (100%) ASA I or II: not reported ASA III or IV: not reported Inclusion criteria:
Exclusion criteria: not reported | |
| Interventions | Pneumoperitoneum: pressure not reported Participants randomly assigned to 2 groups Group 1: nitrous oxide pneumoperitoneum (n = 29) Group 2: carbon dioxide pneumoperitoneum (n = 24) | |
| Outcomes | Pain, analgesia requirements, and operative time | |
| Notes | Funding source: not reported. Declarations of interest: not reported. | |
| Risk of bias | ||
| Bias | Authors' judgement | Support for judgement |
| Random sequence generation (selection bias) | Low risk | Quote: "Patients were prospectively randomised using computer‐generated numbers". |
| Allocation concealment (selection bias) | Unclear risk | Comment: no information provided. |
| Blinding of participants and personnel (performance bias) | Unclear risk | Comment: no information provided. |
| Blinding of outcome assessment (detection bias) | Low risk | Quote: "All data collection was by individuals blinded to the type of gas used". |
| Incomplete outcome data (attrition bias) | Low risk | Comment: no postrandomisation dropouts. |
| Selective reporting (reporting bias) | High risk | Comment: the study protocol was not available, and the study report failed to include results for key outcomes (e.g. cardiopulmonary complications, surgical morbidity) that would be expected to have been reported for such a study. |
| Other bias | High risk | Quote: "There was a significant difference between the two groups in weight (P=0.004)". |
| Study characteristics | ||
| Methods | Randomised controlled trial | |
| Participants | Country: USA, single‐centre Study dates: not reported Number of operating surgeons: not reported Number randomised: 16 Postrandomisation dropout: 2 (12.5%) Intention‐to‐treat‐analysis: no Description of sample size calculation: no Mean age: 34.5 years Females: 16 (100%) ASA I or II: not reported ASA III or IV: not reported Inclusion criteria:
Exclusion criteria: not reported | |
| Interventions | Pneumoperitoneum: pressure not reported Participants randomly assigned to 2 groups Group 1: helium pneumoperitoneum (n = 8) Group 2: carbon dioxide pneumoperitoneum (n = 8) | |
| Outcomes | Cardiopulmonary changes (blood pH and partial pressure of carbon dioxide), operative time, and hormone changes (e.g. adrenaline, noradrenaline, cortisol) | |
| Notes | 2 postrandomisation dropouts in carbon dioxide group. Reason for postrandomisation dropout: not reported. Main outcome in trial was hormone changes. Outcomes of interest for this review were blood pH and partial pressure of carbon dioxide. Funding source: not reported. Declarations of interest: not reported. | |
| Risk of bias | ||
| Bias | Authors' judgement | Support for judgement |
| Random sequence generation (selection bias) | Unclear risk | Comment: no information provided. |
| Allocation concealment (selection bias) | Unclear risk | Comment: no information provided. |
| Blinding of participants and personnel (performance bias) | High risk | Quote: "The operating surgeon and the anesthesiologist were notified of the patient's assignment". |
| Blinding of outcome assessment (detection bias) | Unclear risk | Comment: no information provided. |
| Incomplete outcome data (attrition bias) | High risk | Comment: 2 postrandomisation dropouts. |
| Selective reporting (reporting bias) | High risk | Comment: the study protocol was not available, and the study report failed to include results for key outcomes (e.g. cardiopulmonary complications, serious adverse events) that would be expected to have been reported for such a study. |
| Other bias | High risk | Quote: "There was a significant age difference between the helium and CO2 group". |
| Study characteristics | ||
| Methods | Randomised controlled trial | |
| Participants | Country: Australia, single‐centre Study dates: not reported Number of operating surgeons: not reported Number randomised: 18 Postrandomisation dropout: 0 Intention‐to‐treat‐analysis: yes Description of sample size calculation: no Mean age: not reported Females: not reported ASA I or II: not reported ASA III or IV: not reported
Exclusion criteria:
| |
| Interventions | Pneumoperitoneum: pressure not reported Participants randomly assigned to 2 groups Group 1: helium pneumoperitoneum (n = 8) Group 2: carbon dioxide pneumoperitoneum (n = 10) | |
| Outcomes | Complications, adverse events, cardiopulmonary changes (blood pH and partial pressure of carbon dioxide), pain, analgesia requirements, operative time, and total gas volume | |
| Notes | Funding source: Olympus/Gastroenterological Society of Australia Postgraduate Scholarship in Endoscopic Research and Royal Adelaide Hospital Special Purposes Fund. Declarations of interest: not reported. | |
| Risk of bias | ||
| Bias | Authors' judgement | Support for judgement |
| Random sequence generation (selection bias) | Unclear risk | Comment: no information provided. |
| Allocation concealment (selection bias) | Low risk | Quote: "All participants gave informed consent, and were randomised in the operating theatre by opening one of 20 previously sealed opaque envelopes". |
| Blinding of participants and personnel (performance bias) | Unclear risk | Quote: "The patients and the investigators were all blinded to which insufflation gas had been used". Comment: it was not clear that the surgeon and other clinical staff were adequately blinded. |
| Blinding of outcome assessment (detection bias) | Low risk | Quote: "The patients and the investigators were all blinded to which insufflation gas had been used". |
| Incomplete outcome data (attrition bias) | Low risk | Comment: no postrandomisation dropouts. |
| Selective reporting (reporting bias) | Low risk | Comment: the study protocol was not available, but it was clear that the published reports included all expected outcomes (e.g. cardiopulmonary complications, surgical morbidity, serious adverse events). |
| Other bias | Low risk | Comment: study appeared free of other sources of bias. |
| Study characteristics | ||
| Methods | Randomised controlled trial | |
| Participants | Country: Australia, single‐centre Study dates: January 2000 to November 2000 Number of operating surgeons: not reported Number randomised: 90 (to groups 1 and 2) Postrandomisation dropout: 6 (6.7%) Intention‐to‐treat‐analysis: yes Description of sample size calculation: no Mean age: 49.0 years Females: 58 (64%) ASA I or II: 82 (91.1%) ASA III or IV: 8 (8.9%) Inclusion criteria:
Exclusion criteria:
| |
| Interventions | Pneumoperitoneum: pressure not reported Participants (n = 173) were randomly assigned to 4 groups Group 1: helium pneumoperitoneum (n = 43) Group 2: carbon dioxide pneumoperitoneum (n = 47) Group 3: carbon dioxide pneumoperitoneum with saline lavage (n = 43). We planned to combine groups to create a single pair‐wise comparison for trials with multiple intervention groups. However, the saline lavage may decrease postoperative pain after laparoscopic surgery, which may be a confounding factor when we assess the effect of helium pneumoperitoneum on postoperative pain scores. Thus, this group was not included in the review. Group 4: helium pneumoperitoneum with saline lavage (n = 40). This group was also not included in the review. | |
| Outcomes | Complications, adverse events, pain, analgesia requirements, operative time, hospital stay, and total gas volume | |
| Notes | There were 6 postrandomisation dropouts in the helium alone group. Reason for postrandomisation dropout: conversion to open surgery. Funding source: National Health and Medical Research Council of Australia. Declarations of interest: not reported. | |
| Risk of bias | ||
| Bias | Authors' judgement | Support for judgement |
| Random sequence generation (selection bias) | Unclear risk | Comment: no information provided. |
| Allocation concealment (selection bias) | Low risk | Quote: "Randomisation was performed by opening a sealed envelope for each patient in the operating theatre". |
| Blinding of participants and personnel (performance bias) | Unclear risk | Quote: "The operating surgeon was not aware of the gas chosen until anaesthesia had commenced, and patients were blinded to the gas used throughout the study". Comment: it was not clear that the surgeon and other clinical staff were adequately blinded. |
| Blinding of outcome assessment (detection bias) | Low risk | Quote: "Post‐operative assessment was also performed by a blinded investigator". |
| Incomplete outcome data (attrition bias) | Low risk | Quote: "All data analysis was performed on an intention‐to‐treat basis. Where conversion to an open procedure was necessary, patients remained in their original allocated group". |
| Selective reporting (reporting bias) | Low risk | Comment: the study protocol was not available, but it was clear that the published reports included all expected outcomes (e.g. cardiopulmonary complications, surgical morbidity, serious adverse events). |
| Other bias | Low risk | Comment: study appeared free of other sources of bias. |
| Study characteristics | ||
| Methods | Randomised controlled trial | |
| Participants | Country: Netherlands, single‐centre Study dates: not reported Number of operating surgeons: not reported Number randomised: 33 Postrandomisation dropout: 6 (18.2%) Intention‐to‐treat‐analysis: no Description of sample size calculation: no Mean age: 49.0 years Females: not reported ASA I or II: 33 (100%) ASA III or IV: 0 (0%) Inclusion criteria:
Exclusion criteria:
| |
| Interventions | Pneumoperitoneum: pressure not reported Participants (n = 33) were randomly 3 groups Group 1: helium pneumoperitoneum (n = not reported) Group 2: carbon dioxide pneumoperitoneum (n = not reported) Group 3: abdominal wall lift (n = not reported) | |
| Outcomes | Peripheral white blood cell, C‐reactive protein, interleukin‐6, and HLA‐DR (human leukocyte antigen – antigen D related) expression | |
| Notes | Reason for 6 postrandomisation dropouts: conversion to open surgery (n = 2, 1 from the helium group and 1 from the carbon dioxide group) and conversion from abdominal wall lift to carbon dioxide pneumoperitoneum (n = 4). All 6 excluded from the protocol. Funding source: not reported. Declarations of interest: not reported. | |
| Risk of bias | ||
| Bias | Authors' judgement | Support for judgement |
| Random sequence generation (selection bias) | Unclear risk | Comment: no information provided. |
| Allocation concealment (selection bias) | Unclear risk | Comment: no information provided. |
| Blinding of participants and personnel (performance bias) | Unclear risk | Comment: no information provided. |
| Blinding of outcome assessment (detection bias) | Unclear risk | Comment: no information provided. |
| Incomplete outcome data (attrition bias) | High risk | Comment: 6 postrandomisation dropouts. |
| Selective reporting (reporting bias) | High risk | Comment: the study protocol was not available, and the study report failed to include results for key outcomes (e.g. cardiopulmonary complications, serious adverse events) that would be expected to have been reported for such a study. |
| Other bias | Low risk | Comment: study appeared free of other sources of bias. |
| Study characteristics | ||
| Methods | Randomised controlled trial | |
| Participants | Country: USA, single‐centre Study dates: March 1999 to November 2000 Number of operating surgeons: 1 Number randomised: 103 Postrandomisation dropout: 3 (2.8%) Intention‐to‐treat‐analysis: no Description of sample size calculation: yes Mean age: 47.5 years Females: 35 (45.5%) ASA I or II: 84 (84%) ASA III or IV: 16 (16%) Inclusion criteria:
Exclusion criteria: not reported | |
| Interventions | Pneumoperitoneum: pressure not reported Participants randomly assigned to 2 group Group 1: nitrous oxide pneumoperitoneum (n = 51) Group 2: carbon dioxide pneumoperitoneum (n = 52) | |
| Outcomes | Complications, adverse events, cardiopulmonary changes (heart rate, blood pressure, oxygen saturation, peak inspiratory pressure, mean end‐tidal carbon dioxide, and mean minute ventilation), pain, analgesia requirements, operative time, duration of pneumoperitoneum, and hospital stay | |
| Notes | 2 postrandomisation dropouts in carbon dioxide group. Reason for postrandomisation dropout: 1 participant was converted from laparoscopic surgery to laparotomy, and 1 participant demonstrated an oesophageal leak, which required thoracotomy to repair and extended hospital stay to 15 days. 1 postrandomisation dropout in nitrous oxide group. Reason for postrandomisation dropout: participant had repeat laparoscopy on postoperative day 1 because of herniation of fundoplication. Funding source: not reported. Declarations of interest: not reported. | |
| Risk of bias | ||
| Bias | Authors' judgement | Support for judgement |
| Random sequence generation (selection bias) | Unclear risk | Comment: no information provided. |
| Allocation concealment (selection bias) | Unclear risk | Quote: "Patients were randomised after induction of general anaesthesia by an envelope drawing". Comment: not reported if the envelope was sealed. |
| Blinding of participants and personnel (performance bias) | High risk | Quote: "Patients and anesthesiologists were blinded to the pneumoperitoneum gas used until the patient was discharged from the hospital. Although an attempt was made to blind the surgeon to the insufflating gas, differences in insufflation apparatus made this difficult". Comment: the surgeon was not blinded adequately. |
| Blinding of outcome assessment (detection bias) | Low risk | Quote: "Pain assessor (ZT) was blinded to the pneumoperitoneum gas used until the patient was discharged from the hospital". |
| Incomplete outcome data (attrition bias) | Low risk | Comment: 3 postrandomisation dropouts may be too low an attrition rate to represent a source of bias. |
| Selective reporting (reporting bias) | Low risk | Comment: the study protocol was not available, but it was clear that the published reports included all expected outcomes (e.g. cardiopulmonary complications, surgical morbidity, serious adverse events). |
| Other bias | Low risk | Comment: study appears free of other sources of bias. |
ASA: American Society of Anesthesiologists; n: number of participants.
Characteristics of excluded studies [ordered by study ID]
| Study | Reason for exclusion |
| Non‐randomised study. | |
| Laparoscopic pelvic surgery performed by gynaecology surgeons under local anaesthesia. | |
| Non‐randomised study. | |
| Diagnostic laparoscopy performed under local anaesthesia. | |
| Non‐randomised study. | |
| Non‐randomised study. | |
| Non‐randomised study. | |
| Non‐randomised study. | |
| Diagnostic laparoscopy performed under local anaesthesia. | |
| Non‐randomised study. |
Characteristics of studies awaiting classification [ordered by study ID]
| Methods | Randomised controlled trial? |
| Participants | Country: Sweden Number of participants: 30 Mean age: not reported Females: not reported ASA I or II: not reported ASA III or IV: not reported Inclusion criteria: elective laparoscopic cholecystectomy Exclusion criteria: not reported |
| Interventions | Pneumoperitoneum: pressure not reported Participants randomly assigned to 2 groups Group 1: helium pneumoperitoneum (n = 15) Group 2: carbon dioxide pneumoperitoneum (n = 15) |
| Outcomes | Peritoneal pH, peritoneal fibrinolytic components, and peritoneal fibrinolytic capacity |
| Notes | Conference abstract. It needs further classification because we could not judge whether it is a true randomised controlled trial from the abstract. |
Data and analyses
| Outcome or subgroup title | No. of studies | No. of participants | Statistical method | Effect size |
| 1.1 Cardiopulmonary complications Show forest plot | 3 | 204 | Peto Odds Ratio (Peto, Fixed, 95% CI) | 2.62 [0.78, 8.85] |
| Analysis 1.1  Comparison 1: Nitrous oxide pneumoperitoneum versus carbon dioxide pneumoperitoneum, Outcome 1: Cardiopulmonary complications | ||||
| 1.2 Procedure‐related general complications Show forest plot | 3 | 207 | Peto Odds Ratio (Peto, Fixed, 95% CI) | 1.01 [0.14, 7.31] |
| Analysis 1.2  Comparison 1: Nitrous oxide pneumoperitoneum versus carbon dioxide pneumoperitoneum, Outcome 2: Procedure‐related general complications | ||||
| 1.3 Pain scores (cm) (first postoperative day) Show forest plot | 1 | 64 | Mean Difference (IV, Fixed, 95% CI) | ‐0.90 [‐2.10, 0.30] |
| Analysis 1.3  Comparison 1: Nitrous oxide pneumoperitoneum versus carbon dioxide pneumoperitoneum, Outcome 3: Pain scores (cm) (first postoperative day) | ||||
| 1.4 Analgesia requirements Show forest plot | 4 | 257 | Std. Mean Difference (IV, Fixed, 95% CI) | ‐0.65 [‐0.90, ‐0.39] |
| Analysis 1.4  Comparison 1: Nitrous oxide pneumoperitoneum versus carbon dioxide pneumoperitoneum, Outcome 4: Analgesia requirements | ||||
| 1.4.1 Oxycodone (mg) | 2 | 140 | Std. Mean Difference (IV, Fixed, 95% CI) | ‐1.07 [‐1.42, ‐0.71] |
| 1.4.2 Ibuprofen (tablets/24 hours) | 1 | 53 | Std. Mean Difference (IV, Fixed, 95% CI) | ‐0.16 [‐0.70, 0.38] |
| 1.4.3 Analgesia use (mg/kg) | 1 | 64 | Std. Mean Difference (IV, Fixed, 95% CI) | ‐0.25 [‐0.74, 0.24] |
| 1.5 Cardiopulmonary changes Show forest plot | 1 | Mean Difference (IV, Fixed, 95% CI) | Subtotals only | |
| Analysis 1.5  Comparison 1: Nitrous oxide pneumoperitoneum versus carbon dioxide pneumoperitoneum, Outcome 5: Cardiopulmonary changes | ||||
| 1.5.1 Heart rate change (beats/minute) | 1 | 100 | Mean Difference (IV, Fixed, 95% CI) | ‐0.60 [‐4.13, 2.93] |
| 1.5.2 Mean arterial pressure change (mmHg) | 1 | 100 | Mean Difference (IV, Fixed, 95% CI) | ‐3.80 [‐7.90, 0.30] |
| 1.5.3 Oxygen saturation change (%) | 1 | 100 | Mean Difference (IV, Fixed, 95% CI) | 0.00 [‐0.39, 0.39] |
| 1.5.4 Peak airway pressure change (cmH2O) | 1 | 100 | Mean Difference (IV, Fixed, 95% CI) | ‐0.30 [‐2.17, 1.57] |
| 1.6 Cardiopulmonary parameters Show forest plot | 1 | Mean Difference (IV, Fixed, 95% CI) | Subtotals only | |
| Analysis 1.6  Comparison 1: Nitrous oxide pneumoperitoneum versus carbon dioxide pneumoperitoneum, Outcome 6: Cardiopulmonary parameters | ||||
| 1.6.1 Heart rate (beats/minute) (start) | 1 | 64 | Mean Difference (IV, Fixed, 95% CI) | ‐0.50 [‐7.55, 6.55] |
| 1.6.2 Heart rate (beats/minute) (end) | 1 | 64 | Mean Difference (IV, Fixed, 95% CI) | 1.30 [‐7.14, 9.74] |
| 1.6.3 Mean arterial pressure (mmHg) (start) | 1 | 64 | Mean Difference (IV, Fixed, 95% CI) | ‐5.50 [‐13.46, 2.46] |
| 1.6.4 Mean arterial pressure (mmHg) (end) | 1 | 64 | Mean Difference (IV, Fixed, 95% CI) | 2.90 [‐4.24, 10.04] |
| 1.6.5 Oxygen saturation (%) (start) | 1 | 64 | Mean Difference (IV, Fixed, 95% CI) | 0.10 [‐0.60, 0.80] |
| 1.6.6 Oxygen saturation (%) (end) | 1 | 64 | Mean Difference (IV, Fixed, 95% CI) | ‐0.30 [‐1.52, 0.92] |
| Outcome or subgroup title | No. of studies | No. of participants | Statistical method | Effect size |
| 2.1 Cardiopulmonary complications Show forest plot | 3 | 128 | Peto Odds Ratio (Peto, Fixed, 95% CI) | 1.66 [0.28, 9.72] |
| Analysis 2.1  Comparison 2: Helium pneumoperitoneum versus carbon dioxide pneumoperitoneum, Outcome 1: Cardiopulmonary complications | ||||
| 2.2 Pneumoperitoneum‐related serious adverse events Show forest plot | 3 | 128 | Peto Odds Ratio (Peto, Fixed, 95% CI) | 8.28 [0.86, 80.03] |
| Analysis 2.2  Comparison 2: Helium pneumoperitoneum versus carbon dioxide pneumoperitoneum, Outcome 2: Pneumoperitoneum‐related serious adverse events | ||||
| 2.3 Pain scores (cm) (first postoperative day) Show forest plot | 2 | 108 | Mean Difference (IV, Fixed, 95% CI) | 0.49 [‐0.28, 1.26] |
| Analysis 2.3  Comparison 2: Helium pneumoperitoneum versus carbon dioxide pneumoperitoneum, Outcome 3: Pain scores (cm) (first postoperative day) | ||||
| 2.4 Analgesia requirements (morphine mg) Show forest plot | 1 | 90 | Mean Difference (IV, Fixed, 95% CI) | 12.00 [4.44, 19.56] |
| Analysis 2.4  Comparison 2: Helium pneumoperitoneum versus carbon dioxide pneumoperitoneum, Outcome 4: Analgesia requirements (morphine mg) | ||||
| 2.5 Number of participants requiring analgesia Show forest plot | 1 | 18 | Risk Ratio (M‐H, Fixed, 95% CI) | 0.42 [0.17, 1.04] |
| Analysis 2.5  Comparison 2: Helium pneumoperitoneum versus carbon dioxide pneumoperitoneum, Outcome 5: Number of participants requiring analgesia | ||||
| 2.6 Cardiopulmonary parameters Show forest plot | 3 | Mean Difference (IV, Fixed, 95% CI) | Subtotals only | |
| Analysis 2.6  Comparison 2: Helium pneumoperitoneum versus carbon dioxide pneumoperitoneum, Outcome 6: Cardiopulmonary parameters | ||||
| 2.6.1 Blood pH (start) | 2 | 34 | Mean Difference (IV, Fixed, 95% CI) | 0.01 [‐0.01, 0.04] |
| 2.6.2 Blood pH (middle) | 3 | 52 | Mean Difference (IV, Fixed, 95% CI) | 0.08 [0.06, 0.11] |
| 2.6.3 Blood pH (end) | 2 | 34 | Mean Difference (IV, Fixed, 95% CI) | 0.10 [0.06, 0.14] |
| 2.6.4 Partial pressure of carbon dioxide (mmHg) (start) | 2 | 34 | Mean Difference (IV, Fixed, 95% CI) | 0.31 [‐1.79, 2.40] |
| 2.6.5 Partial pressure of carbon dioxide (mmHg) (middle) | 3 | 52 | Mean Difference (IV, Fixed, 95% CI) | ‐0.84 [‐3.70, 2.02] |
| 2.6.6 Partial pressure of carbon dioxide (mmHg) (end) | 2 | 34 | Mean Difference (IV, Fixed, 95% CI) | ‐12.78 [‐16.78, ‐8.77] |
| Outcome or subgroup title | No. of studies | No. of participants | Statistical method | Effect size |
| 3.1 Cardiopulmonary complications Show forest plot | 1 | 146 | Risk Ratio (M‐H, Fixed, 95% CI) | Not estimable |
| Analysis 3.1  Comparison 3: Room air pneumoperitoneum versus carbon dioxide pneumoperitoneum, Outcome 1: Cardiopulmonary complications | ||||
| 3.2 Pneumoperitoneum‐related serious adverse events Show forest plot | 1 | 146 | Peto Odds Ratio (Peto, Fixed, 95% CI) | Not estimable |
| Analysis 3.2  Comparison 3: Room air pneumoperitoneum versus carbon dioxide pneumoperitoneum, Outcome 2: Pneumoperitoneum‐related serious adverse events | ||||
| 3.3 Pain scores (cm) (first postoperative day) Show forest plot | 1 | 146 | Mean Difference (IV, Fixed, 95% CI) | ‐0.80 [‐1.15, ‐0.45] |
| Analysis 3.3  Comparison 3: Room air pneumoperitoneum versus carbon dioxide pneumoperitoneum, Outcome 3: Pain scores (cm) (first postoperative day) | ||||
| 3.4 Hospital costs (CNY) Show forest plot | 1 | 146 | Mean Difference (IV, Fixed, 95% CI) | ‐2667.00 [‐3275.68, ‐2058.32] |
| Analysis 3.4  Comparison 3: Room air pneumoperitoneum versus carbon dioxide pneumoperitoneum, Outcome 4: Hospital costs (CNY) | ||||
| 3.5 Cardiopulmonary parameters Show forest plot | 1 | Mean Difference (IV, Fixed, 95% CI) | Subtotals only | |
| Analysis 3.5  Comparison 3: Room air pneumoperitoneum versus carbon dioxide pneumoperitoneum, Outcome 5: Cardiopulmonary parameters | ||||
| 3.5.1 Heart rate (beats/minute) (start) | 1 | 146 | Mean Difference (IV, Fixed, 95% CI) | ‐0.10 [‐3.11, 2.91] |
| 3.5.2 Heart rate (beats/minute) (middle) | 1 | 146 | Mean Difference (IV, Fixed, 95% CI) | ‐7.30 [‐9.78, ‐4.82] |
| 3.5.3 Heart rate (beats/minute) (end) | 1 | 146 | Mean Difference (IV, Fixed, 95% CI) | ‐8.70 [‐11.72, ‐5.68] |
| 3.5.4 Blood systolic pressure (mmHg) (start) | 1 | 146 | Mean Difference (IV, Fixed, 95% CI) | ‐1.00 [‐5.12, 3.12] |
| 3.5.5 Blood systolic pressure (mmHg) (middle) | 1 | 146 | Mean Difference (IV, Fixed, 95% CI) | 2.80 [‐0.44, 6.04] |
| 3.5.6 Blood systolic pressure (mmHg) (end) | 1 | 146 | Mean Difference (IV, Fixed, 95% CI) | ‐2.00 [‐5.42, 1.42] |
| 3.5.7 Partial pressure of carbon dioxide (mmHg) (start) | 1 | 146 | Mean Difference (IV, Fixed, 95% CI) | ‐0.20 [‐1.39, 0.99] |
| 3.5.8 Partial pressure of carbon dioxide (mmHg) (middle) | 1 | 146 | Mean Difference (IV, Fixed, 95% CI) | ‐0.30 [‐1.37, 0.77] |
| 3.5.9 Partial pressure of carbon dioxide (mmHg) (end) | 1 | 146 | Mean Difference (IV, Fixed, 95% CI) | 0.10 [‐1.43, 1.63] |
| Outcome or subgroup title | No. of studies | No. of participants | Statistical method | Effect size |
| 4.1 Cardiopulmonary complications Show forest plot | 3 | 207 | Peto Odds Ratio (Peto, Fixed, 95% CI) | 3.16 [1.03, 9.69] |
| Analysis 4.1  Comparison 4: Nitrous oxide pneumoperitoneum versus carbon dioxide pneumoperitoneum (worst/best‐case scenario analysis for missing data), Outcome 1: Cardiopulmonary complications | ||||
| 4.2 Procedure‐related general complications Show forest plot | 3 | 207 | Peto Odds Ratio (Peto, Fixed, 95% CI) | 2.01 [0.40, 10.20] |
| Analysis 4.2  Comparison 4: Nitrous oxide pneumoperitoneum versus carbon dioxide pneumoperitoneum (worst/best‐case scenario analysis for missing data), Outcome 2: Procedure‐related general complications | ||||
| 4.3 Pneumoperitoneum‐related serious adverse events Show forest plot | 3 | 207 | Peto Odds Ratio (Peto, Fixed, 95% CI) | 7.46 [0.47, 119.30] |
| Analysis 4.3  Comparison 4: Nitrous oxide pneumoperitoneum versus carbon dioxide pneumoperitoneum (worst/best‐case scenario analysis for missing data), Outcome 3: Pneumoperitoneum‐related serious adverse events | ||||
| 4.4 Mortality Show forest plot | 3 | 207 | Peto Odds Ratio (Peto, Fixed, 95% CI) | 7.46 [0.47, 119.30] |
| Analysis 4.4  Comparison 4: Nitrous oxide pneumoperitoneum versus carbon dioxide pneumoperitoneum (worst/best‐case scenario analysis for missing data), Outcome 4: Mortality | ||||
| Outcome or subgroup title | No. of studies | No. of participants | Statistical method | Effect size |
| 5.1 Cardiopulmonary complications Show forest plot | 3 | 207 | Peto Odds Ratio (Peto, Fixed, 95% CI) | 1.66 [0.54, 5.12] |
| Analysis 5.1  Comparison 5: Nitrous oxide pneumoperitoneum versus carbon dioxide pneumoperitoneum (best/worst‐case scenario analysis for missing data, Outcome 1: Cardiopulmonary complications | ||||
| 5.2 Procedure‐related general complications Show forest plot | 3 | 207 | Peto Odds Ratio (Peto, Fixed, 95% CI) | 0.51 [0.10, 2.60] |
| Analysis 5.2  Comparison 5: Nitrous oxide pneumoperitoneum versus carbon dioxide pneumoperitoneum (best/worst‐case scenario analysis for missing data, Outcome 2: Procedure‐related general complications | ||||
| 5.3 Pneumoperitoneum‐related serious adverse events Show forest plot | 3 | 207 | Peto Odds Ratio (Peto, Fixed, 95% CI) | 0.14 [0.01, 2.19] |
| Analysis 5.3  Comparison 5: Nitrous oxide pneumoperitoneum versus carbon dioxide pneumoperitoneum (best/worst‐case scenario analysis for missing data, Outcome 3: Pneumoperitoneum‐related serious adverse events | ||||
| 5.4 Mortality Show forest plot | 3 | 207 | Peto Odds Ratio (Peto, Fixed, 95% CI) | 0.14 [0.01, 2.19] |
| Analysis 5.4  Comparison 5: Nitrous oxide pneumoperitoneum versus carbon dioxide pneumoperitoneum (best/worst‐case scenario analysis for missing data, Outcome 4: Mortality | ||||
| Outcome or subgroup title | No. of studies | No. of participants | Statistical method | Effect size |
| 6.1 Cardiopulmonary complications Show forest plot | 3 | 128 | Peto Odds Ratio (Peto, Fixed, 95% CI) | 4.66 [1.43, 15.15] |
| Analysis 6.1  Comparison 6: Helium pneumoperitoneum versus carbon dioxide pneumoperitoneum (worst/best‐case scenario analysis for missing data), Outcome 1: Cardiopulmonary complications | ||||
| 6.2 Procedure‐related general complications Show forest plot | 4 | 144 | Peto Odds Ratio (Peto, Fixed, 95% CI) | 8.89 [1.94, 40.64] |
| Analysis 6.2  Comparison 6: Helium pneumoperitoneum versus carbon dioxide pneumoperitoneum (worst/best‐case scenario analysis for missing data), Outcome 2: Procedure‐related general complications | ||||
| 6.3 Pneumoperitoneum‐related serious adverse events Show forest plot | 3 | 128 | Peto Odds Ratio (Peto, Fixed, 95% CI) | 9.19 [2.56, 33.01] |
| Analysis 6.3  Comparison 6: Helium pneumoperitoneum versus carbon dioxide pneumoperitoneum (worst/best‐case scenario analysis for missing data), Outcome 3: Pneumoperitoneum‐related serious adverse events | ||||
| 6.4 Mortality Show forest plot | 4 | 144 | Peto Odds Ratio (Peto, Fixed, 95% CI) | 8.89 [1.94, 40.64] |
| Analysis 6.4  Comparison 6: Helium pneumoperitoneum versus carbon dioxide pneumoperitoneum (worst/best‐case scenario analysis for missing data), Outcome 4: Mortality | ||||
| Outcome or subgroup title | No. of studies | No. of participants | Statistical method | Effect size |
| 7.1 Cardiopulmonary complications Show forest plot | 3 | 128 | Peto Odds Ratio (Peto, Fixed, 95% CI) | 1.66 [0.28, 9.72] |
| Analysis 7.1  Comparison 7: Helium pneumoperitoneum versus carbon dioxide pneumoperitoneum (best/worst‐case scenario analysis for missing data, Outcome 1: Cardiopulmonary complications | ||||
| 7.2 Procedure‐related general complications Show forest plot | 4 | 144 | Peto Odds Ratio (Peto, Fixed, 95% CI) | 0.12 [0.01, 2.07] |
| Analysis 7.2  Comparison 7: Helium pneumoperitoneum versus carbon dioxide pneumoperitoneum (best/worst‐case scenario analysis for missing data, Outcome 2: Procedure‐related general complications | ||||
| 7.3 Pneumoperitoneum‐related serious adverse events Show forest plot | 3 | 128 | Peto Odds Ratio (Peto, Fixed, 95% CI) | 8.28 [0.86, 80.03] |
| Analysis 7.3  Comparison 7: Helium pneumoperitoneum versus carbon dioxide pneumoperitoneum (best/worst‐case scenario analysis for missing data, Outcome 3: Pneumoperitoneum‐related serious adverse events | ||||
| 7.4 Mortality Show forest plot | 4 | 144 | Peto Odds Ratio (Peto, Fixed, 95% CI) | 0.12 [0.01, 2.07] |
| Analysis 7.4  Comparison 7: Helium pneumoperitoneum versus carbon dioxide pneumoperitoneum (best/worst‐case scenario analysis for missing data, Outcome 4: Mortality | ||||

Study flow diagram.

Risk of bias graph: review authors' judgements about each risk of bias item presented as percentages across all included studies.

Risk of bias summary: review authors' judgements about each risk of bias item for each included study.

Trial sequential analysis of nitrous oxide pneumoperitoneum versus carbon dioxide pneumoperitoneum for cardiopulmonary complications. Analysis was performed with an event rate of 2.9% (Pc) in the control group, a risk ratio reduction of 20%, alpha 5%, beta 20%, and observed diversity 0%. The accrued sample size was so small that the trial sequential boundaries could not be drawn. The cumulative Z‐curve did not cross the naive 5% statistical boundaries (red horizontal lines). The results showed that the observed diversity‐adjusted required information size was 3781 participants, corresponding to 5.4% of the total sample size in the included trials. Accordingly, the meta‐analysis did not support or refute an intervention effect as data were too few.

Trial sequential analysis of nitrous oxide pneumoperitoneum versus carbon dioxide pneumoperitoneum for surgical morbidity. Analysis was performed with an event rate of 2.8% (Pc) in the control group, a risk ratio reduction of 20%, alpha 5%, beta 20%, and observed diversity 0%. The cumulative Z‐curve did not cross the naive 5% statistical boundaries (red horizontal lines). The results showed that the observed diversity adjusted required information size was 3919 participants, corresponding to 5.3% of the total sample size in the included trials. Accordingly, the meta‐analysis did not support or refute an intervention effect as data were too few.
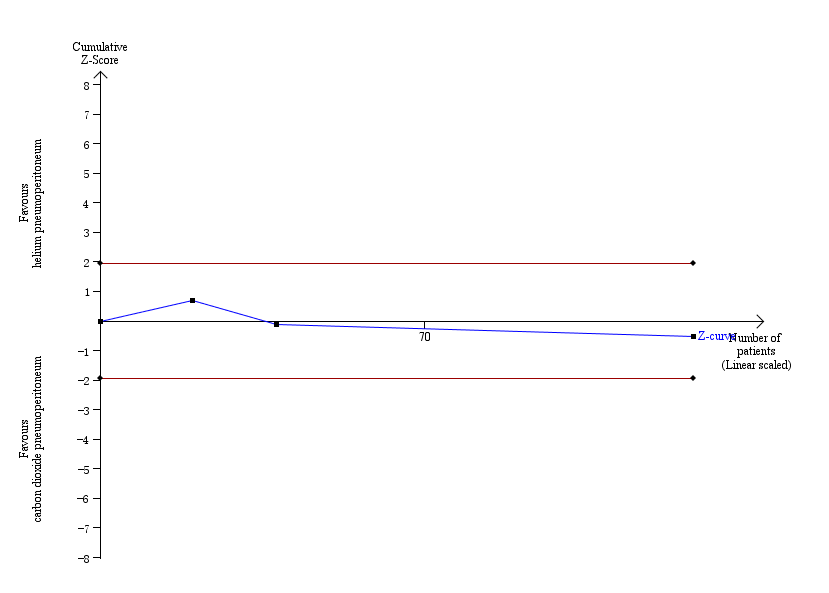
Trial sequential analysis of helium pneumoperitoneum versus carbon dioxide pneumoperitoneum for cardiopulmonary complications. Analysis was performed with an event rate of 3.0% (Pc) in the control group, a risk ratio reduction of 20%, alpha 5%, beta 20%, and observed diversity 0%. The cumulative Z‐curve did not cross the naive 5% statistical boundaries (red horizontal lines). The results showed that the observed diversity adjusted required information size was 3651 participants, corresponding to 3.5% of the total sample size in the included trials. Accordingly, the meta‐analysis did not support or refute an intervention effect as data were too few.

Trial sequential analysis of helium pneumoperitoneum versus carbon dioxide pneumoperitoneum for serious adverse events. Analysis was performed with an event rate of 2.3% (Pc) in the control group, a risk ratio reduction of 20%, alpha 5%, beta 20%, and observed diversity 0%. The cumulative Z‐curve did not cross the naive 5% statistical boundaries (red horizontal lines). The results showed that the observed diversity adjusted required information size was 4793 participants, corresponding to 2.7% of the total sample size in the included trials. Accordingly, the meta‐analysis did not support or refute an intervention effect as data were too few.

Comparison 1: Nitrous oxide pneumoperitoneum versus carbon dioxide pneumoperitoneum, Outcome 1: Cardiopulmonary complications

Comparison 1: Nitrous oxide pneumoperitoneum versus carbon dioxide pneumoperitoneum, Outcome 2: Procedure‐related general complications

Comparison 1: Nitrous oxide pneumoperitoneum versus carbon dioxide pneumoperitoneum, Outcome 3: Pain scores (cm) (first postoperative day)

Comparison 1: Nitrous oxide pneumoperitoneum versus carbon dioxide pneumoperitoneum, Outcome 4: Analgesia requirements

Comparison 1: Nitrous oxide pneumoperitoneum versus carbon dioxide pneumoperitoneum, Outcome 5: Cardiopulmonary changes

Comparison 1: Nitrous oxide pneumoperitoneum versus carbon dioxide pneumoperitoneum, Outcome 6: Cardiopulmonary parameters

Comparison 2: Helium pneumoperitoneum versus carbon dioxide pneumoperitoneum, Outcome 1: Cardiopulmonary complications

Comparison 2: Helium pneumoperitoneum versus carbon dioxide pneumoperitoneum, Outcome 2: Pneumoperitoneum‐related serious adverse events

Comparison 2: Helium pneumoperitoneum versus carbon dioxide pneumoperitoneum, Outcome 3: Pain scores (cm) (first postoperative day)

Comparison 2: Helium pneumoperitoneum versus carbon dioxide pneumoperitoneum, Outcome 4: Analgesia requirements (morphine mg)

Comparison 2: Helium pneumoperitoneum versus carbon dioxide pneumoperitoneum, Outcome 5: Number of participants requiring analgesia

Comparison 2: Helium pneumoperitoneum versus carbon dioxide pneumoperitoneum, Outcome 6: Cardiopulmonary parameters

Comparison 3: Room air pneumoperitoneum versus carbon dioxide pneumoperitoneum, Outcome 1: Cardiopulmonary complications

Comparison 3: Room air pneumoperitoneum versus carbon dioxide pneumoperitoneum, Outcome 2: Pneumoperitoneum‐related serious adverse events

Comparison 3: Room air pneumoperitoneum versus carbon dioxide pneumoperitoneum, Outcome 3: Pain scores (cm) (first postoperative day)

Comparison 3: Room air pneumoperitoneum versus carbon dioxide pneumoperitoneum, Outcome 4: Hospital costs (CNY)

Comparison 3: Room air pneumoperitoneum versus carbon dioxide pneumoperitoneum, Outcome 5: Cardiopulmonary parameters

Comparison 4: Nitrous oxide pneumoperitoneum versus carbon dioxide pneumoperitoneum (worst/best‐case scenario analysis for missing data), Outcome 1: Cardiopulmonary complications

Comparison 4: Nitrous oxide pneumoperitoneum versus carbon dioxide pneumoperitoneum (worst/best‐case scenario analysis for missing data), Outcome 2: Procedure‐related general complications

Comparison 4: Nitrous oxide pneumoperitoneum versus carbon dioxide pneumoperitoneum (worst/best‐case scenario analysis for missing data), Outcome 3: Pneumoperitoneum‐related serious adverse events

Comparison 4: Nitrous oxide pneumoperitoneum versus carbon dioxide pneumoperitoneum (worst/best‐case scenario analysis for missing data), Outcome 4: Mortality

Comparison 5: Nitrous oxide pneumoperitoneum versus carbon dioxide pneumoperitoneum (best/worst‐case scenario analysis for missing data, Outcome 1: Cardiopulmonary complications

Comparison 5: Nitrous oxide pneumoperitoneum versus carbon dioxide pneumoperitoneum (best/worst‐case scenario analysis for missing data, Outcome 2: Procedure‐related general complications

Comparison 5: Nitrous oxide pneumoperitoneum versus carbon dioxide pneumoperitoneum (best/worst‐case scenario analysis for missing data, Outcome 3: Pneumoperitoneum‐related serious adverse events

Comparison 5: Nitrous oxide pneumoperitoneum versus carbon dioxide pneumoperitoneum (best/worst‐case scenario analysis for missing data, Outcome 4: Mortality

Comparison 6: Helium pneumoperitoneum versus carbon dioxide pneumoperitoneum (worst/best‐case scenario analysis for missing data), Outcome 1: Cardiopulmonary complications

Comparison 6: Helium pneumoperitoneum versus carbon dioxide pneumoperitoneum (worst/best‐case scenario analysis for missing data), Outcome 2: Procedure‐related general complications

Comparison 6: Helium pneumoperitoneum versus carbon dioxide pneumoperitoneum (worst/best‐case scenario analysis for missing data), Outcome 3: Pneumoperitoneum‐related serious adverse events

Comparison 6: Helium pneumoperitoneum versus carbon dioxide pneumoperitoneum (worst/best‐case scenario analysis for missing data), Outcome 4: Mortality

Comparison 7: Helium pneumoperitoneum versus carbon dioxide pneumoperitoneum (best/worst‐case scenario analysis for missing data, Outcome 1: Cardiopulmonary complications

Comparison 7: Helium pneumoperitoneum versus carbon dioxide pneumoperitoneum (best/worst‐case scenario analysis for missing data, Outcome 2: Procedure‐related general complications

Comparison 7: Helium pneumoperitoneum versus carbon dioxide pneumoperitoneum (best/worst‐case scenario analysis for missing data, Outcome 3: Pneumoperitoneum‐related serious adverse events

Comparison 7: Helium pneumoperitoneum versus carbon dioxide pneumoperitoneum (best/worst‐case scenario analysis for missing data, Outcome 4: Mortality
| Nitrous oxide versus carbon dioxide for establishing pneumoperitoneum during laparoscopic abdominal surgery | ||||||
| Patient or population: people undergoing laparoscopic general abdominal or gynaecological pelvic surgery under general anaesthesia Setting: secondary and tertiary care Intervention: nitrous oxide pneumoperitoneum Comparison: carbon dioxide pneumoperitoneum | ||||||
| Outcomes | Anticipated absolute effects* (95% CI) | Relative effect | No of participants | Certainty of the evidence | Comments | |
|---|---|---|---|---|---|---|
| Risk with carbon dioxide pneumoperitoneum | Risk with nitrous oxide pneumoperitoneum | |||||
| Cardiopulmonary complications Follow‐up: 0–1 month | 29 per 1000 | 79 per 1000 | Peto OR 2.62 | 204 | ⊕⊝⊝⊝ | — |
| Procedure‐related general complications (surgical morbidity) Follow‐up: 0–1 month | 19 per 1000 | 19 per 1000 | Peto OR 1.01 | 207 | ⊕⊝⊝⊝ | — |
| Pneumoperitoneum‐related serious adverse events Follow‐up: 0–1 month | See comment | See comment | Not estimable | 260 | ⊕⊝⊝⊝ | None of the studies reported any pneumoperitoneum‐related serious adverse events. |
| Mortality Follow‐up: 0–1 month | See comment | See comment | Not estimable | 260 | ⊕⊝⊝⊝ | None of the studies reported any deaths. |
| Quality of life | None of the studies reported quality of life. | |||||
| Pain scores (first postoperative day) VAS, lower score indicates less pain. Follow‐up: 1 day | The mean pain scores (first postoperative day) in the carbon dioxide pneumoperitoneum group was 3.50 cm | The mean pain scores (first postoperative day) in the nitrous oxide pneumoperitoneum group was | MD −0.90 (−2.10 to 0.30) | 64 | ⊕⊝⊝⊝ | 2 studies reported lower pain scores in the nitrous oxide group compared with the carbon dioxide group at various time points on the first postoperative day (Aitola 1998; Tsereteli 2002). Neither trial reported the standard deviation for pain scores on the VAS scale. The other study reported no difference in the pain scores using McGill pain questionnaire between groups (Lipscomb 1993). We were unable to use the data from these 3 studies in meta‐analysis for the reasons given above. |
| Analgesia requirements Follow‐up: 1 week | The mean analgesia requirement in the carbon dioxide pneumoperitoneum was 54.4 mg of oxycodone and 2.0 tablets/24 hours of ibuprofen | The mean analgesia requirement in the nitrous oxide pneumoperitoneum was 0.65 standard deviations (moderate effect) lower | SMD −0.65 (moderate effect) | 257 | ⊕⊝⊝⊝ | — |
| Costs | None of the studies reported costs. | |||||
| *The basis for the assumed risk is the mean comparison group proportion in the studies. The risk in the intervention group (and its 95% confidence interval) is based on the assumed risk in the comparison group and the relative effect of the intervention (and its 95% CI). CI: confidence interval; MD: mean difference; OR: odds ratio; RR: risk ratio; SMD: standardised mean difference; VAS: visual analogue scale. | ||||||
| GRADE Working Group grades of evidence | ||||||
| aDowngraded two levels for very serious risk of bias: all included studies with unclear risk of bias for random sequence generation and allocation concealment; one study with high risk of bias for blinding of participants and personnel. | ||||||
| Helium versus carbon dioxide for establishing pneumoperitoneum during laparoscopic abdominal surgery | ||||||
| Patient or population: people undergoing laparoscopic general abdominal or gynaecological pelvic surgery under general anaesthesia Setting: secondary and tertiary care Intervention: helium pneumoperitoneum Comparison: carbon dioxide pneumoperitoneum | ||||||
| Outcomes | Anticipated absolute effects* (95% CI) | Relative effect | No of participants | Certainty of the evidence | Comments | |
|---|---|---|---|---|---|---|
| Risk with carbon dioxide pneumoperitoneum | Risk with helium pneumoperitoneum | |||||
| Cardiopulmonary complications Follow‐up: 0–1 month | 30 per 1000 | 44 per 1000 | Peto OR 1.66 | 128 | ⊕⊝⊝⊝ | — |
| Procedure‐related general complications (surgical morbidity) Follow‐up: 0–1 month | See comment | See comment | Not estimable | 177 | ⊕⊝⊝⊝ Very lowb,c | None of the studies reported any significant procedure‐related general complications in either group. |
| Pneumoperitoneum‐related serious adverse events Follow‐up: 0–1 month | 0 per 1000 | 44 per 1000 | Peto OR 8.28 | 128 | ⊕⊝⊝⊝ | — |
| Mortality Follow‐up: 0–1 month | See comment | See comment | Not estimable | 177 | ⊕⊝⊝⊝ | None of the studies reported any deaths. |
| Quality of life | None of the studies reported quality of life. | |||||
| Pain scores (first postoperative day) Visual analogue scale, lower score indicates less pain. Follow‐up: 1 day | The mean pain scores (first postoperative day) in the carbon dioxide pneumoperitoneum was 3.01 cm | The mean pain scores (first postoperative day) in the helium pneumoperitoneum was | MD 0.49 (−0.28 to 1.26) | 108 | ⊕⊕⊝⊝ | — |
| Analgesia requirements (morphine mg) Follow‐up: 2 days | The mean analgesia requirements (morphine) in the carbon dioxide pneumoperitoneum was 36.6 mg | The mean analgesia requirements (morphine) in the helium pneumoperitoneum was 12 mg higher | MD 12.00 (4.44 to 19.56) | 90 | ⊕⊝⊝⊝ | 2 trials (108 participants) reported analgesia requirements (Neuhaus 2001; O'Boyle 2002). Results of O'Boyle 2002 presented here. The other study including 18 participants reported no difference in the number of participants requiring analgesia (morphine) between the groups (Neuhaus 2001). |
| Costs | None of the studies reported costs. | |||||
| *The basis for the assumed risk is the mean comparison group proportion in the studies. The risk in the intervention group (and its 95% confidence interval) is based on the assumed risk in the comparison group and the relative effect of the intervention (and its 95% CI). CI: confidence interval; MD: mean difference; OR: odds ratio; RR: risk ratio. | ||||||
| GRADE Working Group grades of evidence | ||||||
| aDowngraded two levels for very serious risk of bias: two studies with unclear risk of bias for random sequence generation and allocation concealment; one study with high risk of bias for blinding of participants and personnel and baseline imbalance. | ||||||
| Room air versus carbon dioxide for establishing pneumoperitoneum during laparoscopic abdominal surgery | ||||||
| Patient or population: people undergoing laparoscopic general abdominal or gynaecological pelvic surgery under general anaesthesia Setting: secondary and tertiary care Intervention: room air pneumoperitoneum Comparison: carbon dioxide pneumoperitoneum | ||||||
| Outcomes | Anticipated absolute effects* (95% CI) | Relative effect | No of participants | Certainty of the evidence | Comments | |
|---|---|---|---|---|---|---|
| Risk with carbon dioxide pneumoperitoneum | Risk with room air pneumoperitoneum | |||||
| Cardiopulmonary complications Follow‐up: 1 month | See comment | See comment | Not estimable | 146 | ⊕⊝⊝⊝ | Trial did not report any cardiopulmonary complications. |
| Procedure‐related general complications (surgical morbidity) | The study did not report procedure‐related general complications. | |||||
| Pneumoperitoneum‐related serious adverse events Follow‐up: 1 month | See comment | See comment | Not estimable | 146 | ⊕⊝⊝⊝ | Trial did not report any pneumoperitoneum‐related serious adverse events. |
| Mortality Follow‐up: 1 month | See comment | See comment | Not estimable | 146 | ⊕⊝⊝⊝ | The study did not report any deaths. |
| Quality of life | The study did not report quality of life. | |||||
| Pain scores (first postoperative day) Visual analogue scale, lower score indicates less pain. Follow‐up: 1 day | The mean pain scores (first postoperative day) in the carbon dioxide pneumoperitoneum was 2.60 cm | The mean pain scores (first postoperative day) in the room air pneumoperitoneum was | MD −0.80 (−1.15 to −0.45) | 146 | ⊕⊝⊝⊝ | — |
| Analgesia requirements | The study did not report analgesia requirements. | |||||
| Hospital costs (CNY) Follow‐up: 1 month | The mean hospital costs in the carbon dioxide pneumoperitoneum was CNY 12,012.00 | The mean hospital costs in the room air pneumoperitoneum was CNY 2667.00 lower | MD −2667.00 (−3275.68 to −2058.32) | 146 | ⊕⊝⊝⊝ | — |
| *The basis for the assumed risk is the mean comparison group proportion in the studies. The risk in the intervention group (and its 95% confidence interval) is based on the assumed risk in the comparison group and the relative effect of the intervention (and its 95% CI). CI: confidence interval; CNY: Chinese Yuan; MD: mean difference. | ||||||
| GRADE Working Group grades of evidence | ||||||
| aDowngraded two levels for very serious risk of bias: unclear risk of bias for random sequence generation, allocation concealment, blinding of participants and personnel, and blinding of outcome assessment; high risk of bias for selective reporting. | ||||||
| Changing between worst‐case scenario analysis and best‐case scenario analysis for missing data | |||
|---|---|---|---|
| Outcomes | Risk ratio (95% CI) | ||
| Main analysis | Worst/best‐case | Best/worst‐case | |
| Nitrous oxide vs carbon dioxide | |||
| Cardiopulmonary complications | Peto OR 2.62 (0.78 to 8.85) | Peto OR 3.16 (1.03 to 9.69) | Peto OR 1.66 (0.54 to 5.12) |
| Procedure‐related general complications (surgical morbidity) | Peto OR 1.01 (0.14 to 7.31) | Peto OR 2.01 (0.40 to 10.20) | Peto OR 0.51 (0.10 to 2.60) |
| Pneumoperitoneum‐related serious adverse events | No events | Peto OR 7.46 (0.47 to 119.30) | Peto OR 0.14 (0.01 to 2.19) |
| Mortality | No events | Peto OR 7.46 (0.47 to 119.30) | Peto OR 0.14 (0.01 to 2.19) |
| Helium vs carbon dioxide | |||
| Cardiopulmonary complications | Peto OR 1.66 (0.28 to 9.72) | Peto OR 4.66 (1.43 to 15.15) | Peto OR 1.66 (0.28 to 9.72) |
| Procedure‐related general complications/surgical morbidity | No events | Peto OR 8.89 (1.94 to 40.64) | Peto OR 0.12 (0.01 to 2.07) |
| Pneumoperitoneum‐related serious adverse events | Peto OR 8.28 (0.86 to 80.03) | Peto OR 9.19 (2.56 to 33.01) | Peto OR 8.28 (0.86 to 80.03) |
| Mortality | No events | Peto OR 8.89 (1.94 to 40.64) | Peto OR 0.12 (0.01 to 2.07) |
| CI: confidence interval; Peto OR: Peto odds ratio, which was calculated for rare events (mortality, serious adverse events). | |||
| Outcome or subgroup title | No. of studies | No. of participants | Statistical method | Effect size |
| 1.1 Cardiopulmonary complications Show forest plot | 3 | 204 | Peto Odds Ratio (Peto, Fixed, 95% CI) | 2.62 [0.78, 8.85] |
| 1.2 Procedure‐related general complications Show forest plot | 3 | 207 | Peto Odds Ratio (Peto, Fixed, 95% CI) | 1.01 [0.14, 7.31] |
| 1.3 Pain scores (cm) (first postoperative day) Show forest plot | 1 | 64 | Mean Difference (IV, Fixed, 95% CI) | ‐0.90 [‐2.10, 0.30] |
| 1.4 Analgesia requirements Show forest plot | 4 | 257 | Std. Mean Difference (IV, Fixed, 95% CI) | ‐0.65 [‐0.90, ‐0.39] |
| 1.4.1 Oxycodone (mg) | 2 | 140 | Std. Mean Difference (IV, Fixed, 95% CI) | ‐1.07 [‐1.42, ‐0.71] |
| 1.4.2 Ibuprofen (tablets/24 hours) | 1 | 53 | Std. Mean Difference (IV, Fixed, 95% CI) | ‐0.16 [‐0.70, 0.38] |
| 1.4.3 Analgesia use (mg/kg) | 1 | 64 | Std. Mean Difference (IV, Fixed, 95% CI) | ‐0.25 [‐0.74, 0.24] |
| 1.5 Cardiopulmonary changes Show forest plot | 1 | Mean Difference (IV, Fixed, 95% CI) | Subtotals only | |
| 1.5.1 Heart rate change (beats/minute) | 1 | 100 | Mean Difference (IV, Fixed, 95% CI) | ‐0.60 [‐4.13, 2.93] |
| 1.5.2 Mean arterial pressure change (mmHg) | 1 | 100 | Mean Difference (IV, Fixed, 95% CI) | ‐3.80 [‐7.90, 0.30] |
| 1.5.3 Oxygen saturation change (%) | 1 | 100 | Mean Difference (IV, Fixed, 95% CI) | 0.00 [‐0.39, 0.39] |
| 1.5.4 Peak airway pressure change (cmH2O) | 1 | 100 | Mean Difference (IV, Fixed, 95% CI) | ‐0.30 [‐2.17, 1.57] |
| 1.6 Cardiopulmonary parameters Show forest plot | 1 | Mean Difference (IV, Fixed, 95% CI) | Subtotals only | |
| 1.6.1 Heart rate (beats/minute) (start) | 1 | 64 | Mean Difference (IV, Fixed, 95% CI) | ‐0.50 [‐7.55, 6.55] |
| 1.6.2 Heart rate (beats/minute) (end) | 1 | 64 | Mean Difference (IV, Fixed, 95% CI) | 1.30 [‐7.14, 9.74] |
| 1.6.3 Mean arterial pressure (mmHg) (start) | 1 | 64 | Mean Difference (IV, Fixed, 95% CI) | ‐5.50 [‐13.46, 2.46] |
| 1.6.4 Mean arterial pressure (mmHg) (end) | 1 | 64 | Mean Difference (IV, Fixed, 95% CI) | 2.90 [‐4.24, 10.04] |
| 1.6.5 Oxygen saturation (%) (start) | 1 | 64 | Mean Difference (IV, Fixed, 95% CI) | 0.10 [‐0.60, 0.80] |
| 1.6.6 Oxygen saturation (%) (end) | 1 | 64 | Mean Difference (IV, Fixed, 95% CI) | ‐0.30 [‐1.52, 0.92] |
| Outcome or subgroup title | No. of studies | No. of participants | Statistical method | Effect size |
| 2.1 Cardiopulmonary complications Show forest plot | 3 | 128 | Peto Odds Ratio (Peto, Fixed, 95% CI) | 1.66 [0.28, 9.72] |
| 2.2 Pneumoperitoneum‐related serious adverse events Show forest plot | 3 | 128 | Peto Odds Ratio (Peto, Fixed, 95% CI) | 8.28 [0.86, 80.03] |
| 2.3 Pain scores (cm) (first postoperative day) Show forest plot | 2 | 108 | Mean Difference (IV, Fixed, 95% CI) | 0.49 [‐0.28, 1.26] |
| 2.4 Analgesia requirements (morphine mg) Show forest plot | 1 | 90 | Mean Difference (IV, Fixed, 95% CI) | 12.00 [4.44, 19.56] |
| 2.5 Number of participants requiring analgesia Show forest plot | 1 | 18 | Risk Ratio (M‐H, Fixed, 95% CI) | 0.42 [0.17, 1.04] |
| 2.6 Cardiopulmonary parameters Show forest plot | 3 | Mean Difference (IV, Fixed, 95% CI) | Subtotals only | |
| 2.6.1 Blood pH (start) | 2 | 34 | Mean Difference (IV, Fixed, 95% CI) | 0.01 [‐0.01, 0.04] |
| 2.6.2 Blood pH (middle) | 3 | 52 | Mean Difference (IV, Fixed, 95% CI) | 0.08 [0.06, 0.11] |
| 2.6.3 Blood pH (end) | 2 | 34 | Mean Difference (IV, Fixed, 95% CI) | 0.10 [0.06, 0.14] |
| 2.6.4 Partial pressure of carbon dioxide (mmHg) (start) | 2 | 34 | Mean Difference (IV, Fixed, 95% CI) | 0.31 [‐1.79, 2.40] |
| 2.6.5 Partial pressure of carbon dioxide (mmHg) (middle) | 3 | 52 | Mean Difference (IV, Fixed, 95% CI) | ‐0.84 [‐3.70, 2.02] |
| 2.6.6 Partial pressure of carbon dioxide (mmHg) (end) | 2 | 34 | Mean Difference (IV, Fixed, 95% CI) | ‐12.78 [‐16.78, ‐8.77] |
| Outcome or subgroup title | No. of studies | No. of participants | Statistical method | Effect size |
| 3.1 Cardiopulmonary complications Show forest plot | 1 | 146 | Risk Ratio (M‐H, Fixed, 95% CI) | Not estimable |
| 3.2 Pneumoperitoneum‐related serious adverse events Show forest plot | 1 | 146 | Peto Odds Ratio (Peto, Fixed, 95% CI) | Not estimable |
| 3.3 Pain scores (cm) (first postoperative day) Show forest plot | 1 | 146 | Mean Difference (IV, Fixed, 95% CI) | ‐0.80 [‐1.15, ‐0.45] |
| 3.4 Hospital costs (CNY) Show forest plot | 1 | 146 | Mean Difference (IV, Fixed, 95% CI) | ‐2667.00 [‐3275.68, ‐2058.32] |
| 3.5 Cardiopulmonary parameters Show forest plot | 1 | Mean Difference (IV, Fixed, 95% CI) | Subtotals only | |
| 3.5.1 Heart rate (beats/minute) (start) | 1 | 146 | Mean Difference (IV, Fixed, 95% CI) | ‐0.10 [‐3.11, 2.91] |
| 3.5.2 Heart rate (beats/minute) (middle) | 1 | 146 | Mean Difference (IV, Fixed, 95% CI) | ‐7.30 [‐9.78, ‐4.82] |
| 3.5.3 Heart rate (beats/minute) (end) | 1 | 146 | Mean Difference (IV, Fixed, 95% CI) | ‐8.70 [‐11.72, ‐5.68] |
| 3.5.4 Blood systolic pressure (mmHg) (start) | 1 | 146 | Mean Difference (IV, Fixed, 95% CI) | ‐1.00 [‐5.12, 3.12] |
| 3.5.5 Blood systolic pressure (mmHg) (middle) | 1 | 146 | Mean Difference (IV, Fixed, 95% CI) | 2.80 [‐0.44, 6.04] |
| 3.5.6 Blood systolic pressure (mmHg) (end) | 1 | 146 | Mean Difference (IV, Fixed, 95% CI) | ‐2.00 [‐5.42, 1.42] |
| 3.5.7 Partial pressure of carbon dioxide (mmHg) (start) | 1 | 146 | Mean Difference (IV, Fixed, 95% CI) | ‐0.20 [‐1.39, 0.99] |
| 3.5.8 Partial pressure of carbon dioxide (mmHg) (middle) | 1 | 146 | Mean Difference (IV, Fixed, 95% CI) | ‐0.30 [‐1.37, 0.77] |
| 3.5.9 Partial pressure of carbon dioxide (mmHg) (end) | 1 | 146 | Mean Difference (IV, Fixed, 95% CI) | 0.10 [‐1.43, 1.63] |
| Outcome or subgroup title | No. of studies | No. of participants | Statistical method | Effect size |
| 4.1 Cardiopulmonary complications Show forest plot | 3 | 207 | Peto Odds Ratio (Peto, Fixed, 95% CI) | 3.16 [1.03, 9.69] |
| 4.2 Procedure‐related general complications Show forest plot | 3 | 207 | Peto Odds Ratio (Peto, Fixed, 95% CI) | 2.01 [0.40, 10.20] |
| 4.3 Pneumoperitoneum‐related serious adverse events Show forest plot | 3 | 207 | Peto Odds Ratio (Peto, Fixed, 95% CI) | 7.46 [0.47, 119.30] |
| 4.4 Mortality Show forest plot | 3 | 207 | Peto Odds Ratio (Peto, Fixed, 95% CI) | 7.46 [0.47, 119.30] |
| Outcome or subgroup title | No. of studies | No. of participants | Statistical method | Effect size |
| 5.1 Cardiopulmonary complications Show forest plot | 3 | 207 | Peto Odds Ratio (Peto, Fixed, 95% CI) | 1.66 [0.54, 5.12] |
| 5.2 Procedure‐related general complications Show forest plot | 3 | 207 | Peto Odds Ratio (Peto, Fixed, 95% CI) | 0.51 [0.10, 2.60] |
| 5.3 Pneumoperitoneum‐related serious adverse events Show forest plot | 3 | 207 | Peto Odds Ratio (Peto, Fixed, 95% CI) | 0.14 [0.01, 2.19] |
| 5.4 Mortality Show forest plot | 3 | 207 | Peto Odds Ratio (Peto, Fixed, 95% CI) | 0.14 [0.01, 2.19] |
| Outcome or subgroup title | No. of studies | No. of participants | Statistical method | Effect size |
| 6.1 Cardiopulmonary complications Show forest plot | 3 | 128 | Peto Odds Ratio (Peto, Fixed, 95% CI) | 4.66 [1.43, 15.15] |
| 6.2 Procedure‐related general complications Show forest plot | 4 | 144 | Peto Odds Ratio (Peto, Fixed, 95% CI) | 8.89 [1.94, 40.64] |
| 6.3 Pneumoperitoneum‐related serious adverse events Show forest plot | 3 | 128 | Peto Odds Ratio (Peto, Fixed, 95% CI) | 9.19 [2.56, 33.01] |
| 6.4 Mortality Show forest plot | 4 | 144 | Peto Odds Ratio (Peto, Fixed, 95% CI) | 8.89 [1.94, 40.64] |
| Outcome or subgroup title | No. of studies | No. of participants | Statistical method | Effect size |
| 7.1 Cardiopulmonary complications Show forest plot | 3 | 128 | Peto Odds Ratio (Peto, Fixed, 95% CI) | 1.66 [0.28, 9.72] |
| 7.2 Procedure‐related general complications Show forest plot | 4 | 144 | Peto Odds Ratio (Peto, Fixed, 95% CI) | 0.12 [0.01, 2.07] |
| 7.3 Pneumoperitoneum‐related serious adverse events Show forest plot | 3 | 128 | Peto Odds Ratio (Peto, Fixed, 95% CI) | 8.28 [0.86, 80.03] |
| 7.4 Mortality Show forest plot | 4 | 144 | Peto Odds Ratio (Peto, Fixed, 95% CI) | 0.12 [0.01, 2.07] |