Cirugía ovárica para el alivio de síntomas en las pacientes con síndrome de ovario poliquístico
Información
- DOI:
- https://doi.org/10.1002/14651858.CD009526.pub2Copiar DOI

- Base de datos:
-
- Cochrane Database of Systematic Reviews
- Versión publicada:
-
- 10 noviembre 2017see what's new
- Tipo:
-
- Intervention
- Etapa:
-
- Review
- Grupo Editorial Cochrane:
-
Grupo Cochrane de Ginecología y fertilidad
- Copyright:
-
- Copyright © 2017 The Cochrane Collaboration. Published by John Wiley & Sons, Ltd.
Cifras del artículo
Altmetric:
Citado por:
Autores
Contributions of authors
SL, JJ and YC performed the analysis and SL was the lead author in the writing of the review.
YC wrote the review and contributed to the methodology and content of the review.
MM contributed to the content and acted as a moderator.
Sources of support
Internal sources
-
None, Other.
External sources
-
Support from the Cochrane Gynaecology and Fertility Group, New Zealand.
Help with searches, editorial feedback gratefully acknowledged
Declarations of interest
SL, JJ, MM and YC have no interests to declare.
Acknowledgements
We thank the Cochrane Gynaecology and Fertility Group for providing us with the search strategy and for proof‐reading the review.
We thank Dr Yvonne Obura and Dr Bindiya Jhamb for their contributions to this review.
Version history
| Published | Title | Stage | Authors | Version |
| 2017 Nov 10 | Ovarian surgery for symptom relief in women with polycystic ovary syndrome | Review | Sam Lepine, Junyoung Jo, Mostafa Metwally, Ying C Cheong | |
| 2011 Dec 07 | Ovarian surgery for symptom relief in women with polycystic ovary syndrome | Protocol | Ying C Cheong, Mostafa Metwally, Norman Shreeve, Khaled Sadek, Cindy Farquhar | |
Differences between protocol and review
We have edited the review's Methods to bring them up to current Cochrane standards. These include: addition of a PRISMA flow chart to document our search and addition of 'Summary of findings' tables in accordance with the now mandatory MECIR standards C74 and C75. We have clarified that menstrual regularity is reported as binary data. There has been a change in the author team between protocol and review, so four review authors shared in selecting studies. We have added an I2 percentage for clarification. We planned to use a random‐effects model where data were heterogenous; these analyses using random‐effects model are now sensitivity analyses. The background sections have been updated in the lay and non‐lay sections. We planned to stratify comparisons by some specified characteristics of interventions and planned subgroups by hormone profiles and different surgical techniques; we did not do this because with hindsight the data were not reported in a format applicable to this analysis.
Keywords
MeSH
Medical Subject Headings (MeSH) Keywords
- Acne Vulgaris [etiology, *therapy];
- Clomiphene [therapeutic use];
- Gonadotropins [therapeutic use];
- Hirsutism [etiology, *therapy];
- Laparoscopy [adverse effects, methods];
- Letrozole;
- Menstruation Disturbances [etiology, *therapy];
- Metformin [therapeutic use];
- Nitriles [therapeutic use];
- Ovary [*surgery];
- Polycystic Ovary Syndrome [*complications, therapy];
- Punctures [adverse effects, *methods];
- Randomized Controlled Trials as Topic;
- Triazoles [therapeutic use];
Medical Subject Headings Check Words
Female; Humans;
PICO
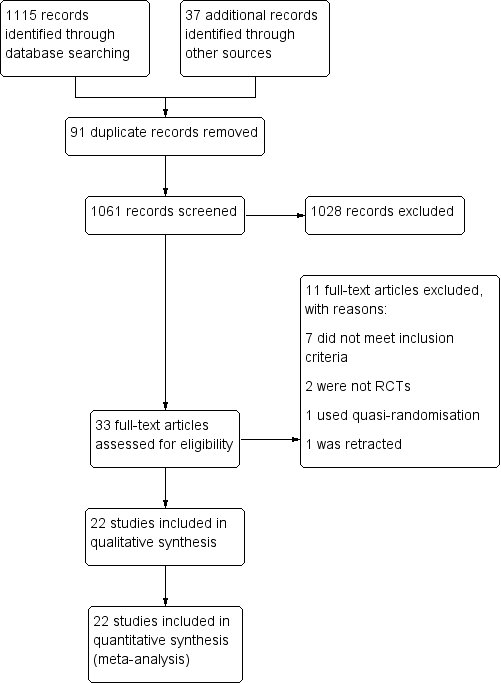
Study flow diagram
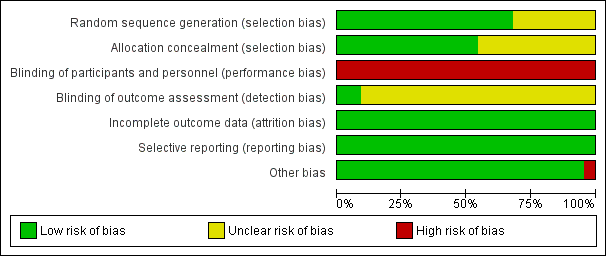
Risk of bias graph: review authors' judgements about each risk of bias item presented as percentages across all included studies.

Risk of bias summary: review authors' judgements about each risk of bias item for each included study.
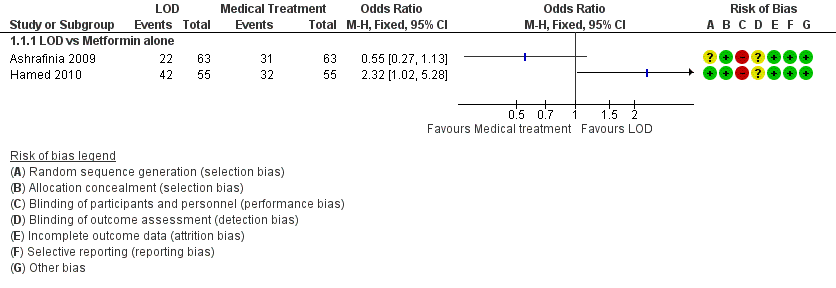
Forest plot of comparison: 1 LOD vs medical interventions, outcome: 1.1 Menstrual regularity.
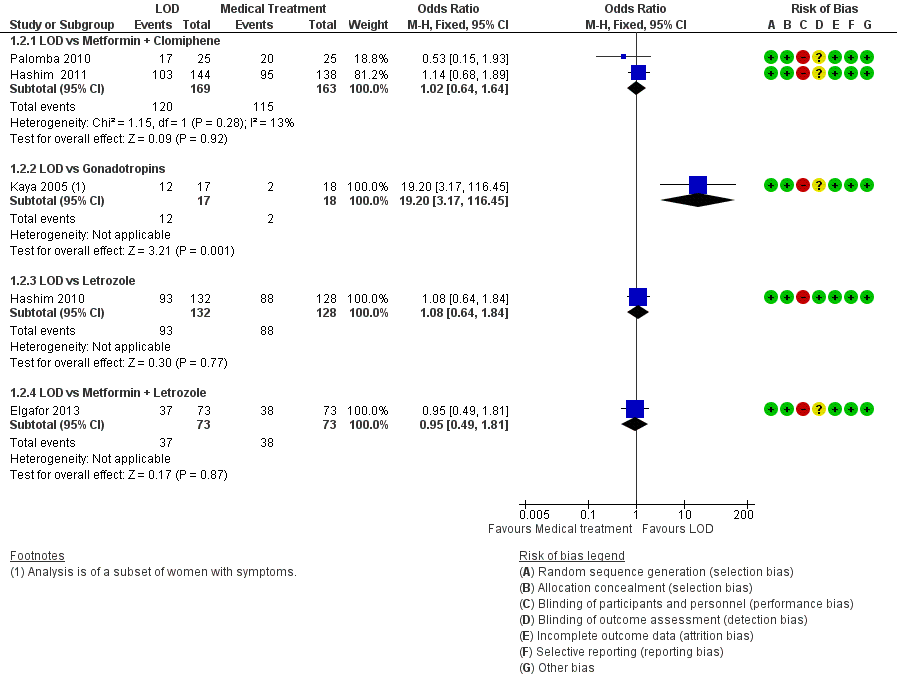
Forest plot of comparison: 1 LOD vs medical interventions, outcome: 1.2 Menstrual regularity.
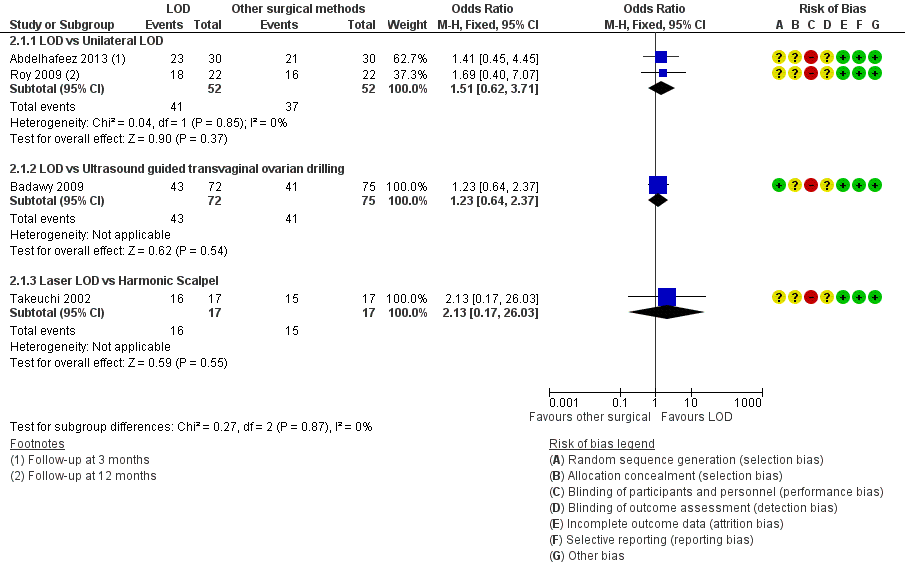
Forest plot of comparison: 2 LOD vs other surgical interventions, outcome: 2.1 Menstrual regularity.
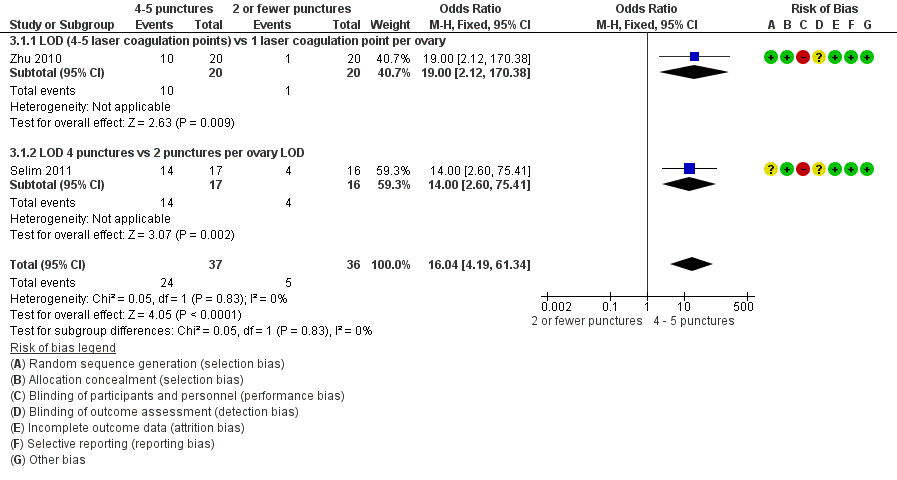
Forest plot of comparison: 3 LOD 4 ‐ 5 vs 2 or fewer punctures, outcome: 3.1 Menstrual regularity.

Forest plot of comparison: 4 LOD vs LOD variable energy, outcome: 4.1 Menstrual regularity.
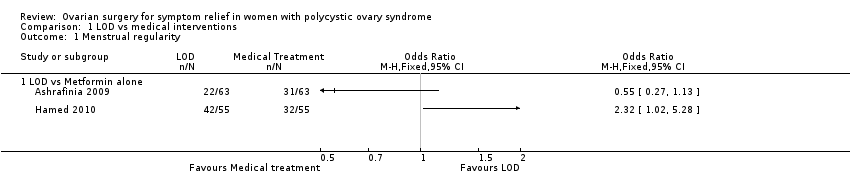
Comparison 1 LOD vs medical interventions, Outcome 1 Menstrual regularity.

Comparison 1 LOD vs medical interventions, Outcome 2 Menstrual regularity.
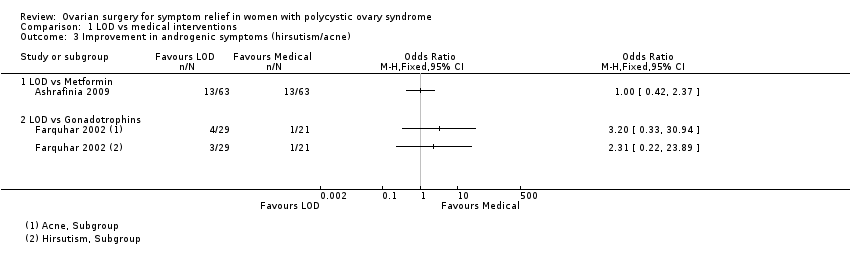
Comparison 1 LOD vs medical interventions, Outcome 3 Improvement in androgenic symptoms (hirsutism/acne).
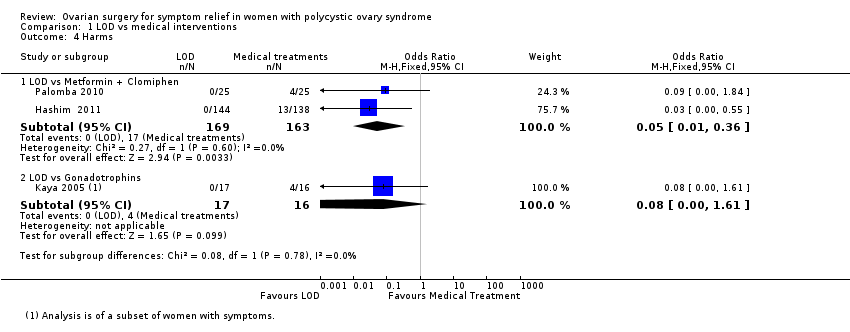
Comparison 1 LOD vs medical interventions, Outcome 4 Harms.
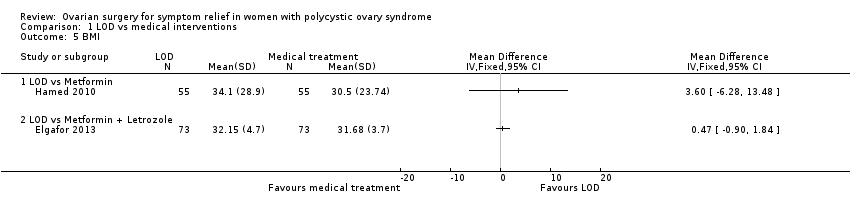
Comparison 1 LOD vs medical interventions, Outcome 5 BMI.

Comparison 1 LOD vs medical interventions, Outcome 6 Testosterone and free androgen index.
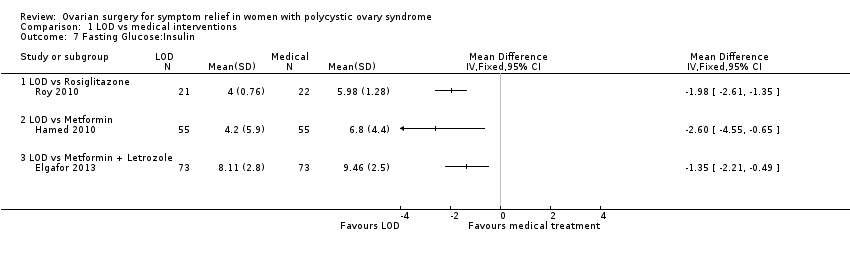
Comparison 1 LOD vs medical interventions, Outcome 7 Fasting Glucose:Insulin.

Comparison 2 LOD vs other surgical interventions, Outcome 1 Menstrual regularity.

Comparison 2 LOD vs other surgical interventions, Outcome 2 Improvement in androgenic symptoms (hirsutism/acne).
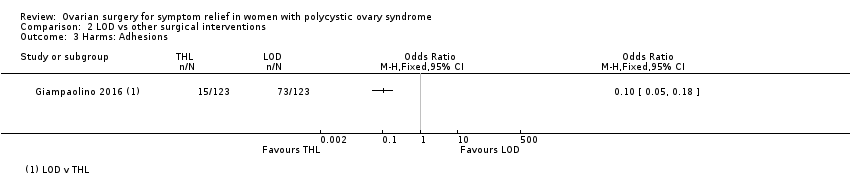
Comparison 2 LOD vs other surgical interventions, Outcome 3 Harms: Adhesions.

Comparison 2 LOD vs other surgical interventions, Outcome 4 Testosterone and free androgen index.
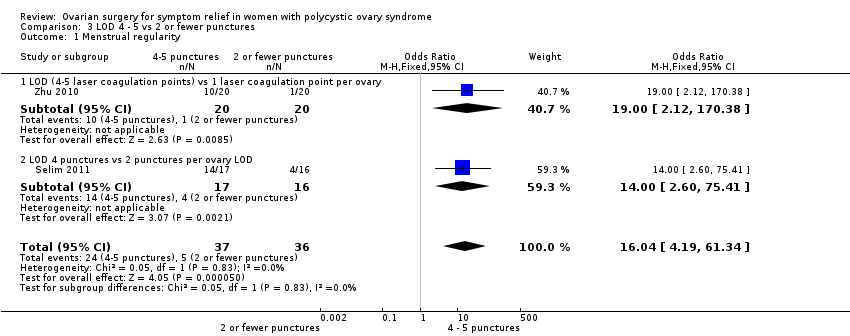
Comparison 3 LOD 4 ‐ 5 vs 2 or fewer punctures, Outcome 1 Menstrual regularity.

Comparison 3 LOD 4 ‐ 5 vs 2 or fewer punctures, Outcome 2 Testosterone and free androgen index.
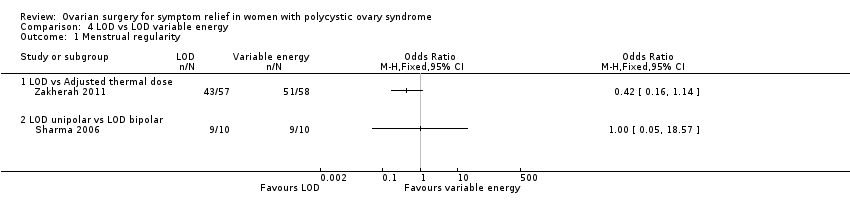
Comparison 4 LOD vs LOD variable energy, Outcome 1 Menstrual regularity.

Comparison 4 LOD vs LOD variable energy, Outcome 2 Harms.

Comparison 4 LOD vs LOD variable energy, Outcome 3 BMI.

Comparison 4 LOD vs LOD variable energy, Outcome 4 Testosterone and free androgen index.
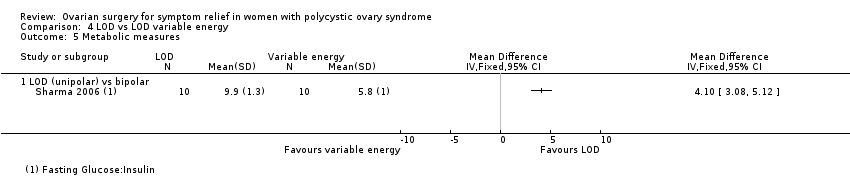
Comparison 4 LOD vs LOD variable energy, Outcome 5 Metabolic measures.
| LOD compared to medical interventions for symptom relief in women with polycystic ovary syndrome | ||||||
| Patient or population: Women with symptoms of PCOS | ||||||
| Outcomes | Relative effect | Anticipated absolute effects* (95% CI) | Quality of the evidence | What happens | ||
| Without LOD | With LOD | Difference | ||||
| Menstrual regularity at 6 months LOD vs metformin LOD vs metformin + clomiphene LOD vs gonadotropins LOD vs letrozole LOD vs metformin + letrozole | Findings inconsistent and data unsuitable for pooling | Not calculable | ⊕⊝⊝⊝ | |||
| OR 1.02 | 70.6% | 71.0% | 0.4% more | ⊕⊕⊝⊝ | ||
| OR 19.20 | 11.1% | 70.6% | 59.5% more | ⊕⊕⊝⊝ | ||
| OR 1.08 | 68.8% | 70.4% | 1.6% more | ⊕⊕⊝⊝ | ||
| OR 0.95 | 52.1% | 50.8% | 1.3% fewer | ⊕⊕⊝⊝ | ||
| Improvement in androgenic symptoms at 6 months (hirsutism/acne) ‐ LOD vs metformin | OR 1.00 | 79.4% | 79.4% | 0.0% fewer | ⊕⊕⊝⊝ | |
| Improvement in androgenic symptoms at 6 months (hirsutism/acne) ‐ LOD vs gonadotrophins | Acne: OR 3.20 (0.33 to 30.94) Hirsutism: OR 2.31, (0.22 to 23.89) | See comments | ⊕⊝⊝⊝VERY LOW 1, 4 | Acne: 4/29 without LOD, 1/21 with LOD Hirsutism: 3/29 without LOD, 1/21 with LOD | ||
| Harms: GI Upset at 6 months ‐ LOD vs metformin + clomiphene Harms: OHSS rates at 6 months ‐ LOD vs gonadotrophins | OR 0.05 | 10.4% | 0.6% | 9.9% fewer | ⊕⊕⊕⊝ | |
| OR 0.08 | 25.0% | 2.6% | 22.4% fewer | ⊕⊕⊝⊝ | ||
| *The risk in the intervention group (and its 95% confidence interval) is based on the mean risk in the comparison group and the relative effect of the intervention (and its 95% CI). | ||||||
| GRADE Working Group grades of evidence | ||||||
| 1Downgraded one level for serious risk of bias: Included studies not double‐blinded, and in some cases methods of randomization unclear. | ||||||
| LOD compared to other surgical interventions for symptom relief in women with polycystic ovary syndrome | ||||||
| Patient or population: Women with symptoms of PCOS | ||||||
| Outcomes | Relative effect | Anticipated absolute effects* (95% CI) | Quality of the evidence | What happens | ||
| Without LOD | With LOD | Difference | ||||
| Menstrual regularity ‐ LOD vs unilateral LOD | OR 1.51 | 71.2% | 78.8% | 7.7% more | ⊕⊕⊕⊝ | 1 study follow‐up at 3 months. 1 study follow‐up at 12 months |
| Menstrual regularity at 6 months ‐ LOD vs ultrasound‐guided transvaginal ovarian drilling | OR 1.23 | 54.7% | 59.7% | 5.1% more | ⊕⊕⊝⊝ | |
| Menstrual regularity at 12 months | OR 2.13 | 88.2% | 94.1% | 5.9% more | ⊕⊕⊝⊝ | Note control group is NdYAG Laser |
| Improvement in androgenic symptoms at 6 months (Acne) ‐ LOD vs USS guided | OR 0.84 (0.20 to 3.5) | 47.1% | 42.7% | 4.3% fewer | ⊕⊕⊝⊝ | |
| Improvement in androgenic symptoms at 6 months (Hirsutism) ‐ LOD vs USS‐guided | OR 1.09 | 40.0% | 42.1% (16.7 to 72.3) | 2.1% more (23.3 fewer to 32.3 more) | ⊕⊕⊝⊝ | |
| Harms: Adhesions at 6 months ‐ LOD vs THL | OR 0.10 | 59.3% | 12.7% | 46.6% fewer | ⊕⊝⊝⊝ | |
| *The risk in the intervention group (and its 95% confidence interval) is based on the assumed risk in the comparison group and the relative effect of the intervention (and its 95% CI). | ||||||
| GRADE Working Group grades of evidence | ||||||
| 1Downgraded one level for serious risk of bias: Included studies not double‐blinded or unclear allocation concealment or unclear randomization method. | ||||||
| LOD 4 ‐ 5 punctures compared to 2 or fewer punctures for symptom relief in women with polycystic ovary syndrome | ||||||
| Patient or population: Women with symptoms of PCOS | ||||||
| Outcomes | Relative effect | Anticipated absolute effects* (95% CI) | Quality of the evidence | What happens | ||
| Without LOD 4‐5 | With LOD 4‐5 | Difference | ||||
| Menstrual regularity at 6 months ‐ LOD 4 ‐ 5 coagulation points compared to 2 or fewer | OR 16.04 | 13.9% | 72.1% | 58.2% more | ⊕⊕⊝⊝ | |
| Menstrual regularity at 6 months ‐ LOD (4 ‐ 5 laser coagulation points) vs 1 laser coagulation point per ovary | OR 19.00 | 5.0% | 50.0% | 45.0% more | ⊕⊕⊝⊝ | |
| Menstrual regularity at 6 months ‐ LOD 4 punctures vs 2 punctures per ovary | OR 14.00 | 25.0% | 82.4% | 57.4% more | ⊕⊕⊝⊝ | |
| Improvement in androgenic symptoms | No data available | |||||
| Harms LOD 4 ‐ 5 versus fewer punctures | No data available | |||||
| *The risk in the intervention group (and its 95% confidence interval) is based on the assumed risk in the comparison group and the relative effect of the intervention (and its 95% CI). | ||||||
| GRADE Working Group grades of evidence | ||||||
| 1Downgraded one level for serious risk of bias: Included studies not double‐blinded or methods of randomization unclear. | ||||||
| LOD compared to LOD variable energy for symptom relief in women with polycystic ovary syndrome | ||||||
| Patient or population: Women with symptoms of PCOS | ||||||
| Outcomes | Relative effect | Anticipated absolute effects* (95% CI) | Quality of the evidence | What happens | ||
| Without LOD | With LOD | Difference | ||||
| Menstrual regularity at 6 months ‐ LOD vs adjusted thermal dose | OR 0.42 | 87.9% | 75.4% | 12.6% fewer | ⊕⊝⊝⊝ | |
| Menstrual regularity at 3 months ‐ LOD unipolar vs LOD bipolar | OR 1.00 | 90.0% | 90.0% | 0.0% fewer | ⊕⊝⊝⊝ | Groups had different metabolic characteristics at baseline |
| Improvement in androgenic symptoms | No data available | |||||
| Harms: Adhesions at 6 months | OR 0.96 | 28.6% | 27.7% | 0.8% fewer | ⊕⊝⊝⊝ VERY LOW1, 2 | Women that remained enrolled for second‐look laparoscopy |
| *The risk in the intervention group (and its 95% confidence interval) is based on the assumed risk in the comparison group and the relative effect of the intervention (and its 95% CI). | ||||||
| GRADE Working Group grades of evidence | ||||||
| 1Downgraded one level for serious risk of bias: Included studies not double‐blinded or unclear allocation concealment. | ||||||
| Outcome or subgroup title | No. of studies | No. of participants | Statistical method | Effect size |
| 1 Menstrual regularity Show forest plot | 2 | Odds Ratio (M‐H, Fixed, 95% CI) | Totals not selected | |
| 1.1 LOD vs Metformin alone | 2 | Odds Ratio (M‐H, Fixed, 95% CI) | 0.0 [0.0, 0.0] | |
| 2 Menstrual regularity Show forest plot | 5 | Odds Ratio (M‐H, Fixed, 95% CI) | Subtotals only | |
| 2.1 LOD vs Metformin + Clomiphene | 2 | 332 | Odds Ratio (M‐H, Fixed, 95% CI) | 1.02 [0.64, 1.64] |
| 2.2 LOD vs Gonadotropins | 1 | 35 | Odds Ratio (M‐H, Fixed, 95% CI) | 19.2 [3.17, 116.45] |
| 2.3 LOD vs Letrozole | 1 | 260 | Odds Ratio (M‐H, Fixed, 95% CI) | 1.08 [0.64, 1.84] |
| 2.4 LOD vs Metformin + Letrozole | 1 | 146 | Odds Ratio (M‐H, Fixed, 95% CI) | 0.95 [0.49, 1.81] |
| 3 Improvement in androgenic symptoms (hirsutism/acne) Show forest plot | 2 | Odds Ratio (M‐H, Fixed, 95% CI) | Totals not selected | |
| 3.1 LOD vs Metformin | 1 | Odds Ratio (M‐H, Fixed, 95% CI) | 0.0 [0.0, 0.0] | |
| 3.2 LOD vs Gonadotrophins | 1 | Odds Ratio (M‐H, Fixed, 95% CI) | 0.0 [0.0, 0.0] | |
| 4 Harms Show forest plot | 3 | Odds Ratio (M‐H, Fixed, 95% CI) | Subtotals only | |
| 4.1 LOD vs Metformin + Clomiphen | 2 | 332 | Odds Ratio (M‐H, Fixed, 95% CI) | 0.05 [0.01, 0.36] |
| 4.2 LOD vs Gonadotrophins | 1 | 33 | Odds Ratio (M‐H, Fixed, 95% CI) | 0.08 [0.00, 1.61] |
| 5 BMI Show forest plot | 2 | Mean Difference (IV, Fixed, 95% CI) | Totals not selected | |
| 5.1 LOD vs Metformin | 1 | Mean Difference (IV, Fixed, 95% CI) | 0.0 [0.0, 0.0] | |
| 5.2 LOD vs Metformin + Letrozole | 1 | Mean Difference (IV, Fixed, 95% CI) | 0.0 [0.0, 0.0] | |
| 6 Testosterone and free androgen index Show forest plot | 5 | Mean Difference (IV, Fixed, 95% CI) | Totals not selected | |
| 6.1 LOD vs Metformin | 2 | Mean Difference (IV, Fixed, 95% CI) | 0.0 [0.0, 0.0] | |
| 6.2 LOD vs GnRHa + OCP | 1 | Mean Difference (IV, Fixed, 95% CI) | 0.0 [0.0, 0.0] | |
| 6.3 LOD vs Metformin + Letrozole | 1 | Mean Difference (IV, Fixed, 95% CI) | 0.0 [0.0, 0.0] | |
| 6.4 LOD versus Rosiglitazone | 1 | Mean Difference (IV, Fixed, 95% CI) | 0.0 [0.0, 0.0] | |
| 7 Fasting Glucose:Insulin Show forest plot | 3 | Mean Difference (IV, Fixed, 95% CI) | Totals not selected | |
| 7.1 LOD vs Rosiglitazone | 1 | Mean Difference (IV, Fixed, 95% CI) | 0.0 [0.0, 0.0] | |
| 7.2 LOD vs Metformin | 1 | Mean Difference (IV, Fixed, 95% CI) | 0.0 [0.0, 0.0] | |
| 7.3 LOD vs Metformin + Letrozole | 1 | Mean Difference (IV, Fixed, 95% CI) | 0.0 [0.0, 0.0] | |
| Outcome or subgroup title | No. of studies | No. of participants | Statistical method | Effect size |
| 1 Menstrual regularity Show forest plot | 4 | Odds Ratio (M‐H, Fixed, 95% CI) | Subtotals only | |
| 1.1 LOD vs Unilateral LOD | 2 | 104 | Odds Ratio (M‐H, Fixed, 95% CI) | 1.51 [0.62, 3.71] |
| 1.2 LOD vs Ultrasound guided transvaginal ovarian drilling | 1 | 147 | Odds Ratio (M‐H, Fixed, 95% CI) | 1.23 [0.64, 2.37] |
| 1.3 Laser LOD vs Harmonic Scalpel | 1 | 34 | Odds Ratio (M‐H, Fixed, 95% CI) | 2.13 [0.17, 26.03] |
| 2 Improvement in androgenic symptoms (hirsutism/acne) Show forest plot | 1 | Odds Ratio (M‐H, Fixed, 95% CI) | Totals not selected | |
| 2.1 Hirsutism | 1 | Odds Ratio (M‐H, Fixed, 95% CI) | 0.0 [0.0, 0.0] | |
| 2.2 Acne | 1 | Odds Ratio (M‐H, Fixed, 95% CI) | 0.0 [0.0, 0.0] | |
| 3 Harms: Adhesions Show forest plot | 1 | Odds Ratio (M‐H, Fixed, 95% CI) | Totals not selected | |
| 4 Testosterone and free androgen index Show forest plot | 6 | Mean Difference (IV, Fixed, 95% CI) | Totals not selected | |
| 4.1 LOD vs Ultrasound guided transvaginal ovarian drilling | 1 | Mean Difference (IV, Fixed, 95% CI) | 0.0 [0.0, 0.0] | |
| 4.2 LOD versus mini laparoscopy with sedation | 1 | Mean Difference (IV, Fixed, 95% CI) | 0.0 [0.0, 0.0] | |
| 4.3 LOD vs unilateral LOD | 3 | Mean Difference (IV, Fixed, 95% CI) | 0.0 [0.0, 0.0] | |
| 4.4 Laser LOD vs Harmonic Scalpel | 1 | Mean Difference (IV, Fixed, 95% CI) | 0.0 [0.0, 0.0] | |
| Outcome or subgroup title | No. of studies | No. of participants | Statistical method | Effect size |
| 1 Menstrual regularity Show forest plot | 2 | 73 | Odds Ratio (M‐H, Fixed, 95% CI) | 16.04 [4.19, 61.34] |
| 1.1 LOD (4‐5 laser coagulation points) vs 1 laser coagulation point per ovary | 1 | 40 | Odds Ratio (M‐H, Fixed, 95% CI) | 19.0 [2.12, 170.38] |
| 1.2 LOD 4 punctures vs 2 punctures per ovary LOD | 1 | 33 | Odds Ratio (M‐H, Fixed, 95% CI) | 14.0 [2.60, 75.41] |
| 2 Testosterone and free androgen index Show forest plot | 2 | Mean Difference (IV, Fixed, 95% CI) | Subtotals only | |
| 2.1 LOD 4‐5 punctures vs 2 or fewer punctures (Testosterone) | 2 | 73 | Mean Difference (IV, Fixed, 95% CI) | ‐0.90 [‐1.12, ‐0.68] |
| 2.2 LOD 4 punctures vs 2 punctures (FAI) | 1 | 33 | Mean Difference (IV, Fixed, 95% CI) | ‐1.5 [‐3.21, 0.21] |
| Outcome or subgroup title | No. of studies | No. of participants | Statistical method | Effect size |
| 1 Menstrual regularity Show forest plot | 2 | Odds Ratio (M‐H, Fixed, 95% CI) | Totals not selected | |
| 1.1 LOD vs Adjusted thermal dose | 1 | Odds Ratio (M‐H, Fixed, 95% CI) | 0.0 [0.0, 0.0] | |
| 1.2 LOD unipolar vs LOD bipolar | 1 | Odds Ratio (M‐H, Fixed, 95% CI) | 0.0 [0.0, 0.0] | |
| 2 Harms Show forest plot | 1 | Odds Ratio (M‐H, Fixed, 95% CI) | Totals not selected | |
| 3 BMI Show forest plot | 1 | Mean Difference (IV, Fixed, 95% CI) | Totals not selected | |
| 4 Testosterone and free androgen index Show forest plot | 2 | Mean Difference (IV, Fixed, 95% CI) | Totals not selected | |
| 4.1 LOD vs Adjusted thermal dose | 1 | Mean Difference (IV, Fixed, 95% CI) | 0.0 [0.0, 0.0] | |
| 4.2 LOD unipolar vs LOD bipolar | 1 | Mean Difference (IV, Fixed, 95% CI) | 0.0 [0.0, 0.0] | |
| 5 Metabolic measures Show forest plot | 1 | Mean Difference (IV, Fixed, 95% CI) | Totals not selected | |
| 5.1 LOD (unipolar) vs bipolar | 1 | Mean Difference (IV, Fixed, 95% CI) | 0.0 [0.0, 0.0] | |