Cirugía ovárica para el alivio de síntomas en las pacientes con síndrome de ovario poliquístico
Resumen
Antecedentes
El síndrome de ovario poliquístico (SOPQ) es una afección endocrina frecuente que afecta a aproximadamente una de diez mujeres. El SOPQ se define por dos de tres características: oligoanovulación u anovulación, hiperandrogenismo clínico o bioquímico o ambos, u ovarios poliquísticos.
Las pacientes con SOPQ pueden tener una variedad amplia de problemas de salud que incluyen períodos poco frecuentes e irregulares, crecimiento de pelo no deseado y acné, así como fertilidad subnormal. Las preocupaciones de salud a largo plazo incluyen un aumento en el riesgo de cardiopatía, diabetes y desarrollo de enfermedad precancerosa de la matriz.
Objetivos
Evaluar la efectividad y los efectos perjudiciales de la cirugía ovárica como tratamiento para el alivio sintomático del hirsutismo, el acné y la irregularidad menstrual en el SOPQ.
Métodos de búsqueda
Se hicieron búsquedas en el registro especializado del Grupo Cochrane de Ginecología y Fertilidad (Cochrane Gynaecology and Fertility Group specialized register), CENTRAL, MEDLINE, Embase y en PsycINFO (desde su inicio hasta el 17 octubre 2016). Se hicieron búsquedas manuales en las listas de citas, registros de ensayos en curso y actas de congresos.
Criterios de selección
Se incluyeron los ensayos controlados aleatorios (ECA) en pacientes sometidas a electropunción ovárica en comparación con ningún tratamiento, tratamiento médico u otras formas de tratamiento quirúrgico para los síntomas del SOPQ.
Obtención y análisis de los datos
Se utilizaron los procedimientos metodológicos estándar recomendados por la Colaboración Cochrane. Las medidas de resultado primarias fueron mejoría en la regularidad menstrual y los síntomas androgénicos del SOPQ (hirsutismo, acné); las medidas de resultado secundarias incluyeron efectos perjudiciales, cambio en el índice de masa corporal (IMC), circunferencia de cintura, niveles de los andrógenos, medidas metabólicas y calidad de vida. La calidad de la evidencia se evaluó mediante los métodos GRADE.
Resultados principales
Se incluyeron 22 ECA (2278 pacientes analizadas) con participantes con SOPQ y síntomas de acné, hirsutismo o ciclos menstruales irregulares, y todos incluyeron la electropunción ovárica laparoscópica (EOL) como una intervención.
Dos estudios informaron su fuente de financiación (Farquhar 2002 ‐ apoyado en parte por la Auckland Medical Research Foundation; Sarouri 2015 ‐ los autores agradecen al Vicerrector de Investigación de la Guilan University of Medical Sciences la financiación de este proyecto).
La calidad de la evidencia varió de muy baja a moderada. Las limitaciones principales fueron la imprecisión asociada con el escaso número de estudios, la inconsistencia y el riesgo de sesgo asociado con la imposibilidad de cegar a las participantes. Hubo muy pocos estudios para evaluar el riesgo de sesgo de publicación.
Regularidad menstrual
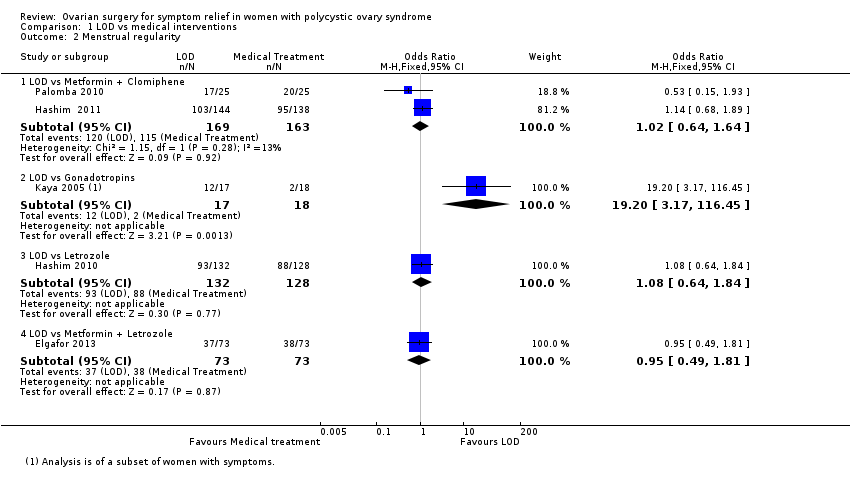
Dos estudios compararon EOL versus metformina (n = 226) pero no fue posible establecer conclusiones con respecto a la regularidad menstrual, ya que los resultados fueron inconsistentes y no fueron apropiados para el agrupamiento. Pareció haber poca o ninguna diferencia en la tasa de pacientes que informaron mejoría en la regularidad menstrual cuando la EOL se comparó con tratamiento médico que incluyó metformina + clomifeno (OR 1,02; IC del 95%: 0,64 a 1,64; dos estudios, 332 pacientes, I2 = 13%, evidencia de baja calidad), letrozol (OR 1,08; IC del 95%: 0,64 a 1,84; un estudio, 260 pacientes, evidencia de baja calidad), o metformina + letrozol (OR 0,95; IC del 95%: 0,49 a 1,81; un estudio, 146 mujeres, evidencia de baja calidad). Sin embargo, un estudio informó que la EOL fue superior a la gonadotrofina (OR 19,2; IC del 95%: 3,17 a 116,45; un estudio, 35 mujeres, evidencia de muy baja calidad).
Pareció haber poca o ninguna diferencia en la tasa de pacientes que informaron mejoría en la regularidad menstrual cuando la EOL unipolar bilateral se comparó con la EOL unilateral (OR 1,51; IC del 95%: 0,62 a 3,71; dos estudios, 104 pacientes, I2 = 0%, evidencia de calidad moderada), EOL transvaginal guiada por ecografía (OR 1,23; IC del 95%: 0,64 a 2,37; un estudio, 147 pacientes, evidencia de baja calidad), EOL mediante dosis térmica ajustada en conformidad con el volumen ovárico (OR 0,42; IC del 95%: 0,16 a 1,14; un estudio, 115 pacientes, evidencia de baja calidad) o EOL bipolar (OR 1,00; IC del 95%: 0,05 a 18,57; un estudio, 18 mujeres, evidencia de baja calidad).
De cuatro a cinco punciones por ovario pueden mejorar la tasa de pacientes que informan regularidad menstrual en comparación con dos o menos (OR 16,04; IC del 95%: 4,19 a 61,34; dos estudios, 73 mujeres, I2 = 0%, evidencia de baja calidad).
Síntomas androgénicos
Probablemente hubo poca o ninguna diferencia en la mejoría de los síntomas androgénicos cuando la EOL se comparó con la metformina (OR 1,00; IC del 95%: 0,42 a 2,37; un estudio, 126 pacientes, evidencia de calidad moderada) o las gonadotrofinas; el acné (OR 3,20; IC del 95%: 0,33 a 30,94; un estudio, 25 pacientes, evidencia de baja calidad), el hirsutismo (OR 2,31; IC del 95%: 0,22 a 23,89; un estudio, 25 pacientes, evidencia de baja calidad).
Pareció haber poca o ninguna diferencia en la mejoría de los síntomas androgénicos cuando la EOL se comparó con la EOL transvaginal guiada por ecografía, con respecto al hirsutismo (OR 1,09; IC del 95%: 0,30 a 3,91; un estudio, 39 pacientes, evidencia de baja calidad) o el acné (OR 0,84; IC del 95%: 0,20 a 3,50; un estudio, 31 mujeres, evidencia de baja calidad).
Efectos perjudiciales
La EOL se asoció con menos efectos secundarios gastrointestinales que la metformina más clomifeno (OR 0,05; IC del 95%: 0,01 a 0,36; dos estudios, 332 mujeres, I2 = 0%, evidencia de calidad moderada). Un estudio indicó poca o ninguna diferencia en las tasas de síndrome de hiperestimulación ovárica entre la EOL y las gonadotrofinas (OR 0,08; IC del 95%: 0,00 a 1,61; un estudio, 33 mujeres, evidencia de baja calidad).
Hubo menos adherencias con la hidrolaparoscopia transvaginal en comparación con la EOL (OR 0,10; IC del 95%: 0,05 a 0,18; un estudio, 246 mujeres, evidencia de calidad moderada). Pareció haber poca o ninguna diferencia en las adherencias cuando la EOL de energía variable se comparó con la EOL estándar (OR 0,96; IC del 95%: 0,32 a 2,88; un estudio, 64 mujeres, evidencia de baja calidad). Otro estudio (44 pacientes) informó que ninguna de las pacientes que regresaron para cirugía después de EOL tradicional o unilateral presentaba adherencias.
Conclusiones de los autores
No hubo evidencia clara de que la EOL mejore la regularidad menstrual o los síntomas androgénicos del SOPQ en comparación con la mayoría de los tratamientos médicos utilizados en los estudios incluidos. La EOL se asoció con menos efectos secundarios gastrointestinales en comparación con la metformina y el clomifeno.
Tampoco hubo evidencia clara de una efectividad diferente entre los tipos de EOL, excepto que la EOL con cuatro a cinco punciones por ovario puede ser más efectiva que dos punciones o menos. Hubo poca evidencia que comparara la EOL con diferentes tipos de cirugía, aunque un estudio concluyó que la hidrolaparoscopia transvaginal tuvo un riesgo menor de adherencias que la EOL.
Hubo evidencia a partir de un estudio pequeño de los efectos beneficiosos de la EOL en comparación con las gonadotrofinas en la regulación menstrual. Sin embargo, las gonadotrofinas rara vez se usan para esta indicación.
PICOs
Resumen en términos sencillos
Cirugía ovárica para el alivio de síntomas en las pacientes con síndrome de ovario poliquístico
Pregunta de la revisión
Los investigadores Cochrane examinaron las evidencia acerca del efecto de la cirugía ovárica sobre los síntomas del síndrome de ovario poliquístico (SOPQ). Se encontraron 22 estudios que compararon tratamientos quirúrgicos y no quirúrgicos, y variaciones en la técnica quirúrgica. Los principales resultados medidos fueron mejoría en la regularidad de los períodos, y disminución en el crecimiento de pelo no deseado y el acné (síntomas androgénicos). También se consideraron los efectos perjudiciales del tratamiento, el cambio en el peso corporal, el cambio en los niveles de testosterona, los cambios en las medidas metabólicas y la calidad de vida.
Antecedentes
Las pacientes con SOPQ pueden tener una variedad amplia de problemas de salud que incluyen períodos poco frecuentes e irregulares, crecimiento de pelo no deseado y acné, así como fertilidad subnormal. Las preocupaciones de salud a largo plazo incluyen un aumento en el riesgo de cardiopatía, diabetes y desarrollo de enfermedad precancerosa de la matriz.
La mayoría de los estudios de investigación actuales han considerado el efecto de la cirugía ovárica para mejorar la fertilidad en las pacientes con SOPQ. Esta revisión tiene como objetivo considerar la repercusión de la cirugía ovárica laparoscópica (por mínimo acceso) (EOL) sobre la mejoría en los otros síntomas del SOPQ.
Fecha de la búsqueda
La evidencia está actualizada hasta octubre de 2016.
Características de los estudios
Se incluyeron 22 ensayos controlados aleatorios (ECA) con 2278 mujeres. Un ensayo controlado aleatorio es un tipo de experimento médico donde los participantes se asignan al azar a uno u otro tratamiento diferente en el estudio. Las participantes presentaban SOPQ y provenían de diferentes contextos en todo el mundo.
Diez de los 22 ECA compararon la EOL con tratamientos médicos. Estos tratamientos incluyeron metformina, clomifeno, gonadotrofinas, letrozol y rosiglitazona. Diez de 22 estudios compararon la EOL tradicional con variaciones en las técnicas quirúrgicas. Dos de 22 ECA consideraron el uso de diferentes niveles de energía o números de orificios por electropunción en el ovario durante la EOL.
Fuentes de financiación de los estudios
Dos estudios informaron su fuente de financiación (Farquhar 2002 ‐ apoyado en parte por la Auckland Medical Research Foundation; Sarouri 2015 ‐ los autores agradecen al Vicerrector de Investigación de la Guilan University of Medical Sciences la financiación de este proyecto).
Resultados clave
La EOL puede ser mejor para la regulación de los ciclos menstruales que las gonadotrofinas. Sin embargo, la mayoría de los médicos considerarían otras opciones para el tratamiento de primera línea. La EOL con cuatro o cinco electropunciones versus dos o menos por ovario puede ser más efectiva en la regulación menstrual de las pacientes con SOPQ.
No hubo suficiente evidencia para determinar si hay una diferencia entre la EOL y otro tratamiento o variaciones médicas en la técnica quirúrgica para mejorar la regularidad de los períodos o los síntomas androgénicos.
La EOL se asoció con menos efectos secundarios gastrointestinales en comparación con la metformina y el clomifeno, pero incluye una cirugía y no es el tratamiento estándar para los trastornos menstruales ni el crecimiento de pelo no deseado. Hubo menos tejido cicatrizal con la hidrolaparoscopia transvaginal en comparación con la EOL.
En general se puede considerar que la EOL tiene un bajo riesgo de efectos perjudiciales y es una opción en el tratamiento de los síntomas del SOPQ.
Calidad de la evidencia
La calidad de la evidencia varió de muy baja a moderada. Las limitaciones principales fueron la imprecisión asociada con el escaso número de estudios, la inconsistencia y el riesgo de sesgo asociado con la imposibilidad de cegar a las participantes (ocultarles el tipo de tratamiento). Hubo muy pocos estudios para evaluar el riesgo de sesgo de publicación.
Conclusiones de los autores
Summary of findings
| LOD compared to medical interventions for symptom relief in women with polycystic ovary syndrome | ||||||
| Patient or population: Women with symptoms of PCOS | ||||||
| Outcomes | Relative effect | Anticipated absolute effects* (95% CI) | Quality of the evidence | What happens | ||
| Without LOD | With LOD | Difference | ||||
| Menstrual regularity at 6 months LOD vs metformin LOD vs metformin + clomiphene LOD vs gonadotropins LOD vs letrozole LOD vs metformin + letrozole | Findings inconsistent and data unsuitable for pooling | Not calculable | ⊕⊝⊝⊝ | |||
| OR 1.02 | 70.6% | 71.0% | 0.4% more | ⊕⊕⊝⊝ | ||
| OR 19.20 | 11.1% | 70.6% | 59.5% more | ⊕⊕⊝⊝ | ||
| OR 1.08 | 68.8% | 70.4% | 1.6% more | ⊕⊕⊝⊝ | ||
| OR 0.95 | 52.1% | 50.8% | 1.3% fewer | ⊕⊕⊝⊝ | ||
| Improvement in androgenic symptoms at 6 months (hirsutism/acne) ‐ LOD vs metformin | OR 1.00 | 79.4% | 79.4% | 0.0% fewer | ⊕⊕⊝⊝ | |
| Improvement in androgenic symptoms at 6 months (hirsutism/acne) ‐ LOD vs gonadotrophins | Acne: OR 3.20 (0.33 to 30.94) Hirsutism: OR 2.31, (0.22 to 23.89) | See comments | ⊕⊝⊝⊝VERY LOW 1, 4 | Acne: 4/29 without LOD, 1/21 with LOD Hirsutism: 3/29 without LOD, 1/21 with LOD | ||
| Harms: GI Upset at 6 months ‐ LOD vs metformin + clomiphene Harms: OHSS rates at 6 months ‐ LOD vs gonadotrophins | OR 0.05 | 10.4% | 0.6% | 9.9% fewer | ⊕⊕⊕⊝ | |
| OR 0.08 | 25.0% | 2.6% | 22.4% fewer | ⊕⊕⊝⊝ | ||
| *The risk in the intervention group (and its 95% confidence interval) is based on the mean risk in the comparison group and the relative effect of the intervention (and its 95% CI). | ||||||
| GRADE Working Group grades of evidence | ||||||
| 1Downgraded one level for serious risk of bias: Included studies not double‐blinded, and in some cases methods of randomization unclear. | ||||||
| LOD compared to other surgical interventions for symptom relief in women with polycystic ovary syndrome | ||||||
| Patient or population: Women with symptoms of PCOS | ||||||
| Outcomes | Relative effect | Anticipated absolute effects* (95% CI) | Quality of the evidence | What happens | ||
| Without LOD | With LOD | Difference | ||||
| Menstrual regularity ‐ LOD vs unilateral LOD | OR 1.51 | 71.2% | 78.8% | 7.7% more | ⊕⊕⊕⊝ | 1 study follow‐up at 3 months. 1 study follow‐up at 12 months |
| Menstrual regularity at 6 months ‐ LOD vs ultrasound‐guided transvaginal ovarian drilling | OR 1.23 | 54.7% | 59.7% | 5.1% more | ⊕⊕⊝⊝ | |
| Menstrual regularity at 12 months | OR 2.13 | 88.2% | 94.1% | 5.9% more | ⊕⊕⊝⊝ | Note control group is NdYAG Laser |
| Improvement in androgenic symptoms at 6 months (Acne) ‐ LOD vs USS guided | OR 0.84 (0.20 to 3.5) | 47.1% | 42.7% | 4.3% fewer | ⊕⊕⊝⊝ | |
| Improvement in androgenic symptoms at 6 months (Hirsutism) ‐ LOD vs USS‐guided | OR 1.09 | 40.0% | 42.1% (16.7 to 72.3) | 2.1% more (23.3 fewer to 32.3 more) | ⊕⊕⊝⊝ | |
| Harms: Adhesions at 6 months ‐ LOD vs THL | OR 0.10 | 59.3% | 12.7% | 46.6% fewer | ⊕⊝⊝⊝ | |
| *The risk in the intervention group (and its 95% confidence interval) is based on the assumed risk in the comparison group and the relative effect of the intervention (and its 95% CI). | ||||||
| GRADE Working Group grades of evidence | ||||||
| 1Downgraded one level for serious risk of bias: Included studies not double‐blinded or unclear allocation concealment or unclear randomization method. | ||||||
| LOD 4 ‐ 5 punctures compared to 2 or fewer punctures for symptom relief in women with polycystic ovary syndrome | ||||||
| Patient or population: Women with symptoms of PCOS | ||||||
| Outcomes | Relative effect | Anticipated absolute effects* (95% CI) | Quality of the evidence | What happens | ||
| Without LOD 4‐5 | With LOD 4‐5 | Difference | ||||
| Menstrual regularity at 6 months ‐ LOD 4 ‐ 5 coagulation points compared to 2 or fewer | OR 16.04 | 13.9% | 72.1% | 58.2% more | ⊕⊕⊝⊝ | |
| Menstrual regularity at 6 months ‐ LOD (4 ‐ 5 laser coagulation points) vs 1 laser coagulation point per ovary | OR 19.00 | 5.0% | 50.0% | 45.0% more | ⊕⊕⊝⊝ | |
| Menstrual regularity at 6 months ‐ LOD 4 punctures vs 2 punctures per ovary | OR 14.00 | 25.0% | 82.4% | 57.4% more | ⊕⊕⊝⊝ | |
| Improvement in androgenic symptoms | No data available | |||||
| Harms LOD 4 ‐ 5 versus fewer punctures | No data available | |||||
| *The risk in the intervention group (and its 95% confidence interval) is based on the assumed risk in the comparison group and the relative effect of the intervention (and its 95% CI). | ||||||
| GRADE Working Group grades of evidence | ||||||
| 1Downgraded one level for serious risk of bias: Included studies not double‐blinded or methods of randomization unclear. | ||||||
| LOD compared to LOD variable energy for symptom relief in women with polycystic ovary syndrome | ||||||
| Patient or population: Women with symptoms of PCOS | ||||||
| Outcomes | Relative effect | Anticipated absolute effects* (95% CI) | Quality of the evidence | What happens | ||
| Without LOD | With LOD | Difference | ||||
| Menstrual regularity at 6 months ‐ LOD vs adjusted thermal dose | OR 0.42 | 87.9% | 75.4% | 12.6% fewer | ⊕⊝⊝⊝ | |
| Menstrual regularity at 3 months ‐ LOD unipolar vs LOD bipolar | OR 1.00 | 90.0% | 90.0% | 0.0% fewer | ⊕⊝⊝⊝ | Groups had different metabolic characteristics at baseline |
| Improvement in androgenic symptoms | No data available | |||||
| Harms: Adhesions at 6 months | OR 0.96 | 28.6% | 27.7% | 0.8% fewer | ⊕⊝⊝⊝ VERY LOW1, 2 | Women that remained enrolled for second‐look laparoscopy |
| *The risk in the intervention group (and its 95% confidence interval) is based on the assumed risk in the comparison group and the relative effect of the intervention (and its 95% CI). | ||||||
| GRADE Working Group grades of evidence | ||||||
| 1Downgraded one level for serious risk of bias: Included studies not double‐blinded or unclear allocation concealment. | ||||||
Antecedentes
Descripción de la afección
El síndrome de ovario poliquístico (SOPQ) es uno de los trastornos endocrinos más frecuentes en las mujeres en edad reproductiva. Habitualmente las pacientes presentarán trastornos menstruales, aumento en el crecimiento de pelo (hirsutismo), acné, períodos menstruales poco frecuentes o ausentes y subfertilidad. El SOPQ afecta aproximadamente al 10% de las mujeres en todo el mundo (Adams 1986; Homburg 2008).
Una proporción de las pacientes con SOPQ clínicamente presentará hirsutismo, acné y alopecia dependiente de los andrógenos. En las mujeres el hirsutismo se define como un aumento en el crecimiento de pelo terminal que sigue un patrón masculino. La prevalencia de signos clínicos de hiperandrogenismo en las pacientes en edad reproductiva está alrededor del 5% al 25% (Azziz 2000). Bioquímicamente se caracteriza por concentraciones séricas elevadas de andrógenos, en particular testosterona y androsteneidona. Estas características se asocian con hipersecreción de hormona luteinizante (LH) pero con concentraciones séricas normales o bajas de hormona foliculoestimulante (FSH). En el 80% de las pacientes con SOPQ, la concentración de testosterona excederá el límite superior de 2,4 nmol/l (Taylor 2003).
Con frecuencia las pacientes con SOPQ también presentan trastornos menstruales como menorragia y oligomenorrea. Se calcula que del 30% al 70% de las pacientes con SOPQ presentan obesidad (Vrbikova 2009), y muchas desarrollarán diabetes tipo 2, trastornos metabólicos y enfermedades cardiovasculares (Giallauria 2008; Kiddy 1992).
La reunión en Rotterdam en 2003 aprobó un consenso con respecto al diagnóstico del síndrome (ESHRE/ASRM PCOS Consensus 2004a; ESHRE/ASRM PCOS Consensus 2004b). Este consenso define al SOPQ, después de la exclusión de los trastornos relacionados, como una afección clínica que presenta al menos dos de las tres características siguientes: oligoanovulación o anovulación (períodos menstruales poco frecuentes o ausentes); signos clínicos o bioquímicos, o ambos, de hiperandrogenismo (habitualmente hirsutismo o acné); u ovarios poliquísticos observados en la ecografía.
Una reunión adicional en Grecia en 2007 propuso un tratamiento basado en la evidencia para el tratamiento de la subfertilidad relacionada con el SOPQ (Thessaloniki ESHRE/ASRM PCOS Consensus 2008). Sin embargo, una parte muy pequeña de las recomendaciones del consenso están dirigidas al tratamiento de los síntomas no relacionados con la fertilidad de esta afección.
El tratamiento conservador con asesoramiento sobre cambios en el estilo de vida como la acupuntura (Lim 2016), la dieta y la pérdida de peso tiene una efectividad variable. El tratamiento médico con estatinas (Raval 2011), terapia hormonal o agentes sensibilizadores a la insulina (Costello 2007) se puede asociar con efectos secundarios significativos y a menudo está contraindicado en las pacientes que desean concebir. La electropunción ovárica laparoscópica (EOL) es una alternativa quirúrgica al tratamiento médico de la anovulación en pacientes con SOPQ y subfertilidad. Sin embargo, aunque los estudios han examinado la efectividad de la EOL con respecto a la mejoría en la concepción, los informes sobre el efecto de la EOL sobre los síntomas del SOPQ no relacionados con la fertilidad son contradictorios.
Descripción de la intervención
La resección en cuña del ovario se describió por primera vez en 1935 por Stein y Leventhal (Homburg 2008). Esta cirugía tuvo como finalidad principal reducir la masa ovárica mediante resecciones en cuña bilaterales del ovario. Con el advenimiento de la cirugía laparoscópica, se desarrolló una variante de la resección tradicional en cuña con el uso de esta técnica. Durante la EOL se utiliza un electrocauterio unipolar o bipolar a diversos niveles de energía por una duración variable para puncionar el ovario. Dichas punciones tienen habitualmente de 2 a 4 mm de profundidad, y penetran en la corteza. El número de orificios de punción, el tipo de fuente de energía y la duración del tratamiento varían entre los profesionales sanitarios. Adelantos recientes en hidrolaparoscopia transvaginal también han permitido que la electropunción ovárica se realice por vía transvaginal (Gordts 2009), mediante un hidrolaparoscopio o fertiloscopio. Tradicionalmente la cirugía ovárica se realiza para inducir la ovulación en las pacientes anovulatorias con SOPQ. La ventaja documentada de la EOL en comparación con la terapia hormonal es la reducción de las tasas de complicación asociadas con el síndrome de hiperestimulación ovárica (SHEO) y la disminución en el riesgo de embarazo múltiple (Farquhar 2007).
De qué manera podría funcionar la intervención
Gran parte del mecanismo de acción de la cirugía ovárica, la resección en cuña o más generalmente la EOL no se ha explicado. En comparación con el tratamiento médico, donde el efecto del tratamiento depende de la administración continua de la medicación, muchos de los efectos inducidos por la EOL parecen ser a largo plazo. Sin embargo, no se sabe si la EOL ejerce su acción mediante un efecto directo sobre el ovario o a través de un mecanismo endocrino sistémico. Se ha mostrado que la EOL reduce las concentraciones séricas de andrógeno a largo plazo a través de varios mecanismos (Amer 2002). La destrucción del estroma ovárico que produce andrógeno y la reducción posterior del sustrato para la aromatización corticosteroide pueden contribuir a una reducción general en la producción de andrógeno, con mejorías en el acné y el hirsutismo. Los niveles altos de testosterona aumentan el crecimiento de pelo terminal y, por lo tanto, los inhibidores de la 5α‐reductasa se utilizan en el tratamiento del hirsutismo. Un aumento más generalizado en la actividad de la 5α‐reductasa puede ser importante para aumentar el metabolismo del cortisol en el SOPQ (Glintborg 2010). En la EOL, se ha formulado la hipótesis de que las electropunciones dentro del estroma que produce andrógeno pueden hacer que disminuyan las concentraciones séricas de andrógeno y proporcionar un alivio sintomático. Un posible mecanismo adicional es la repercusión de la EOL en la resistencia a la insulina. Aunque en la actualidad hay muy poca evidencia que documente el efecto de la EOL en los cambios metabólicos y los niveles de insulina en las pacientes con SOPQ, estudios pequeños han mostrado que la EOL (mediante electrocauterio) puede reducir la resistencia a la insulina en pacientes con SOPQ a través de la disminución de la fosforilación del IRS‐1 Ser312 (Seow 2007). Otros estudios más recientes también han indicado que la EOL puede reducir las concentraciones de la hormona anti‐mülleriana (AMH) y el flujo de sangre en el estroma ovárico en las pacientes con SOPQ en comparación con los controles (Elmashad 2011).
Por qué es importante realizar esta revisión
El objetivo de esta revisión es evaluar la repercusión de la cirugía ovárica en el control sintomático del SOPQ. Aunque muchos estudios de investigación se han centrado en el efecto de la cirugía ovárica para mejorar la fertilidad en las pacientes con SOPQ resistente al clomifeno, no se ha examinado la repercusión de la EOL en los síntomas del SOPQ.
Objetivos
Evaluar la efectividad y los efectos perjudiciales de la cirugía ovárica como tratamiento para el alivio sintomático del hirsutismo, el acné y los trastornos menstruales en las pacientes con SOPQ.
Métodos
Criterios de inclusión de estudios para esta revisión
Tipos de estudios
Solo se incluyeron los ensayos controlados aleatorios (ECA) de intervenciones quirúrgicas para el tratamiento de los síntomas asociados con el SOPQ. En este estudio se incluyeron solo los datos previos al cruzamiento de los estudios cruzados. Tampoco se incluyeron otros datos de los estudios cruzados, incluso aunque hubiera un período de lavado, ya que el efecto de la EOL es a largo plazo (por ejemplo, algunas pacientes ovularán regularmente después de un año).
Tipos de participantes
Pacientes con SOPQ (como se definió por el Rotterdam Criteria) sintomáticas con acné, hirsutismo o ciclos menstruales irregulares. La oligoamenorrea se definió en esta revisión como un ciclo menstrual que dura más de 45 días.
Tipos de intervenciones
Intervenciones quirúrgicas ováricas para el tratamiento sintomático de las pacientes con SOPQ. Los tipos de comparaciones incluidos son los siguientes:
1. Cirugía (laparotomía o laparoscopia) versus intervención no quirúrgica (placebo o ningún tratamiento).
2. Comparación entre diversos métodos o técnicas quirúrgicas, p.ej.:
-
comparación del número de orificios de electropunción realizados.
-
Comparación de diversas modalidades de energía para el procedimiento de electropunción ovárica (p.ej. electrocauterio unipolar versus bipolar, o electrocauterio versus láser versus bisturí armónico).
-
Laparotomía versus laparoscopia.
Tipos de medida de resultado
Resultados primarios
1. Tasas de pacientes que informan una mejoría en la regularidad menstrual como se definió por el número de ciclos por año (o a otro plazo, p.ej. seis meses) y registrado como regular o irregular.
2. Mejoría en los síntomas androgénicos del SOPQ o las tasas de síntomas androgénicos: mejorías en el hirsutismo o el acné, como se definió mediante sistemas de calificación como la Ferriman Gallwey Score (FGS), la Global Acne Grading Score (GAGS) o el Leeds revised Acne Grading system (LRAGS).
-
La FGS fracciona el cuerpo en nueve áreas identificadas para evaluación: el labio superior, el mentón, el tórax, la espalda superior, la espalda inferior, el abdomen superior, el abdomen inferior, la parte superior de los brazos y los muslos. A cada área se le asigna una puntuación entre 0 y 4 según el crecimiento del pelo, y se obtiene una posible puntuación de 0 a 36. En las poblaciones blancas una puntuación mayor de 7 indica hiperandrogenismo. Hay una variación étnica de lo "normal".
-
La GAGS divide la cara, el tórax y la espalda en seis áreas identificadas para evaluación: la frente, cada mejilla, la nariz, el mentón, el tórax y la espalda. A cada área se le asigna un factor de 1, 2 ó 3 según el área. A las lesiones de acné se les da un valor según la gravedad: ninguna lesión = 0, comedones = 1, pápulas = 2, pústulas = 3 y nódulos = 4, Las puntuaciones de 1 a 18 se consideran leve, 19 a 30 se consideran moderado, 31 a 38 son grave y más de 39 muy grave.
-
El LRAGS evalúa el acné en la cara, el tórax y la espalda. Se utiliza una escala de 1 a 10.
Resultados secundarios
1. Efectos perjudiciales de las intervenciones quirúrgicas y no quirúrgicas
2. Cambio en el peso corporal o el índice de masa corporal
3. Cambio en la circunferencia de la cintura
4. Niveles de testosterona, testosterona libre o índice de andrógeno libre
5. Medidas metabólicas: nivel de glucosa en ayunas o insulina o hemoglobina A1C (HbA1C)
6. Cambios en la calidad de vida
Results
Description of studies
Only pre‐cross‐over data from cross‐over studies were to be included in this review. We do not include other data from cross‐over studies, even if there is a wash‐out period, as the effect of LOD is long‐term (for example, some women will ovulate regularly after one year).
Results of the search
The search retrieved 1115 articles. Thirty‐one studies were potentially eligible and retrieved in full text, with 22 meeting our inclusion criteria and included in the final analysis. See study tables: Characteristics of included studies; Characteristics of excluded studies.
See Figure 1.
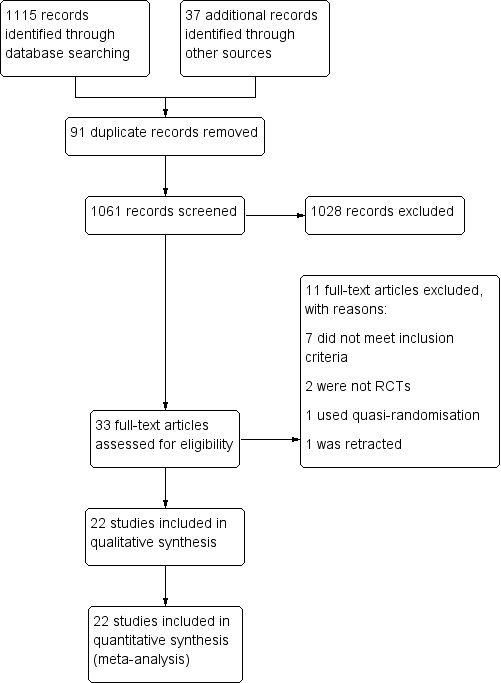
Study flow diagram
Included studies
Study Design and setting
22 randomized controlled trials included in this review were set in the high‐, middle‐ and low‐income countries, in private, public and university hospitals. All trials had a parallel design, and all but one were single‐centre studies.
Participants
The studies included 2278 women. All the participants had polycystic ovary syndrome. The characteristics of the participants can be found in the table for each included study. Participants were included regardless of whether their treatment goal was symptom management of PCOS or, more commonly, fertility outcomes.
Interventions
Ten of the 22 studies were designed to assess the impact of LOD on the outcome measures specified earlier, compared to a medical treatment. The comparisons were as follows:
Traditional LOD compared to;
-
Metformin (Ashrafinia 2009; Hamed 2010)
-
Metformin + clomiphene (Hashim 2011; Palomba 2010)
-
Gonadotrophins for ovulation induction (Kaya 2005; Farquhar 2002)
-
Letrozole (Hashim 2010)
-
Gonadotrophin analogue + the oral contraceptive pill (Taskin 1996)
-
Metformin + letrozole (Elgafor 2013)
-
Rosiglitazone (Roy 2010)
Ten of 22 studies were designed to assess the impact of LOD on the outcome measures specified compared to a different surgical technique/method of ovarian drilling. The comparisons were as follows:
Traditional LOD compared to;
-
Transvaginal ultrasound‐guided LOD (Badawy 2009)
-
Minilaparoscopic LOD (Zullo 2000)
-
Bipolar LOD (as opposed to unipolar) (Sharma 2006)
-
Unilateral LOD (Abdelhafeez 2013; Roy 2009; Sarouri 2015; Youssef 2007)
-
Harmonic scalpel LOD (Takeuchi 2002)
-
Transvaginal hydrolaparoscopy (THL) (Giampaolino 2016)
-
LOD using adjusted thermal dose in accordance with the ovarian volume (Zakherah 2011)
Two of 22 studies were head‐to‐head comparisons between different dosage/number of punctures of LOD (Selim 2011; Zhu 2010)
No studies compared LOD with no treatment/placebo, or laparotomy. No studies compared LOD to wedge resection.
Outcomes
The following studies reported on the specified outcome measures in this review:
1. Menstrual regularity: Abdelhafeez 2013; Ashrafinia 2009; Badawy 2009; Elgafor 2013; Hamed 2010; Hashim 2010; Hashim 2011; Kaya 2005; Palomba 2010; Roy 2009; Selim 2011; Takeuchi 2002; Zakherah 2011; Zhu 2010
2. Androgenic symptoms: Ashrafinia 2009; Badawy 2009; Farquhar 2002
3. Harms of surgical intervention: short‐ and long‐term surgical complications:
-
Adverse events relating to surgery: Zullo 2000; Zhu 2010
-
Ovarian hyperstimulation syndrome (OHSS): Kaya 2005; Roy 2010
-
Post‐surgical adhesions: Giampaolino 2016; Roy 2009; Zakherah 2011
-
Gastrointestinal side effects of metformin + clomiphene: Hashim 2011; Palomba 2010
4. Body weight or body mass index (kg/m2): Elgafor 2013; Hamed 2010; Farquhar 2002; Zakherah 2011
5. Change in waist circumference: None of the studies reported on waist circumference.
6. Testosterone levels (nmol/l), free testosterone (pg/ml) or free androgen index: Ashrafinia 2009; Badawy 2009; Elgafor 2013; Hamed 2010; Roy 2009; Roy 2010; Sarouri 2015; Selim 2011; Sharma 2006; Takeuchi 2002; Taskin 1996; Youssef 2007; Zakherah 2011; Zhu 2010; Zullo 2000
7. Metabolic measures: fasting glucose (nmol/L) or insulin levels (pmol/L) or haemoglobin A1C (HbA1C): Elgafor 2013; Hamed 2010; Roy 2010
8. Quality of life: Farquhar 2002 provided a questionnaire on the acceptability and convenience of both procedures.
Excluded studies
We excluded nine studies from the review. Reasons for exclusion include studies not being RCTs (three studies), one study was retracted, one study did not measure testosterone as planned, and the remainder did not meet our inclusion criteria.
Risk of bias in included studies
Risk of bias assessment focused on seven main domains: random sequence generation, allocation concealment, blinding, incomplete data outcome, selective reporting and other potential bias. The findings are summarized in Figure 2 and Figure 3, and details appear in individual 'Risk of bias' included studies tables.

Risk of bias graph: review authors' judgements about each risk of bias item presented as percentages across all included studies.
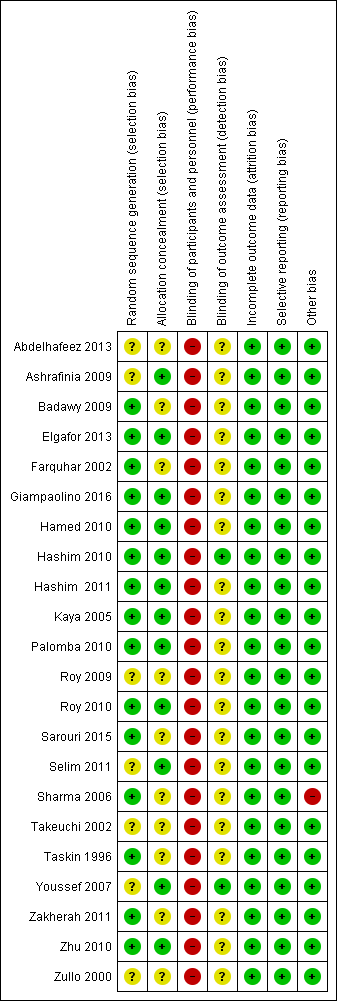
Risk of bias summary: review authors' judgements about each risk of bias item for each included study.
Allocation
Sequence generation
Eighteen trials were at low risk of selection bias related to sequence generation. Four studies had unclear risk due to a lack of detail about their methods of sequence generation.
Allocation concealment
Twelve trials were at low risk of bias for allocation concealment, with the other 10 trials at unclear risk of bias.
Blinding
Blinding of participants
Due to the nature of the studies, blinding was often not possible. Fourteen trials had no means of blinding due to the surgical study design and so were at high risk of performance and detection bias; the remaining eight trials were deemed to be at high risk as they stated a lack of participant blinding.
Blinding of assessment
Most of the studies (20/22) were at unclear risk of assessment blinding. Two studies were at low risk, as they specified that the assessors were blinded.
Incomplete outcome data
Attrition rates in all studies were low and hence we rated all studies at low risk for this domain. One study (Giampaolino 2016) had attrition rates of 45/246, with 19 lost from one arm and 26 from the other.
Selective reporting
All the studies reported on the outcome specified.
Other potential sources of bias
One study (Sharma 2006) showed a statistically significant difference in baseline levels of glucose between the control and intervention groups.
Effects of interventions
See: Summary of findings for the main comparison LOD compared to medical interventions for symptom relief in women with polycystic ovary syndrome; Summary of findings 2 LOD compared to other surgical interventions for symptom relief in women with polycystic ovary syndrome; Summary of findings 3 LOD 4‐5 compared to 2 or fewer punctures for symptom relief in women with polycystic ovary syndrome; Summary of findings 4 LOD compared to LOD variable energy for symptom relief in women with polycystic ovary syndrome
We include 22 studies in this review.
As the studies were sufficiently similar, we combined the data using a fixed‐effect model in the following comparisons:
-
LOD versus medical interventions (stratified by type of medication)
-
LOD versus other surgical interventions (stratified by type of surgery)
-
LOD with four to five punctures versus LOD with two or fewer punctures
-
LOD versus variable energy
1. LOD versus medical treatments
Primary outcomes
1.1 Improvement of menstrual regularity
Seven studies reported this outcome. We did not pool studies comparing different medications, as this resulted in high statistical heterogeneity (I2 = 66%). We interpret the underlying cause of the heterogeneity to be attributable to the differences between the interventions.
1.1.1. LOD versus metformin: Two studies reported this comparison. Findings were inconsistent and the data were unsuitable for pooling due to high statistical heterogeneity (I2=85%). There was no obvious difference between the studies that might explain the heterogeneity. One study (Hamed 2010) suggested a benefit in the LOD arm (OR 2.32, 95% CI 1.02 to 5.28, 110 women) while the other study (Ashrafinia 2009) had the opposite direction of effect but found no conclusive evidence of a difference between the groups (OR 0.55, 95% CI 0.27 to 1.13, 126 women). See Analysis 1.1; Figure 4.
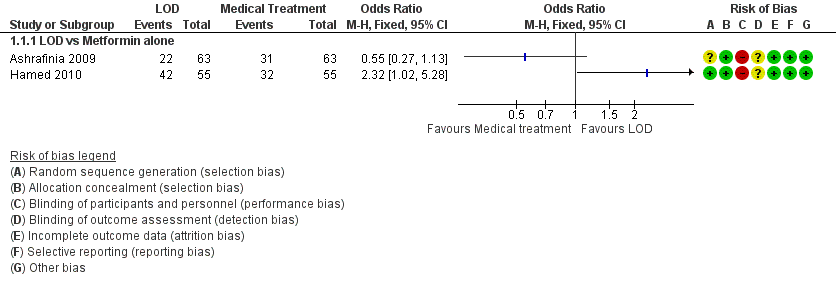
Forest plot of comparison: 1 LOD vs medical interventions, outcome: 1.1 Menstrual regularity.
1.1.2. LOD versus metformin + clomiphene: There was no clear evidence of a difference between the groups at six months (OR 1.02, 95% CI 0.64 to 1.64, 2 RCTs, n = 332, I2 = 13%, low‐quality evidence) (Hashim 2011; Palomba 2010).
1.1.3 LOD versus gonadotrophin: One study showed evidence of benefit of LOD over gonadotrophin at six months (OR 19.20, 95% CI 3.17 to 116.45, 1 RCT, n = 35, low‐quality evidence) (Kaya 2005).
1.1.4. LOD versus letrozole: There was no clear evidence of a difference between the groups at six months (OR 1.08, 95% CI 0.64 to 1.84, 1 RCT, n = 260, moderate‐quality evidence) (Hashim 2010).
1.1.5. LOD versus metformin + letrozole: There was no clear evidence of a difference between the groups at six months (OR 0.95, 95% CI 0.49 to 1.81, 1 RCT, n = 146, moderate‐quality evidence) (Elgafor 2013).
See Analysis 1.2; Figure 5

Forest plot of comparison: 1 LOD vs medical interventions, outcome: 1.2 Menstrual regularity.
1.2 Improvement of androgenic symptoms (hirsutism or acne, or both)
1.2.1. LOD versus metformin: There was no clear evidence of a difference between the groups at six months (OR 1.00, 95% CI 0.42 to 2.37, 1 RCT, n = 126, moderate‐quality evidence) (Ashrafinia 2009).
1.2.2. LOD versus gonadotrophins: There was no clear evidence of a difference between the groups in improvement of acne (OR 3.20, 95% CI 0.33 to 30.94, 1 RCT, n = 25, low‐quality evidence) or hirsutism at six months (OR 2.31, 95% CI 0.22 to 23.89, 1 RCT, n = 25, very low‐quality evidence) (Farquhar 2002).
Secondary outcomes
1.3 Harms
1.3.1. LOD versus metformin + clomiphene: There were more gastrointestinal side effects in the metformin + clomiphene group at six months (OR 0.05, 95% CI 0.01 to 0.36, 2 RCTs, n = 332 I2 = 0%, moderate‐quality evidence) (Hashim 2011; Palomba 2010).
1.3.2. LOD versus gonadotrophin: There was no clear evidence of a difference between the groups in OHSS rate at six months (OR 0.08, 95% CI 0.00 to 1.61, 1 study, n = 33, low‐quality evidence) (Kaya 2005).
1.3.3. LOD versus rosiglitazone: There was no occurrence of OHSS in either group at six months (Roy 2010).
1.4 Body weight or body mass index (kg/m2)
1.4.1. LOD versus metformin: There was a higher body mass index (BMI) at six months follow‐up in the LOD group compared to the metformin group (MD 3.60, 95% CI ‐6.28 to 13.48, 1 RCT, n = 110) (Hamed 2010).
1.4.2. LOD versus metformin + letrozole: There was no clear evidence of a difference in BMI at six months follow‐up between groups (MD 0.47, 95% CI ‐0.90 to 1.84, 1 RCT, n = 146) (Elgafor 2013).
1.5 Waist circumference
None of the studies reported on waist circumference.
1.6 Testosterone levels (nmol/L), free testosterone (pg/ml) or free androgen index
1.6.1. LOD versus metformin: There was no clear evidence of a difference in free testosterone levels post‐surgery at six months follow‐up, (MD ‐0.34, 95% CI ‐0.46 to ‐0.22; n = 126 ; 1 RCT) (Ashrafinia 2009) There was no clear evidence of a difference in mean testosterone levels post‐surgery at six months follow‐up, (MD 0.20, 95% CI ‐0.61 to 1.01, 1 RCTs, n = 110) Hamed 2010).
1.6.2. LOD versus gonadotropin‐releasing hormone antagonist (GnRHa) + oral contraceptive pill (OCP): There was a higher testosterone level one week post‐surgery or at the first menstruation after treatment in the LOD group compared to the GnRHa + OCP group (MD 0.3, 95% CI 0.01 to 0.59, 1 RCT, n = 17) (Taskin 1996).
1.6.3. LOD versus metformin + letrozole: There was a higher testosterone level after LOD compared to metformin + letrozole use (MD 0.60, 95% CI 0.23 to 0.97, 1 RCT, n = 146) (Elgafor 2013).
1.6.4. LOD versus rosiglitazone: There was no clear evidence of a difference between the groups in testosterone levels between rosiglitazone and LOD (MD 0.08, 95% CI ‐0.11 to 0.27, 1 RCT, n = 43) (Roy 2010).
1.7 Metabolic measures: fasting glucose or insulin levels or ratios or haemoglobin A1C (HbA1C)
1.7.1. LOD versus rosiglitazone: There was a lower glucose/insulin ratio in the LOD group compared to the rosiglitazone group (MD ‐1.98, 95% CI ‐2.61 to ‐1.35, 1 RCT, n = 43) (Roy 2010).
1.7.2. LOD versus metformin: There was a lower glucose/insulin ratio in the LOD group compared to the metformin group (MD ‐2.60, 95% CI ‐4.55 to ‐0.65, 1 RCT, n = 110) (Hamed 2010).
1.7.3. LOD versus metformin + letrozole: There was a lower glucose/insulin ratio in the LOD group compared to the metformin + letrozole group (MD ‐1.35, 95% CI ‐2.21 to ‐0.49, 1 RCT, n = 146) (Elgafor 2013).
1.8 Quality of life
1.8.1. LOD versus gonadotrophins: Farquhar 2002 provided a questionnaire to the 19 women who underwent both LOD and gonadotrophins regarding the acceptability and convenience of both procedures. Seventeen returned the questionnaire; 15 women preferred LOD and two preferred gonadotrophins. LOD was described as "less traumatic".
2. Bilateral LOD versus other surgical techniques
Primary outcomes
2.1 Improvement of menstrual regularity
2.1.1. LOD versus unilateral LOD: There was no clear evidence of a difference between the groups (OR 1.51, 95% CI 0.62 to 3.71, 2 RCTs, n = 104, I2 = 0%, moderate‐quality evidence) (Abdelhafeez 2013; Roy 2009). Abdelhafeez 2013 reported at follow‐up of three months (OR 1.41, 95% CI 0.45 to 4.45, 1 RCT, n = 60), while Roy 2009 reported at follow‐up of 12 months (OR 1.69, 95% CI 0.40 to 7.07, 1 RCT, n = 44). We have pooled these data, as they are otherwise similar studies.
2.1.2. LOD versus transvaginal ultrasound‐guided LOD: There was no clear evidence of a difference between the groups at six months (OR 1.23, 95% CI 0.64 to 2.37, 1 RCT, n = 147, low‐quality evidence) (Badawy 2009).
2.1.3. LOD with Hd‐YAG laser versus LOD with harmonic scalpel: There was no clear evidence of a difference between the groups at 12 months (OR 2.13, 95% CI 0.17 to 26.03, 1 RCT, n = 34, low‐quality evidence) (Takeuchi 2002).
See Analysis 2.1; Figure 6.
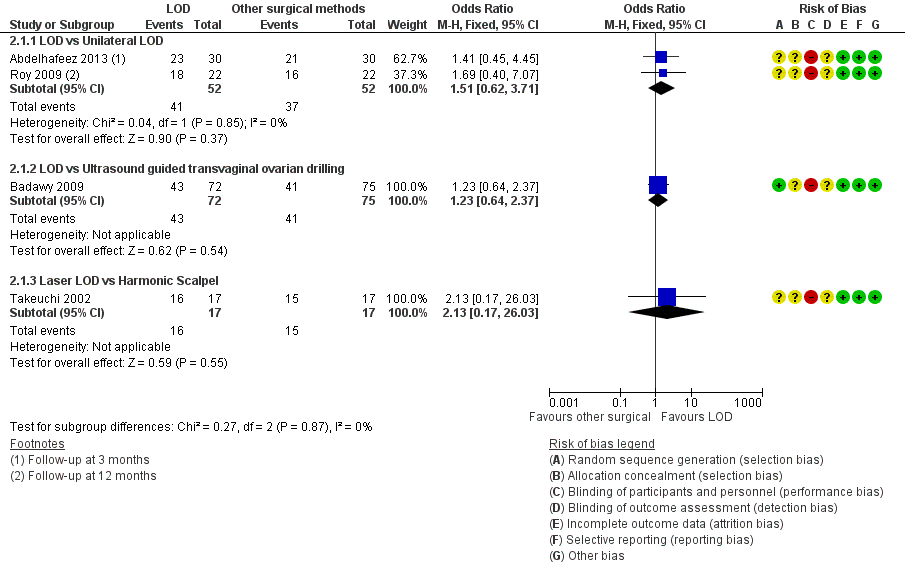
Forest plot of comparison: 2 LOD vs other surgical interventions, outcome: 2.1 Menstrual regularity.
2.2 Improvement of androgenic symptoms (hirsutism or acne, or both)
LOD versus transvaginal ultrasound‐guided LOD: There was no clear evidence of a difference between the groups in hirsutism (OR 1.09, 95% CI 0.30 to 3.91, 1 RCT, n = 39, low‐quality evidence) or acne at six months (OR 0.84, 95% CI 0.20 to 3.50, 1 RCT, n = 31, low‐quality evidence) (Badawy 2009).
Secondary outcomes
2.3 Harms
2.3.1. LOD versus unilateral LOD: There were no post‐surgical peri‐ovarian adhesions found in a subgroup of women who returned for repeat laparoscopy or caesarean section up to 12 months post‐intervention (Roy 2009).
2.3.2. LOD versus minilaparoscopic LOD under local anaesthetic and conscious sedation: There were no complications from local anaesthetic (Zullo 2000).
2.3.3 LOD versus transvaginal hydrolaparoscopy: There were significantly fewer women with post‐procedure adhesions with THL compared to LOD at six months (OR 0.10, 95% CI 0.05 to 0.18, 1 RCT, n = 246, very low‐quality evidence) (Giampaolino 2016).
2.4 Body weight or body mass index (kg/m2)
None of the studies reported on this outcome.
2.5 Waist circumference
None of the studies reported on this outcome.
2.6 Testosterone levels (nmol/L), free testosterone (pg/ml) or free androgen index
2.4.1. LOD versus transvaginal ultrasound‐guided LOD: The mean testosterone levels were found to be higher in the LOD group compared to the ultrasound‐guided transvaginal LOD group (MD 0.30, 95% CI 0.13 to 0.47, 1 RCT, n = 163) (Badawy 2009).
2.4.2. LOD versus minilaparoscopic LOD under local anaesthetic and conscious sedation: There was no clear evidence of a difference between the groups (MD 0.00, 95% CI ‐0.43 to 0.43, 1 RCT, n = 62) (Zullo 2000).
2.4.3. LOD versus unilateral LOD: There was no clear evidence of a difference in mean testosterone between the groups (MD 0.03, 95% CI ‐0.04 to 0.09, 2 RCTs, n = 112, I2 = 0%) (Roy 2009; Youssef 2007). There was no clear evidence in free testosterone between the groups (MD ‐0.30, 95% CI ‐0.84 to 0.24, 1 RCTs, n = 90) (Sarouri 2015).
2.4.4. LOD with Hd‐YAG Laser versus LOD with harmonic scalpel: There was no clear evidence of difference between the groups (MD 0.0, 95% CI ‐0.28 to 0.28, 1 RCT, n = 34) (Takeuchi 2002).
2.7 Metabolic measures: fasting glucose or insulin levels or ratio or haemoglobin A1C (Hb1AC)
None of the studies reported on this outcome.
2.8 Quality of life
None of the studies reported on this outcome.
3. LOD with different numbers of punctures per ovary
Primary outcomes
3.1 Improvement of menstrual regularity
LOD four to five punctures versus two or fewer punctures per ovary: There is evidence of benefit of applying four or five punctures per ovary compared to two or fewer punctures at six months (OR 16.04, 95% CI 4.19 to 61.34, 2 RCTs, n = 73, I2 = 0%, low‐quality evidence) (Zhu 2010; Selim 2011).
See Analysis 3.1; Figure 7.
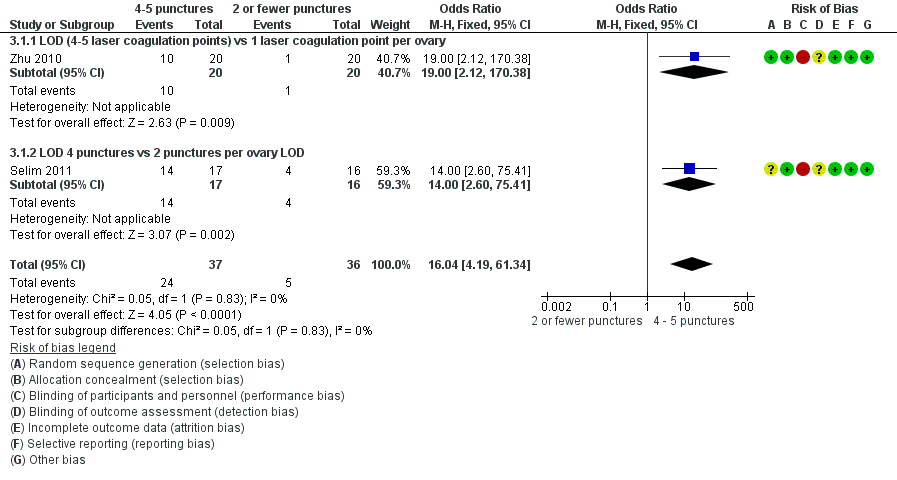
Forest plot of comparison: 3 LOD 4 ‐ 5 vs 2 or fewer punctures, outcome: 3.1 Menstrual regularity.
3.2 Improvement of androgenic symptoms (hirsutism or acne, or both)
None of the studies reported on this outcome.
Secondary outcomes
3.3 Harms
LOD four to five punctures versus two or fewer punctures: There were no surgical adverse events in any group (Zhu 2010).
3.4 Body weight or body mass index (kg/m2)
None of the studies reported on this outcome.
3.5 Waist circumference
None of the studies reported on this outcome.
3.6 Testosterone levels (nmol/L) or free androgen index
Testosterone
3.6.1. LOD four to five punctures versus two or fewer punctures: There is evidence of a difference in applying more punctures per ovary compared to two or fewer punctures (MD ‐0.90, 95% CI ‐1.12 to ‐0.68, 2 RCTs, n = 73, I2 = 0%) (Selim 2011; Zhu 2010) (Analysis 3.2).
Free androgen index (FAI)
3.6.2. LOD four to five punctures versus two or fewer punctures: There was no clear evidence of a difference between the groups (MD ‐1.50, 95% CI ‐3.21 to 0.21, 1 RCT, n = 33) (Selim 2011) (Analysis 3.2).
3.7 Metabolic measures: fasting glucose or insulin levels or haemoglobin A1C (HbA1C)
None of the studies reported on this outcome.
3.8 Quality of life
None of the studies reported on this outcome.
4. LOD with various energy modalities
Primary outcomes
4.1 Improvement of menstrual regularity
4.1.1. LOD versus LOD using adjusted thermal dose in accordance with the ovarian volume: There was no clear evidence of a difference between the groups at six months (OR 0.42, 95% CI 0.16 to 1.14, 1 RCT, n = 115, very low‐quality evidence) (Zakherah 2011).
4.1.2. Unipolar LOD versus bipolar LOD: There was no clear evidence of a difference between the groups at three months (OR 1.00, 95% CI 0.05 to 18.57, 1 RCT, n = 20, very low‐quality evidence) (Sharma 2006).
See Analysis 4.1; Figure 8.

Forest plot of comparison: 4 LOD vs LOD variable energy, outcome: 4.1 Menstrual regularity.
4.2 Improvement of androgenic symptoms (hirsutism or acne, or both)
None of the studies reported on this outcome.
Secondary outcomes
4.3 Harms
LOD versus LOD using adjusted thermal dose in accordance with ovarian volume: There was no clear evidence of a difference between the groups in the adhesions found at second‐look laparoscopy at six months (OR 0.96, 95% CI 0.32 to 2.88, 1 RCT, n = 64, very low‐quality evidence) (Zakherah 2011).
4.4 Body weight or body mass index (kg/m2)
LOD versus LOD using adjusted thermal dose in accordance with ovarian volume: There was no clear evidence of a difference between the groups (MD 0.20, 95% CI ‐0.71 to 1.11, 1 RCT, n = 115) (Zakherah 2011).
4.5 Waist circumference
None of the studies reported on this outcome.
4.6 Testosterone levels (nmol/L) or free androgen index
4.6.1. LOD versus LOD using adjusted thermal dose in accordance with ovarian volume: Testosterone levels were lower in the thermal dose group (MD 0.70, 95% CI 0.57 to 0.83, 1 RCT, n = 115) (Zakherah 2011) (Analysis 4.4).
4.6.2. Unipolar LOD versus bipolar LOD: There was no clear evidence of a difference between the groups in the testosterone levels (MD 0.30, 95% CI ‐2.01 to 2.61, 1 RCT, n = 20) (Sharma 2006) (Analysis 4.4).
4.7 Metabolic measures: fasting glucose or insulin levels or haemoglobin A1C (HbA1C)
4.5.1. Unipolar LOD versus bipolar LOD: There was a significantly lower glucose insulin ratio at three months after surgery in the group who had unipolar LOD compared to those with bipolar LOD (MD 4.10, 95% CI 3.08 to 5.12, 1 RCT, n = 20) (Sharma 2006). However, in this study there was a significant disparity between the baseline characteristics of the glucose insulin ratio between the two groups.
4.8 Quality of life
None of the studies reported on this outcome.
5. LOD versus laparotomy
There were no studies that investigated this.
Other analyses
Upon completing study selection and data extraction we considered no subgroups to be relevant to our analysis.
We conducted sensitivity analyses as planned. The sensitivity analyses resulted in no significant modification of the results or the strength of associations after applying the above considerations to our data. No imputation of data was required. We are unable to address publication bias in this review.
Discusión
Resumen de los resultados principales
En las pacientes con irregularidad menstrual, acné o hirsutismo debido a SOPQ hubo evidencia de efectos beneficiosos de la EOL sobre la gonadotrofina, y de un número alto de punciones versus un escaso número de punciones en la regularidad menstrual. Estos resultados se basaron en uno y dos ECA respectivamente. Como es poco probable que las gonadotrofinas se prescriban exclusivamente para estas indicaciones, es importante señalar que estos resultados son secundarios.
No hubo evidencia clara de una diferencia en las tasas de mejoría en la regularidad menstrual ni en los síntomas androgénicos cuando la EOL se comparó con otras intervenciones médicas o quirúrgicas.
Los estudios informaron efectos adversos leves con la EOL y la metformina y el clomifeno se asocian con mayores efectos secundarios gastrointestinales en comparación con la EOL. Debido a la evidencia que apoya que la metformina tiene efectos beneficiosos en la mejoría de la regularidad menstrual (Tang 2012), la EOL se puede considerar una opción no inferior pero invasiva en las pacientes que no pueden tolerar la metformina.
Hubo significativamente menos adherencias posteriores al procedimiento con la hidrolaparoscopia transvaginal en comparación con la EOL, pero este resultado se basó en un único ECA.
Compleción y aplicabilidad general de las pruebas
Los estudios incluidos analizaron la pregunta de la revisión y todas las participantes y los resultados fueron relevantes. Ciertas comparaciones de la técnica quirúrgica no serán relevantes en centros donde el equipo no esté disponible. No hubo estudios que compararan la EOL versus ningún tratamiento y, por lo tanto, en esta revisión solo fue posible establecer conclusiones de las comparaciones directas de la EOL con los tratamientos médicos o quirúrgicos. La evidencia actual en gran parte está limitada por los datos obtenidos a partir de estudios controlados aleatorios únicos o escasos. Cuando se consulta una mujer con síntomas de SOPQ, es necesario aplicar esta evidencia en el contexto más amplio de sus síntomas y objetivos, ya que ni la EOL ni las intervenciones médicas se consideran tratamientos de primera línea. Sin embargo, pueden haber efectos beneficiosos adicionales si por otra parte se indican estas intervenciones; estos efectos beneficiosos deben formar parte de la orientación a las pacientes y pueden guiar ciertas decisiones.
Calidad de la evidencia
La calidad de la evidencia varió de muy baja a moderada. Las limitaciones principales fueron la imprecisión asociada con el escaso número de estudios, la inconsistencia y el riesgo de sesgo asociado con la imposibilidad de cegar a las participantes (ver Resumen de los hallazgos para la comparación principal; Resumen de los hallazgos 2; Resumen de los hallazgos 3; Resumen de los hallazgos 4). El riesgo de sesgo de realización en los estudios individuales fue alto debido a la falta de cegamiento de los evaluadores de resultado, que es de esperar en las comparaciones quirúrgicas. Hubo muy pocos estudios para evaluar el riesgo de sesgo de publicación. Otros sesgos fueron poco frecuentes, con la excepción de Sharma 2006 que se consideró con alto riesgo de otro sesgo debido a una disparidad significativa en las características iniciales del cociente glucosa/insulina.
Sesgos potenciales en el proceso de revisión
Se realizó una búsqueda inclusiva, que redujera al mínimo en la medida de lo posible, la identificación incompleta de estudios y el riesgo de sesgo de informe. Se hizo todo lo posible para identificar todos los estudios potencialmente elegibles, y cuando fue necesario, se buscaron datos adicionales de los autores de los estudios. Sin embargo, es posible que haya estudios no publicados que no se recuperaron.
Acuerdos y desacuerdos con otros estudios o revisiones
No se encontraron otros estudios o revisiones sobre este tema.
Risk of bias graph: review authors' judgements about each risk of bias item presented as percentages across all included studies.
Risk of bias summary: review authors' judgements about each risk of bias item for each included study.
Forest plot of comparison: 1 LOD vs medical interventions, outcome: 1.1 Menstrual regularity.
Forest plot of comparison: 1 LOD vs medical interventions, outcome: 1.2 Menstrual regularity.
Forest plot of comparison: 2 LOD vs other surgical interventions, outcome: 2.1 Menstrual regularity.
Forest plot of comparison: 3 LOD 4 ‐ 5 vs 2 or fewer punctures, outcome: 3.1 Menstrual regularity.
Forest plot of comparison: 4 LOD vs LOD variable energy, outcome: 4.1 Menstrual regularity.

Comparison 1 LOD vs medical interventions, Outcome 1 Menstrual regularity.
Comparison 1 LOD vs medical interventions, Outcome 2 Menstrual regularity.
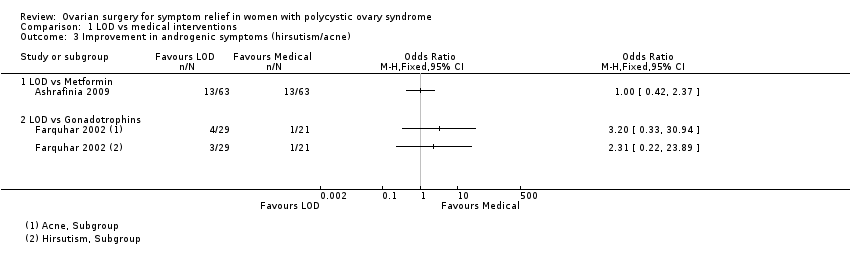
Comparison 1 LOD vs medical interventions, Outcome 3 Improvement in androgenic symptoms (hirsutism/acne).

Comparison 1 LOD vs medical interventions, Outcome 4 Harms.

Comparison 1 LOD vs medical interventions, Outcome 5 BMI.

Comparison 1 LOD vs medical interventions, Outcome 6 Testosterone and free androgen index.
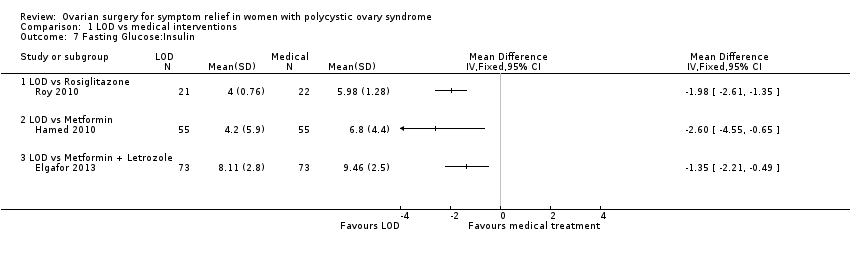
Comparison 1 LOD vs medical interventions, Outcome 7 Fasting Glucose:Insulin.

Comparison 2 LOD vs other surgical interventions, Outcome 1 Menstrual regularity.
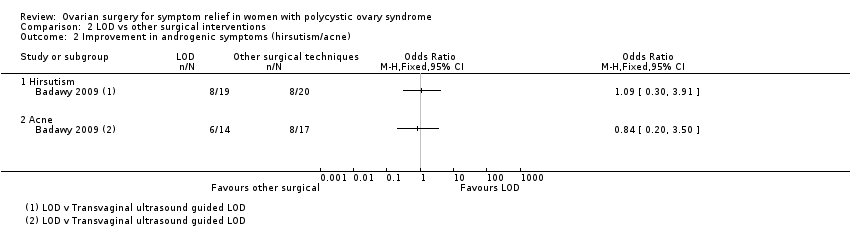
Comparison 2 LOD vs other surgical interventions, Outcome 2 Improvement in androgenic symptoms (hirsutism/acne).
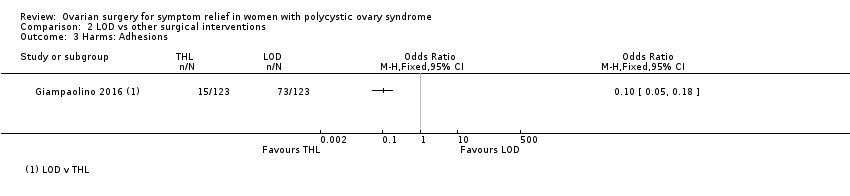
Comparison 2 LOD vs other surgical interventions, Outcome 3 Harms: Adhesions.

Comparison 2 LOD vs other surgical interventions, Outcome 4 Testosterone and free androgen index.
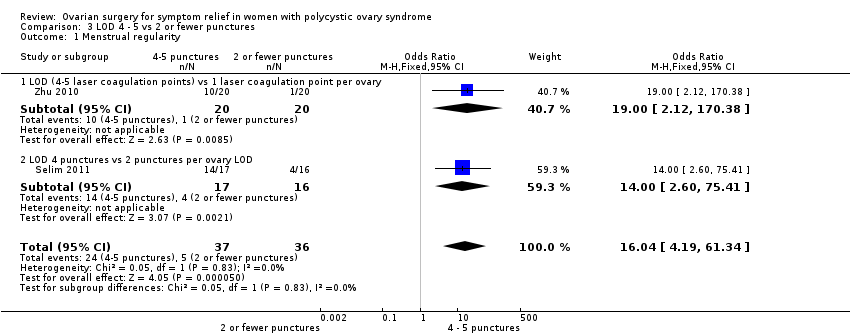
Comparison 3 LOD 4 ‐ 5 vs 2 or fewer punctures, Outcome 1 Menstrual regularity.

Comparison 3 LOD 4 ‐ 5 vs 2 or fewer punctures, Outcome 2 Testosterone and free androgen index.
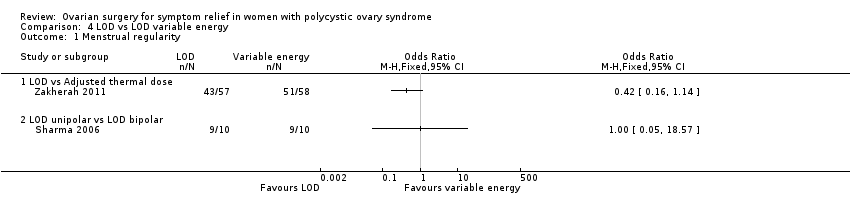
Comparison 4 LOD vs LOD variable energy, Outcome 1 Menstrual regularity.
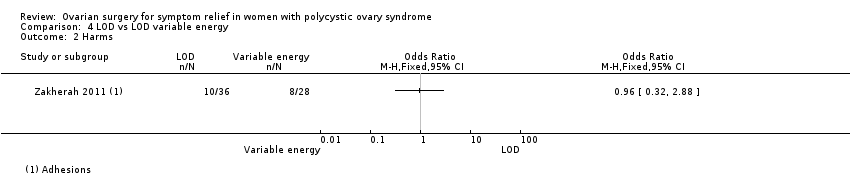
Comparison 4 LOD vs LOD variable energy, Outcome 2 Harms.

Comparison 4 LOD vs LOD variable energy, Outcome 3 BMI.

Comparison 4 LOD vs LOD variable energy, Outcome 4 Testosterone and free androgen index.

Comparison 4 LOD vs LOD variable energy, Outcome 5 Metabolic measures.
| LOD compared to medical interventions for symptom relief in women with polycystic ovary syndrome | ||||||
| Patient or population: Women with symptoms of PCOS | ||||||
| Outcomes | Relative effect | Anticipated absolute effects* (95% CI) | Quality of the evidence | What happens | ||
| Without LOD | With LOD | Difference | ||||
| Menstrual regularity at 6 months LOD vs metformin LOD vs metformin + clomiphene LOD vs gonadotropins LOD vs letrozole LOD vs metformin + letrozole | Findings inconsistent and data unsuitable for pooling | Not calculable | ⊕⊝⊝⊝ | |||
| OR 1.02 | 70.6% | 71.0% | 0.4% more | ⊕⊕⊝⊝ | ||
| OR 19.20 | 11.1% | 70.6% | 59.5% more | ⊕⊕⊝⊝ | ||
| OR 1.08 | 68.8% | 70.4% | 1.6% more | ⊕⊕⊝⊝ | ||
| OR 0.95 | 52.1% | 50.8% | 1.3% fewer | ⊕⊕⊝⊝ | ||
| Improvement in androgenic symptoms at 6 months (hirsutism/acne) ‐ LOD vs metformin | OR 1.00 | 79.4% | 79.4% | 0.0% fewer | ⊕⊕⊝⊝ | |
| Improvement in androgenic symptoms at 6 months (hirsutism/acne) ‐ LOD vs gonadotrophins | Acne: OR 3.20 (0.33 to 30.94) Hirsutism: OR 2.31, (0.22 to 23.89) | See comments | ⊕⊝⊝⊝VERY LOW 1, 4 | Acne: 4/29 without LOD, 1/21 with LOD Hirsutism: 3/29 without LOD, 1/21 with LOD | ||
| Harms: GI Upset at 6 months ‐ LOD vs metformin + clomiphene Harms: OHSS rates at 6 months ‐ LOD vs gonadotrophins | OR 0.05 | 10.4% | 0.6% | 9.9% fewer | ⊕⊕⊕⊝ | |
| OR 0.08 | 25.0% | 2.6% | 22.4% fewer | ⊕⊕⊝⊝ | ||
| *The risk in the intervention group (and its 95% confidence interval) is based on the mean risk in the comparison group and the relative effect of the intervention (and its 95% CI). | ||||||
| GRADE Working Group grades of evidence | ||||||
| 1Downgraded one level for serious risk of bias: Included studies not double‐blinded, and in some cases methods of randomization unclear. | ||||||
| LOD compared to other surgical interventions for symptom relief in women with polycystic ovary syndrome | ||||||
| Patient or population: Women with symptoms of PCOS | ||||||
| Outcomes | Relative effect | Anticipated absolute effects* (95% CI) | Quality of the evidence | What happens | ||
| Without LOD | With LOD | Difference | ||||
| Menstrual regularity ‐ LOD vs unilateral LOD | OR 1.51 | 71.2% | 78.8% | 7.7% more | ⊕⊕⊕⊝ | 1 study follow‐up at 3 months. 1 study follow‐up at 12 months |
| Menstrual regularity at 6 months ‐ LOD vs ultrasound‐guided transvaginal ovarian drilling | OR 1.23 | 54.7% | 59.7% | 5.1% more | ⊕⊕⊝⊝ | |
| Menstrual regularity at 12 months | OR 2.13 | 88.2% | 94.1% | 5.9% more | ⊕⊕⊝⊝ | Note control group is NdYAG Laser |
| Improvement in androgenic symptoms at 6 months (Acne) ‐ LOD vs USS guided | OR 0.84 (0.20 to 3.5) | 47.1% | 42.7% | 4.3% fewer | ⊕⊕⊝⊝ | |
| Improvement in androgenic symptoms at 6 months (Hirsutism) ‐ LOD vs USS‐guided | OR 1.09 | 40.0% | 42.1% (16.7 to 72.3) | 2.1% more (23.3 fewer to 32.3 more) | ⊕⊕⊝⊝ | |
| Harms: Adhesions at 6 months ‐ LOD vs THL | OR 0.10 | 59.3% | 12.7% | 46.6% fewer | ⊕⊝⊝⊝ | |
| *The risk in the intervention group (and its 95% confidence interval) is based on the assumed risk in the comparison group and the relative effect of the intervention (and its 95% CI). | ||||||
| GRADE Working Group grades of evidence | ||||||
| 1Downgraded one level for serious risk of bias: Included studies not double‐blinded or unclear allocation concealment or unclear randomization method. | ||||||
| LOD 4 ‐ 5 punctures compared to 2 or fewer punctures for symptom relief in women with polycystic ovary syndrome | ||||||
| Patient or population: Women with symptoms of PCOS | ||||||
| Outcomes | Relative effect | Anticipated absolute effects* (95% CI) | Quality of the evidence | What happens | ||
| Without LOD 4‐5 | With LOD 4‐5 | Difference | ||||
| Menstrual regularity at 6 months ‐ LOD 4 ‐ 5 coagulation points compared to 2 or fewer | OR 16.04 | 13.9% | 72.1% | 58.2% more | ⊕⊕⊝⊝ | |
| Menstrual regularity at 6 months ‐ LOD (4 ‐ 5 laser coagulation points) vs 1 laser coagulation point per ovary | OR 19.00 | 5.0% | 50.0% | 45.0% more | ⊕⊕⊝⊝ | |
| Menstrual regularity at 6 months ‐ LOD 4 punctures vs 2 punctures per ovary | OR 14.00 | 25.0% | 82.4% | 57.4% more | ⊕⊕⊝⊝ | |
| Improvement in androgenic symptoms | No data available | |||||
| Harms LOD 4 ‐ 5 versus fewer punctures | No data available | |||||
| *The risk in the intervention group (and its 95% confidence interval) is based on the assumed risk in the comparison group and the relative effect of the intervention (and its 95% CI). | ||||||
| GRADE Working Group grades of evidence | ||||||
| 1Downgraded one level for serious risk of bias: Included studies not double‐blinded or methods of randomization unclear. | ||||||
| LOD compared to LOD variable energy for symptom relief in women with polycystic ovary syndrome | ||||||
| Patient or population: Women with symptoms of PCOS | ||||||
| Outcomes | Relative effect | Anticipated absolute effects* (95% CI) | Quality of the evidence | What happens | ||
| Without LOD | With LOD | Difference | ||||
| Menstrual regularity at 6 months ‐ LOD vs adjusted thermal dose | OR 0.42 | 87.9% | 75.4% | 12.6% fewer | ⊕⊝⊝⊝ | |
| Menstrual regularity at 3 months ‐ LOD unipolar vs LOD bipolar | OR 1.00 | 90.0% | 90.0% | 0.0% fewer | ⊕⊝⊝⊝ | Groups had different metabolic characteristics at baseline |
| Improvement in androgenic symptoms | No data available | |||||
| Harms: Adhesions at 6 months | OR 0.96 | 28.6% | 27.7% | 0.8% fewer | ⊕⊝⊝⊝ VERY LOW1, 2 | Women that remained enrolled for second‐look laparoscopy |
| *The risk in the intervention group (and its 95% confidence interval) is based on the assumed risk in the comparison group and the relative effect of the intervention (and its 95% CI). | ||||||
| GRADE Working Group grades of evidence | ||||||
| 1Downgraded one level for serious risk of bias: Included studies not double‐blinded or unclear allocation concealment. | ||||||
| Outcome or subgroup title | No. of studies | No. of participants | Statistical method | Effect size |
| 1 Menstrual regularity Show forest plot | 2 | Odds Ratio (M‐H, Fixed, 95% CI) | Totals not selected | |
| 1.1 LOD vs Metformin alone | 2 | Odds Ratio (M‐H, Fixed, 95% CI) | 0.0 [0.0, 0.0] | |
| 2 Menstrual regularity Show forest plot | 5 | Odds Ratio (M‐H, Fixed, 95% CI) | Subtotals only | |
| 2.1 LOD vs Metformin + Clomiphene | 2 | 332 | Odds Ratio (M‐H, Fixed, 95% CI) | 1.02 [0.64, 1.64] |
| 2.2 LOD vs Gonadotropins | 1 | 35 | Odds Ratio (M‐H, Fixed, 95% CI) | 19.2 [3.17, 116.45] |
| 2.3 LOD vs Letrozole | 1 | 260 | Odds Ratio (M‐H, Fixed, 95% CI) | 1.08 [0.64, 1.84] |
| 2.4 LOD vs Metformin + Letrozole | 1 | 146 | Odds Ratio (M‐H, Fixed, 95% CI) | 0.95 [0.49, 1.81] |
| 3 Improvement in androgenic symptoms (hirsutism/acne) Show forest plot | 2 | Odds Ratio (M‐H, Fixed, 95% CI) | Totals not selected | |
| 3.1 LOD vs Metformin | 1 | Odds Ratio (M‐H, Fixed, 95% CI) | 0.0 [0.0, 0.0] | |
| 3.2 LOD vs Gonadotrophins | 1 | Odds Ratio (M‐H, Fixed, 95% CI) | 0.0 [0.0, 0.0] | |
| 4 Harms Show forest plot | 3 | Odds Ratio (M‐H, Fixed, 95% CI) | Subtotals only | |
| 4.1 LOD vs Metformin + Clomiphen | 2 | 332 | Odds Ratio (M‐H, Fixed, 95% CI) | 0.05 [0.01, 0.36] |
| 4.2 LOD vs Gonadotrophins | 1 | 33 | Odds Ratio (M‐H, Fixed, 95% CI) | 0.08 [0.00, 1.61] |
| 5 BMI Show forest plot | 2 | Mean Difference (IV, Fixed, 95% CI) | Totals not selected | |
| 5.1 LOD vs Metformin | 1 | Mean Difference (IV, Fixed, 95% CI) | 0.0 [0.0, 0.0] | |
| 5.2 LOD vs Metformin + Letrozole | 1 | Mean Difference (IV, Fixed, 95% CI) | 0.0 [0.0, 0.0] | |
| 6 Testosterone and free androgen index Show forest plot | 5 | Mean Difference (IV, Fixed, 95% CI) | Totals not selected | |
| 6.1 LOD vs Metformin | 2 | Mean Difference (IV, Fixed, 95% CI) | 0.0 [0.0, 0.0] | |
| 6.2 LOD vs GnRHa + OCP | 1 | Mean Difference (IV, Fixed, 95% CI) | 0.0 [0.0, 0.0] | |
| 6.3 LOD vs Metformin + Letrozole | 1 | Mean Difference (IV, Fixed, 95% CI) | 0.0 [0.0, 0.0] | |
| 6.4 LOD versus Rosiglitazone | 1 | Mean Difference (IV, Fixed, 95% CI) | 0.0 [0.0, 0.0] | |
| 7 Fasting Glucose:Insulin Show forest plot | 3 | Mean Difference (IV, Fixed, 95% CI) | Totals not selected | |
| 7.1 LOD vs Rosiglitazone | 1 | Mean Difference (IV, Fixed, 95% CI) | 0.0 [0.0, 0.0] | |
| 7.2 LOD vs Metformin | 1 | Mean Difference (IV, Fixed, 95% CI) | 0.0 [0.0, 0.0] | |
| 7.3 LOD vs Metformin + Letrozole | 1 | Mean Difference (IV, Fixed, 95% CI) | 0.0 [0.0, 0.0] | |
| Outcome or subgroup title | No. of studies | No. of participants | Statistical method | Effect size |
| 1 Menstrual regularity Show forest plot | 4 | Odds Ratio (M‐H, Fixed, 95% CI) | Subtotals only | |
| 1.1 LOD vs Unilateral LOD | 2 | 104 | Odds Ratio (M‐H, Fixed, 95% CI) | 1.51 [0.62, 3.71] |
| 1.2 LOD vs Ultrasound guided transvaginal ovarian drilling | 1 | 147 | Odds Ratio (M‐H, Fixed, 95% CI) | 1.23 [0.64, 2.37] |
| 1.3 Laser LOD vs Harmonic Scalpel | 1 | 34 | Odds Ratio (M‐H, Fixed, 95% CI) | 2.13 [0.17, 26.03] |
| 2 Improvement in androgenic symptoms (hirsutism/acne) Show forest plot | 1 | Odds Ratio (M‐H, Fixed, 95% CI) | Totals not selected | |
| 2.1 Hirsutism | 1 | Odds Ratio (M‐H, Fixed, 95% CI) | 0.0 [0.0, 0.0] | |
| 2.2 Acne | 1 | Odds Ratio (M‐H, Fixed, 95% CI) | 0.0 [0.0, 0.0] | |
| 3 Harms: Adhesions Show forest plot | 1 | Odds Ratio (M‐H, Fixed, 95% CI) | Totals not selected | |
| 4 Testosterone and free androgen index Show forest plot | 6 | Mean Difference (IV, Fixed, 95% CI) | Totals not selected | |
| 4.1 LOD vs Ultrasound guided transvaginal ovarian drilling | 1 | Mean Difference (IV, Fixed, 95% CI) | 0.0 [0.0, 0.0] | |
| 4.2 LOD versus mini laparoscopy with sedation | 1 | Mean Difference (IV, Fixed, 95% CI) | 0.0 [0.0, 0.0] | |
| 4.3 LOD vs unilateral LOD | 3 | Mean Difference (IV, Fixed, 95% CI) | 0.0 [0.0, 0.0] | |
| 4.4 Laser LOD vs Harmonic Scalpel | 1 | Mean Difference (IV, Fixed, 95% CI) | 0.0 [0.0, 0.0] | |
| Outcome or subgroup title | No. of studies | No. of participants | Statistical method | Effect size |
| 1 Menstrual regularity Show forest plot | 2 | 73 | Odds Ratio (M‐H, Fixed, 95% CI) | 16.04 [4.19, 61.34] |
| 1.1 LOD (4‐5 laser coagulation points) vs 1 laser coagulation point per ovary | 1 | 40 | Odds Ratio (M‐H, Fixed, 95% CI) | 19.0 [2.12, 170.38] |
| 1.2 LOD 4 punctures vs 2 punctures per ovary LOD | 1 | 33 | Odds Ratio (M‐H, Fixed, 95% CI) | 14.0 [2.60, 75.41] |
| 2 Testosterone and free androgen index Show forest plot | 2 | Mean Difference (IV, Fixed, 95% CI) | Subtotals only | |
| 2.1 LOD 4‐5 punctures vs 2 or fewer punctures (Testosterone) | 2 | 73 | Mean Difference (IV, Fixed, 95% CI) | ‐0.90 [‐1.12, ‐0.68] |
| 2.2 LOD 4 punctures vs 2 punctures (FAI) | 1 | 33 | Mean Difference (IV, Fixed, 95% CI) | ‐1.5 [‐3.21, 0.21] |
| Outcome or subgroup title | No. of studies | No. of participants | Statistical method | Effect size |
| 1 Menstrual regularity Show forest plot | 2 | Odds Ratio (M‐H, Fixed, 95% CI) | Totals not selected | |
| 1.1 LOD vs Adjusted thermal dose | 1 | Odds Ratio (M‐H, Fixed, 95% CI) | 0.0 [0.0, 0.0] | |
| 1.2 LOD unipolar vs LOD bipolar | 1 | Odds Ratio (M‐H, Fixed, 95% CI) | 0.0 [0.0, 0.0] | |
| 2 Harms Show forest plot | 1 | Odds Ratio (M‐H, Fixed, 95% CI) | Totals not selected | |
| 3 BMI Show forest plot | 1 | Mean Difference (IV, Fixed, 95% CI) | Totals not selected | |
| 4 Testosterone and free androgen index Show forest plot | 2 | Mean Difference (IV, Fixed, 95% CI) | Totals not selected | |
| 4.1 LOD vs Adjusted thermal dose | 1 | Mean Difference (IV, Fixed, 95% CI) | 0.0 [0.0, 0.0] | |
| 4.2 LOD unipolar vs LOD bipolar | 1 | Mean Difference (IV, Fixed, 95% CI) | 0.0 [0.0, 0.0] | |
| 5 Metabolic measures Show forest plot | 1 | Mean Difference (IV, Fixed, 95% CI) | Totals not selected | |
| 5.1 LOD (unipolar) vs bipolar | 1 | Mean Difference (IV, Fixed, 95% CI) | 0.0 [0.0, 0.0] | |