Interferones beta versus acetato de glatirámero para la esclerosis múltiple recurrente remitente
Información
- DOI:
- https://doi.org/10.1002/14651858.CD009333.pub3Copiar DOI

- Base de datos:
-
- Cochrane Database of Systematic Reviews
- Versión publicada:
-
- 24 noviembre 2016see what's new
- Tipo:
-
- Intervention
- Etapa:
-
- Review
- Grupo Editorial Cochrane:
-
Grupo Cochrane de Esclerosis múltiple y enfermedades raras del sistema nervioso central
- Copyright:
-
- Copyright © 2016 The Cochrane Collaboration. Published by John Wiley & Sons, Ltd.
Cifras del artículo
Altmetric:
Citado por:
Autores
Contributions of authors
| Roles and responsibilities | |
| Drafting the protocol | All review authors |
| Selecting which studies to include | LLM, SF, AG |
| Planning data sheet for study data extraction | LLM, AV, GR, CDP |
| Planning data sheet for MRI data extraction | LLM, AV, MR, CDP |
| Extracting data from studies, double‐checking data and resolving discrepancies | LLM, AV, MR, FB, SF, AL, GR |
| Assessing risk of bias of included studies | LLM, AV, SF |
| Entering data into RevMan | LLM, AV, CDP |
| Planning the strategy analysis | LLM, AV, MR, CDP |
| Carrying out statistical analysis, interpreting statistical results | CDP, AV, LLM |
| Carrying out and interpreting the results and drafting the final review | LLM, AV, MR, CDP, BWG |
| Providing review control, according to Standards for the Reporting of New Cochrane Intervention Reviews | LLM, AV |
| Updating the review | LLM, AV, AL, SF |
Sources of support
Internal sources
-
Cochrane Multiple Sclerosis Group, The Cochrane Collaboration, Other.
Cochrane MS Review Group, Neuroepidemiology Unit. Fondazione IRCCS Istituto Neurologico Carlo Besta, via Celoria 11, 20133 Milan, Italy
External sources
-
No sources of support supplied
Declarations of interest
This Cochrane review has no commercial sponsorship.
MR and BWG have participated in meetings and trials sponsored by large pharmaceutical companies.
LLM, SF, AG, FB, GR, AL, CDP, and AV have no conflicts of interest.
Acknowledgements
We thank Dirk Pleimes, MD, Global Medical Lead Neurology (Bayer Healthcare Pharmaceuticals, Global Medical Affairs Specialized Therapeutics, Montville, M100, USA), for providing data from the primary studies (BEYOND).
We thank Andrea Fittipaldo, Trials Search Co‐ordinator, for support provided in paper retrieval. We are grateful to Liliana Coco for valuable and helpful technical assistance provided, as well as for support in drawing up the paper.
Version history
| Published | Title | Stage | Authors | Version |
| 2016 Nov 24 | Interferons‐beta versus glatiramer acetate for relapsing‐remitting multiple sclerosis | Review | Loredana La Mantia, Carlo Di Pietrantonj, Marco Rovaris, Giulio Rigon, Serena Frau, Francesco Berardo, Anna Gandini, Anna Longobardi, Bianca Weinstock‐Guttman, Alberto Vaona | |
| 2014 Jul 26 | Interferons‐beta versus glatiramer acetate for relapsing‐remitting multiple sclerosis | Review | Loredana La Mantia, Carlo Di Pietrantonj, Marco Rovaris, Giulio Rigon, Serena Frau, Francesco Berardo, Anna Gandini, Anna Longobardi, Bianca Weinstock‐Guttman, Alberto Vaona | |
| 2011 Sep 07 | Interferon beta versus glatiramer acetate for relapsing‐remitting multiple sclerosis | Protocol | Loredana La Mantia, Alberto Vaona, Marco Rovaris, Francesco Berardo, Serena Frau, Anna Gandini, Anna Longobardi, Giulio Rigon, Carlo Di Pietrantonj, Bianca Weinstock‐Guttman | |
Differences between protocol and review
Outcomes
The secondary clinical outcome "Mean change in EDSS disability score" was deleted because it was considered not relevant.
The secondary clinical outcomes "Mean number of active (new or enlarged) T2‐hyperintense lesions per participant" and "Mean number of new contrast‐enhancing T1 lesions per participant" at 3 months were not evaluated because considered not relevant
The definition of outcome "Number of relapse free" was changed to "Number of participants who experienced a relapse" for consistency.
Analysis
Treatment schedules not approved in RRMS treatment and not used in clinical practice were not included in the analysis.
Scoring of overall quality of the study was better defined.
Sensitivity analysis exploring the impact of loss to follow‐up was performed using a likely scenario because that is more understandable.
We used risk ratio instead of odds ratio because this measure is suitable for the design of included studies, as studies provided neither infrequent events nor unbalanced groups.
The summary of findings Table for the main comparison was added.
Keywords
MeSH
Medical Subject Headings (MeSH) Keywords
- Adjuvants, Immunologic [*therapeutic use];
- Glatiramer Acetate [*therapeutic use];
- Interferon beta‐1a [*therapeutic use];
- Interferon beta‐1b [*therapeutic use];
- Magnetic Resonance Imaging;
- Multiple Sclerosis, Relapsing‐Remitting [diagnostic imaging, *drug therapy, pathology];
- Randomized Controlled Trials as Topic;
- Recurrence;
Medical Subject Headings Check Words
Humans;
PICO

Study flow diagram.
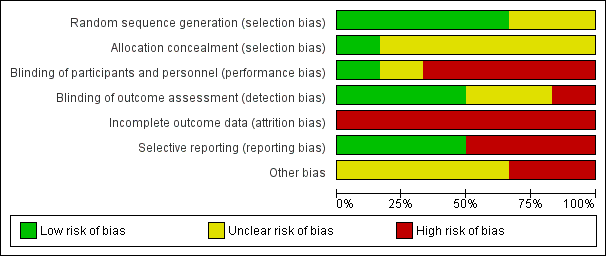
Risk of bias graph: review authors' judgements about each risk of bias item presented as percentages across all included studies.

Risk of bias summary: review authors' judgements about each risk of bias item for each included study.

Comparison 1 Number of participants who experienced at least 1 relapse at 24 months and at end of follow‐up, Outcome 1 At the end of follow‐up (24 ‐ 36 months).
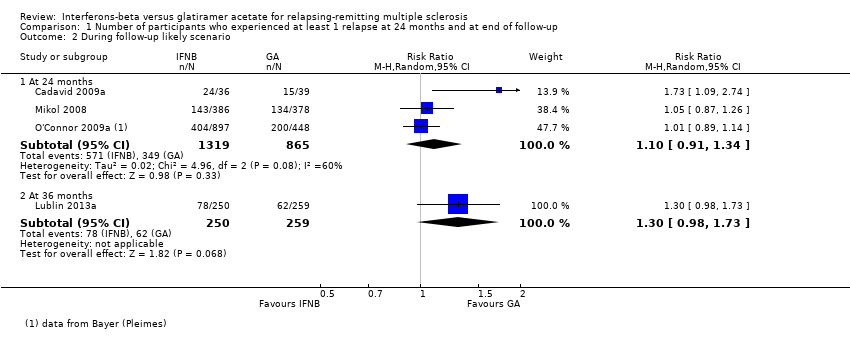
Comparison 1 Number of participants who experienced at least 1 relapse at 24 months and at end of follow‐up, Outcome 2 During follow‐up likely scenario.

Comparison 2 Number of participants who worsened during the study (EDSS progression) at 24 months and at the end of follow‐up, Outcome 1 At the end of follow‐up (24‐36 months).
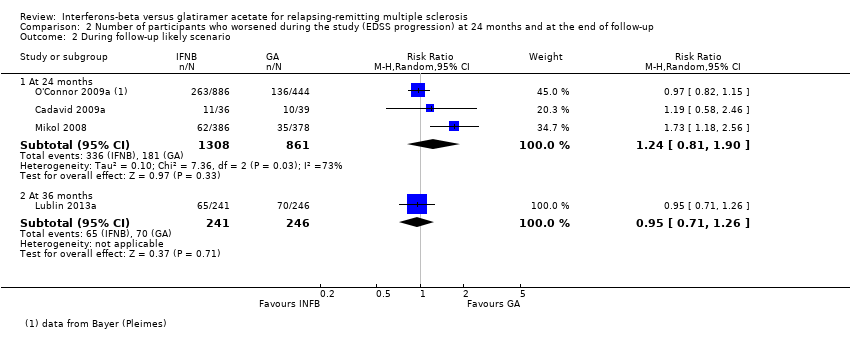
Comparison 2 Number of participants who worsened during the study (EDSS progression) at 24 months and at the end of follow‐up, Outcome 2 During follow‐up likely scenario.

Comparison 3 Number of participants who withdrew or dropped out of the study because of adverse events, Outcome 1 Number of participants who dropped out for AE.

Comparison 3 Number of participants who withdrew or dropped out of the study because of adverse events, Outcome 2 Number of participants who dropped out for SAE.

Comparison 4 Frequency of relapse (ARR), Outcome 1 Relapse frequency.

Comparison 5 Time to first relapse, Outcome 1 Time to first relapse (HR).

Comparison 7 Number of participants treated with steroids for MS relapse, Outcome 1 Patients Treated with Steroids.

Comparison 9 Mean number of active (new or enlarged) T2‐hyperintense lesions per participant at 6 ‐ 12 ‐ 24 months and at end of follow‐up period, Outcome 1 During follow‐up.

Comparison 10 Mean number of new contrast‐enhancing T1 lesions per participant at 6 ‐ 12 ‐ 24 months and at end of follow‐up period, Outcome 1 Mean number.

Comparison 11 Mean change in total T2‐hyperintense lesion load at 12‐24 months and at end of follow‐up period, Outcome 1 Mean absolute change.

Comparison 12 Mean change in total T1‐hypointense lesion load at 12‐24 months and at end of follow‐up, Outcome 1 Mean absolute change.

Comparison 13 Mean change in total brain volume (as a measure of atrophy) at 12‐24 months and at end of follow‐up, Outcome 1 Mean absolute change.
| interferons compared with glatiramer acetate for participants with relapsing‐remitting multiple sclerosis | ||||||
| Patient or population: people with relapsing‐remitting multiple sclerosis | ||||||
| Outcomes | Illustrative comparative risks* (95% CI) | Relative effect | No. of participants | Quality of the evidence | Comments | |
| Assumed risk (control) | Corresponding risk (intervention) | |||||
| Glatiramer acetate | Interferons | |||||
| Number of participants with relapse (M‐H, random, 95% CI) | Study population | RR 1.04 | 2184 | ⊕⊕⊕⊝ | Detection bias risk for clinical outcomes was judged as high for 1 study and low for the other 2 RCTs | |
| 36 per 100 | 38 per 100 | |||||
| Moderate | ||||||
| 35 per 100 | 36 per 100 | |||||
| Number of participants with confirmed progression (M‐H, random, 95% CI) | Study population | RR 1.11 | 2169 | ⊕⊕⊕⊝ | Detection bias risk for clinical outcomes was judged as high for 1 study and low for the other 2 RCTs | |
| 15 per 100 | 16 per 100 | |||||
| Moderate | ||||||
| 15 per 100 | 17 per 100 | |||||
| Number of participants who dropped out for AEs (M‐H, random, 95% CI) | Study population | RR 0.95 | 2685 | ⊕⊕⊝⊝ | ||
| 4 per 100 | 4 per 100 | |||||
| Moderate | ||||||
| 5 per 100 | 5 per 100 | |||||
| Mean number of active T2 lesions | 0.15 lower in IFN versus GA groups | 1790 | ⊕⊕⊝⊝ | Detection bias risk for MRI outcomes was judged as low for all studies | ||
| Mean number of new enhancing lesions | 0.14 lower in IFN versus GA groups | 1734 | ⊕⊕⊕⊝ | Detection bias risk for MRI outcomes was judged as low for all studies | ||
| Mean change in total T2‐hyperintense lesion load | 0.58 lower in IFN versus GA groups | 1608 | ⊕⊕⊕⊝ | Detection bias risk for MRI outcomes was judged as low for both studies | ||
| Mean change in total T1‐hypointense lesion load | −0.20 lower in IFN versus GA groups (−0.33 to −0.07) | 1602 | ⊕⊕⊕⊝ | Detection bias risk for MRI outcomes was judged as low for both studies | ||
| *The basis for the assumed risk (e.g. median control group risk (GA) across studies) is provided in footnotes. The corresponding risk (and its 95% confidence interval) is based on the assumed risk in the comparison group (IFNs) and the relative effect of the intervention (and its 95% CI). | ||||||
| GRADE Working Group grades of evidence. | ||||||
| aHigh risk of attrition bias. | ||||||
| Study name | Drugs | Number of participants | % female | Age, years, mean (SD) | Mean EDSS score (SD) | Disease duration, years,mean (SD) | Previous number of relapses, mean (SD) | Number of participants with MRI Gad+ lesions (%) |
| IFN‐beta 1b | 36 | 75 | 36 (7.75) | 2.0* (0 to 5) | 0.9* (0.1 to 24) | 1.8* (0 to 7.5) | 26 (72) | |
| GA | 39 | 64 | 36 (8.25) | 2.0* (0 to 5.5) | 1.2* (0.2 to 34) | 1,9* (0.13 to 7.0) | 27 (69) | |
| IFN‐beta 1a 44 | 55 | 69.5 | 35.9 (9.1) | 1.9 (1.0) | 5.7 (4.9) | 1,2 (0.6) | ND | |
| IFN‐beta 1a 30 μg | 55 | 68.0 | 34.8 (9.6) | 1.9 (0.8) | 5.3 (5.1) | 1,2 (0.7) | ND | |
| GA | 55 | 72.9 | 38.9 (10.2) | 2.1 (1.1) | 5.5 (6.1) | 1,3 (0.7) | ND | |
| IFN‐beta 1a 30 μg | 250 | 69.2 | 37.6 (10.2) | 2.0 (1.2) | 1.4 (4.0) | 1.7° (0.9) | 187 (74.8) | |
| GA | 259 | 71.4 | 39.0 (9.5) | 1.9 (1.2) | 1.0 (2.9) | 1.6° (0.7) | 215 (83.01) | |
| IFN‐beta 1a 44 μg | 386 | 69 | 36.7 (9.8) | 2.35 (1.28) | 5.93 (6.25) | 0.97** (0.42) | 150 (39) | |
| GA | 378 | 72 | 36.8 (9.5) | 2.33 (1.31) | 6.55 (7.10) | 1.01** (0.35) | 156 (41) | |
| IFN‐beta 1b | 897 | 70 | 35.8** (11.13) | 2.35 (2) | 5.3** (4.45) | 1.6° (0.74) | ND | |
| GA | 448 | 68 | 35.2** (11.87) | 2.28 (2) | 5.1** (4.45) | 1.6° (0.74) | ND | |
| ND (no data available). *Median (range); mean not reported. **SD or weighted mean was calculated. °Pre‐1‐year. | ||||||||
| Study | Arm | N° participants | N° dropout | Reasons for missing | |||||||||||
| At randomisation | 24 months | 36 months | n° | % | Lost to follow‐up | Did not receive drug | Switched treatment | Withdrew | Deviated from protocol | Had adverse events | Died | Became pregnant | Other reasons | ||
| IFN‐beta 1a 44 μg | 36 | 25 | ND | 116 | 30.6 | 7 | 0 | 0 | 0 | 0 | 1 | 0 | 0 | 38 | |
| GA | 39 | 31 | ND | 87 | 20.5 | 4 | 0 | 0 | 0 | 0 | 0 | 0 | 0 | 48 | |
| IFN‐beta 1a 44 μg | 55 | 46 | ND | 9 | 16.4 | 9 | ND | ||||||||
| IFN‐beta 1a 30 μg | 55 | 47 | ND | 8 | 14.5 | 8 | |||||||||
| GA | 55 | 48 | ND | 7 | 12.7 | 7 | |||||||||
| IFN‐beta 1a 30 μg | 250 | ND | 194 | 56 | 22.4 | 13 | 0 | 0 | 0 | 0 | 1711 | 1 | 0 | 2513 | |
| GA | 259 | ND | 223 | 36 | 13.9 | 9 | 0 | 0 | 0 | 0 | 1112 | 1 | 0 | 1514 | |
| IFN‐beta 1a 44 μg | 386 | 301 | ND | 85 | 22.0 | 17 | 3 | 0 | 0 | 2 | 23 | 0 | 8 | 329 | |
| GA | 378 | 324 | ND | 54 | 14.3 | 2 | 3 | 0 | 0 | 2 | 19 | 0 | 5 | 2310 | |
| IFN‐beta 1b 250 | 897 | 784 | ND | 113 | 12.6 | 12 | 9 | 10 | 38 | 3 | 13 | 1 | 27 | ||
| GA | 448 | 374 | ND | 74 | 16.5 | 12 | 3 | 5 | 18 | 2 | 8 | 1 | 1 | 24 | |
| ND (no data available) Source of data are described as follow. 1] pg 1977; 2] pg 3; 3] pg 33; 4] pg 904; 5] pg 890; 6] 7 lost to follow‐up + 4 discontinued intervention (see pg 1977); 7] 4 lost to follow‐up + 4 discontinued intervention (see pg 1977); 8] treatment failure; 9] 4 had disease progression + 28 for other reasons; 10] 7 had disease progression + 16 for other reasons; 11] 4 AE/SAE + 13 side effects; 12] 6 AE/SAE + 5 side effects; 13] 14 non‐medical reason + 11 other medical reason; 14] 8 non‐medical reason + 7 other medical reason | |||||||||||||||
| Study | Arm | N° participants | N° dropout | Lost to follow‐up | |||
| Randomised available for the outcome | 24 months | 36 months | n° | % | |||
| IFN‐beta 1a 44 | 36 | 25 | 11 | 30.6 | 7 | ||
| GA | 39 | 31 | 8 | 20.5 | 4 | ||
| IFN‐beta 1a 44 | 55 | 46 | 9 | 16.4 | 9 | ||
| IFN‐beta 1a 30 | 55 | 47 | 8 | 14.5 | 8 | ||
| GA | 55 | 48 | 7 | 12.7 | 7 | ||
| IFN‐beta 1a 30 | 250 | 194 | 56 | 22.4 | 13 | ||
| GA | 259 | 223 | 36 | 13.9 | 9 | ||
| IFN‐beta 1a 44 | 386 | 301 | 85 | 22.0 | 17 | ||
| GA | 378 | 324 | 54 | 14.3 | 2 | ||
| IFN‐beta 1b | 897 | 784 | 113 | 12.6 | 57* | ||
| GA | 448 | 374 | 74 | 16.5 | 31* | ||
| *Data provided by Bayer (Pleimes 2013). | |||||||
| Study | Arm | N° participants at | N° dropout | Lost to follow‐up | |||
| Randomised available for the outcome | 24 months | 36 months | n° | % | |||
| IFN‐beta 1a 44 | 36 | 25 | 11 | 30.6 | 7 | ||
| GA | 39 | 31 | 8 | 20.5 | 4 | ||
| IFN‐beta 1a 44 | 55 | 46 | 9 | 16.4 | 9 | ||
| IFN‐beta 1a 30 | 55 | 47 | 8 | 14.5 | 8 | ||
| GA | 55 | 48 | 7 | 12.7 | 7 | ||
| IFN‐beta 1a 30 | 241 | 194 | 47 | 19.5 | 13 | ||
| GA | 246 | 223 | 23 | 9.3 | 9 | ||
| IFN‐beta 1a 44 | 386 | 301 | 85 | 22.0 | 17 | ||
| GA | 378 | 324 | 54 | 14.3 | 2 | ||
| IFN‐beta 1b | 886 | 784 | 102 | 11.5 | 80* | ||
| GA | 444 | 374 | 70 | 15.8 | 58* | ||
| *Data provided by Bayer (Pleimes 2013). | |||||||
| Outcome or subgroup title | No. of studies | No. of participants | Statistical method | Effect size |
| 1 At the end of follow‐up (24 ‐ 36 months) Show forest plot | 4 | Risk Ratio (M‐H, Random, 95% CI) | Subtotals only | |
| 1.1 At 24 months | 3 | 2184 | Risk Ratio (M‐H, Random, 95% CI) | 1.04 [0.87, 1.24] |
| 1.2 At 36 months | 1 | 509 | Risk Ratio (M‐H, Random, 95% CI) | 1.27 [0.92, 1.75] |
| 2 During follow‐up likely scenario Show forest plot | 4 | Risk Ratio (M‐H, Random, 95% CI) | Subtotals only | |
| 2.1 At 24 months | 3 | 2184 | Risk Ratio (M‐H, Random, 95% CI) | 1.10 [0.91, 1.34] |
| 2.2 At 36 months | 1 | 509 | Risk Ratio (M‐H, Random, 95% CI) | 1.30 [0.98, 1.73] |
| Outcome or subgroup title | No. of studies | No. of participants | Statistical method | Effect size |
| 1 At the end of follow‐up (24‐36 months) Show forest plot | 4 | Risk Ratio (M‐H, Random, 95% CI) | Subtotals only | |
| 1.1 At 24 months | 3 | 2169 | Risk Ratio (M‐H, Random, 95% CI) | 1.11 [0.91, 1.35] |
| 1.2 At 36 months | 1 | 487 | Risk Ratio (M‐H, Random, 95% CI) | 0.87 [0.63, 1.20] |
| 2 During follow‐up likely scenario Show forest plot | 4 | Risk Ratio (M‐H, Random, 95% CI) | Subtotals only | |
| 2.1 At 24 months | 3 | 2169 | Risk Ratio (M‐H, Random, 95% CI) | 1.24 [0.81, 1.90] |
| 2.2 At 36 months | 1 | 487 | Risk Ratio (M‐H, Random, 95% CI) | 0.95 [0.71, 1.26] |
| Outcome or subgroup title | No. of studies | No. of participants | Statistical method | Effect size |
| 1 Number of participants who dropped out for AE Show forest plot | 4 | 2685 | Risk Ratio (M‐H, Random, 95% CI) | 0.95 [0.64, 1.40] |
| 2 Number of participants who dropped out for SAE Show forest plot | 3 | 2610 | Risk Ratio (M‐H, Random, 95% CI) | 0.99 [0.63, 1.56] |
| Outcome or subgroup title | No. of studies | No. of participants | Statistical method | Effect size |
| 1 Relapse frequency Show forest plot | 5 | Rate Ratio (Random, 95% CI) | Subtotals only | |
| 1.1 At 24 months | 4 | Rate Ratio (Random, 95% CI) | 1.06 [0.95, 1.18] | |
| 1.2 At 36 months | 1 | Rate Ratio (Random, 95% CI) | 1.40 [1.13, 1.74] | |
| Outcome or subgroup title | No. of studies | No. of participants | Statistical method | Effect size |
| 1 Time to first relapse (HR) Show forest plot | 3 | Hazard Ratio (Random, 95% CI) | 1.01 [0.87, 1.16] | |
| Outcome or subgroup title | No. of studies | No. of participants | Statistical method | Effect size |
| 1 Patients Treated with Steroids Show forest plot | 2 | 1420 | Risk Ratio (M‐H, Random, 95% CI) | 1.30 [0.76, 2.24] |
| Outcome or subgroup title | No. of studies | No. of participants | Statistical method | Effect size |
| 1 During follow‐up Show forest plot | 3 | Mean Difference (IV, Random, 95% CI) | Subtotals only | |
| 1.1 At 6 months | 1 | 396 | Mean Difference (IV, Random, 95% CI) | ‐0.86 [‐1.32, ‐0.40] |
| 1.2 At 12 months | 2 | 1722 | Mean Difference (IV, Random, 95% CI) | ‐0.52 [‐1.12, 0.09] |
| 1.3 At 24 months | 3 | 1790 | Mean Difference (IV, Random, 95% CI) | ‐0.15 [‐0.68, 0.39] |
| Outcome or subgroup title | No. of studies | No. of participants | Statistical method | Effect size |
| 1 Mean number Show forest plot | 3 | Mean Difference (IV, Random, 95% CI) | Subtotals only | |
| 1.1 At 6 months | 0 | 0 | Mean Difference (IV, Random, 95% CI) | 0.0 [0.0, 0.0] |
| 1.2 At 12 months | 1 | 1233 | Mean Difference (IV, Random, 95% CI) | ‐0.10 [‐0.26, 0.06] |
| 1.3 At 24 months | 3 | 1734 | Mean Difference (IV, Random, 95% CI) | ‐0.14 [‐0.30, 0.02] |
| Outcome or subgroup title | No. of studies | No. of participants | Statistical method | Effect size |
| 1 Mean absolute change Show forest plot | 3 | Mean Difference (IV, Random, 95% CI) | Subtotals only | |
| 1.1 At 12 months | 1 | 1221 | Mean Difference (IV, Random, 95% CI) | ‐0.4 [‐0.59, ‐0.21] |
| 1.2 At 24 months | 2 | 1608 | Mean Difference (IV, Random, 95% CI) | ‐0.58 [‐0.99, ‐0.18] |
| 1.3 At 36 months | 1 | 509 | Mean Difference (IV, Random, 95% CI) | ‐0.26 [‐1.04, 0.52] |
| Outcome or subgroup title | No. of studies | No. of participants | Statistical method | Effect size |
| 1 Mean absolute change Show forest plot | 2 | Mean Difference (IV, Random, 95% CI) | Subtotals only | |
| 1.1 At 12 months | 1 | 1207 | Mean Difference (IV, Random, 95% CI) | ‐0.06 [‐0.18, 0.07] |
| 1.2 At 24 months | 2 | 1602 | Mean Difference (IV, Random, 95% CI) | ‐0.20 [‐0.33, ‐0.07] |
| Outcome or subgroup title | No. of studies | No. of participants | Statistical method | Effect size |
| 1 Mean absolute change Show forest plot | 2 | Mean Difference (IV, Random, 95% CI) | Subtotals only | |
| 1.1 At 12 months | 1 | 1137 | Mean Difference (IV, Random, 95% CI) | ‐0.10 [‐0.22, 0.02] |
| 1.2 At 24 months | 2 | 1552 | Mean Difference (IV, Random, 95% CI) | ‐0.12 [‐0.23, ‐0.01] |