| interferons compared with glatiramer acetate for participants with relapsing‐remitting multiple sclerosis |
| Patient or population: people with relapsing‐remitting multiple sclerosis
Settings: secondary care
Intervention: interferons
Comparison: glatiramer acetate |
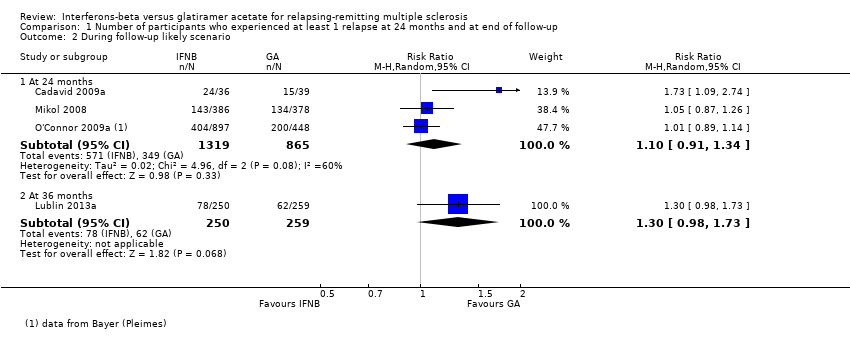
| Number of participants with relapse
Risk ratio (M‐H, random, 95% CI)
Follow‐up: 24 months | Study population | RR 1.04
(0.87 to 1.24) | 2184
(3 studies) | ⊕⊕⊕⊝
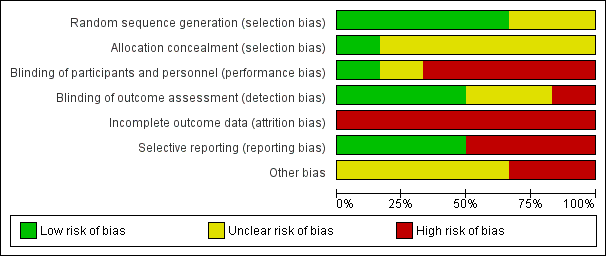
moderatea | Detection bias risk for clinical outcomes was judged as high for 1 study and low for the other 2 RCTs |
| 36 per 100 | 38 per 100
(31 to 45) |
| Moderate |
| 35 per 100 | 36 per 100
(30 to 43) |
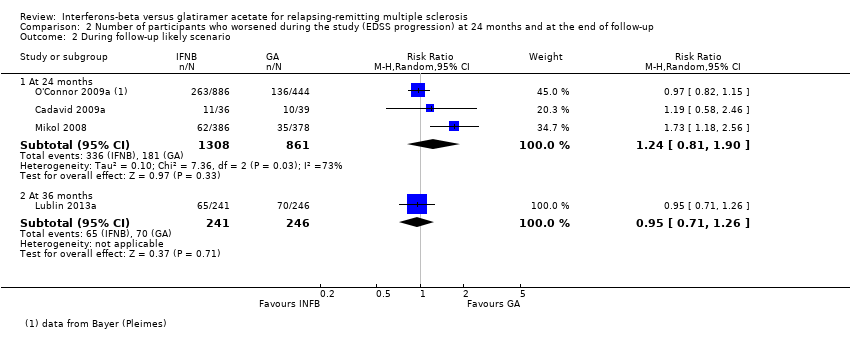
| Number of participants with confirmed progression
Risk ratio (M‐H, random, 95% CI)
Follow‐up: 24 months | Study population | RR 1.11
(0.91 to 1.35) | 2169
(3 studies) | ⊕⊕⊕⊝
moderatea | Detection bias risk for clinical outcomes was judged as high for 1 study and low for the other 2 RCTs |
| 15 per 100 | 16 per 100
(13 to 20) |
| Moderate |
| 15 per 100 | 17 per 100
(14 to 21) |
| Number of participants who dropped out for AEs
Risk ratio (M‐H, random, 95% CI)
Follow‐up: 24 months | Study population | RR 0.95
(0.64 to 1.4) | 2685
(4 studies) | ⊕⊕⊝⊝
lowa,b | |
| 4 per 100 | 4 per 100
(3 to 6) |
| Moderate |
| 5 per 100 | 5 per 100
(3 to 7) |
| Mean number of active T2 lesions
Mean difference (IV, random, 95% CI)
Follow‐up: 24 months | | 0.15 lower in IFN versus GA groups
(0.68 lower to 0.39 higher) | | 1790
(3 studies) | ⊕⊕⊝⊝
lowb,c | Detection bias risk for MRI outcomes was judged as low for all studies |
| Mean number of new enhancing lesions
Mean difference (IV, random, 95% CI)
Follow‐up: 24 months | | 0.14 lower in IFN versus GA groups
(0.3 lower to 0.02 higher) | | 1734
(3 studies) | ⊕⊕⊕⊝
moderated | Detection bias risk for MRI outcomes was judged as low for all studies |
| Mean change in total T2‐hyperintense lesion load
Mean difference (IV, random, 95% CI)
Follow‐up: 24 months | | 0.58 lower in IFN versus GA groups
(0.99 to 0.18 lower) | | 1608
(2 studies) | ⊕⊕⊕⊝
moderated | Detection bias risk for MRI outcomes was judged as low for both studies |
| Mean change in total T1‐hypointense lesion load
Follow‐up: 24 months | | −0.20 lower in IFN versus GA groups (−0.33 to −0.07) | | 1602
(2 studies) | ⊕⊕⊕⊝
moderated | Detection bias risk for MRI outcomes was judged as low for both studies |
| *The basis for the assumed risk (e.g. median control group risk (GA) across studies) is provided in footnotes. The corresponding risk (and its 95% confidence interval) is based on the assumed risk in the comparison group (IFNs) and the relative effect of the intervention (and its 95% CI).
CI: Confidence interval; RR: Risk ratio. |
| GRADE Working Group grades of evidence.
High quality: Further research is very unlikely to change our confidence in the estimate of effect.
Moderate quality: Further research is likely to have an important impact on our confidence in the estimate of effect and may change the estimate.
Low quality: Further research is very likely to have an important impact on our confidence in the estimate of effect and is likely to change the estimate.
Very low quality: We are very uncertain about the estimate. |