Selective serotonin reuptake inhibitors (SSRIs) for stroke recovery
Abstract
Background
Selective serotonin reuptake inhibitors (SSRIs) might theoretically reduce post‐stroke disability by direct effects on the brain. This Cochrane Review was first published in 2012 and last updated in 2019.
Objectives
To determine if SSRIs are more effective than placebo or usual care at improving outcomes in people less than 12 months post‐stroke, and to determine whether treatment with SSRIs is associated with adverse effects.
Search methods
We searched the Cochrane Stroke Group Trials Register (last searched 7 January 2021), Cochrane Controlled Trials Register (CENTRAL, Issue 7 of 12, 7 January 2021), MEDLINE (1946 to 7 January 2021), Embase (1974 to 7 January 2021), CINAHL (1982 to 7 January 2021), PsycINFO (1985 to 7 January 2021), and AMED (1985 to 7 January 2021). PsycBITE had previously been searched (16 July 2018). We searched clinical trials registers.
Selection criteria
We included randomised controlled trials (RCTs) recruiting stroke survivors within the first year. The intervention was any SSRI, at any dose, for any period, and for any indication. The comparator was usual care or placebo. Studies reporting at least one of our primary (disability score or independence) or secondary outcomes (impairments, depression, anxiety, quality of life, fatigue, cognition, healthcare cost, death, adverse events and leaving the study early) were included in the meta‐analysis. The primary analysis included studies at low risk of bias.
Data collection and analysis
We extracted data on demographics, stroke type and, our pre‐specified outcomes, and bias sources. Two review authors independently extracted data. We used mean difference (MD) or standardised mean differences (SMDs) for continuous variables, and risk ratios (RRs) for dichotomous variables, with 95% confidence intervals (CIs). We assessed bias risks and applied GRADE criteria.
Main results
We identified 76 eligible studies (13,029 participants); 75 provided data at end of treatment, and of these two provided data at follow‐up. Thirty‐eight required participants to have depression to enter. The duration, drug, and dose varied. Six studies were at low risk of bias across all domains; all six studies did not need participants to have depression to enter, and all used fluoxetine. Of these six studies, there was little to no difference in disability between groups SMD ‐0.0; 95% CI ‐0.05 to 0.05; 5 studies, 5436 participants, high‐quality evidence) or in independence (RR 0.98; 95% CI 0.93 to 1.03; 5 studies, 5926 participants; high‐quality evidence) at the end of treatment.
In the studies at low risk of bias across all domains, SSRIs slightly reduced the average depression score (SMD 0.14 lower, 95% CI 0.19 lower to 0.08 lower; 4 studies; 5356 participants, high‐quality evidence) and there was a slight reduction in the proportion with depression (RR 0.75, 95% CI 0.65 to 0.86; 3 studies, 5907 participants, high‐quality evidence).
Cognition was slightly better in the control group (MD ‐1.22, 95% CI ‐2.37 to ‐0.07; 4 studies, 5373 participants, moderate‐quality evidence).
Only one study (n = 30) reported neurological deficit score (SMD ‐0.39, 95% CI ‐1.12 to 0.33; low‐quality evidence).
SSRIs resulted in little to no difference in motor deficit (SMD 0.03, ‐0.02 to 0.08; 6 studies, 5518 participants, moderate‐quality evidence).
SSRIs slightly increased the proportion leaving the study early (RR 1.57, 95% CI 1.03 to 2.40; 6 studies, 6090 participants, high‐quality evidence).
SSRIs slightly increased the outcome of a seizure (RR 1.40, 95% CI 1.00 to 1.98; 6 studies, 6080 participants, moderate‐quality evidence) and a bone fracture (RR 2.35, 95% CI 1.62 to 3.41; 6 studies, 6080 participants, high‐quality evidence).
One study at low risk of bias across all domains reported gastrointestinal side effects (RR 1.71, 95% CI 0.33, to 8.83; 1 study, 30 participants).
There was no difference in the total number of deaths between SSRI and placebo (RR 1.01, 95% CI 0.82 to 1.24; 6 studies, 6090 participants, moderate quality evidence).
SSRIs probably result in little to no difference in fatigue (MD ‐0.06; 95% CI ‐1.24 to 1.11; 4 studies, 5524 participants, moderate‐quality of evidence), nor in quality of life (MD 0.00; 95% CI ‐0.02 to 0.02, 3 studies, 5482 participants, high‐quality evidence).
When all studies, irrespective of risk of bias, were included, SSRIs reduced disability scores but not the proportion independent.
There was insufficient data to perform a meta‐analysis of outcomes at end of follow‐up.
Several small ongoing studies are unlikely to alter conclusions.
Authors' conclusions
There is high‐quality evidence that SSRIs do not make a difference to disability or independence after stroke compared to placebo or usual care, reduced the risk of future depression, increased bone fractures and probably increased seizure risk.
PICO
Plain language summary
Selective serotonin reuptake inhibitors for stroke recovery
Review question
What are the effects of selective serotonin uptake inhibitor (SSRI) drugs on recovery from stroke?
Background
Stroke is a major cause of disability. Stroke‐related disability can include difficulty with daily tasks such as toileting, washing, and walking. Sometimes disability is so severe that a person becomes dependent on others for performing basic activities (this is known as 'dependence'). We previously published an update of this Cochrane Review which aimed to find out whether SSRIs (a class of drug usually used to treat mood problems, which work by changing the level of chemicals in the brain) might improve recovery after stroke.
Since the update in 2019, two large studies have now been completed and so it is necessary to perform a further update of this review. In our main analyses we included only high‐quality trials, that is those which used rigorous methods to avoid biases (such as the person assessing outcome being aware of whether the stroke survivor received the active drug or placebo). We refer to these studies as 'low risk of bias' studies.
We also wanted to find out whether SSRIs had other benefits, for example improving the severity of any arm or leg weakness, mood, anxiety, cognition, quality of life, and whether SSRIs were associated with side effects such as bleeding or seizures.
Study characteristics
In total we found 76 studies recruiting 13,029 stroke survivors within one year of their stroke. There was a wide age range. About half the studies required participants to have depression to enter the trial. The duration, drug, and dose varied between studies. However, only six of these studies were at low risk of bias; the participants in these studies did not have to be depressed to enter the study, and they were all recruited soon after their stroke.
Key results
When we combined data from these six studies at low risk of bias, SSRIs did not reduce disability or dependency. SSRIs reduced the risk of future depression by about a quarter, but led to a slight increase in the risk of seizures and also increased the risk of bone fractures. The evidence is current until January 2021.
Quality of the evidence
We are very confident that the results are reliable for the effect on disability, dependency and bone fractures, and moderately confident about the effect on seizure risk.
Authors' conclusions
Summary of findings
| Fluoxetine versus control at end of treatment, by SSRI, for stroke recovery* | ||||||
| Patient or population: people with stroke recovery *Summary of findings table based on studies with low risk of bias. | ||||||
| Outcomes | Illustrative comparative risks* (95% CI) | Relative effect | No of Participants | Quality of the evidence | Comments | |
|---|---|---|---|---|---|---|
| Assumed risk | Corresponding risk | |||||
| Control | Fluoxetine versus control at end of treatment | |||||
| Disability (primary analysis) |
| SMD 0.0 (‐0.05, 0.05) |
| 5436 | ⊕⊕⊕⊕ | ‐ |
| Independent on modified Rankin score (mRS 0 to 2) (primary analysis) | Study population | RR 0.98
| 5926 | ⊕⊕⊕⊕ | ‐ | |
| 1541/2971 (i.e. 52 per hundred) | 1498/2955 (i.e. 51 per hundred) | |||||
| Neurological deficit score |
| SMD ‐0.39 (95% CI (‐1.12 to 0.33) |
| 30 participants, one study | ⊕⊕⊝⊝ Lowa | This is a small effect (based on the 'rule‐of‐thumb' method for interpreting SMD) |
| Depression (continuous data) |
| SMD ‐0.14 (‐0.19 to ‐0.08) |
| 5356 | ⊕⊕⊕⊕ | This is a small effect (based on the 'rule‐of‐thumb' method for interpreting SMD) |
| Death | Study population | RR 1.01 | 6090 | ⊕⊕⊕⊝ | ‐ | |
| 168/3029 (i.e. 55 per thousand) | 170/3061 (i.e. 56 per thousand) | |||||
| Number of seizures | Study population | RR 1.40 | 6080 | ⊕⊕⊕⊝ Moderatec | ‐ | |
| 54/3024 (i.e. 18 per thousand) | 76/3056 (i.e. 25 per thousand) | |||||
| Bone fractures | Study population | RR 2.35 | 6080 | ⊕⊕⊕ ⊕ | ‐ | |
| 40/3024 (i.e. 13 per thousand) | 93/3056 (i.e. 30 per thousand) | |||||
| *The basis for the assumed risk (e.g. the mean control group risk across studies) is provided in footnotes. The corresponding risk (and its 95% confidence interval) is based on the assumed risk in the comparison group and the relative effect of the intervention (and its 95% CI). | ||||||
| GRADE Working Group grades of evidence | ||||||
| aNeurological deficit from only one trial of 30 people so we have downgraded for imprecision (GRADE 2013). bDeath downgraded for imprecision. cSeizures downgraded for imprecision. Note that because we included only the low risk of bias studies in our review, none of the evidence was downgraded because of study quality. A range of different outcome scales were used for disability (including Barthel Index and daily activities subscale of the Stroke Impact Scale), and depression (including emotional role function of the Stroke Impact Scale). | ||||||
Background
Description of the condition
Worldwide, stroke is the second leading cause of death, the third leading cause of disability (Johnson 2016), and results in 6.5 million years being lived with disability (GBD 2015). Although major advances in the early reperfusion of ischaemic stroke have been achieved in recent years (e.g. by intravenous thrombolysis, thrombectomy), and more is known about prevention of recurrent stroke), effective, safe and widely accessible and affordable treatments that facilitate early and sustained recovery after stroke are urgently needed to further reduce the burdens of disability and dependency after stroke.
Description of the intervention
Selective serotonin reuptake inhibitors (SSRIs) are drugs that have been available for many years. There are several different SSRIs which all increase brain serotonin levels by preventing its reuptake by the presynaptic neurons. They are widely used to treat mood disorders, including those that occur after stroke, such as depression and emotional lability (i.e. emotional behaviour that is outside normal control and that occurs in situations that previously would not have provoked such behaviour) (Allida 2019). SSRIs are sometimes used to manage anxiety.
Small studies have suggested that fluoxetine, one of the SSRIs, might have a favourable effect on motor recovery after stroke (Chollet 2011; Yi 2010), even in people without mood disorders. Our 2019 Cochrane Review of SSRI for stroke recovery included 63 studies of SSRIs recruiting 9168 stroke survivors within one year of their stroke, where SSRIs were used in people with or without depression (Legg 2019). Combining the studies suggested a benefit on recovery but this benefit was not apparent when low‐quality studies were excluded from the meta‐analysis.
How the intervention might work
In animal studies, multiple potentially beneficial effects of SSRIs have been demonstrated in both normal and diseased brains. First, SSRIs have a neurotrophic effect. Neurotrophins are a family of proteins that are involved in embryogenesis (formulation of an embryo) and organogenesis (development of organs). They control neural plasticity (ability to change, or easily changed or shaped) in adults, regulate synaptic activity and neurotransmitter synthesis, and are essential for the regeneration of nerves (Lang 2004). The development of new nerve cells in adults is generally restricted to specific areas of the brain, namely the subependymal cells of the ventricular system and the subgranular zone of the dentate gyrus in the hippocampus (Ming 2005). SSRIs increase neurogenesis and expression of neurotrophic or growth factors in the adult hippocampus (Schmidt 2007), and this is likely to account for the behavioural benefits of antidepressants in animals (Santarelli 2003). Importantly, several studies have shown that migration of new neurones to damaged areas of brain may occur (Wiltrout 2007), and that neurogenesis can also occur within areas of damaged brain, for example in people with Alzheimer's disease and in animal models of Alzheimer's disease (Taupin 2006).
Second, fluoxetine may have a neuroprotective effect (i.e. protect nerve cells when the brain is damaged, e.g. by a stroke). In animals, there may be several mechanisms for neuroprotective effects of SSRIs, such as reducing inflammation (e.g. repression of microglia activation) (Lim 2009), and by enhancement of specific protein expression (hypoxia inducible factor–1 alpha, heme oxygenase‐1) (Shin 2009).
Third, SSRIs can indirectly affect an important hormonal system in the body, the adrenergic system, through up‐regulation (i.e. increase a cellular component of a cell, such as ribonucleic acid (RNA) or protein, in response to an external variable) of beta1 receptors (Pälvimäki 1994).
In healthy humans, functional magnetic resonance imaging (fMRI) studies have demonstrated that fluoxetine can modulate cerebral motor activity (Loubinoux 1999). For example, in eight chronic stroke participants in (Zittel 2008) , a single dose of citalopram 40 mg led to improvements in dexterity. A 2017 review paper discussed the hypothesis that SSRI might modulate inhibitory pathways, and that this modulation might enhances reorganisation and reestablishment of excitatory‐inhibitory control, and thus promote motor recovery after stroke (Pinto 2017).
SSRIs may also improve recovery after stroke simply through their effect on preventing or treating depression and anxiety, and through improving sleep and alertness.
Why it is important to do this review
Our 2012 Cochrane Review of SSRIs for stroke recovery showed that SSRIs appeared to reduce dependence, disability, neurological impairment, anxiety, and depression after stroke, even in participants without depression, but when we included only those studies at low risk of bias, effect sizes were much smaller (Mead 2012). The review generated the hypothesis that SSRIs might promote recovery after stroke.
SSRIs interact with platelet function and clotting, and therefore may have adverse effects in people with stroke, particularly those with haemorrhagic stroke, and these adverse effects might outweigh any potential benefits.
Three large collaborative studies (AFFINITY 2020; EFFECTS 2020; FOCUS 2019), were designed based on the results of the 2012 Cochrane Review (Mead 2012), to test the hypothesis that fluoxetine given early after stroke would improve recovery, or in other words, lead to less dependency and less disability at follow‐up. The 2019 Cochrane review Legg 2019 included the results of FOCUS 2019, which recruited over 3000 participants; in the 2019 update, meta‐analysis of the studies at low risk of bias indicated that SSRIs did not improve recovery from stroke. There were improvements in disability only when studies at high risk of bias were included.
Cochrane Reviews should be updated regularly (ideally every two years when substantial new evidence becomes available). In 2020, the results of two large studies (AFFINITY 2020; EFFECTS 2020) were published and therefore we decided to update this review.
Objectives
To determine if selective serotonin reuptake inhibitors (SSRIs) are more effective than placebo or usual care at improving outcomes in people less than 12 months post‐stroke, and to determine whether treatment with SSRIs is associated with adverse effects.
Methods
Criteria for considering studies for this review
Types of studies
We included all randomised controlled trials (RCTs) in people with a clinical diagnosis of stroke (Hatano 1976), where an SSRI had been given within the first year of stroke onset i.e. 1) studies had to state that participants were recruited within 12 months of stroke onset, or 2) studies where the mean (or median) time since stroke was less than 12 months. Studies had to have reported at least one of our outcomes of interest in order to be included in the meta‐analysis. For those studies which did not report data in a form that we could use, we attempted to get the raw data from the authors, and if this was not possible, we retained the studies in the list of included studies, even though they could not be included in the meta‐analysis .
We included studies:
-
with more than two arms (e.g. SSRI versus another active treatment versus placebo). We included data from the SSRI arm and the placebo arm (or usual‐care arm if a placebo was not used), and discarded data from the other active treatment arms;
-
in all languages.
We excluded studies:
-
using a quasi‐experimental design (i.e. where investigators describe a non‐random component in the sequence generation process, such as date of admission);
-
using a cross‐over design.
There was no restriction on the eligibility of RCTs on the basis of sample size or duration of follow‐up.
Types of participants
We included studies that had recruited survivors of a stroke, defined as a sudden‐onset focal neurological disturbance, assumed to be vascular in origin, and lasting more than 24 hours (Hatano 1976). Studies had to recruit participants within 12 months of stroke onset, or the mean/median time since stroke had to be less than 12 months. We intended to include studies in subarachnoid haemorrhage and perform a subgroup analysis but we did not find any such studies. We intended to exclude trials of mixed populations (e.g. stroke and head injury) unless separate results for those with stroke were available, but we found no such studies.
Types of interventions
We included any drug classified as a SSRI (e.g. fluvoxamine, fluoxetine, sertraline, citalopram and paroxetine). We included any dose or mode of delivery, given for any duration and for any reason (e.g. to aid neurological recovery, to treat depression or anxiety or emotionalism, or to prevent depression or anxiety or other mood disorders). We did not include drugs that have mixed effects that include SSRI actions.
The comparator arm could include usual care or a placebo.
We excluded studies in which an SSRI was compared with another active intervention (e.g. another type of drug or herb or acupuncture). We also excluded studies that combined an SSRI with another active treatment and compared with the active treatment alone, because of the potential for interaction between the SSRI and other active treatment.
If studies had two SSRI arms, we combined these and compared with control.
Types of outcome measures
We included several outcomes.
Primary outcomes
We had two co‐primary outcomes:
-
independence at end of treatment. In stroke trials this is typically measured using the modified Rankin Scale (mRS), with a score of 0 to 2 conventionally considered to represent independence;
-
disability score at the end of treatment. Measures included, but were not limited to, Barthel index (BI) or Functional Independence Measure (FIM). If FIM or Barthel was not measured, we included an outcome reported in the trial that reported a construct as similar as possible to FIM or Barthel. For the trials which reported the Stroke Impact Scale, we used the daily activities subscale as a measure of disability.
Although disability scores and independence (or not) are arguably measuring the same concept, disability scores provide a more detailed description of functional outcome than simply using a dichotomous outcome such as independence. In other words, we were interested in performance in personal activities of daily living (ADL)/disability (measured using disability scores) and also independence in performance in personal ADL/disability measured using dichotomous outcome (independent or not).
Note that 'end of treatment' depends on the duration of treatment, and so the outcome might be measured at different time points in different studies. But we justified this approach because we were interested in whether an SSRI, given for any duration, led to better outcomes immediately after completing the course of the SSRI. However, to be included, the outcome measure had to be assessed at the same time in the control and SRRI group.
Secondary outcomes
-
Impairments (which can include neurological deficit scores such as the National Institute of Health Score, Motor deficit scores‐such as the Fugl‐Meyer motor score). If the total score was reported, and also motor deficit alone, we performed two separate meta‐analyses. For the trials which reported Stroke Impact Scale, we elected to use the self‐reported 'strength' domain for motor deficit.
-
Depression. We accepted any depression score. We did not decide which score to prioritise as we anticipated that trials would use only one depression score. W e included both continuous and dichotomous scores and analysed these separately.
-
Anxiety. We intended to accept any anxiety score. We intended to include both continuous and dichotomous scores and analyse these separately.
-
Quality of life. We accepted any score.
-
Fatigue. This could include any fatigue score, or the vitality component of the SF‐36 ( Short Form Survey).
-
Healthcare cost.
-
Death
-
Adverse events including gastrointestinal (GI) side effects, bleeding, seizures, and any other side effect. For this update, there were sufficient data on fractures to include this as an additional analysis, and so we included this as an additional Forest plot.
-
Cognition‐this could include self report or directly measured cognition. We would have prioritised directly measured cognition if these data had been available. In the previous update no trials reported this‐but the new trials included in this update did include cognition.
-
Leaving the trial early (for reasons other than death).
We anticipated that most studies would assess these at the end of treatment and possibly at one or more time points. We did not stipulate a minimum follow‐up time. We did not stipulate in advance precisely how multiple time points would be handled (if they had been found).
In the previous update we stated that we would also analyse change in depression scores over time. For this update, we made the decision just to analyse depression score at the end of the studies, as change in scores were not reported by the new included trials.
Search methods for identification of studies
See the methods for the Cochrane Stroke Group Specialised register. We searched for studies in all languages and arranged for the translation of trials where necessary.
Electronic searches
We developed the MEDLINE search strategy with the help of the Cochrane Stroke Group Information Specialist and adapted it for the other databases.
We searched the following electronic bibliographic databases.
-
Cochrane Stroke Group Trials Register (7 January 2021)
-
Cochrane Central Register of Controlled Trials (CENTRAL; 2021, Issue 1) in the Cochrane Library (searched 7 January 2021) (Appendix 1)
-
MEDLINE (from 1948 to 7 January 2021) (Appendix 2)
-
Embase Ovid (from 1980 to 7 January 2021) (Appendix 3)
-
CINAHL EBSCO (Cumulative Index to Nursing and Allied Health Literature ; 1982 to 7 January 2021) (Appendix 4)
-
AMED Ovid (Allied and Complementary Medicine) (from 1985 to 7 January 2021) (Appendix 5)
-
PsycINFO Ovid (from 1967 to 7 January 2021) (Appendix 6)
-
PsycBITE Psychological Database for Brain Impairment Treatment Efficacy (www.psycbite.com/) (16 July 2018)
In addition, we searched the following ongoing trials registers (Appendix 7).
-
Stroke Trials Registry (www.strokecenter.org/trials) (26 June 2018)
-
US National Institutes of Health ongoing Trials Register ClinicalTrials.gov (www.ClinicalTrials.gov) (7 January 2021)
-
World Health Organization International Clinical Trials Registry Platform (WHO ICTRP) (apps.who.int/trialsearch/) (7 September 2020)
Evidence for this update included search results from the previous version of this review), combined with results from the above searches. In Mead 2012 there had been no date limits and searches had been applied from inception of databases.
Following editorial review, one review author (GM) searched the WHO ICTRP using the term 'stroke' on 8 August 2021 to identify any new trials registered after 7 July 2020 i.e. > 1 year since last search.
Searching other resources
In an effort to identify further published, unpublished and ongoing studies, we:
-
searched reference lists of included trials and relevant reviews when full texts were retrieved for detailed scrutiny;
-
contacted researchers in the field.
Data collection and analysis
Selection of studies
Joshua Cheyne (Cochrane Stroke Group Information Specialist), ran the searches of CENTRAL, MEDLINE, Embase, CINAHL, AMED, and PsycINFO, and downloaded the resulting references into Reference Manager. These were imported into Covidence, which automatically removed some, but not all, of the duplicates.
Any two review authors (from GM, EL, LAL, MK, SW, RT, A‐SR, LL,C‐FH, MH or XH) independently scrutinised the resulting titles and abstracts and excluded obviously irrelevant reports and duplicates. We obtained full texts of potentially eligible studies. Any two review authors (from GM, AB, EL, LAL, MK, SW, RT, A‐SR, LL C‐FH or XH) independently applied inclusion and exclusion criteria; if there was lack of consensus, a third review author (usually GM unless she had already scrutinised the paper) also applied inclusion and exclusion criteria.
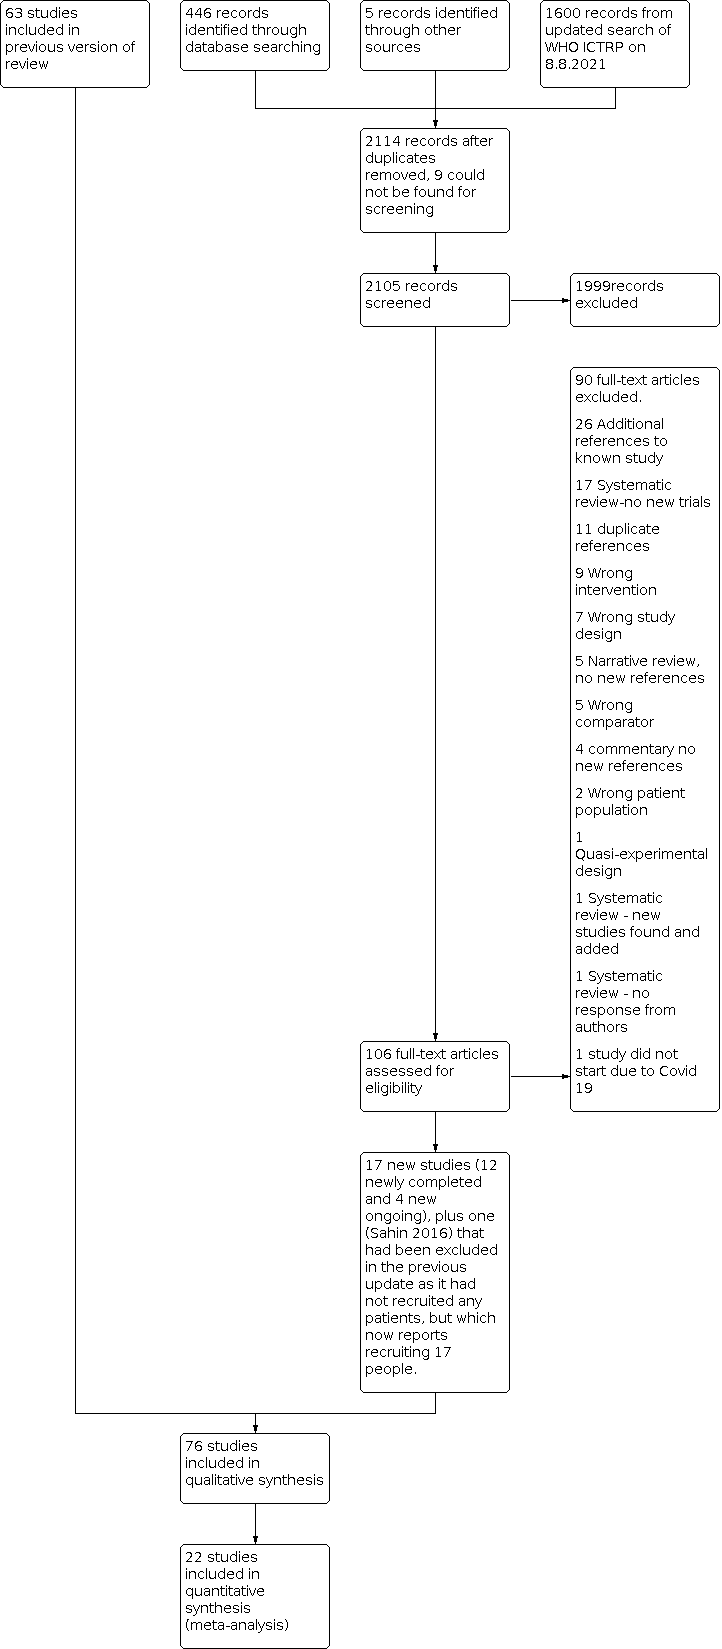
We include a flow diagram that includes the number of unique references identified by the searches, the number of records excluded after preliminary screening of titles and abstracts, the number of records retrieved in full text, and the number of studies fulfilling our inclusion criteria (Figure 1).

PRISMA flow diagram for this update
Data extraction and management
For the new eligible studies that we had identified, any two review authors (from GM, EL, LAL, MK, MH, SW, RT, LL, A‐SR, LL, C‐FH or XH) independently extracted data from each new study.
We extracted the following data:
-
the report: author, year and source of publication;
-
the study: sample characteristics, social demography;
-
the participants: stroke sequence (first‐ever versus recurrent), social situation, time since stroke onset, prior history of psychiatric illness, current neurological status, stroke severity, whether people with aphasia were recruited, the proportion with depression at baseline (if recorded by trialists), we did not extract information on location or size of lesion as this was unlikely to have been recorded by the trialists, and brain imaging often does not show a visible infarct in people with minor strokes;
-
the research design and features: adherence, non‐response and length of follow‐up;
-
the intervention: type, duration, dose, timing and mode of delivery;
-
the effect size: sample size, nature of outcome, estimate and standard deviation (SD) (or standard error (SE));
-
source of funding.
Methods in previous versions were broadly similar and are fully reported in previous versions (Legg 2019; Mead 2012)
Assessment of risk of bias in included studies
We assessed risks of bias using the Cochrane 'Risk of bias' tool (Higgins 2017). We assessed the methods used in each study to control for the following potential sources of bias: sequence generation (selection bias); allocation concealment (selection bias); blinding of participants, personnel and outcome assessors (performance and detection bias); incomplete outcome data (attrition bias); selective outcome reporting (reporting bias); and other potential threats to validity.
Where there was a disagreement between the two review authors on risk of bias, a third review author (LAL, GM) reviewed the data and reached a consensus in discussion with the first two review authors.
For incomplete outcome data, we categorised as 'low risk' if missing data were imputed using appropriate methods or if missing outcome data overall were less than 5%. For this update, we decided to categorise studies as low risk of bias if more than 5% of data were missing providing the number of participants with missing data was balanced between groups and the reasons for missing data were unrelated to treatment allocation.
We extracted data on source of funding, and listed this under 'Other sources of bias'. If the source of funding was not given, or if there were links with the pharmaceutical industry and no explicit statement that the funder had no input into the design or analysis of the study, we classified this as 'unclear risk'. We also recorded any other potential threats to validity.
We also extracted data on how adverse effects were reported, and listed these in the descriptions of the studies.
If a study author was also one of the review authors, a review author who was not involved in the study extracted data and assessed quality.
For this 2021 update, we contacted study authors to obtain more information to enable us to make judgements about risk of bias if this was unclear from the paper, AND if this was going to influence whether a study was categorised as low risk of bias across all seven domains i.e. changing a judgement of 'uncertain' to 'low risk' of bias.
Measures of treatment effect
For dichotomous data, we reported risk ratios (RRs). For ordinal scales, where there was a well‐recognised cut‐point in the scale (e.g. mRS) we analysed the data as a dichotomous outcome (dependent or independent).
For ordinal scales with no recognised cut‐point, we analysed the data as continuous data. The data required for meta‐analyses of continuous data in Review Manager 5 are means and standard deviations (SDs) (Review Manager 2014). When extracting continuous data from the study reports, we checked whether trials reported the SD or the standard error (SE). We had planned to use the SE or 95% confidence interval (CI) to compute the SD when SDs were missing, but this was not needed as all the trials reported SDs.
For ordinal scales and continuous data, we calculated standardised mean differences (SMDs), because different scales were used for the same outcomes (e.g. Barthel Index (BI) and Funtional Independence Measure (FIM) for disability score, the Beck Depression Inventory (BDI) or the Hamilton Rating Scale for Depression (HAMD) for depression). The SMD does not correct for differences in the direction of the scale. Some scales increase with disease severity and others decrease, so we multiplied the mean value from one set of trials by −1. For example, in the National Institute of Health Stroke Scale (NIHSS), a low score indicates a less severe stroke, whilst a low score in the Scandinavian Stroke Scale (SSS) indicates a more severe stroke.
If there was more than one outcome measure in the same domain (e.g. two different depression scales), we made a post‐hoc decision to select the one with the most complete data.
Unit of analysis issues
The number of observations in the analysis should match the number of 'units' that were randomised. We considered outcomes measured at the end of treatment and at the end of follow‐up in separate analyses. For side effects, we considered the number of participants developing a specified side effect rather than the total number of side effects in each group.
Dealing with missing data
For this update, we contacted authors of new trials to obtain any data that we needed for our meta‐analysis that had not been included in a published full‐text article or an abstract.
Note that for some analyses, the sample size is slightly different for different outcomes, this is because of the missing responses for some outcomes.
Assessment of heterogeneity
We assessed whether there was evidence of inconsistency in our results by considering possible clinical, methodological, and statistical heterogeneity. We assessed clinical and methodological heterogeneity by comparing similarities in our included studies between study designs, participants, interventions, and outcomes.
We quantified the effect of heterogeneity using the I2 statistic. We assessed statistical heterogeneity by visually examining forest plots. Thresholds for the interpretation of the I2 statistic can be misleading, since the importance of inconsistency depends on several factors. A rough guide to interpretation in the context of meta‐analyses of randomised trials is as follows: (Section 9.5.2; Deeks 2021):
-
0% to 40% is not considered important;
-
30% to 60% suggests moderate heterogeneity;
-
50% to 90% suggests substantial heterogeneity;
-
75% to 100% is considerable heterogeneity.
Assessment of reporting biases
We searched clinical trials registers to identify published protocols for each of our included studies. We checked for selective reporting of results by comparing the published protocol with the published full‐text article and by scrutinising the aims and methods of the trials and comparing these with outcomes reported. We found several papers by the same authors, and contacted the authors to check whether the publications were duplicates or to check if the included study populations were unique. If it was not possible to determine whether different publications reported overlapping groups of participants, we included just one of the papers and listed the others as awaiting assessment.
If we had identified a sufficient number of included studies at low risk of bias (i.e. more than 10 studies (Sterne 2017), we would have generated a funnel plot of low risk of bias studies, to assess risk of publication bias, an asymmetrical funnel plot might have suggested publication of only positive results (Egger 1997). We made a post‐hoc decision to perform a funnel plot for all studies, irrespective of risk of bias, for the co‐primary outcome of disability.
We deployed a comprehensive search strategy in an effort to avoid reporting biases in our review methodology. See Search methods for identification of studies.
We tried to avoid language bias by including all trials, irrespective of language: we sought translation where needed.
Data synthesis
We completed meta‐analysis of outcomes for which we had comparable effect measures from more than one study, and when measures of heterogeneity indicated that pooling of results was appropriate. We used the statistical calculator provided in Review Manager 5 to perform meta‐analysis (Review Manager 2014).
We used a fixed‐effect model (Mantel 1959), rather than a random‐effects model because of the dominance of the three largest trials (AFFINITY 2020, EFFECTS 2020; FOCUS 2019); random effects would have given too much weight to the smaller trials. The dominance of the three large trials makes a fixed‐effect model a more reliable indicator of the effect than the average across the smaller trials. We assessed the robustness of the results to choice of model using a sensitivity analysis for our primary outcomes.
In the initial 2012 review, we had performed multiple meta‐analyses of all the primary and secondary outcomes, included all trials irrespective of risk of bias, and then explored the influence of each aspect of bias on estimates of effects in a series of sensitivity analyses.
In the 2019 review we limited our analyses of all outcome measures to studies at low risk of bias (Higgins 2017), as we wanted reliable data, not confounded by bias, to find out whether SSRIs were more effective than placebo or usual care at improving a range of important outcomes. Also, had we included all studies, irrespective or risk of bias, for all available outcomes, the number of analyses would have become unmanageable within the resources we had. However, in the 2019 review, we performed a sensitivity analysis by using data on our two primary outcomes (disability and independence) from all trials, irrespective of risk of bias. For this current update, we use the same approach.
We reached decisions on overall risk of bias by study by consideration of six risk of bias domains: sequence generation, allocation concealment, blinding of participants and trial personnel, blinding of outcome assessment, incomplete outcome data, selective outcome reporting and other risk of bias. We required a study to have a judgement of low risk of bias in all domains in order to categorise it as having an overall low risk of bias.
Subgroup analysis and investigation of heterogeneity
If there had been at least two studies at low risk of bias across all six domains of risk of bias, we would have explored variability in the participants, interventions, and outcomes among studies using the following subgroups.
-
Type of SSRI.
-
Studies with depression at baseline as an inclusion criterion and those where depression was not an inclusion criterion.
-
Time since stroke at recruitment. We categorised these as less than three months (0 ‐ 90 days), three to six months (91 to 108 days), six to nine months (181 to 271 days) or nine to 12 months (272 to 365 days).
Finding high statistical heterogeneity (I2 > 50%) would not have prevented us from performing a subgroup analysis, rather we would have considered the reason for this heterogeneity.
We did not perform subgroup analyses by type of SSRI or time since stroke as all studies included in the main analyses were similar with regard to these characteristics.
Sensitivity analysis
We explored the potential effects of decisions made as part of the review process as follows.
-
We included all studies regardless of risk of bias judgement for our primary outcomes of disability score and independence.
-
We conducted meta‐analysis using the alternate meta‐analytical effects model (fixed‐effect or random‐effects) for just those studies at low risk of bias across all six domains.
-
We intended to conduct a meta‐analysis using the alternate 'last available follow‐up' time point if studies had reported more than one follow‐up after the end of treatment, but none of the included studies did this.
-
We compared effect estimates from the above results with effect estimates from the main analysis. We reported differences that altered the interpretation of effects.
Summary of findings and assessment of the quality of the evidence
We created a summary of findings table using the following outcomes: disability; dependent according to the mRS; neurological deficit score; depression (continuous data); death; seizures; and gastrointestinal side effects (summary of findings Table 1). We chose these outcomes as they are of high clinical relevance. We used the five GRADE considerations (study limitations, consistency of effect, imprecision, indirectness and publication bias) to assess the quality of the body of evidence as it relates to the studies that contribute data to the meta‐analyses for the prespecified outcomes (Atkins 2004). We used methods and recommendations described in Chapter 11 of the Cochrane Handbook for Systematic Reviews of Interventions (Schünemann 2017), using GRADEproGDT software (GRADEproGDT 2015). We justified all decisions to downgrade the quality of studies using footnotes, and made comments to aid the reader's understanding of the review where necessary.
Summary of findings and assessment of the certainty of the evidence
We created a 'Summary of findings' table using the following outcomes: disability; dependent according to the mRS; neurological deficit score; depression (continuous data); death; seizures; and gastrointestinal side effects (summary of findings Table 1). We chose these outcomes as they are of high clinical relevance. We used the five GRADE considerations (study limitations, consistency of effect, imprecision, indirectness and publication bias) to assess the quality of the body of evidence as it relates to the studies that contribute data to the meta‐analyses for the prespecified outcomes (Atkins 2004). We used methods and recommendations described in Chapter 11 of the Cochrane Handbook for Systematic Reviews of Interventions (Schünemann 2017), using GRADEproGDT software (GRADEproGDT 2015). We justified all decisions to downgrade the quality of studies using footnotes, and made comments to aid the reader's understanding of the review where necessary.
Results
Description of studies
For substantive descriptions of studies see: Characteristics of included studies, Characteristics of excluded studies, Studies awaiting classification, and Characteristics of ongoing studies.
Results of the search
For this update, we screened 221 references from database searches and accessed the available full‐text reports for 10 6 studies. This included a systematic review from which we identified five new studies from China (Chen 2015; Hu 2018; Li 2007; Li 2017; Wang 2009).
As a final check for new studies, WHO ICTRP was searched by one review author (GM) on 8 August 2021 and 1600 citations screened.
The flow diagram is shown in Figure 1. This includes the results of the August 2021 search of the WHO ICTRP.
The 2019 version of this review (Legg 2019), identified 63 completed studies recruiting 9168 stroke survivors within one year of their stroke; and 16 ongoing studies (AFFINITY 2020; Asadollahi 2018; Bembenek 2020; Dike 2019; EFFECTS 2020; EudraCT 2005‐005266‐37; Bonin Pinto 2019 ; IRCT201112228490N1; IRCT2012101011062N1; IRCT2017041720258N37; NCT02386475; NCT02737930; NCT02767999; NCT02865642; NCT03448159; NCT03826875).
Of these 16 previously ongoing studies, six have now been published (AFFINITY 2020; Asadollahi 2018; Bembenek 2020; Dike 2019; EFFECTS 2020; Bonin Pinto 2019); we excluded one of these at it recruited patients within two years (not one year) of stroke (Bonin Pinto 2019). One trial which we had previously listed as 'excluded' has been moved to our list of included studies; this study recruited only 17 patients and was terminated due to slow recruitment and lack of funding to expand to other sites (NCT02737930).
Based on information provided in trials registers: we found the following.
-
Five of these previously ongoing studies are still ongoing: EudraCT 2005‐005266‐37, NCT02767999, NCT02865642, NCT03448159, NCT03826875.
-
There are no results for IRCT201112228490N1; the authors were contacted on 20 April 2021 but no response was received; this trial is also listed as ongoing.
-
Three studies are completed but the results are not yet available; these are still listed as ongoing (IRCT2012101011062N1; IRCT2017041720258N37; NCT02386475).
Our January 2021 searches identified two new completed studies (Cao 2020; Gong 2020) and three new ongoing studies (ChiCTR1800019467; CTRI/2018/12/016568; TCTR20181216001). An additional study identified in the January 2021 searches did not start due to the COVID 19 pandemic (ACTRN12619000573156).
The flow of search results for the previous version of the review are reported in Legg 2019. We report details of the search for this update in a PRISMA flow chart (Figure 1). This includes our additional searches of WHO ICTRP on 8 August 2021, to identify any new ongoing studies, where we used the broad search term 'STROKE' which identified 1600 records, of which two records which were scrutinised in detail; one of these is now included as an ongoing study (IRCT20210307050617N1).
Included studies
In the previous version of the review (Legg 2019), there were 63 included studies recruiting a total of 9168 randomised participants. One study had previously been included in the list of excluded studies, but for this review we included it in our list of included studies as it now reports having recruited 17 participants although the results are not available (NCT02737930).
For the current 2021 update, we identified a further 12 completed studies providing data for meta‐analysis and recruiting a total of 3845 more participants (AFFINITY 2020; Asadollahi 2018; Bembenek 2020; Cao 2020; Chen 2015; Dike 2019; EFFECTS 2020; Gong 2020; Hu 2018; Li 2007; Li 2017; Wang 2009). Five of these studies (Chen 2015; Hu 2018; Li 2007; Li 2017; Wang 2009), were identified from the reference list of a 2020 systematic review (Li 2020). For Cao 2020, there are two reports (one reporting 97 participants and the other reporting 100 participants, with overlapping periods for recruitment, almost identical stroke subtypes in the control and citalopram groups, the same funding source, and identical text in some sections of the papers); the author did not respond to our request for clarification, and the editors of the journals in which they were published also did not receive a response from the authors, so to avoid the possibility of double‐counting the same participants, we included just one paper reporting 100 participants.
Overall, we now have a total of 76 included studies recruiting 13,029 participants (Figure 1). Of these, 22 contributed to the quantitative syntheses; the remaining studies were not of sufficiently high quality to be included in the main analyses, or did not report our co‐primary outcomes of disability, or independence, or did not report any results .
Of the 76 included studies:
-
38 studies used fluoxetine (AFFINITY 2020; Bembenek 2020; Birchenall 2019; Brown 1998; Chen 2001; Cheng 2003; Chollet 2011; Dam 1996; Dike 2019; EFFECTS 2020; Feng 2004; FOCUS 2019; Fruehwald 2003; Gong 2020; He 2004; He 2016; Hu 2002; Huang 2002; Kong 2007; Li 2004a; Li 2004b; Li 2008; Marquez Romero 2013; NCT01674868; NCT02737930; Pariente 2001; Razazian 2014; Restifo 2001; Robinson 2000a; Robinson 2000b; Shah 2016; Song 2006; Wang 2003; Wen 2006; Wiart 2000; Xu 2001; Zhao 2011; Zhou 2008);
-
eight studies used sertraline (Almeida 2006; Burns 1999; Guo 2009; Meara 1998; Murray 2005; NCT00177424; Rasmussen 2003; Xie 2005);
-
13 studies used paroxetine (Chen 2002; Chen 2005b; GlaxoSmithKline 1998; He 2005; Lai 2006; Li 2005; Li 2007; Pan 2018; Wang 2009; Xu 2006; Yang 2002; Yang 2011; Ye 2004);
-
nine studies used citalopram (Acler 2009; Andersen 1994; Andersen 2013; Chen 2015; Gao 2017; Li 2006; Liu 2006; Miao 2004; Savadi Oskouie 2012)
-
five studies used escitalopram (Cao 2020; Hu 2018; Kim 2017; Li 2017; Robinson 2008);
-
one study used either sertraline or fluoxetine (Jia 2005);
-
two studies used citalopram or fluoxetine (Chen 2005a; Asadollahi 2018).
Baseline sociodemographic and clinical characteristics
The mean age of participants ranged from 51 ± 7 years (Song 2006), to 75.6 years (Wang 2003), with most studies recruiting participants in their 60s. There are more men than women. Patients with ischaemic stroke and/or primary intracerebral haemorrhage were included.
Mean time since stroke
Of the 76 included studies: (numbers below add up to 76 not 75).
-
Forty‐four studies report recruiting participants between 0 and 90 days after stroke onset (AFFINITY 2020; Acler 2009; Almeida 2006; Andersen 1994; Andersen 2013; Bembenek 2020; Birchenall 2019; Chen 2001; Chen 2005b; Cheng 2003; Chollet 2011; Dike 2019; EFFECTS 2020; Feng 2004; FOCUS 2019; Fruehwald 2003; Gao 2017; Gong 2020; He 2004; He 2016; Hu 2002; Huang 2002; Asadollahi 2018; Kim 2017; Kong 2007; Li 2004a; Li 2004b; Li 2008; Marquez Romero 2013; Pan 2018; Rasmussen 2003; Robinson 2008; Savadi Oskouie 2012; Shah 2016; Song 2006; Wen 2006; Wiart 2000; Xie 2005; Xu 2001; Xu 2006; Yang 2011; Ye 2004; Zhao 2011; Zhou 2008).
-
Five studies described participants as having an 'acute stroke'; so we have included these in the zero‐to‐three‐month group (Cao 2020; He 2005; Lai 2006; Li 2006; NCT02737930).
-
Two further studies reported that the mean time since stroke was between five and 16 weeks, so we included these in the zero‐to three‐month group (Robinson 2000a; Robinson 2000b).
-
One study, which did not recruit any participants, had an inclusion criterion of less than 15 days before stroke (NCT01674868).
-
Four studies report recruiting participants three to six months (91 to 108 days) after stroke onset: Dam 1996 (described as participants being one to six months), Miao 2004, Murray 2005, and Yang 2002 ('recovery phase of stroke' two to six months).
-
Two studies report recruiting participants at six to nine months (181 to 271 days) after stroke onset (Guo 2009; Li 2006).
-
No study reported recruiting participants between nine and 12 months after stroke.
-
One study reported the experimental and control group being median 10.5 months and 5.5 months after stroke, respectively (Burns 1999).
-
Seventeen studies did not report the precise time (Brown 1998; Chen 2002; Chen 2005a; Chen 2015; GlaxoSmithKline 1998; Hu 2018; Jia 2005; Li 2005; Li 2007; Li 2017; Meara 1998; NCT00177424; Pariente 2001; Razazian 2014; Restifo 2001; Wang 2003; Wang 2009).
Depression as an inclusion criterion
Thirty‐seven studies included participants affected by depression (i.e. depression used as an inclusion criterion) (Andersen 1994; Chen 2001; Chen 2002; Chen 2005a; Chen 2005b; Chen 2015; Cheng 2003; Feng 2004; Fruehwald 2003; GlaxoSmithKline 1998; Guo 2009; He 2005; Hu 2002; Hu 2018; Huang 2002; Jia 2005; Lai 2006; Li 2004a; Li 2004b; Li 2005; Li 2006; Li 2008; Li 2017; Liu 2006; Meara 1998; Miao 2004; Murray 2005; Robinson 2000a; Song 2006; Wang 2003; Wang 2009; Wiart 2000; Xie 2005; Xu 2001; Yang 2002; Yang 2011; Ye 2004).
Thirty‐nine studies did not use depression as an inclusion criterion (Acler 2009; AFFINITY 2020; Almeida 2006; Andersen 2013; Bembenek 2020; Birchenall 2019; Brown 1998; Burns 1999; Cao 2020; Chollet 2011; Dam 1996; Dike 2019; EFFECTS 2020; FOCUS 2019; Gao 2017; Gong 2020; He 2004; He 2016; Asadollahi 2018; Kim 2017; Kong 2007; Li 2007; Marquez Romero 2013; NCT00177424; NCT01674868; NCT02737930; Pan 2018; Pariente 2001; Rasmussen 2003; Razazian 2014; Restifo 2001; Robinson 2000b; Robinson 2008; Savadi Oskouie 2012; Shah 2016; Wen 2006; Xu 2006; Zhao 2011; Zhou 2008).
The criteria for diagnosing depression varied between studies.
Excluded studies
Our table of excluded studies is as brief as possible and does not list studies that obviously do not fulfil the inclusion criteria. There are a total of 28 excluded studies.
We describe a total of 28 studies in our table of excluded studies (ACTRN12619000573156; Andersen 1993; Andersen 2012; Anderson 2002; Anonymous 2012a; Anonymous 2012b; Berends 2009; Chen 2019; Choi Kwon 2008; Finkenzeller 2009; Foster 2019; Bonin Pinto 2019; Gourab 2015; Graffagnino 2002; Ji 2000; Kitago 2020; Li 2002; Liang 2003; Liu 2004; Liu 2020; Mosarrezaii 2018; NCT01963832; Robinson 2011; Sitzer 2002; Sun 2015; Vogel 2020; Xu 2007; Zhou 2003). Eight of these studies were excluded during this update (ACTRN12619000573156; Chen 2019; Foster 2019; Bonin Pinto 2019; Kitago 2020; Liu 2020; Mosarrezaii 2018; Vogel 2020).
Ongoing studies
The following studies are either ongoing or are completed but have not yet published results (ChiCTR1800019467; CTRI/2018/12/016568; EudraCT 2005‐005266‐37; IRCT201112228490N1; IRCT2012101011062N1; IRCT2017041720258N37; IRCT20210307050617N1; NCT02386475; NCT02767999; NCT02865642; NCT03448159; NCT03826875; TCTR20181216001). See Characteristics of ongoing studies.
Studies awaiting classification
The same studies that were listed as 'awaiting classification' in the previous version of the review of Legg 2019 continue to be listed as 'awaiting classification' as no new information is available to change these classification (Guo 2016; He 2018; Jurcau 2016; NCT00967408). See Characteristics of studies awaiting classification.
Risk of bias in included studies
All 76 studies were randomised controlled trials (RCTs). We could not assess risk of bias in one study as there are no published data, just information on a trials register (NCT02737930). Thirty‐two studies were at low risk of bias for random sequence generation and 44 at unclear risk. See Figure 2 and Figure 3.

Risk of bias summary: review authors' judgements about each risk of bias item for each included study.

'Risk of bias' graph: review authors' judgements about each 'risk of bias' item presented as percentages across all included studies.
Allocation
For allocation concealment, we assessed 21 studies to be at low risk of bias and 55 studies to be at unclear risk. Figure 2 and Figure 3 demonstrate selection bias.
Blinding
For performance bias, we assessed 26 studies to be at low risk of bias, 23 studies to be at unclear risk of bias, and 26 studies to be at high risk of bias for blinding of participants.
For blinding of outcome we assessed 25 studies to be a low risk of bias, 48 studies to be at unclear risk of bias, and two studies to be at high risk of bias. Figure 2 and Figure 3 demonstrate blinding.
Incomplete outcome data
For incomplete outcome data we assessed 28 studies to be at low risk of bias, 20 studies to be at unclear risk of bias, and 27 studies to be at high risk of bias. Figure 2 and Figure 3 demonstrate attrition bias.
Selective reporting
We assessed 20 studies to be at low risk of bias, 46 studies to be at unclear risk of bias, and nine studies to be a high risk of bias for selective outcome reporting. Figure 2 and Figure 3 demonstrate reporting bias.
Other potential sources of bias
Other sources of bias
These are shown in the final column of Figure 2 and Figure 3. There were 23 studies at low risk of bias, seven at high risk, and the rest were at unclear risk.
Low risk of bias across all domains
Six trials were at low risk of bias across all domains (AFFINITY 2020; Asadollahi 2018; Bembenek 2020; EFFECTS 2020; FOCUS 2019; Marquez Romero 2013) (Figure 2; Figure 3). For two of these trials, the final judgement was made after obtaining further information from the trialists (Asadollahi 2018; Bembenek 2020).
Following editorial review, one trial that had been included as low risk of bias across all domains in the previous review was re‐categorised as unclear risk of bias for 'other sources of bias' as there were baseline differences in motor scores (Chollet 2011).
Publication bias
We performed a funnel plot for the outcome of disability, for all trials irrespective of risk of bias (Figure 4). This suggests publication bias, with a cluster of studies in the upper left portion of the graph.

Funnel plot, all studies irrespective or risk of bias, for disability at end of treatment.
Effects of interventions
Primary outcomes (low risk of bias trials only)
Disability score at the end of treatment
Of the six studies at low risk of bias in all seven domains, two reported Barthel score as median and interquartile range (QR) (Bembenek 2020; Marquez Romero 2013). For one study (Marquez Romero 2013), we converted the median Barthel score and IQR to mean and standard deviation (SD) using a method described in Wan 2014.
For Bembenek 2020, AFFINITY 2020, EFFECTS 2020, and FOCUS 2019 the authors supplied the mean and SD of the activities of daily living score (five questions about activities done during a typical day) of the Stroke Impact Scale.
One did not report disability or independence and so is not included in the analyses of disability and independence (Asadollahi 2018).
There was no difference in measures of disability between selective serotonin reuptake inhibitors (SSRIs) and placebo (Analysis 1.1): the standard mean difference (SMD) with a fixed‐effect model (SMD −0.00, 95% CI −0.05 to 0.05; P = 0.98; 5 studies, 5436 participants; high‐quality evidence) with no heterogeneity (I2 = 0%).
Independent on modified Rankin score (mRS 0 to 2) at the end of treatment
We combined data from the five studies at low risk of bias across all seven domains for the outcome of independent on mRS 0 to 2 using a risk ratio with a fixed‐effect model (RR 0.98, 95% CI 0.93 to 1.03; P = 0.37; 5 studies, 5926 participants, high‐quality evidence). The I2 was 32%, moderate heterogeneity (Analysis 1.2).
Secondary outcomes (low risk of bias trials only)
Impairments: neurological deficit score at the end of treatment
One study (30 participants) of high quality reported neurological deficit scores. The study authors reported no difference in neurological score for participants who received and SSRI compared with those who received a placebo (Analysis 1.3).
Impairments: motor deficits at end of treatment
We combined data for the six low risk of bias studies that reported motor deficits, using the SMD with a fixed‐effect model. The analysis found no difference between SSRI and placebo (SMD 0.03, 95% CI −0.02 to 0.08; P = 0.23; 6 studies, 5518 participants, I2 = 75%, substantial heterogeneity, moderate‐quality evidence) (Analysis 1.4).
We downgraded the evidence to 'moderate' as the data from several trials were by self‐report rather than by an objective assessment of deficits. Note that data from Marquez Romero 2013 are means and SDs estimated from reported medians and interquartile ranges using a method described in Wan 2014.
Depression severity at end of treatment (continuous data)
We combined data from the four studies with an overall low risk of bias for the outcome of depression severity using the SMD with a fixed‐effect model (SMD −0.14, 95% CI −0.19 to −0.08; P < 0.01; 4 studies, 5356 participants; high‐quality evidence). Participants who received fluoxetine had significantly lower end‐of‐treatment scores on measures of depression than those participants receiving placebo (Analysis 1.5) with moderate heterogeneity (I2 = 36%, P < 0.01).
Depression at the end of treatment (dichotomous data)
Data were available for three studies at low risk of bias (Analysis 1.6). Risk of depression was lower in the SSRI group (RR 0.75, 95% CI 0.65 to 0.86; 3 studies, 5907 participants, P < 0.01 ), with no important heterogeneity (I2 = 0%). This was assessed as high‐quality evidence.
Anxiety severity at end of treatment (continuous data)
No studies at low risk of bias reported measures of anxiety.
Anxiety severity at end of treatment (dichotomous data)
No studies at low risk of bias reported number of diagnoses of anxiety.
Death at end of treatment
We combined data for the six studies with an overall low risk of bias for the outcome of death, using a risk ratio with a fixed‐effect model. The analysis found no difference in the total number of deaths between SSRI and placebo (RR 1.01, 95% CI 0.82 to 1.24; P = 0.98; 6 studies, 6090 participants, moderate quality evidence), with no evidence of heterogeneity (I2 = 0%) (Analysis 1.7).
Side effects: seizures at end of treatment
We combined data for the six studies with an overall low risk of bias for the outcome of seizures, using a risk ratio with a fixed‐effect model. The analysis showed more patients had seizures in the SSRI than control group (RR 1.40, 95% CI 1.00 to 1.98; P = 0.05; 6 studies, 6080 participants, moderate‐quality evidence because wide confidence intervals), with moderate heterogeneity (I2 = 45%) (Analysis 1.8).
Gastrointestinal side effects at end of treatment
One study (30 participants) of high quality reported 'gastrointestinal side effects' at the end of treatment. The study authors reported no difference in 'gastrointestinal side effects' for participants who received and SSRI compared with those who received a placebo (Analysis 1.9).
Side effects: bleeding at end of treatment
We combined data from the six studies at low risk of bias using a risk ratio with fixed‐effects model (Analysis 1.10). The risk ratio was 1.08 (95% CI 0.69 to 1.70; P = 0.73, 6 trials, 6088 participants, high‐quality evidence). There was no important heterogeneity I2 = 0%).
Side effects: fractures at end of treatment
We combined data from the six studies at low risk of bias. SSRIs were associated with higher risk of fractures (RR 2.35, 95% 1.62 to 3.41, 6 studies, 6080 participants, high‐quality evidence, P < 0.01, I2 = 0%, no important heterogeneity) (Analysis 1.11).
Cognition at end of treatment (continuous data)
Of the six studies at low risk of bias, four studies reported the memory domain of the Stroke Impact Scale (AFFINITY 2020; Bembenek 2020; EFFECTS 2020; FOCUS 2019). MD was ‐1.22 (95% CI ‐2.37 to ‐0.07) in favour of control, 4 trials, 5373 participants, I2 72%, P = 0.04 (Analysis 1.12). There was substantial heterogeneity. We downgraded to moderate‐quality evidence because the cognition outcomes were self‐reported, not directly measured. Note that the size of the mean difference between treatment and placebo is very small.
Leaving the study early (before the end of scheduled follow‐up) for reasons other than death
We combined data for studies with an overall low risk of bias for the outcome of leaving the study before the end of scheduled follow‐up, using a risk ratio with a fixed‐effect model. The analysis suggested a slight excess of people leaving early in the SSRI group with no evidence of heterogeneity (RR 1.57, 95% CI 1.03 to 2.40, P = 0. 04, 6 studies, 6090 participants; I2 = 0%, no important heterogeneity, high‐quality evidence) (Analysis 1.13).
Fatigue
Four trials reported SF36 Vitality score as a measure of fatigue (AFFINITY 2020; EFFECTS 2020; Bembenek 2020; FOCUS 2019). The mean difference between groups was ‐0.06 (95% CI ‐1.24 to 1.11; 5524 participants, P = 0.92, I2 = 0, no important heterogeneity, moderate‐quality evidence). We downgraded quality because of wide confidence intervals (Analysis 1.14).
Quality of life
Three trials used EQ5 5DL and reported mean and standard deviation in each group which enabled us to perform a meta‐analysis. (FOCUS 2019; AFFINITY 2020; EFFECTS 2020 ). The mean difference between groups was ‐0.00 (95% CI ‐0.02 to 0.02), 5482 participants, P = 0. 93 ; I2 = 0, no important heterogeneity, high ‐ quality of evidence) (Analysis 1.15).
Healthcare costs
No trial reported healthcare costs.
Outcomes at the end of follow‐up
We repeated the analyses above for all outcomes reported at the end of follow‐up for the studies at low risk of bias across all domains. Four studies collected data on outcomes 12 months after completing the intervention and so we selected this time point for our analyses (AFFINITY 2020; Bembenek 2020; EFFECTS 2020; FOCUS 2019). Two studies have not yet published their 12‐month data and so are not included in this meta‐analysis (AFFINITY 2020; EFFECTS 2020). We analysed available data for other two studies (Bembenek 2020; FOCUS 2019).
These analyses are shown in Analysis 2.1 to Analysis 2.10. There was no clear evidence of differences between SSRI and control for any outcome.
Subgroup analyses by intervention characteristics and subsets of participant
We did not perform preplanned subgroup analyses by intervention characteristics and subsets of participant (including with or without depression) of the studies at low risk of bias, because they all used fluoxetine and all did not require participants to have depression to enter the trial.
Sensitivity analysis
Inclusion of all studies regardless of 'Risk of bias' judgement for the co‐primary outcomes
We included all studies reporting disability, regardless of 'Risk of bias' judgement for the co‐primary outcome of disability at the end of treatment using a SMD and a fixed‐effect model.
For disability, participants who received an SSRI intervention had significantly lower end‐of‐treatment scores than those participants receiving placebo or standard care/practice (SMD ‐0.18, 95% CI ‐0.23 to ‐0.14; P < 0.00001; 32 studies, 7667 participants) with considerable heterogeneity (I2 = 94% ) (Analysis 1.16). Our post‐hoc analysis (Funnel plot, Figure 4) demonstrated an absence of studies in the right hand side of the plot, consistent with publication bias.
We included all studies regardless of risk of bias judgement for the co‐primary outcome of independence.
Note that previously Andersen 2013 had the mRS data entered as a continuous variable for disability; for this update we have entered it only as dichotomous data for mRS.
The mRS 0 to 2 at the end of treatment was similar in the two groups (RR 0.97, 95% CI 0.93 to 1.01; P = 0.18, I2 = 59%, 8 studies, 6792 participants) (Analysis 1.17).
Meta‐analysis using the alternate meta‐analytical effects model (fixed‐effect or random‐effects) for the primary outcomes from the high‐quality studies
We re‐analysed the data for our primary outcomes (disability score and independence (0‐2 on mRS) using the random‐effects analysis for the high‐quality studies. This made no difference to the results (Table 1).
| mRS (RR and 95% CI) | Disability (SMD and 95% CI) | |
|---|---|---|
| Fixed‐effect | 0.98 (0.93, 1.03) | ‐0.0 (‐0.05, 0.05) |
| Random‐effects | 0.98 (0.92, 1.04) | ‐0.00 (‐0.05, 0.05) |
CI: confidence interval
mRS: modified Rankin Scale
RR: risk ratio
SMD: standardised mean difference
Discussion
Summary of main results
For this update we included 76 studies with 13,029 participants, of which 38 used fluoxetine and the remaining studies used other selective serotonin reuptake inhibitors (SSRIs) . Data from our co‐primary outcomes (disability, independence) were not collected in many of the studies.
Six studies were at low risk of bias across all key domains; these all recruited participants who were less than 90 days after stroke onset, none used depression as an inclusion criterion; and they all compared fluoxetine with placebo. Comparing fluoxetine to placebo in these trials, we found high‐quality evidence of no beneficial effects of fluoxetine on our co‐primary outcomes (disability and independence) at end of treatment. We found high‐quality evidence that fluoxetine reduced the severity of depression evaluated using a continuous outcome and the number of participants with depression at end of treatment. We found an excess of participants having seizures and bone fractures amongst those allocated to fluoxetine. Cognition was lower at the end of treatment in the SSRI group. As we included only high‐quality studies in our main analyses, we did not downgrade for quality of trials; the main reason for downgrading quality was because of imprecision.
There are data on outcomes at end of follow‐up for two trials (Bembenek 2020; FOCUS 2019); follow‐up data will be available for two other studies in due course (AFFINITY 2020; EFFECTS 2020).
When we performed a meta‐analysis of disability for all studies irrespective of risk of bias, we found a small beneficial effect of SSRI but with high heterogeneity. There was no difference in the proportion of participants independent at follow‐up; for this outcome there was evidence of publication bias on our funnel plot.
Overall completeness and applicability of evidence
This review includes studies from different settings (e.g. countries; high‐, middle‐ and low‐income settings; healthcare systems), with different criteria for selecting participants (e.g. methods of pre‐randomisation diagnosis and investigation, inclusion and exclusion criteria), that may reflect differences between the trial protocol and routine clinical practice (e.g. inclusion of participants based on a diagnosis of stroke made using brain imaging: brain imaging is unlikely to be either available or affordable in routine clinical care in many low‐ and middle‐income country settings); and different characteristics of randomised participants (e.g. baseline demographic and clinical characteristics, stroke severity, time since stroke onset, presence or absence of depression, severity of depression). These study characteristics may in part explain the heterogeneity of results, but we know from our previous review that the most probable cause of heterogeneity is study quality.
There is a discordance between the results for disability (one of our co‐primary outcomes) between the studies at low risk of bias, which showed no effect, and all studies irrespective of bias (a positive effect). This is because trials at high risk of bias tended to be positive.
The results of the meta‐analysis of the seven studies at low risk of bias are applicable to clinical practice throughout the world, for both ischaemic and haemorrhagic stroke.
There is a theoretical risk that SSRIs might carry particular risks in people with haemorrhagic stroke, due to their effects on platelet aggregation and bleeding, but there was no evidence of this based on data from the individual studies; to explore this further we are planning an individual patient meta‐analysis (EFFECTS 2020; FOCUS 2019). We noted that those allocated control had better cognition at the end of treatment, although the effect size was very small, and of uncertain clinical relevance. According to the NHS in the UK, confusion is a rare side effect of SSRIs (NHS 2021 , but on the other hand, there is also systematic review evidence that fluoxetine might improve cognition in people with dementia (Xie 2019). Our finding might also have been due to chance. We plan to explore in more detail the impact of fluoxetine on cognition when we perform our individual patient data meta‐analysis from the three large studies.
There were no data on anxiety from the studies, even though anxiety is a common problem after stroke.
We were unable to explore the influence of the type of SSRI, as all the high‐quality trials used fluoxetine.
The full searches were last performed in January 2021; the lead review author (GM) searched WHO ICTRP in August 2021 and did not find any further new eligible studies. We are not aware of any other new studies published since January 2021 that are likely to change the results of the review.
We have data on follow‐up after treatment end for only two studies (Bembenek 2020; FOCUS 2019). Two large studies have unpublished data for outcome six months after treatment end (12 months after randomisation) (AFFINITY 2020; EFFECTS 2020); these data will be incorporated into an individual patient data meta‐analysis in due course (Mead 2020).
We did not include studies which combined an SSRI with another active treatment (either drugs or another type of intervention), and either compared with control or the active treatment alone. It is possible that SSRIS could modify (either enhance or reduce) training‐induced brain plasticity and hence functional recovery. Thus, the absence of an effect of SSRIs on disability might have been because the SSRI was not coupled with a domain‐specific behavioural rehabilitation intervention. In the future, a systematic review of SSRIs plus training would be of interest.
Quality of the evidence
For the evaluation of quality of the evidence, we contacted authors of primary studies as yet unpublished for data on outcomes. For studies which we thought would fall into the category of being at low risk of bias across all the domains, but where some of the methodology was not reported in sufficient detail to enable us to make a final judgement, we contacted authors to clarify methodology. We also contacted authors of primary studies when it appeared that the same (or similar) group of patients had been described in more than one publication, in order to avoid double counting participants, and for one study, we also contacted the editors of the respective journals.
We used the Cochrane risk of bias tool to assess study methods. As in the previous update (Legg 2019), we restricted our meta‐analyses to studies at low risk of bias, because in the first review, Mead 2011, there was evidence that the apparently beneficial effects of SSRI on recovery was due to methodological limitations of the included trials. This observation was confirmed by the sensitivity analyses that we performed for these two previous reviews.
The meta‐analysis of the high‐quality studies is dominated by three trials (AFFINITY 2020; EFFECTS 2020; FOCUS 2019). All three of these trials were neutral for their primary outcome (modified Rankin score (mRS) at six months).
We performed sensitivity analyses of our two co‐primary outcomes (disability and independence) by including all the available outcome data, irrespective of risk of bias. Like our initial (hypothesis‐generating) Cochrane Review (Mead 2011), we found that SSRIs reduced disability at the end of treatment. However, it is highly likely that this positive effect is due to biases in trial quality. Publication bias might also be a problem, as suggested by the funnel plot (Figure 4).
We also performed sensitivity analyses to explore whether a random‐effects model would make any difference to outcome, but it did not (Table 1).
Potential biases in the review process
We conducted the review using robust Cochrane methodology, with two review authors independently assessing studies for eligibility, extracting data, and carrying out risk of bias assessment. As five review authors (MD, GEM, EL, GH, MH) were also authors of the AFFINITY 2020, FOCUS 2019, and EFFECTS 2020 trials, we ensured that assessment of risk of bias and data extraction for these trials was not performed by these review authors; except for unpublished data on mean (SD) for the Stroke Impact Scale scores, fatigue and quality of life, which were provided by the trial statisticians and entered into forest plots by one review author (GEM).
Our searches identified one systematic review that included several trials from China that we had not identified in the previous review (Li 2020). These trials are now included. Thus, it is possible, though unlikely, that there are other trials that have been published since the Li 2020 review that our searches might not have identified.
After editorial review in July 2021, we decided to perform a final check of the WHO ICTRP (that had last been searched about a year previously) to check for any new ongoing studies. This search was done by one review author only (GEM) and so it is possible, though very unlikely, that new studies were missed.
Agreements and disagreements with other studies or reviews
This review has demonstrated that SSRIs do not improve recovery after stroke. This is in contrast with several other meta‐analyses which showed that SSRIs might improve recovery, but these meta‐analyses did not include two recently published large high‐quality trials which were both neutral (AFFINITY 2020; EFFECTS 2020). In this meta‐analysis, we were also able to explore the influence of SSRIs on other important outcomes, that previous reviews had not done, because there had previously been insufficient data.
PRISMA flow diagram for this update

Risk of bias summary: review authors' judgements about each risk of bias item for each included study.

'Risk of bias' graph: review authors' judgements about each 'risk of bias' item presented as percentages across all included studies.

Funnel plot, all studies irrespective or risk of bias, for disability at end of treatment.

Comparison 1: SSRI versus control at end of treatment, by SSRI, Outcome 1: Disability (primary outcome). Studies at low risk of bias

Comparison 1: SSRI versus control at end of treatment, by SSRI, Outcome 2: Independent on modified Rankin score (mRS 0 to 2) (primary outcome). Studies at low risk of bias

Comparison 1: SSRI versus control at end of treatment, by SSRI, Outcome 3: Neurological deficit score (studies at low risk of bias)

Comparison 1: SSRI versus control at end of treatment, by SSRI, Outcome 4: Motor deficits (studies at low risk of bias)

Comparison 1: SSRI versus control at end of treatment, by SSRI, Outcome 5: Depression, continuous data (studies at low risk of bias)

Comparison 1: SSRI versus control at end of treatment, by SSRI, Outcome 6: Depression, dichotomous data (studies at low risk of bias)

Comparison 1: SSRI versus control at end of treatment, by SSRI, Outcome 7: Death (trials at low risk of bias)

Comparison 1: SSRI versus control at end of treatment, by SSRI, Outcome 8: Seizures (studies at low risk of bias)

Comparison 1: SSRI versus control at end of treatment, by SSRI, Outcome 9: Gastrointestinal side effects (studies at low risk of bias)

Comparison 1: SSRI versus control at end of treatment, by SSRI, Outcome 10: Bleeding (studies at low risk of bias)

Comparison 1: SSRI versus control at end of treatment, by SSRI, Outcome 11: Fractures (studies at low risk of only)

Comparison 1: SSRI versus control at end of treatment, by SSRI, Outcome 12: Cognition (trials at low risk of bias)

Comparison 1: SSRI versus control at end of treatment, by SSRI, Outcome 13: Leaving the study before the end of scheduled follow‐up for reasons other than death (trials at low risk of bias)

Comparison 1: SSRI versus control at end of treatment, by SSRI, Outcome 14: Fatigue at end of treatment (studies at low risk of bias only)

Comparison 1: SSRI versus control at end of treatment, by SSRI, Outcome 15: Quality of life at end of treatment (studies at low risk of bias)

Comparison 1: SSRI versus control at end of treatment, by SSRI, Outcome 16: Disability (all studies regardless of risk of bias)

Comparison 1: SSRI versus control at end of treatment, by SSRI, Outcome 17: Independent on modified Rankin score (mRS 0 to 2) (all studies regardless of risk of bias)

Comparison 2: SSRI versus control at end of follow up, by SSRI, Outcome 1: Disability (studies at low risk of bias only)

Comparison 2: SSRI versus control at end of follow up, by SSRI, Outcome 2: Independent on modified rankin score (0‐2) (studies at low risk of bias only)

Comparison 2: SSRI versus control at end of follow up, by SSRI, Outcome 3: Depression, continuous data (studies at low risk of bias only)

Comparison 2: SSRI versus control at end of follow up, by SSRI, Outcome 4: Depression, dichotomous (studies at low risk of bias only)

Comparison 2: SSRI versus control at end of follow up, by SSRI, Outcome 5: Motor deficits (studies at low risk of bias only)

Comparison 2: SSRI versus control at end of follow up, by SSRI, Outcome 6: Cognition (studies at low risk of bias only)

Comparison 2: SSRI versus control at end of follow up, by SSRI, Outcome 7: Death (studies at low risk of bias only)

Comparison 2: SSRI versus control at end of follow up, by SSRI, Outcome 8: Leaving the trial before the end of follow‐up, for reasons other than death ( studies at low risk of bias)

Comparison 2: SSRI versus control at end of follow up, by SSRI, Outcome 9: Disability, all studies irrespective of risk of bias

Comparison 2: SSRI versus control at end of follow up, by SSRI, Outcome 10: Independent on mRS (0‐2) all studies irrespective of risk of bias
| Fluoxetine versus control at end of treatment, by SSRI, for stroke recovery* | ||||||
| Patient or population: people with stroke recovery *Summary of findings table based on studies with low risk of bias. | ||||||
| Outcomes | Illustrative comparative risks* (95% CI) | Relative effect | No of Participants | Quality of the evidence | Comments | |
|---|---|---|---|---|---|---|
| Assumed risk | Corresponding risk | |||||
| Control | Fluoxetine versus control at end of treatment | |||||
| Disability (primary analysis) |
| SMD 0.0 (‐0.05, 0.05) |
| 5436 | ⊕⊕⊕⊕ | ‐ |
| Independent on modified Rankin score (mRS 0 to 2) (primary analysis) | Study population | RR 0.98
| 5926 | ⊕⊕⊕⊕ | ‐ | |
| 1541/2971 (i.e. 52 per hundred) | 1498/2955 (i.e. 51 per hundred) | |||||
| Neurological deficit score |
| SMD ‐0.39 (95% CI (‐1.12 to 0.33) |
| 30 participants, one study | ⊕⊕⊝⊝ Lowa | This is a small effect (based on the 'rule‐of‐thumb' method for interpreting SMD) |
| Depression (continuous data) |
| SMD ‐0.14 (‐0.19 to ‐0.08) |
| 5356 | ⊕⊕⊕⊕ | This is a small effect (based on the 'rule‐of‐thumb' method for interpreting SMD) |
| Death | Study population | RR 1.01 | 6090 | ⊕⊕⊕⊝ | ‐ | |
| 168/3029 (i.e. 55 per thousand) | 170/3061 (i.e. 56 per thousand) | |||||
| Number of seizures | Study population | RR 1.40 | 6080 | ⊕⊕⊕⊝ Moderatec | ‐ | |
| 54/3024 (i.e. 18 per thousand) | 76/3056 (i.e. 25 per thousand) | |||||
| Bone fractures | Study population | RR 2.35 | 6080 | ⊕⊕⊕ ⊕ | ‐ | |
| 40/3024 (i.e. 13 per thousand) | 93/3056 (i.e. 30 per thousand) | |||||
| *The basis for the assumed risk (e.g. the mean control group risk across studies) is provided in footnotes. The corresponding risk (and its 95% confidence interval) is based on the assumed risk in the comparison group and the relative effect of the intervention (and its 95% CI). | ||||||
| GRADE Working Group grades of evidence | ||||||
| aNeurological deficit from only one trial of 30 people so we have downgraded for imprecision (GRADE 2013). bDeath downgraded for imprecision. cSeizures downgraded for imprecision. Note that because we included only the low risk of bias studies in our review, none of the evidence was downgraded because of study quality. A range of different outcome scales were used for disability (including Barthel Index and daily activities subscale of the Stroke Impact Scale), and depression (including emotional role function of the Stroke Impact Scale). | ||||||
| mRS (RR and 95% CI) | Disability (SMD and 95% CI) | |
|---|---|---|
| Fixed‐effect | 0.98 (0.93, 1.03) | ‐0.0 (‐0.05, 0.05) |
| Random‐effects | 0.98 (0.92, 1.04) | ‐0.00 (‐0.05, 0.05) |
| CI: confidence interval | ||
| Outcome or subgroup title | No. of studies | No. of participants | Statistical method | Effect size |
| 1.1 Disability (primary outcome). Studies at low risk of bias Show forest plot | 5 | 5436 | Std. Mean Difference (IV, Fixed, 95% CI) | ‐0.00 [‐0.05, 0.05] |
| 1.1.1 Fluoxetine | 5 | 5436 | Std. Mean Difference (IV, Fixed, 95% CI) | ‐0.00 [‐0.05, 0.05] |
| 1.2 Independent on modified Rankin score (mRS 0 to 2) (primary outcome). Studies at low risk of bias Show forest plot | 5 | 5926 | Risk Ratio (M‐H, Fixed, 95% CI) | 0.98 [0.93, 1.03] |
| 1.3 Neurological deficit score (studies at low risk of bias) Show forest plot | 1 | 30 | Std. Mean Difference (IV, Fixed, 95% CI) | ‐0.39 [‐1.12, 0.33] |
| 1.3.1 Fluoxetine | 1 | 30 | Std. Mean Difference (IV, Fixed, 95% CI) | ‐0.39 [‐1.12, 0.33] |
| 1.4 Motor deficits (studies at low risk of bias) Show forest plot | 6 | 5518 | Std. Mean Difference (IV, Fixed, 95% CI) | 0.03 [‐0.02, 0.08] |
| 1.4.1 Fluoxetine | 6 | 5518 | Std. Mean Difference (IV, Fixed, 95% CI) | 0.03 [‐0.02, 0.08] |
| 1.5 Depression, continuous data (studies at low risk of bias) Show forest plot | 4 | 5356 | Std. Mean Difference (IV, Fixed, 95% CI) | ‐0.14 [‐0.19, ‐0.08] |
| 1.5.1 Fluoxetine | 4 | 5356 | Std. Mean Difference (IV, Fixed, 95% CI) | ‐0.14 [‐0.19, ‐0.08] |
| 1.6 Depression, dichotomous data (studies at low risk of bias) Show forest plot | 3 | 5907 | Risk Ratio (M‐H, Fixed, 95% CI) | 0.75 [0.65, 0.86] |
| 1.6.1 Fluoxetine | 3 | 5907 | Risk Ratio (M‐H, Fixed, 95% CI) | 0.75 [0.65, 0.86] |
| 1.7 Death (trials at low risk of bias) Show forest plot | 6 | 6090 | Risk Ratio (M‐H, Fixed, 95% CI) | 1.01 [0.82, 1.24] |
| 1.7.1 Fluoxetine | 6 | 6090 | Risk Ratio (M‐H, Fixed, 95% CI) | 1.01 [0.82, 1.24] |
| 1.8 Seizures (studies at low risk of bias) Show forest plot | 6 | 6080 | Risk Ratio (M‐H, Fixed, 95% CI) | 1.40 [1.00, 1.98] |
| 1.8.1 Fluoxetine | 6 | 6080 | Risk Ratio (M‐H, Fixed, 95% CI) | 1.40 [1.00, 1.98] |
| 1.9 Gastrointestinal side effects (studies at low risk of bias) Show forest plot | 1 | 30 | Risk Ratio (M‐H, Fixed, 95% CI) | 1.71 [0.33, 8.83] |
| 1.9.1 Fluoxetine | 1 | 30 | Risk Ratio (M‐H, Fixed, 95% CI) | 1.71 [0.33, 8.83] |
| 1.10 Bleeding (studies at low risk of bias) Show forest plot | 6 | 6088 | Risk Ratio (M‐H, Fixed, 95% CI) | 1.08 [0.69, 1.70] |
| 1.10.1 Fluoxetine (except for Asadollahi 2018) | 6 | 6088 | Risk Ratio (M‐H, Fixed, 95% CI) | 1.08 [0.69, 1.70] |
| 1.11 Fractures (studies at low risk of only) Show forest plot | 6 | 6080 | Odds Ratio (M‐H, Fixed, 95% CI) | 2.35 [1.62, 3.41] |
| 1.12 Cognition (trials at low risk of bias) Show forest plot | 4 | 5373 | Mean Difference (IV, Fixed, 95% CI) | ‐1.22 [‐2.37, ‐0.07] |
| 1.13 Leaving the study before the end of scheduled follow‐up for reasons other than death (trials at low risk of bias) Show forest plot | 6 | 6090 | Risk Ratio (M‐H, Fixed, 95% CI) | 1.57 [1.03, 2.40] |
| 1.13.1 Fluoxetine | 6 | 6090 | Risk Ratio (M‐H, Fixed, 95% CI) | 1.57 [1.03, 2.40] |
| 1.14 Fatigue at end of treatment (studies at low risk of bias only) Show forest plot | 4 | 5524 | Mean Difference (IV, Fixed, 95% CI) | ‐0.06 [‐1.24, 1.11] |
| 1.15 Quality of life at end of treatment (studies at low risk of bias) Show forest plot | 3 | 5482 | Mean Difference (IV, Fixed, 95% CI) | 0.00 [‐0.02, 0.02] |
| 1.16 Disability (all studies regardless of risk of bias) Show forest plot | 32 | 7667 | Std. Mean Difference (IV, Fixed, 95% CI) | ‐0.18 [‐0.23, ‐0.14] |
| 1.16.1 Fluoxetine | 19 | 6590 | Std. Mean Difference (IV, Fixed, 95% CI) | ‐0.09 [‐0.13, ‐0.04] |
| 1.16.2 Sertraline | 1 | 130 | Std. Mean Difference (IV, Fixed, 95% CI) | ‐1.38 [‐1.76, ‐0.99] |
| 1.16.3 Paroxetine | 5 | 293 | Std. Mean Difference (IV, Fixed, 95% CI) | ‐1.29 [‐1.55, ‐1.03] |
| 1.16.4 Citalopram | 5 | 446 | Std. Mean Difference (IV, Fixed, 95% CI) | ‐0.68 [‐0.88, ‐0.48] |
| 1.16.5 Escitalopram | 2 | 208 | Std. Mean Difference (IV, Fixed, 95% CI) | ‐0.67 [‐1.00, ‐0.34] |
| 1.17 Independent on modified Rankin score (mRS 0 to 2) (all studies regardless of risk of bias) Show forest plot | 8 | 6792 | Risk Ratio (M‐H, Fixed, 95% CI) | 0.97 [0.93, 1.01] |
| 1.17.1 Fluoxetine | 6 | 6039 | Risk Ratio (M‐H, Fixed, 95% CI) | 0.98 [0.94, 1.03] |
| 1.17.2 Sertraline | 1 | 111 | Risk Ratio (M‐H, Fixed, 95% CI) | 1.00 [0.97, 1.04] |
| 1.17.3 Citalopram | 1 | 642 | Risk Ratio (M‐H, Fixed, 95% CI) | 0.90 [0.82, 0.98] |
| Outcome or subgroup title | No. of studies | No. of participants | Statistical method | Effect size |
| 2.1 Disability (studies at low risk of bias only) Show forest plot | 2 | 2591 | Mean Difference (IV, Fixed, 95% CI) | ‐0.24 [‐2.59, 2.11] |
| 2.2 Independent on modified rankin score (0‐2) (studies at low risk of bias only) Show forest plot | 2 | 3137 | Odds Ratio (M‐H, Fixed, 95% CI) | 1.03 [0.89, 1.19] |
| 2.3 Depression, continuous data (studies at low risk of bias only) Show forest plot | 2 | 2684 | Mean Difference (IV, Fixed, 95% CI) | 0.04 [‐0.36, 0.44] |
| 2.4 Depression, dichotomous (studies at low risk of bias only) Show forest plot | 1 | 3083 | Odds Ratio (M‐H, Fixed, 95% CI) | 0.87 [0.73, 1.04] |
| 2.5 Motor deficits (studies at low risk of bias only) Show forest plot | 2 | 2688 | Mean Difference (IV, Fixed, 95% CI) | ‐0.77 [‐3.00, 1.46] |
| 2.6 Cognition (studies at low risk of bias only) Show forest plot | 2 | 2689 | Mean Difference (IV, Fixed, 95% CI) | ‐0.35 [‐2.32, 1.62] |
| 2.7 Death (studies at low risk of bias only) Show forest plot | 2 | 3144 | Risk Ratio (M‐H, Fixed, 95% CI) | 0.93 [0.77, 1.12] |
| 2.8 Leaving the trial before the end of follow‐up, for reasons other than death ( studies at low risk of bias) Show forest plot | 2 | 3188 | Odds Ratio (M‐H, Fixed, 95% CI) | 0.90 [0.54, 1.51] |
| 2.9 Disability, all studies irrespective of risk of bias Show forest plot | 2 | 2691 | Mean Difference (IV, Fixed, 95% CI) | ‐0.25 [‐2.56, 2.06] |
| 2.10 Independent on mRS (0‐2) all studies irrespective of risk of bias Show forest plot | 2 | 3134 | Odds Ratio (M‐H, Fixed, 95% CI) | 1.03 [0.89, 1.19] |