Inhibidores selectivos de la recaptación de serotonina (ISRS) para la recuperación del accidente cerebrovascular
Información
- DOI:
- https://doi.org/10.1002/14651858.CD009286.pub4Copiar DOI

- Base de datos:
-
- Cochrane Database of Systematic Reviews
- Versión publicada:
-
- 15 noviembre 2021see what's new
- Tipo:
-
- Intervention
- Etapa:
-
- Review
- Grupo Editorial Cochrane:
-
Grupo Cochrane de Accidentes cerebrovasculares
- Copyright:
-
- Copyright © 2021 The Cochrane Collaboration. Published by John Wiley & Sons, Ltd.
Cifras del artículo
Altmetric:
Citado por:
Autores
Contributions of authors
Gillian Mead conceived the study, screened references, extracted data, assessed risk of bias, performed the analyses and wrote the first draft of this update.
Lynn Legg searched for studies selected studies for inclusion, collected data, assessed risk of bias, managed studies through the review process, contributed to the final version.
Russel Tilney screened citations, retrieved potentially relevant papers and screened their eligibility, assisted with data extraction, performed risk of bias assessments.
Cheng Fang Hsieh screened citations, retrieved potentially relevant papers and screened their eligibility, assisted with data extraction, performed risk of bias assessments and approved the final version.
Simiao Wu screened citations, retrieved potentially relevant papers and screened their eligibility, assisted with data extraction, performed risk of bias assessments and approved the final version.
Erik Lundström screened citations, retrieved potentially relevant papers and screened their eligibility, assisted with data extraction performed risk of bias assessments and approved the final version.
Xing Hua screened citations, retrieved potentially relevant papers, assisted with data extraction, performed risk of bias assessments and approved the final version.
Linnea Lindgren screened citations, retrieved potentially relevant papers, assisted with data extraction, performed risk of bias assessments and approved the final version
Ann‐Sofie Rudberg screened citations, retrieved potentially relevant papers and screened their eligibility, assisted with data extraction, performed risk of bias assessments and approved the final version.
Mansur Kutlubaev screened citations, retrieved potentially relevant papers and screened their eligibility, assisted with data extraction, performed risk of bias assessments and approved the final version.
Amanda Barugh screened citations, retrieved potentially relevant papers and screened their eligibility, assisted with data extraction, drafted the manuscript for submission, performed risk of bias assessments and approved the final version.
Maree Hackett screened citations, retrieved potentially relevant papers and screened their eligibility, assisted with data extraction, performed risk of bias assessments and approved the final version.
Graeme Hankey conceived the review, provided expertise in relation to analysis methods, and approved the final version of the review.
Martin Dennis provided topic expertise, advised on methods of analysis and approved the final version.
Sources of support
Internal sources
-
National Health and Medical Research Council of Australia, Australia
Maree Hackett: Career Development Fellowship, Population Health (Level 2), APP1141328 (1/1/18‐31/12/21)
External sources
-
Chief Scientist Office, Scotland, UK
The Chief Scientist Office, Scotland, provides infrastructure support for Cochrane Stroke
-
Incentive grant from National Institute of Health Research, UK
£5000 incentive grant to support an honorarium to Lynn Legg
-
NIHR Incentive grant, UK
£7000 to backfill some of Gillian Mead's academic time to enable her to work on this review.
Declarations of interest
Lynn A Legg: none known.
Ann‐Sofie Rudberg: none known.
Xing Hua: none known.
Simiao Wu: none known.
Maree L Hackett: Grants and contracts: Project grant (NHMRC funding for AFFINITY trial), HTA Program (National Institute for Health Research funding for FOCUS), Framework grant (Swedish Research Council funding for EFFECTS); all funding received by the author's institution. Payment for a fellowship: National Health and Medical Research Council (NHMRC), received by the author's institution.
Russel Tilney: none known.
Linnea Lindgren: none known.
Mansur A Kutlubaev: none known.
Cheng‐Fang Hsieh: none known.
Amanda Barugh: none known.
Graeme J Hankey: Grants and contracts: Chief Investigator for the AFFINITY trial, National Health and Medical Research Council of Australia, received by the author's institution. Payment or honoraria for lectures, presentations, speakers bureaus, manuscript writing, or educational events: Discussion about antithrombotic therapy to prevent stroke, Medscape, received by the author. Consulting fees: Consulting on design of a possible phase III trial of a new anticoagulant in atrial fibrillation, Janssen Research and Development, received by the author. Payment for participation on a Data Safety Monitoring Board, Advisory Board, or Guideline Panel: Chair or Member of Data Safety Monitoring Committees, of ACI trials of an immune therapies for Alzheimer's disease, AC Immune, Lausanne, Switzerland, received by the author; Member of Stroke Prevention Initiative, Bayer, received by the author; Other: Associate Editor of Circulation, American Heart Association, received by the author. Published opinions in medical journals, the public press, broadcast and social media relevant to the interventions in the work: Publication, Lancet Neurology, AFFINITY Trial Collaboration. Safety and efficacy of fluoxetine on functional outcome after acute stroke (AFFINITY): a randomised, double‐blind, placebo‐controlled trial. Lancet Neurology 2020; 19(8): 651‐660. doi: 10.1016/S1474‐4422(20)30207‐6. PMID: 32702334; Publication, Stroke. Declaring involvement in eligible studies: Yes, National Health and Medical Research Council of Australia (for AFFINITY trial).
Erik Lundström: Grants and contracts: Funding, STROKE‐Riksförbundet, received by author's institution. Leadership or other fiduciary role in other board, society, committee, or advocacy group: Chief Investigator of the EFFECTS trial, received by author. Declaring involvement in eligible studies: The Swedish Research Council, The Swedish Heart‐Lung Fund, The Swedish Brain Fund, STROKE‐Riksförbundet, The Swedish Medical Society, Konung Gustaf V:s och Drottning Victorias Frimurarstiftelse.
Martin Dennis: Grants and contracts: Grants received to carry out FOCUS trial ‐ and RCT which is included in the review, NIHR, Stroke Association, received by the author's institution
Gillian E Mead: Grants and contracts: Research grants, HTA NIHR, co‐applicant on grants led by Prof Graeme Hankey and Maree Hackett, and Erik Lundstrom; NIHR incentive award for updating this review, both received by the author's institution.
Gillian Mead, Martin Dennis, Maree Hackett, Erik Lundstrom and Graeme Hankey are investigators on the FOCUS trial (Fluoxetine or control under supervision) in the UK, the AFFINITY (Assessment of fluoxetine in stroke recovery) trial in Australia, and the EFFECTs trial in Sweden designed to assess the impact of fluoxetine on disability and dependency after stroke. None of these review authors extracted data from these three trials.
Acknowledgements
For this update, we are grateful to the following people.
Joshua Cheyne, Cochrane Stroke Information Specialist, ran the literature searches.
Maureen Harding obtained articles for full‐text review.
Dr Jan Bembenek and Professor Anna Czlonkowska provided further unpublished information about FOCUS‐Poland, and additional data on SIS.
Dr Qilong Yi provided additional data for means (SD) of SIS, SF‐36 vitality and quality of life from AFFINITY.
Professor Osvaldo Almeida provided additional information about Almeida 2006
Dr Per Näsman provided data for means (SD) of SIS, SF‐36 vitality and quality of life from AFFINITY.
Dr Ehsan Karimi provided further information about Asadollahi 2018.
Bernhard Sabel (Editor in Chief of Restorative Neurology and Neuroscience) and Dr. João Pereira Leite, Editor of Brazilian Journal of Medical and Biological Research, wrote to the authors of the two publications relating to Cao 2020; these papers were very similar. No response was received; the two editors kindly checked the text of the two papers and decided that it was likely that the two papers described overlapping groups of patients.
We are also grateful to the peer reviewers and editors in Cochrane Stroke for their comments.
This updated review was funded by the National Institute for Health Research (NIHR) [NIHR Cochrane Review Incentive Scheme 2020 (NIHR133254)]. The views expressed are those of the authors and not necessarily those of the NIHR or the Department of Health and Social Care.
Version history
| Published | Title | Stage | Authors | Version |
| 2021 Nov 15 | Selective serotonin reuptake inhibitors (SSRIs) for stroke recovery | Review | Lynn A Legg, Ann-Sofie Rudberg, Xing Hua, Simiao Wu, Maree L Hackett, Russel Tilney, Linnea Lindgren, Mansur A Kutlubaev, Cheng-Fang Hsieh, Amanda J Barugh, Graeme J Hankey, Erik Lundström, Martin Dennis, Gillian E Mead | |
| 2019 Nov 26 | Selective serotonin reuptake inhibitors (SSRIs) for stroke recovery | Review | Lynn A Legg, Russel Tilney, Cheng‐Fang Hsieh, Simiao Wu, Erik Lundström, Ann‐Sofie Rudberg, Mansur A Kutlubaev, Martin Dennis, Babak Soleimani, Amanda Barugh, Maree L Hackett, Graeme J Hankey, Gillian E Mead | |
| 2012 Nov 14 | Selective serotonin reuptake inhibitors (SSRIs) for stroke recovery | Review | Gillian E Mead, Cheng‐Fang Hsieh, Rebecca Lee, Mansur A Kutlubaev, Anne Claxton, Graeme J Hankey, Maree L Hackett | |
| 2011 Nov 09 | Selective serotonin reuptake inhibitors (SSRIs) for stroke | Protocol | Gillian E Mead, Graeme J Hankey, Mansur A Kutlubaev, Rebecca Lee, Matthew Bailey, Maree L Hackett | |
Differences between protocol and review
Changes to 'Criteria for considering studies for this review'
We did not change the criteria since the last update.
Changes to 'Data collection and analysis'
We included cognition as a secondary outcome.
Changes to Results
We added in new eligible studies, and updated all analyses.
Keywords
MeSH
Medical Subject Headings (MeSH) Keywords
Medical Subject Headings Check Words
Humans;
PICO
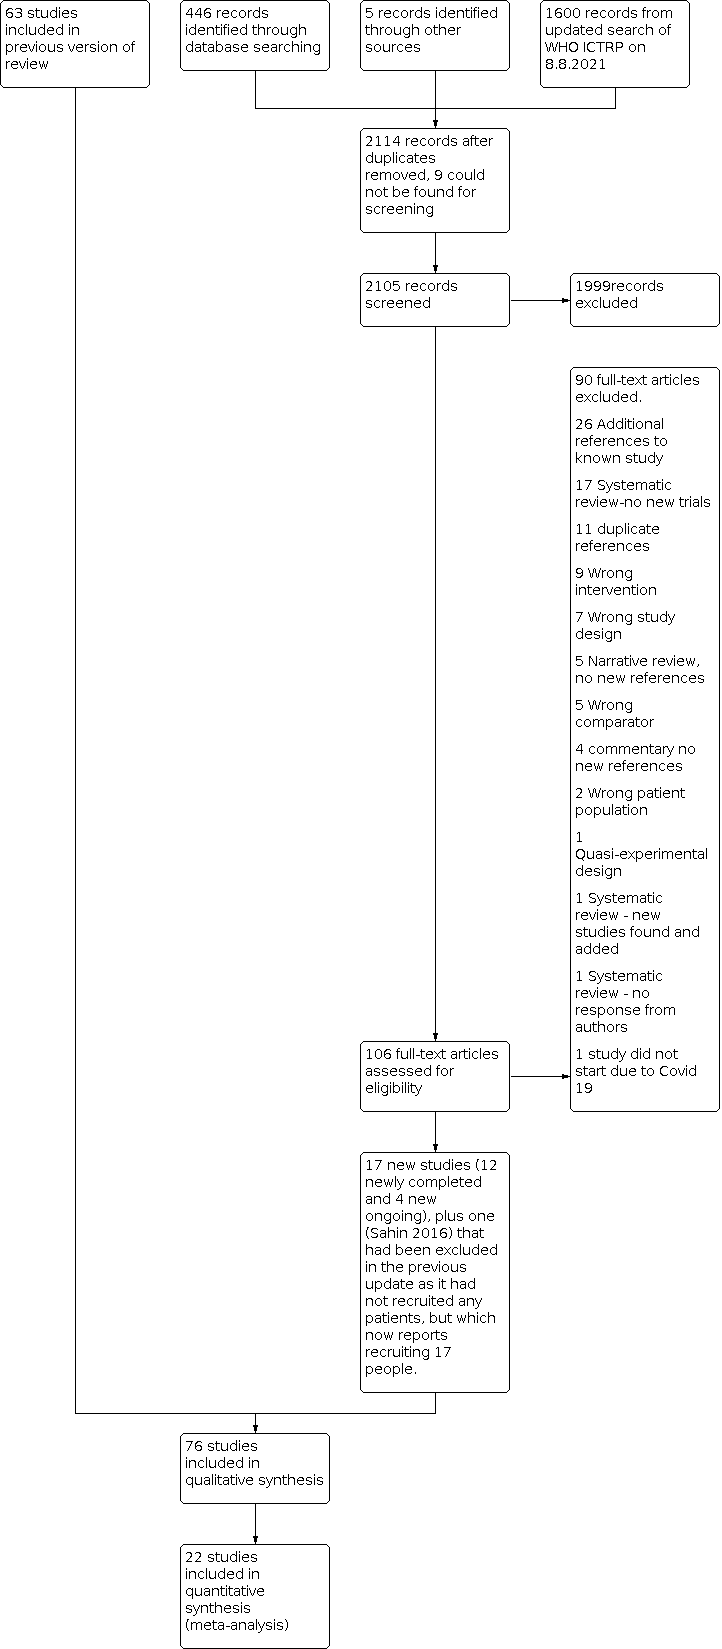
PRISMA flow diagram for this update

Risk of bias summary: review authors' judgements about each risk of bias item for each included study.

'Risk of bias' graph: review authors' judgements about each 'risk of bias' item presented as percentages across all included studies.

Funnel plot, all studies irrespective or risk of bias, for disability at end of treatment.

Comparison 1: SSRI versus control at end of treatment, by SSRI, Outcome 1: Disability (primary outcome). Studies at low risk of bias

Comparison 1: SSRI versus control at end of treatment, by SSRI, Outcome 2: Independent on modified Rankin score (mRS 0 to 2) (primary outcome). Studies at low risk of bias

Comparison 1: SSRI versus control at end of treatment, by SSRI, Outcome 3: Neurological deficit score (studies at low risk of bias)

Comparison 1: SSRI versus control at end of treatment, by SSRI, Outcome 4: Motor deficits (studies at low risk of bias)

Comparison 1: SSRI versus control at end of treatment, by SSRI, Outcome 5: Depression, continuous data (studies at low risk of bias)

Comparison 1: SSRI versus control at end of treatment, by SSRI, Outcome 6: Depression, dichotomous data (studies at low risk of bias)

Comparison 1: SSRI versus control at end of treatment, by SSRI, Outcome 7: Death (trials at low risk of bias)

Comparison 1: SSRI versus control at end of treatment, by SSRI, Outcome 8: Seizures (studies at low risk of bias)

Comparison 1: SSRI versus control at end of treatment, by SSRI, Outcome 9: Gastrointestinal side effects (studies at low risk of bias)

Comparison 1: SSRI versus control at end of treatment, by SSRI, Outcome 10: Bleeding (studies at low risk of bias)

Comparison 1: SSRI versus control at end of treatment, by SSRI, Outcome 11: Fractures (studies at low risk of only)

Comparison 1: SSRI versus control at end of treatment, by SSRI, Outcome 12: Cognition (trials at low risk of bias)

Comparison 1: SSRI versus control at end of treatment, by SSRI, Outcome 13: Leaving the study before the end of scheduled follow‐up for reasons other than death (trials at low risk of bias)

Comparison 1: SSRI versus control at end of treatment, by SSRI, Outcome 14: Fatigue at end of treatment (studies at low risk of bias only)

Comparison 1: SSRI versus control at end of treatment, by SSRI, Outcome 15: Quality of life at end of treatment (studies at low risk of bias)

Comparison 1: SSRI versus control at end of treatment, by SSRI, Outcome 16: Disability (all studies regardless of risk of bias)

Comparison 1: SSRI versus control at end of treatment, by SSRI, Outcome 17: Independent on modified Rankin score (mRS 0 to 2) (all studies regardless of risk of bias)

Comparison 2: SSRI versus control at end of follow up, by SSRI, Outcome 1: Disability (studies at low risk of bias only)

Comparison 2: SSRI versus control at end of follow up, by SSRI, Outcome 2: Independent on modified rankin score (0‐2) (studies at low risk of bias only)

Comparison 2: SSRI versus control at end of follow up, by SSRI, Outcome 3: Depression, continuous data (studies at low risk of bias only)

Comparison 2: SSRI versus control at end of follow up, by SSRI, Outcome 4: Depression, dichotomous (studies at low risk of bias only)

Comparison 2: SSRI versus control at end of follow up, by SSRI, Outcome 5: Motor deficits (studies at low risk of bias only)

Comparison 2: SSRI versus control at end of follow up, by SSRI, Outcome 6: Cognition (studies at low risk of bias only)

Comparison 2: SSRI versus control at end of follow up, by SSRI, Outcome 7: Death (studies at low risk of bias only)

Comparison 2: SSRI versus control at end of follow up, by SSRI, Outcome 8: Leaving the trial before the end of follow‐up, for reasons other than death ( studies at low risk of bias)

Comparison 2: SSRI versus control at end of follow up, by SSRI, Outcome 9: Disability, all studies irrespective of risk of bias

Comparison 2: SSRI versus control at end of follow up, by SSRI, Outcome 10: Independent on mRS (0‐2) all studies irrespective of risk of bias
| Fluoxetine versus control at end of treatment, by SSRI, for stroke recovery* | ||||||
| Patient or population: people with stroke recovery *Summary of findings table based on studies with low risk of bias. | ||||||
| Outcomes | Illustrative comparative risks* (95% CI) | Relative effect | No of Participants | Quality of the evidence | Comments | |
|---|---|---|---|---|---|---|
| Assumed risk | Corresponding risk | |||||
| Control | Fluoxetine versus control at end of treatment | |||||
| Disability (primary analysis) |
| SMD 0.0 (‐0.05, 0.05) |
| 5436 | ⊕⊕⊕⊕ | ‐ |
| Independent on modified Rankin score (mRS 0 to 2) (primary analysis) | Study population | RR 0.98
| 5926 | ⊕⊕⊕⊕ | ‐ | |
| 1541/2971 (i.e. 52 per hundred) | 1498/2955 (i.e. 51 per hundred) | |||||
| Neurological deficit score |
| SMD ‐0.39 (95% CI (‐1.12 to 0.33) |
| 30 participants, one study | ⊕⊕⊝⊝ Lowa | This is a small effect (based on the 'rule‐of‐thumb' method for interpreting SMD) |
| Depression (continuous data) |
| SMD ‐0.14 (‐0.19 to ‐0.08) |
| 5356 | ⊕⊕⊕⊕ | This is a small effect (based on the 'rule‐of‐thumb' method for interpreting SMD) |
| Death | Study population | RR 1.01 | 6090 | ⊕⊕⊕⊝ | ‐ | |
| 168/3029 (i.e. 55 per thousand) | 170/3061 (i.e. 56 per thousand) | |||||
| Number of seizures | Study population | RR 1.40 | 6080 | ⊕⊕⊕⊝ Moderatec | ‐ | |
| 54/3024 (i.e. 18 per thousand) | 76/3056 (i.e. 25 per thousand) | |||||
| Bone fractures | Study population | RR 2.35 | 6080 | ⊕⊕⊕ ⊕ | ‐ | |
| 40/3024 (i.e. 13 per thousand) | 93/3056 (i.e. 30 per thousand) | |||||
| *The basis for the assumed risk (e.g. the mean control group risk across studies) is provided in footnotes. The corresponding risk (and its 95% confidence interval) is based on the assumed risk in the comparison group and the relative effect of the intervention (and its 95% CI). | ||||||
| GRADE Working Group grades of evidence | ||||||
| aNeurological deficit from only one trial of 30 people so we have downgraded for imprecision (GRADE 2013). bDeath downgraded for imprecision. cSeizures downgraded for imprecision. Note that because we included only the low risk of bias studies in our review, none of the evidence was downgraded because of study quality. A range of different outcome scales were used for disability (including Barthel Index and daily activities subscale of the Stroke Impact Scale), and depression (including emotional role function of the Stroke Impact Scale). | ||||||
| mRS (RR and 95% CI) | Disability (SMD and 95% CI) | |
|---|---|---|
| Fixed‐effect | 0.98 (0.93, 1.03) | ‐0.0 (‐0.05, 0.05) |
| Random‐effects | 0.98 (0.92, 1.04) | ‐0.00 (‐0.05, 0.05) |
| CI: confidence interval | ||
| Outcome or subgroup title | No. of studies | No. of participants | Statistical method | Effect size |
| 1.1 Disability (primary outcome). Studies at low risk of bias Show forest plot | 5 | 5436 | Std. Mean Difference (IV, Fixed, 95% CI) | ‐0.00 [‐0.05, 0.05] |
| 1.1.1 Fluoxetine | 5 | 5436 | Std. Mean Difference (IV, Fixed, 95% CI) | ‐0.00 [‐0.05, 0.05] |
| 1.2 Independent on modified Rankin score (mRS 0 to 2) (primary outcome). Studies at low risk of bias Show forest plot | 5 | 5926 | Risk Ratio (M‐H, Fixed, 95% CI) | 0.98 [0.93, 1.03] |
| 1.3 Neurological deficit score (studies at low risk of bias) Show forest plot | 1 | 30 | Std. Mean Difference (IV, Fixed, 95% CI) | ‐0.39 [‐1.12, 0.33] |
| 1.3.1 Fluoxetine | 1 | 30 | Std. Mean Difference (IV, Fixed, 95% CI) | ‐0.39 [‐1.12, 0.33] |
| 1.4 Motor deficits (studies at low risk of bias) Show forest plot | 6 | 5518 | Std. Mean Difference (IV, Fixed, 95% CI) | 0.03 [‐0.02, 0.08] |
| 1.4.1 Fluoxetine | 6 | 5518 | Std. Mean Difference (IV, Fixed, 95% CI) | 0.03 [‐0.02, 0.08] |
| 1.5 Depression, continuous data (studies at low risk of bias) Show forest plot | 4 | 5356 | Std. Mean Difference (IV, Fixed, 95% CI) | ‐0.14 [‐0.19, ‐0.08] |
| 1.5.1 Fluoxetine | 4 | 5356 | Std. Mean Difference (IV, Fixed, 95% CI) | ‐0.14 [‐0.19, ‐0.08] |
| 1.6 Depression, dichotomous data (studies at low risk of bias) Show forest plot | 3 | 5907 | Risk Ratio (M‐H, Fixed, 95% CI) | 0.75 [0.65, 0.86] |
| 1.6.1 Fluoxetine | 3 | 5907 | Risk Ratio (M‐H, Fixed, 95% CI) | 0.75 [0.65, 0.86] |
| 1.7 Death (trials at low risk of bias) Show forest plot | 6 | 6090 | Risk Ratio (M‐H, Fixed, 95% CI) | 1.01 [0.82, 1.24] |
| 1.7.1 Fluoxetine | 6 | 6090 | Risk Ratio (M‐H, Fixed, 95% CI) | 1.01 [0.82, 1.24] |
| 1.8 Seizures (studies at low risk of bias) Show forest plot | 6 | 6080 | Risk Ratio (M‐H, Fixed, 95% CI) | 1.40 [1.00, 1.98] |
| 1.8.1 Fluoxetine | 6 | 6080 | Risk Ratio (M‐H, Fixed, 95% CI) | 1.40 [1.00, 1.98] |
| 1.9 Gastrointestinal side effects (studies at low risk of bias) Show forest plot | 1 | 30 | Risk Ratio (M‐H, Fixed, 95% CI) | 1.71 [0.33, 8.83] |
| 1.9.1 Fluoxetine | 1 | 30 | Risk Ratio (M‐H, Fixed, 95% CI) | 1.71 [0.33, 8.83] |
| 1.10 Bleeding (studies at low risk of bias) Show forest plot | 6 | 6088 | Risk Ratio (M‐H, Fixed, 95% CI) | 1.08 [0.69, 1.70] |
| 1.10.1 Fluoxetine (except for Asadollahi 2018) | 6 | 6088 | Risk Ratio (M‐H, Fixed, 95% CI) | 1.08 [0.69, 1.70] |
| 1.11 Fractures (studies at low risk of only) Show forest plot | 6 | 6080 | Odds Ratio (M‐H, Fixed, 95% CI) | 2.35 [1.62, 3.41] |
| 1.12 Cognition (trials at low risk of bias) Show forest plot | 4 | 5373 | Mean Difference (IV, Fixed, 95% CI) | ‐1.22 [‐2.37, ‐0.07] |
| 1.13 Leaving the study before the end of scheduled follow‐up for reasons other than death (trials at low risk of bias) Show forest plot | 6 | 6090 | Risk Ratio (M‐H, Fixed, 95% CI) | 1.57 [1.03, 2.40] |
| 1.13.1 Fluoxetine | 6 | 6090 | Risk Ratio (M‐H, Fixed, 95% CI) | 1.57 [1.03, 2.40] |
| 1.14 Fatigue at end of treatment (studies at low risk of bias only) Show forest plot | 4 | 5524 | Mean Difference (IV, Fixed, 95% CI) | ‐0.06 [‐1.24, 1.11] |
| 1.15 Quality of life at end of treatment (studies at low risk of bias) Show forest plot | 3 | 5482 | Mean Difference (IV, Fixed, 95% CI) | 0.00 [‐0.02, 0.02] |
| 1.16 Disability (all studies regardless of risk of bias) Show forest plot | 32 | 7667 | Std. Mean Difference (IV, Fixed, 95% CI) | ‐0.18 [‐0.23, ‐0.14] |
| 1.16.1 Fluoxetine | 19 | 6590 | Std. Mean Difference (IV, Fixed, 95% CI) | ‐0.09 [‐0.13, ‐0.04] |
| 1.16.2 Sertraline | 1 | 130 | Std. Mean Difference (IV, Fixed, 95% CI) | ‐1.38 [‐1.76, ‐0.99] |
| 1.16.3 Paroxetine | 5 | 293 | Std. Mean Difference (IV, Fixed, 95% CI) | ‐1.29 [‐1.55, ‐1.03] |
| 1.16.4 Citalopram | 5 | 446 | Std. Mean Difference (IV, Fixed, 95% CI) | ‐0.68 [‐0.88, ‐0.48] |
| 1.16.5 Escitalopram | 2 | 208 | Std. Mean Difference (IV, Fixed, 95% CI) | ‐0.67 [‐1.00, ‐0.34] |
| 1.17 Independent on modified Rankin score (mRS 0 to 2) (all studies regardless of risk of bias) Show forest plot | 8 | 6792 | Risk Ratio (M‐H, Fixed, 95% CI) | 0.97 [0.93, 1.01] |
| 1.17.1 Fluoxetine | 6 | 6039 | Risk Ratio (M‐H, Fixed, 95% CI) | 0.98 [0.94, 1.03] |
| 1.17.2 Sertraline | 1 | 111 | Risk Ratio (M‐H, Fixed, 95% CI) | 1.00 [0.97, 1.04] |
| 1.17.3 Citalopram | 1 | 642 | Risk Ratio (M‐H, Fixed, 95% CI) | 0.90 [0.82, 0.98] |
| Outcome or subgroup title | No. of studies | No. of participants | Statistical method | Effect size |
| 2.1 Disability (studies at low risk of bias only) Show forest plot | 2 | 2591 | Mean Difference (IV, Fixed, 95% CI) | ‐0.24 [‐2.59, 2.11] |
| 2.2 Independent on modified rankin score (0‐2) (studies at low risk of bias only) Show forest plot | 2 | 3137 | Odds Ratio (M‐H, Fixed, 95% CI) | 1.03 [0.89, 1.19] |
| 2.3 Depression, continuous data (studies at low risk of bias only) Show forest plot | 2 | 2684 | Mean Difference (IV, Fixed, 95% CI) | 0.04 [‐0.36, 0.44] |
| 2.4 Depression, dichotomous (studies at low risk of bias only) Show forest plot | 1 | 3083 | Odds Ratio (M‐H, Fixed, 95% CI) | 0.87 [0.73, 1.04] |
| 2.5 Motor deficits (studies at low risk of bias only) Show forest plot | 2 | 2688 | Mean Difference (IV, Fixed, 95% CI) | ‐0.77 [‐3.00, 1.46] |
| 2.6 Cognition (studies at low risk of bias only) Show forest plot | 2 | 2689 | Mean Difference (IV, Fixed, 95% CI) | ‐0.35 [‐2.32, 1.62] |
| 2.7 Death (studies at low risk of bias only) Show forest plot | 2 | 3144 | Risk Ratio (M‐H, Fixed, 95% CI) | 0.93 [0.77, 1.12] |
| 2.8 Leaving the trial before the end of follow‐up, for reasons other than death ( studies at low risk of bias) Show forest plot | 2 | 3188 | Odds Ratio (M‐H, Fixed, 95% CI) | 0.90 [0.54, 1.51] |
| 2.9 Disability, all studies irrespective of risk of bias Show forest plot | 2 | 2691 | Mean Difference (IV, Fixed, 95% CI) | ‐0.25 [‐2.56, 2.06] |
| 2.10 Independent on mRS (0‐2) all studies irrespective of risk of bias Show forest plot | 2 | 3134 | Odds Ratio (M‐H, Fixed, 95% CI) | 1.03 [0.89, 1.19] |