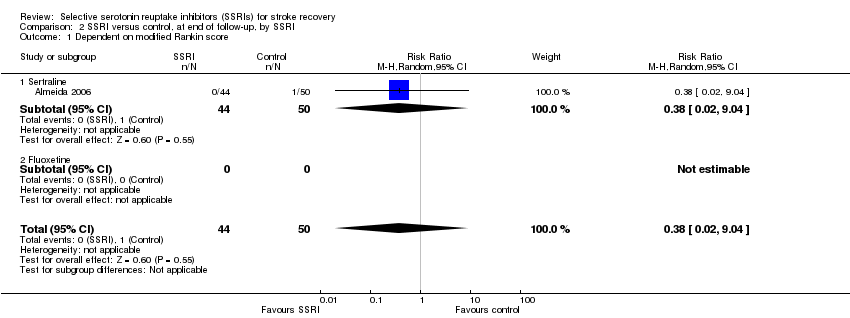
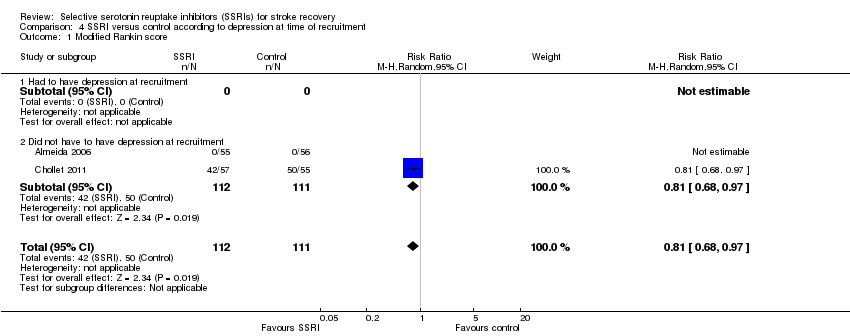
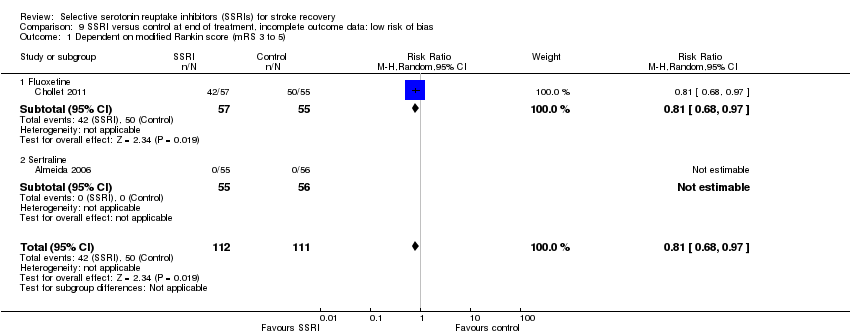
| 1 Dependent on modified Rankin score Show forest plot | 2 | 223 | Risk Ratio (M‐H, Random, 95% CI) | 0.81 [0.68, 0.97] |
|
| 1.1 Mean time since stroke < 2 weeks | 2 | 223 | Risk Ratio (M‐H, Random, 95% CI) | 0.81 [0.68, 0.97] |
| 1.2 Mean time since stroke 2 weeks to 3 months at randomisation | 0 | 0 | Risk Ratio (M‐H, Random, 95% CI) | 0.0 [0.0, 0.0] |
| 1.3 Mean time since stroke 3 to 6 months at randomisation | 0 | 0 | Risk Ratio (M‐H, Random, 95% CI) | 0.0 [0.0, 0.0] |
| 1.4 Mean time since stroke > 6 months and < 9 months | 0 | 0 | Risk Ratio (M‐H, Random, 95% CI) | 0.0 [0.0, 0.0] |
| 1.5 Mean time since stroke at randomisation 9 to 12 months | 0 | 0 | Risk Ratio (M‐H, Random, 95% CI) | 0.0 [0.0, 0.0] |
| 1.6 Mean time since stroke not known | 0 | 0 | Risk Ratio (M‐H, Random, 95% CI) | 0.0 [0.0, 0.0] |
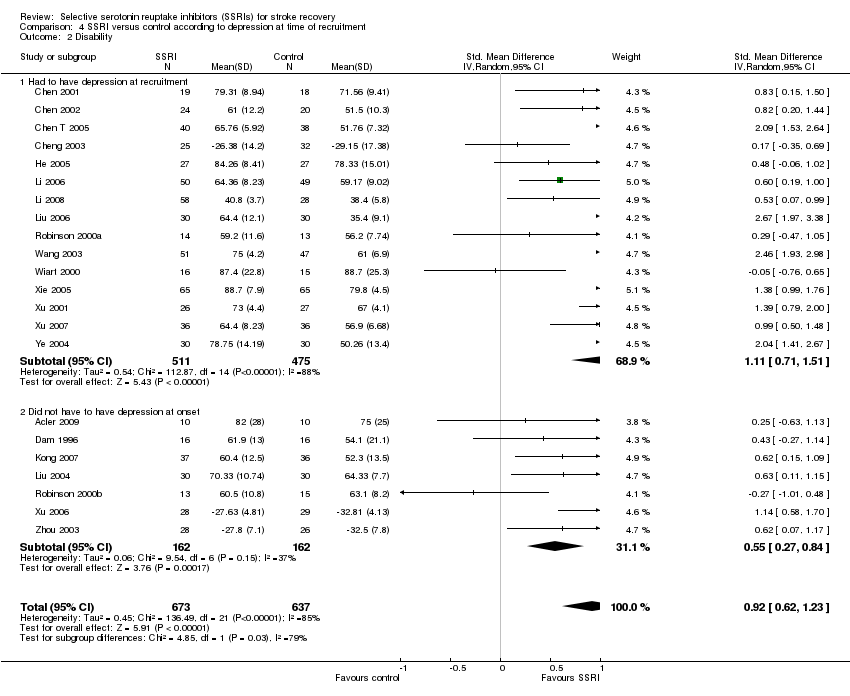
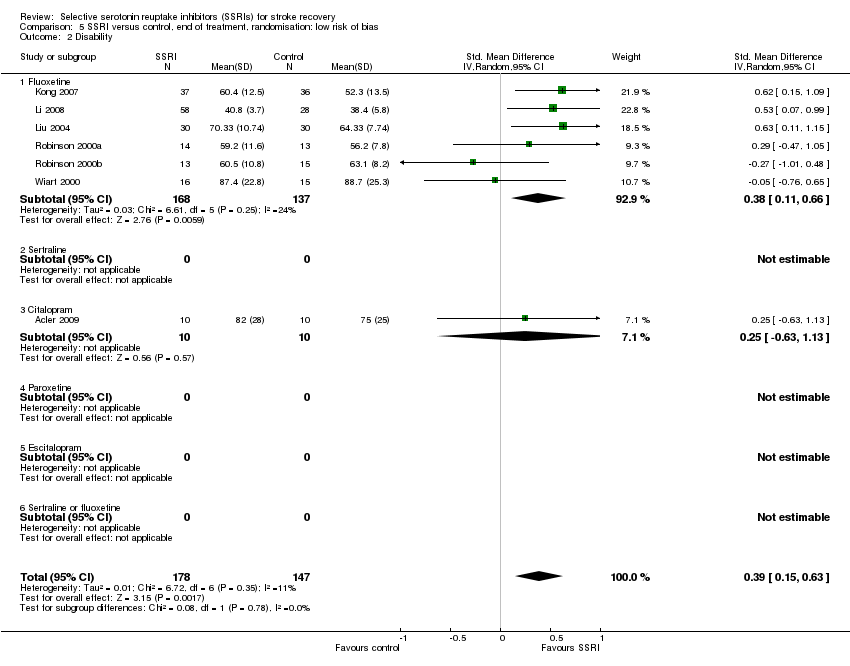
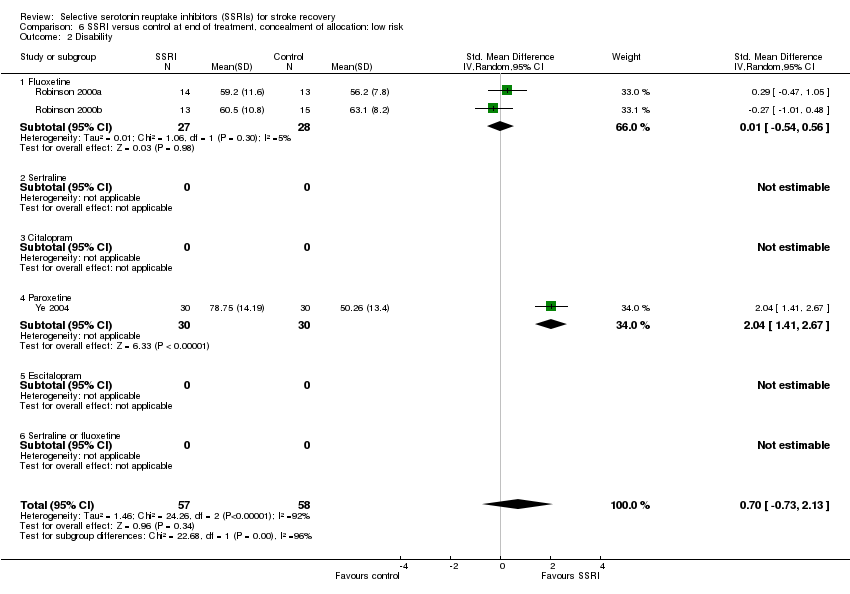
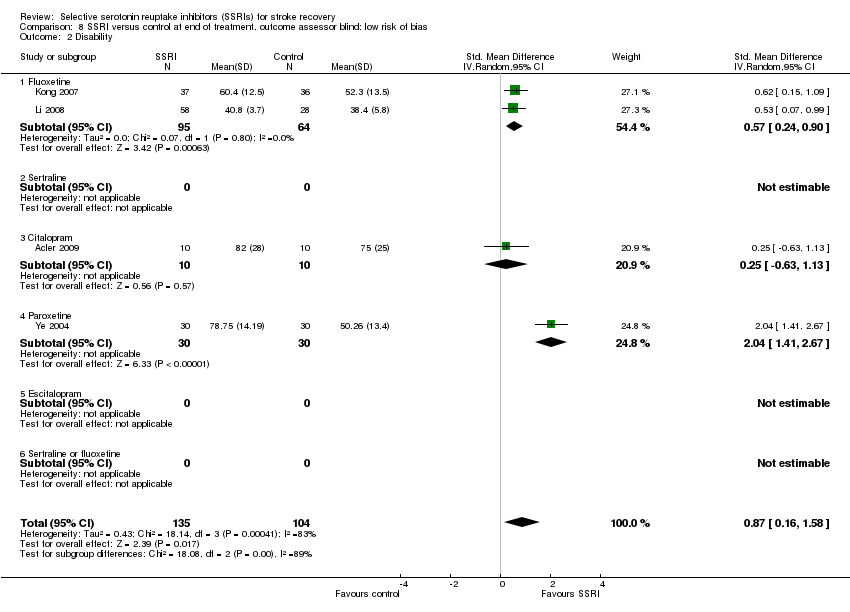
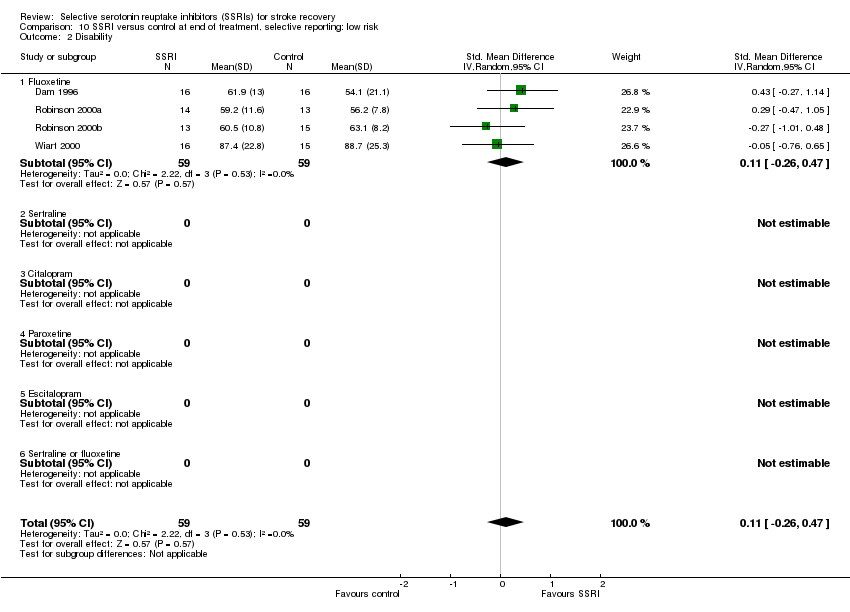
| 2 Disability Show forest plot | 22 | 1310 | Std. Mean Difference (IV, Random, 95% CI) | 0.92 [0.62, 1.23] |
|
| 2.1 Mean time since stroke < 3 months | 17 | 1004 | Std. Mean Difference (IV, Random, 95% CI) | 0.77 [0.47, 1.06] |
| 2.2 Mean time since stroke 3 to 6 months at randomisation | 1 | 32 | Std. Mean Difference (IV, Random, 95% CI) | 0.43 [‐0.27, 1.14] |
| 2.3 Mean time since stroke > 6 months and < 9 months | 1 | 60 | Std. Mean Difference (IV, Random, 95% CI) | 2.67 [1.97, 3.38] |
| 2.4 Mean time since stroke 9 to 12 months | 0 | 0 | Std. Mean Difference (IV, Random, 95% CI) | 0.0 [0.0, 0.0] |
| 2.5 Mean time since stroke not known | 3 | 214 | Std. Mean Difference (IV, Random, 95% CI) | 1.43 [0.40, 2.45] |
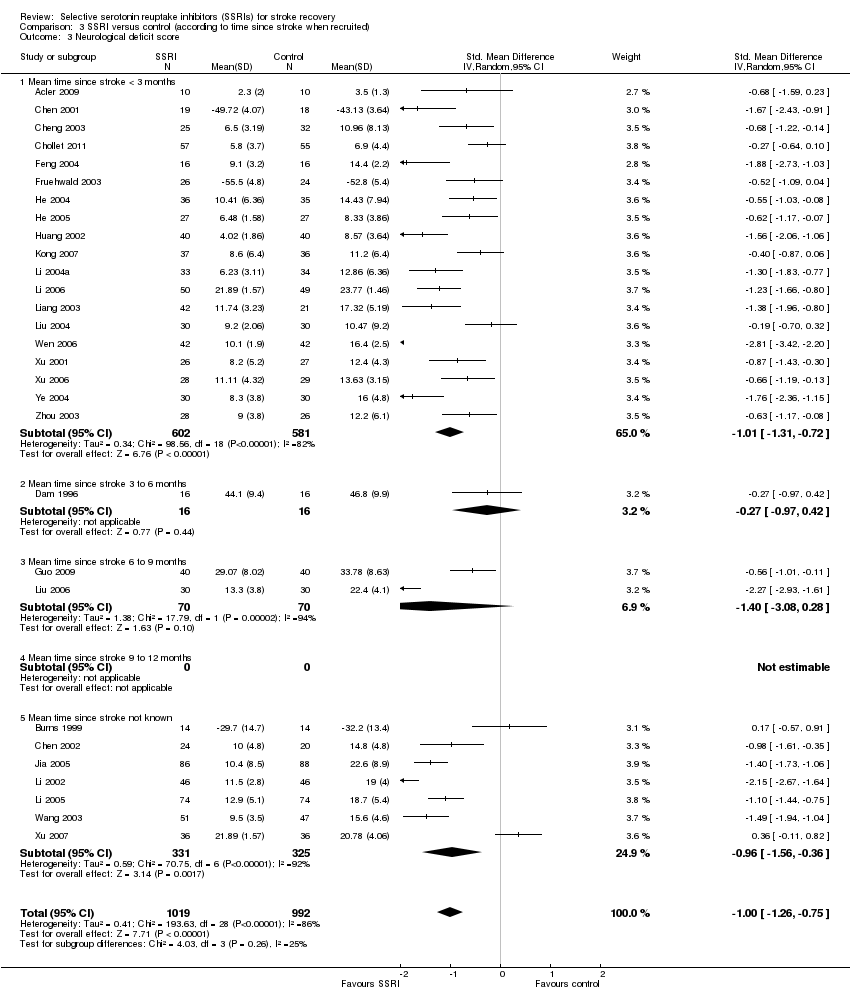
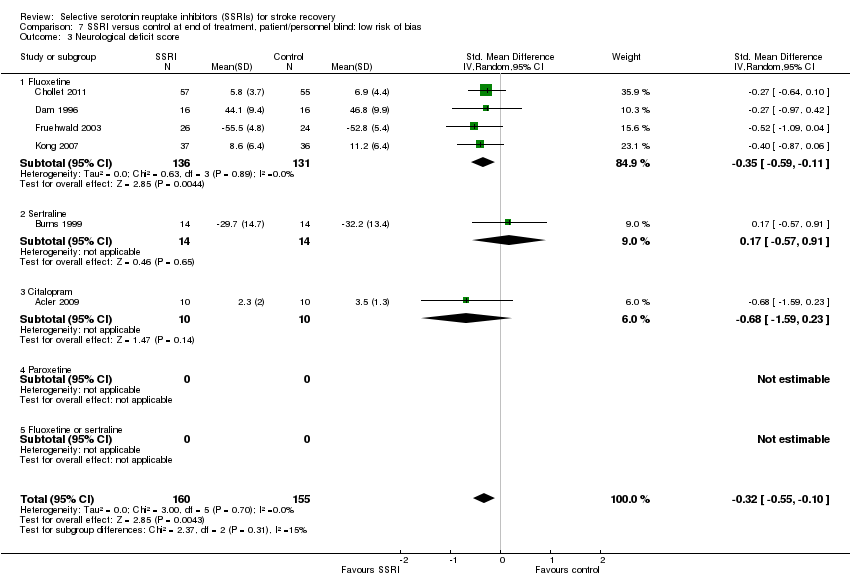
| 3 Neurological deficit score Show forest plot | 29 | 2011 | Std. Mean Difference (IV, Random, 95% CI) | ‐1.00 [‐1.26, ‐0.75] |
|
| 3.1 Mean time since stroke < 3 months | 19 | 1183 | Std. Mean Difference (IV, Random, 95% CI) | ‐1.01 [‐1.31, ‐0.72] |
| 3.2 Mean time since stroke 3 to 6 months | 1 | 32 | Std. Mean Difference (IV, Random, 95% CI) | ‐0.27 [‐0.97, 0.42] |
| 3.3 Mean time since stroke 6 to 9 months | 2 | 140 | Std. Mean Difference (IV, Random, 95% CI) | ‐1.40 [‐3.08, 0.28] |
| 3.4 Mean time since stroke 9 to 12 months | 0 | 0 | Std. Mean Difference (IV, Random, 95% CI) | 0.0 [0.0, 0.0] |
| 3.5 Mean time since stroke not known | 7 | 656 | Std. Mean Difference (IV, Random, 95% CI) | ‐0.96 [‐1.56, ‐0.36] |
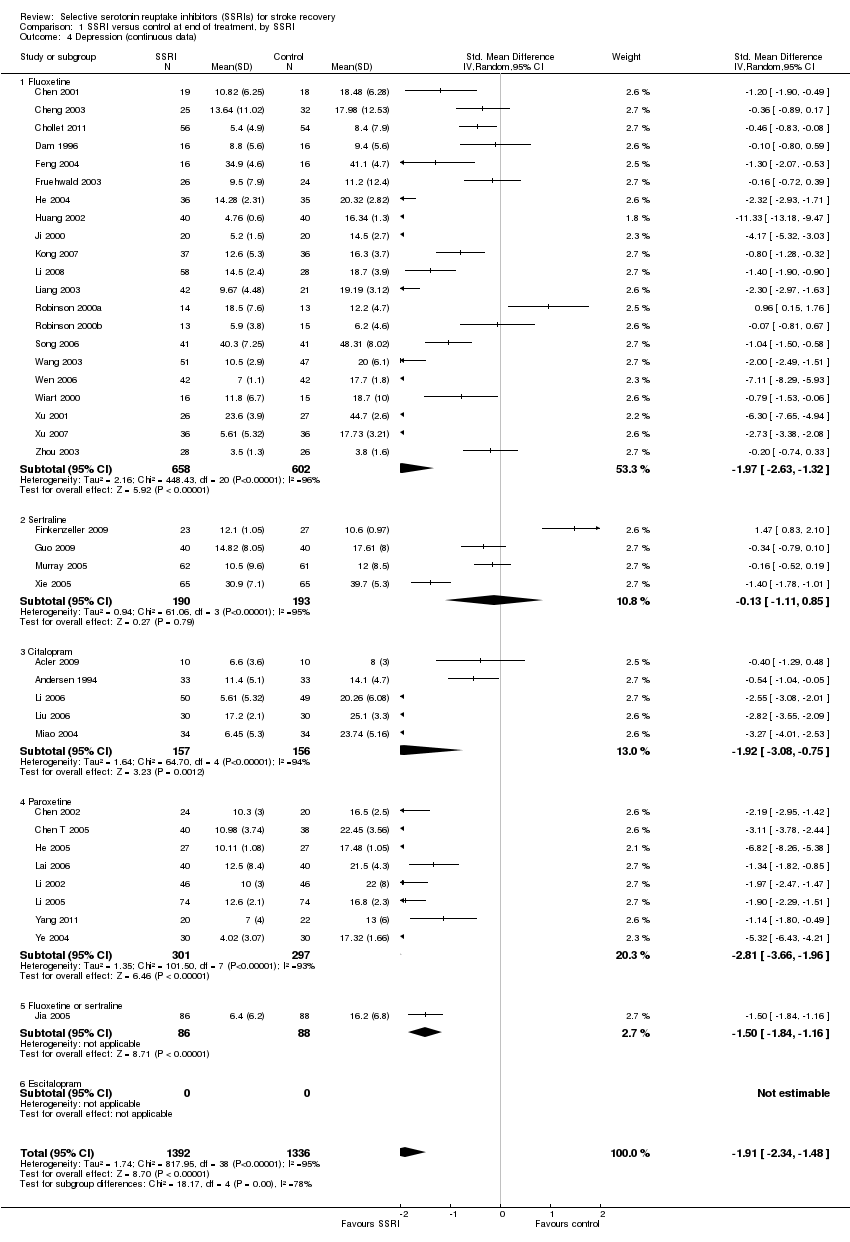
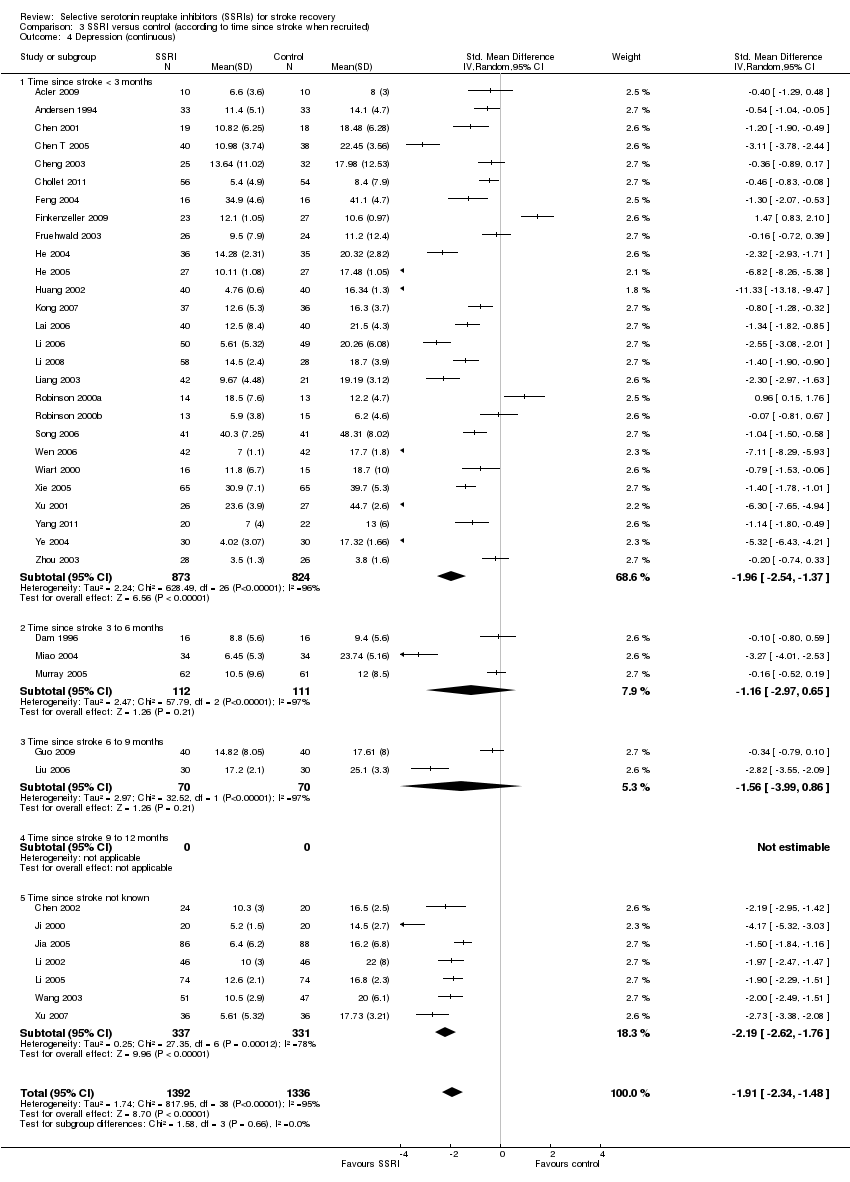
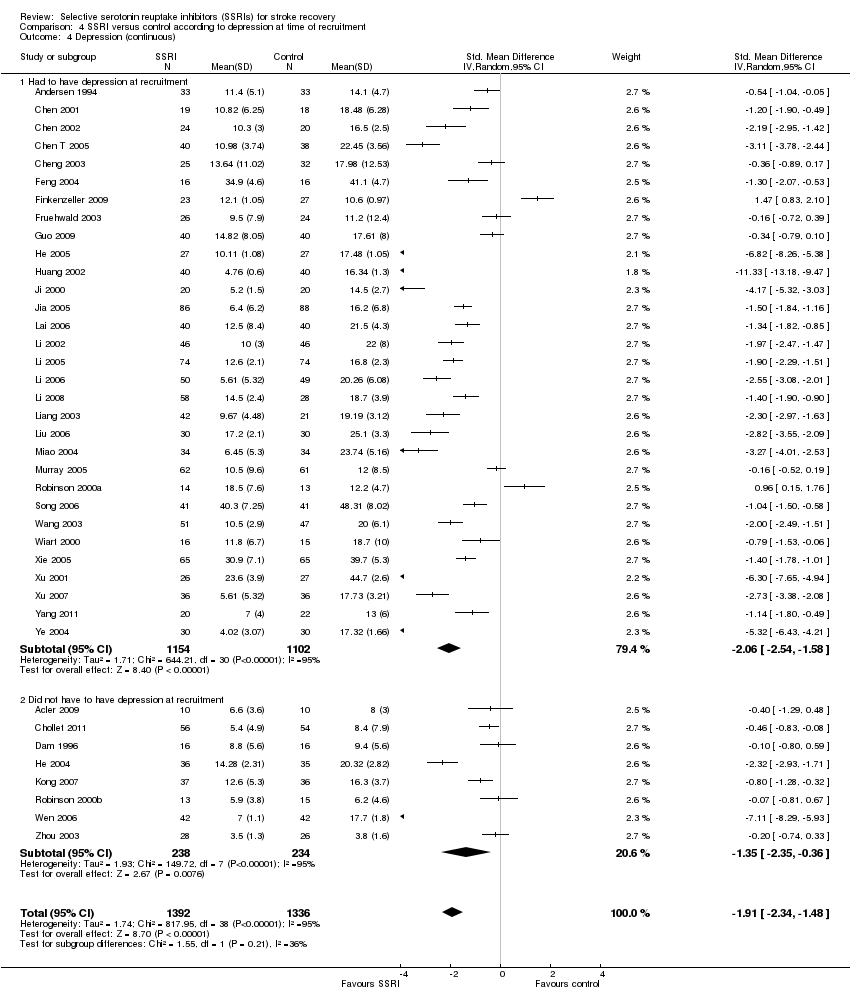
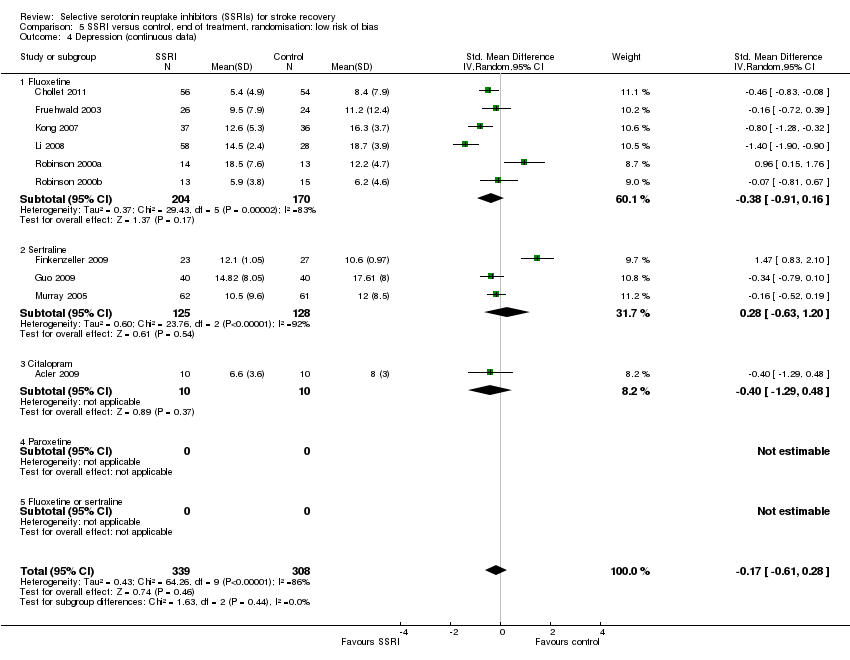
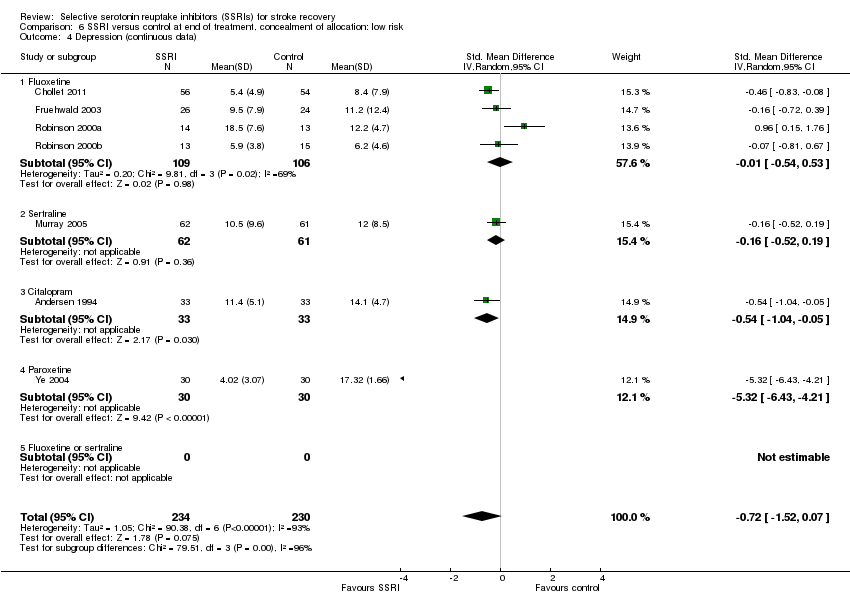
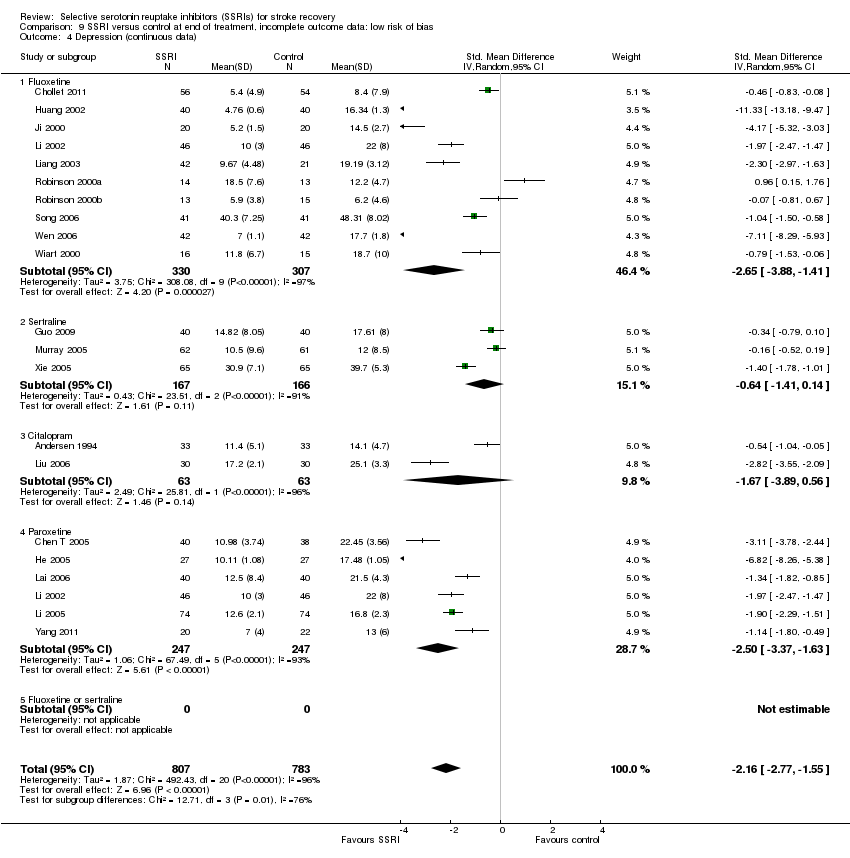
| 4 Depression (continuous) Show forest plot | 39 | 2728 | Std. Mean Difference (IV, Random, 95% CI) | ‐1.91 [‐2.34, ‐1.48] |
|
| 4.1 Time since stroke < 3 months | 27 | 1697 | Std. Mean Difference (IV, Random, 95% CI) | ‐1.96 [‐2.54, ‐1.37] |
| 4.2 Time since stroke 3 to 6 months | 3 | 223 | Std. Mean Difference (IV, Random, 95% CI) | ‐1.16 [‐2.97, 0.65] |
| 4.3 Time since stroke 6 to 9 months | 2 | 140 | Std. Mean Difference (IV, Random, 95% CI) | ‐1.56 [‐3.99, 0.86] |
| 4.4 Time since stroke 9 to 12 months | 0 | 0 | Std. Mean Difference (IV, Random, 95% CI) | 0.0 [0.0, 0.0] |
| 4.5 Time since stroke not known | 7 | 668 | Std. Mean Difference (IV, Random, 95% CI) | ‐2.19 [‐2.62, ‐1.76] |
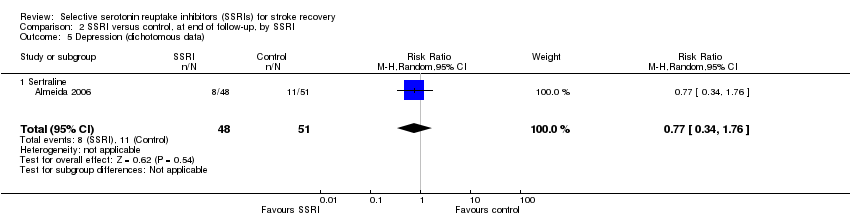
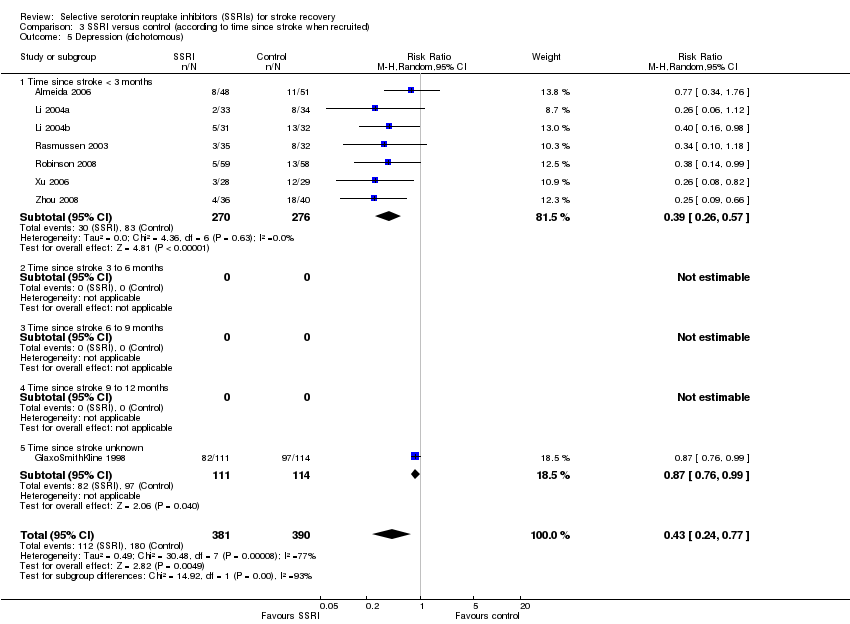
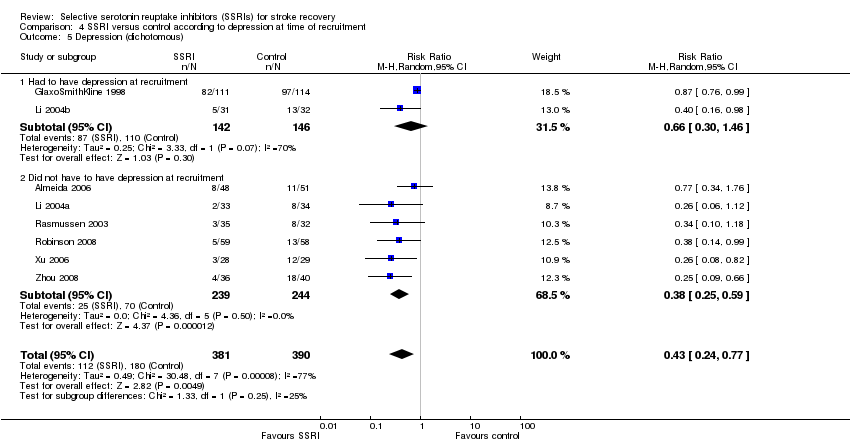
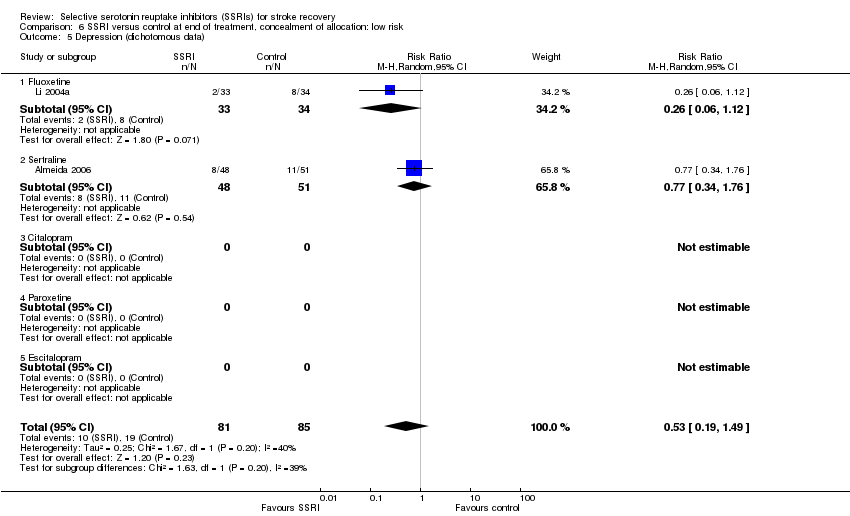
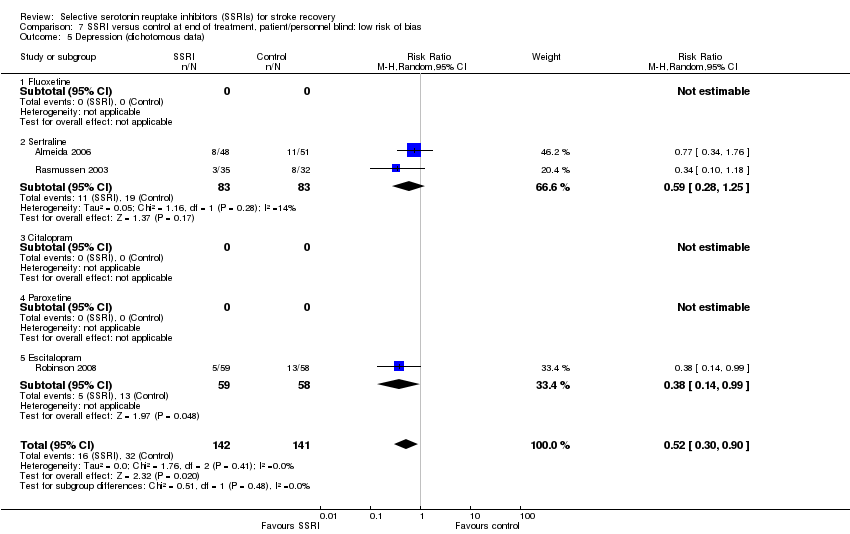
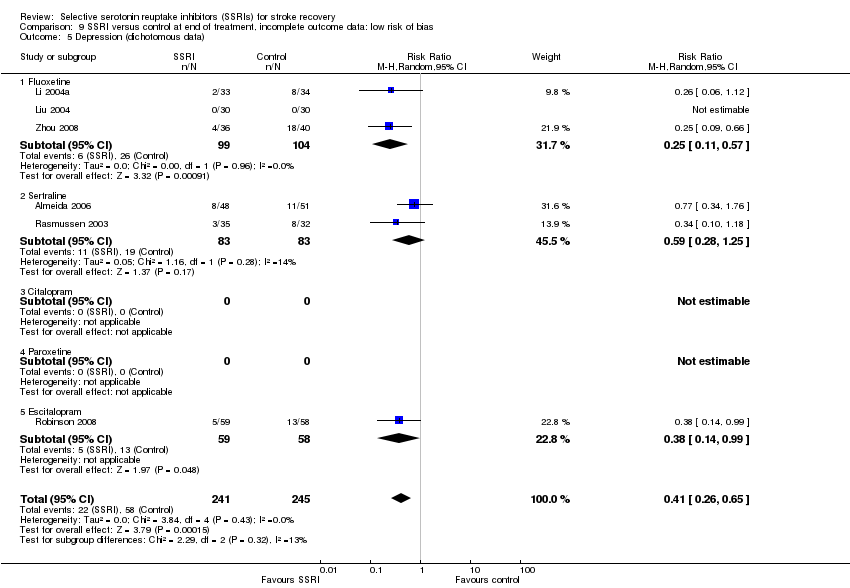
| 5 Depression (dichotomous) Show forest plot | 8 | 771 | Risk Ratio (M‐H, Random, 95% CI) | 0.43 [0.24, 0.77] |
|
| 5.1 Time since stroke < 3 months | 7 | 546 | Risk Ratio (M‐H, Random, 95% CI) | 0.39 [0.26, 0.57] |
| 5.2 Time since stroke 3 to 6 months | 0 | 0 | Risk Ratio (M‐H, Random, 95% CI) | 0.0 [0.0, 0.0] |
| 5.3 Time since stroke 6 to 9 months | 0 | 0 | Risk Ratio (M‐H, Random, 95% CI) | 0.0 [0.0, 0.0] |
| 5.4 Time since stroke 9 to 12 months | 0 | 0 | Risk Ratio (M‐H, Random, 95% CI) | 0.0 [0.0, 0.0] |
| 5.5 Time since stroke unknown | 1 | 225 | Risk Ratio (M‐H, Random, 95% CI) | 0.87 [0.76, 0.99] |
| 6 Anxiety (dichotomous) | 0 | 0 | Risk Ratio (M‐H, Random, 95% CI) | 0.0 [0.0, 0.0] |
| 6.1 Time since stroke < 3 months | 0 | 0 | Risk Ratio (M‐H, Random, 95% CI) | 0.0 [0.0, 0.0] |
| 6.2 Time since stroke 3 to 6 months | 0 | 0 | Risk Ratio (M‐H, Random, 95% CI) | 0.0 [0.0, 0.0] |
| 6.3 Time since stroke 6 to 9 months | 0 | 0 | Risk Ratio (M‐H, Random, 95% CI) | 0.0 [0.0, 0.0] |
| 6.4 Time since stroke 9 to 12 months | 0 | 0 | Risk Ratio (M‐H, Random, 95% CI) | 0.0 [0.0, 0.0] |
| 6.5 Time from stroke onset unknown | 0 | 0 | Risk Ratio (M‐H, Random, 95% CI) | 0.0 [0.0, 0.0] |
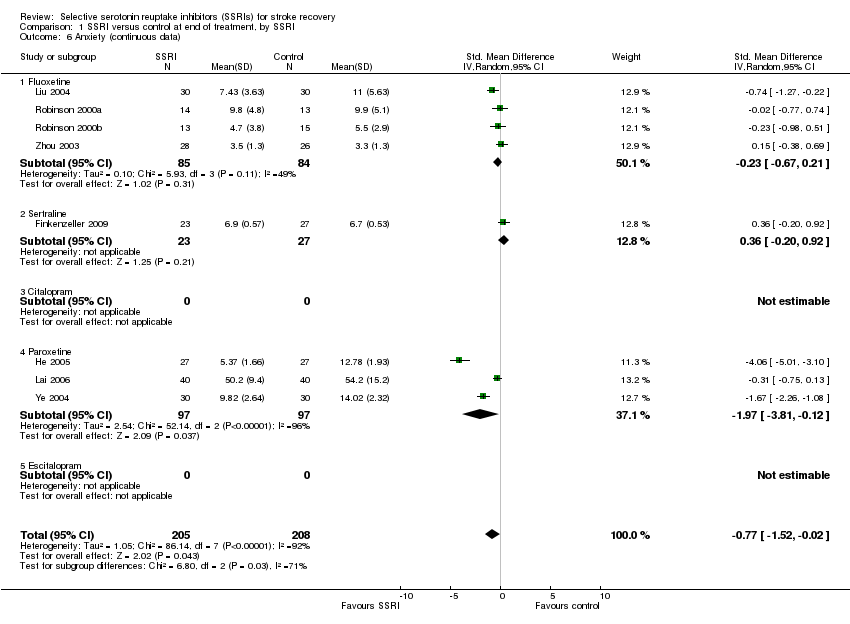
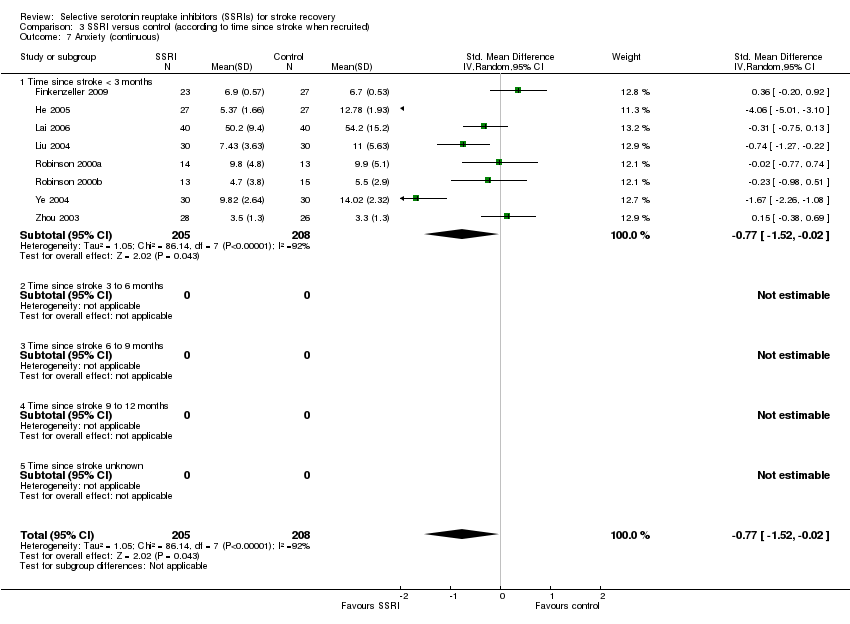
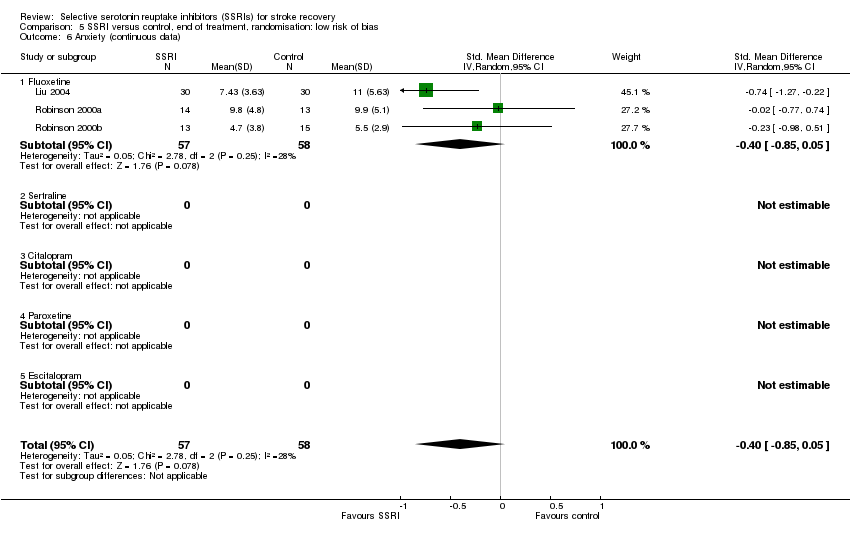
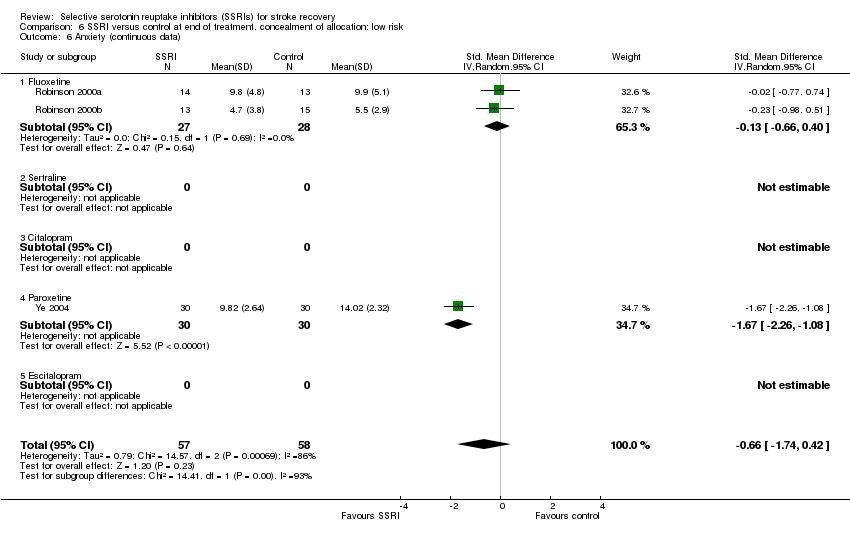
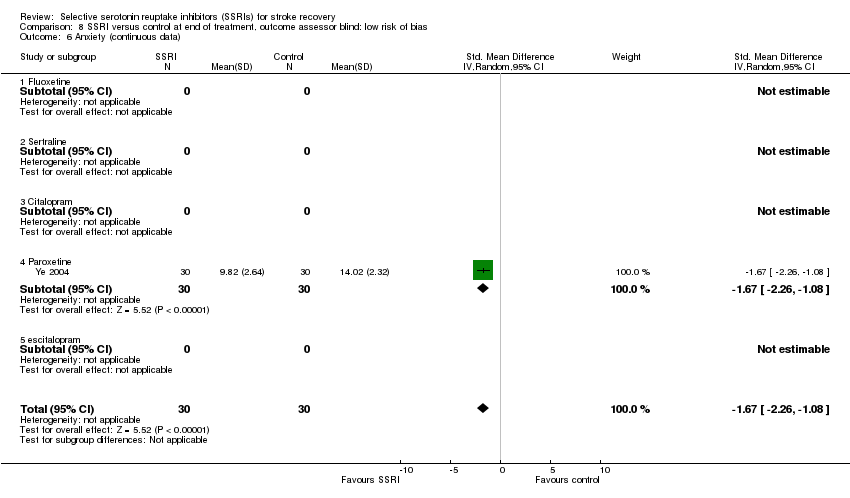
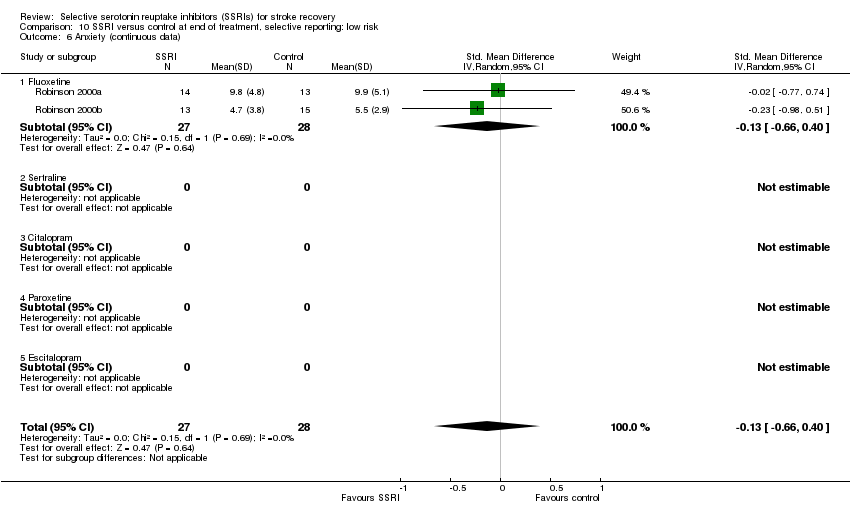
| 7 Anxiety (continuous) Show forest plot | 8 | 413 | Std. Mean Difference (IV, Random, 95% CI) | ‐0.77 [‐1.52, ‐0.02] |
|
| 7.1 Time since stroke < 3 months | 8 | 413 | Std. Mean Difference (IV, Random, 95% CI) | ‐0.77 [‐1.52, ‐0.02] |
| 7.2 Time since stroke 3 to 6 months | 0 | 0 | Std. Mean Difference (IV, Random, 95% CI) | 0.0 [0.0, 0.0] |
| 7.3 Time since stroke 6 to 9 months | 0 | 0 | Std. Mean Difference (IV, Random, 95% CI) | 0.0 [0.0, 0.0] |
| 7.4 Time since stroke 9 to 12 months | 0 | 0 | Std. Mean Difference (IV, Random, 95% CI) | 0.0 [0.0, 0.0] |
| 7.5 Time since stroke unknown | 0 | 0 | Std. Mean Difference (IV, Random, 95% CI) | 0.0 [0.0, 0.0] |
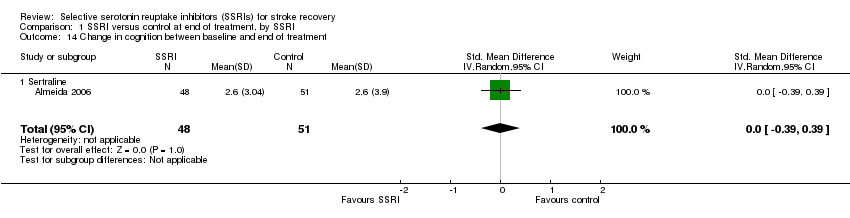
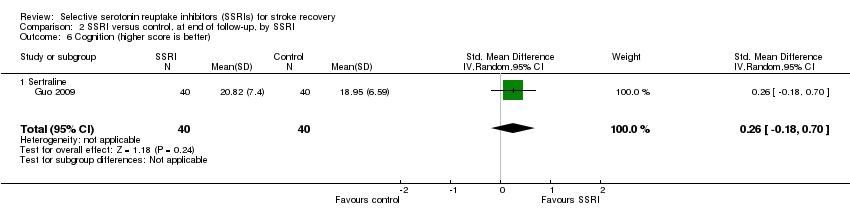
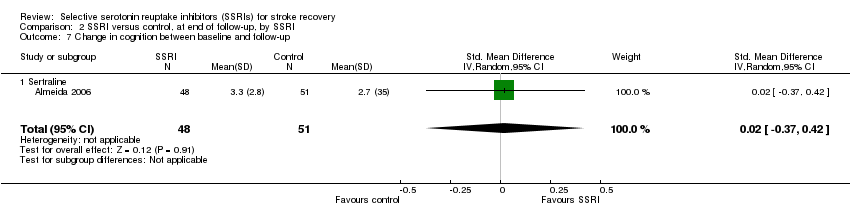
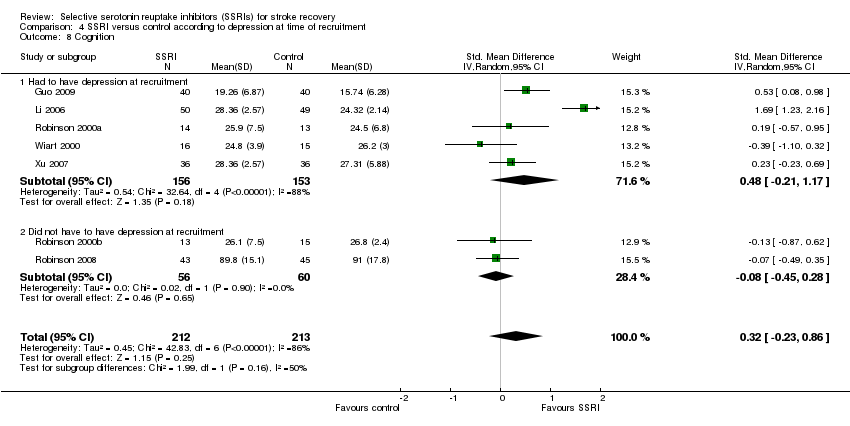
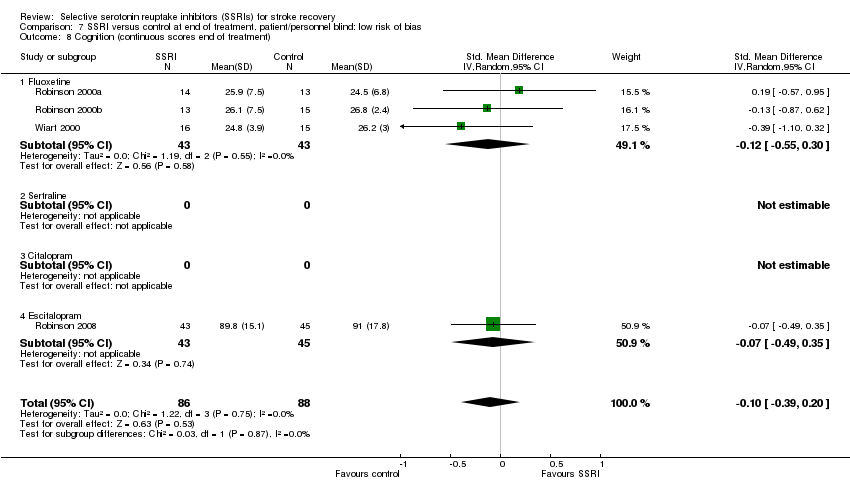
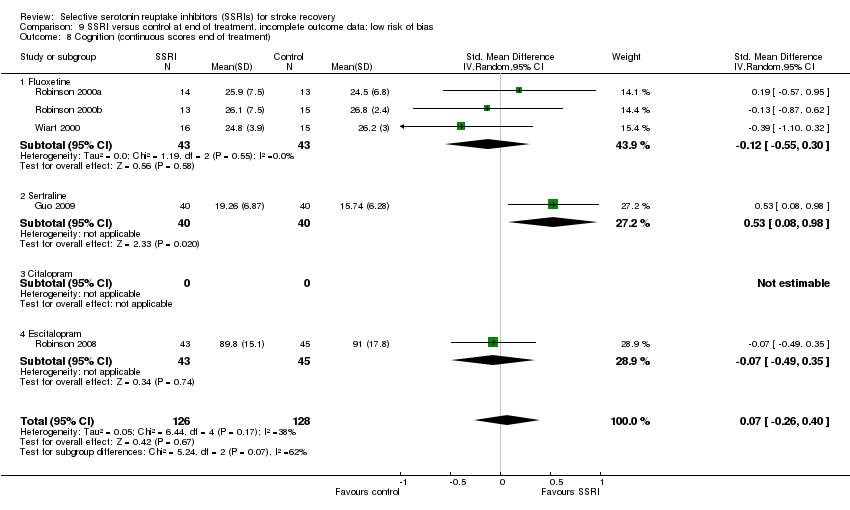
| 8 Cognition Show forest plot | 7 | 425 | Std. Mean Difference (IV, Random, 95% CI) | 0.32 [‐0.23, 0.86] |
|
| 8.1 Time since stroke < 3 months | 5 | 273 | Std. Mean Difference (IV, Random, 95% CI) | 0.28 [‐0.57, 1.13] |
| 8.2 Time since stroke 3 to 6 months | 0 | 0 | Std. Mean Difference (IV, Random, 95% CI) | 0.0 [0.0, 0.0] |
| 8.3 Time since stroke 6 to 9 months | 1 | 80 | Std. Mean Difference (IV, Random, 95% CI) | 0.53 [0.08, 0.98] |
| 8.4 Time since stroke 9 to 12 months | 0 | 0 | Std. Mean Difference (IV, Random, 95% CI) | 0.0 [0.0, 0.0] |
| 8.5 Time since stroke unknown | 1 | 72 | Std. Mean Difference (IV, Random, 95% CI) | 0.23 [‐0.23, 0.69] |
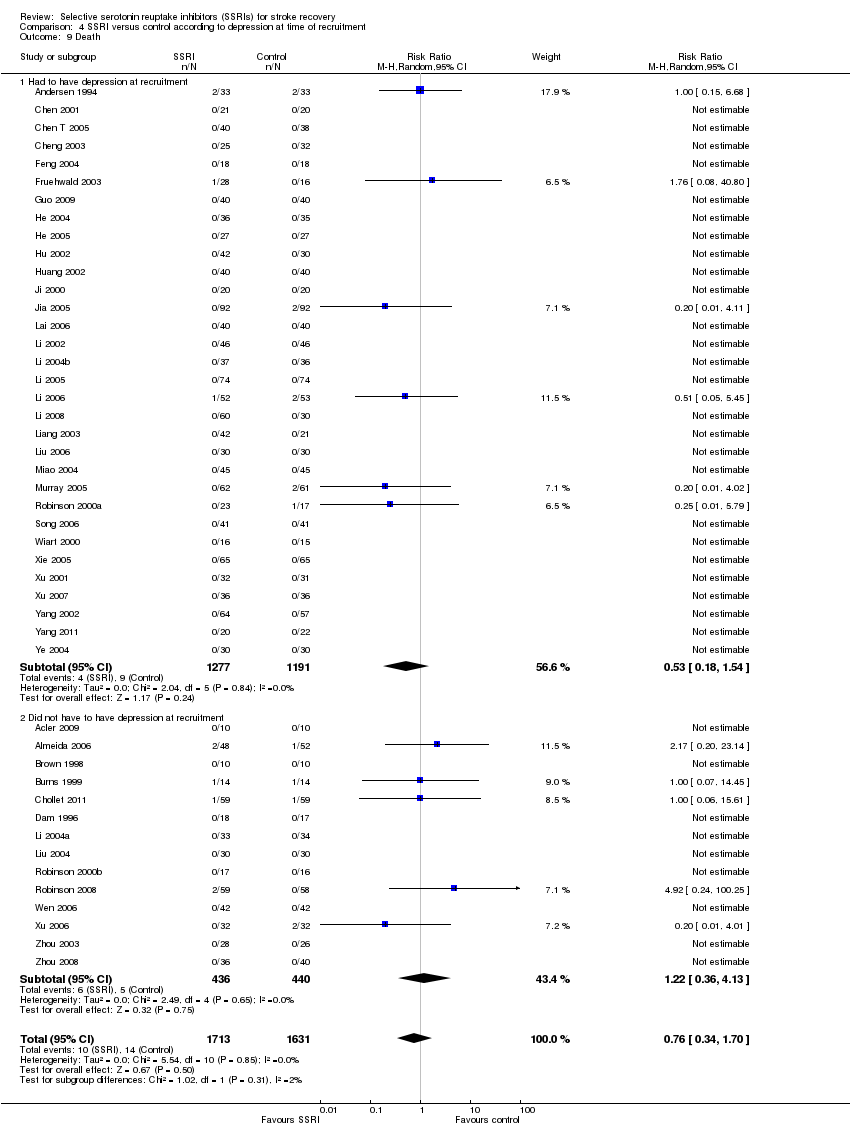
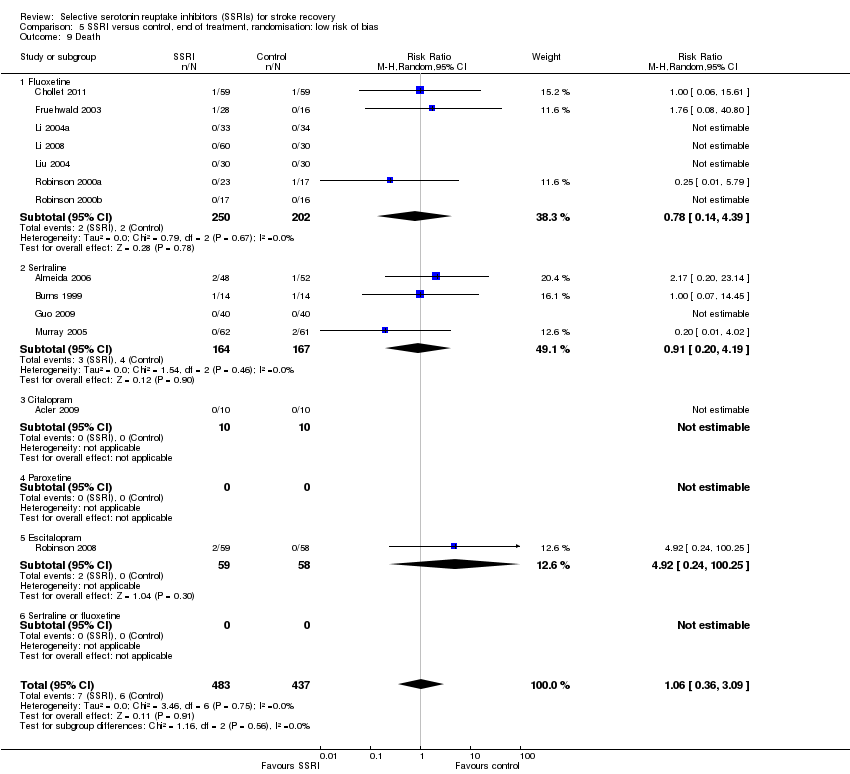
| 9 Death Show forest plot | 46 | 3404 | Risk Ratio (M‐H, Random, 95% CI) | 0.76 [0.34, 1.70] |
|
| 9.1 Time since stroke < 3 months | 34 | 2311 | Risk Ratio (M‐H, Random, 95% CI) | 0.94 [0.38, 2.36] |
| 9.2 Time since stroke 3 to 6 months | 4 | 369 | Risk Ratio (M‐H, Random, 95% CI) | 0.20 [0.01, 4.02] |
| 9.3 Time since stroke 6 to 9 months | 2 | 140 | Risk Ratio (M‐H, Random, 95% CI) | 0.0 [0.0, 0.0] |
| 9.4 Time since stroke 9 to 12 months | 0 | 0 | Risk Ratio (M‐H, Random, 95% CI) | 0.0 [0.0, 0.0] |
| 9.5 Time since stroke unknown | 7 | 584 | Risk Ratio (M‐H, Random, 95% CI) | 0.49 [0.07, 3.65] |
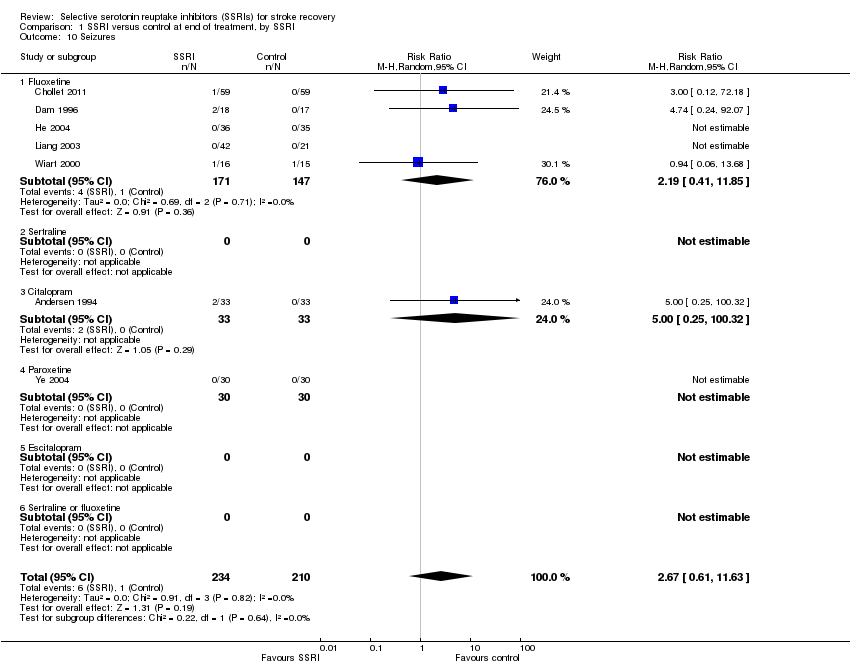
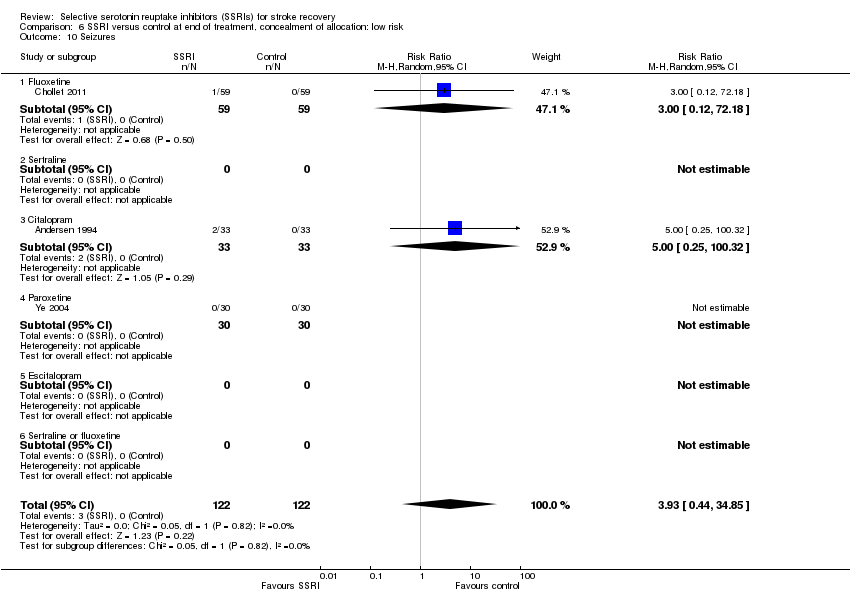
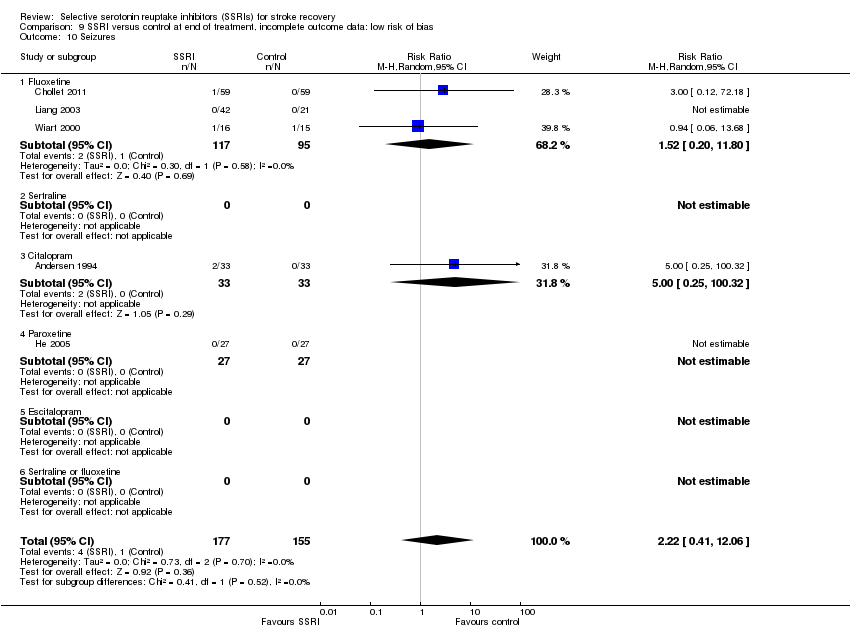
| 10 Seizure Show forest plot | 7 | 444 | Risk Ratio (M‐H, Random, 95% CI) | 2.67 [0.61, 11.63] |
|
| 10.1 Time since stroke < 3 months | 6 | 409 | Risk Ratio (M‐H, Random, 95% CI) | 2.22 [0.41, 12.06] |
| 10.2 Time since stroke 3 to 6 months | 1 | 35 | Risk Ratio (M‐H, Random, 95% CI) | 4.74 [0.24, 92.07] |
| 10.3 Time since stroke 6 to 9 months | 0 | 0 | Risk Ratio (M‐H, Random, 95% CI) | 0.0 [0.0, 0.0] |
| 10.4 Time since stroke 9 to 12 months | 0 | 0 | Risk Ratio (M‐H, Random, 95% CI) | 0.0 [0.0, 0.0] |
| 10.5 Time since stroke unknown | 0 | 0 | Risk Ratio (M‐H, Random, 95% CI) | 0.0 [0.0, 0.0] |
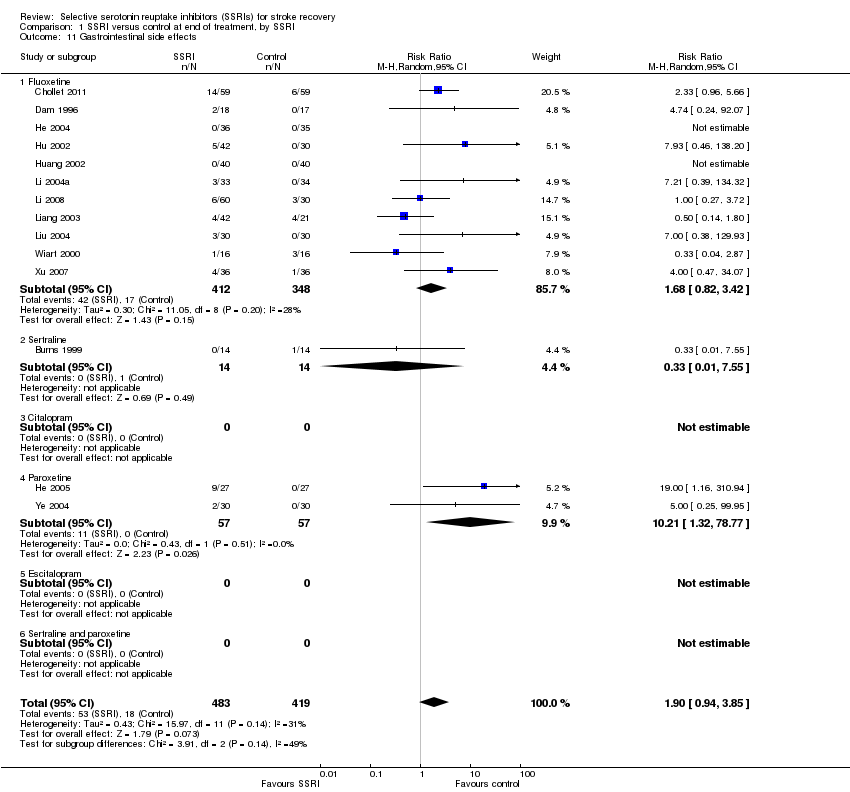
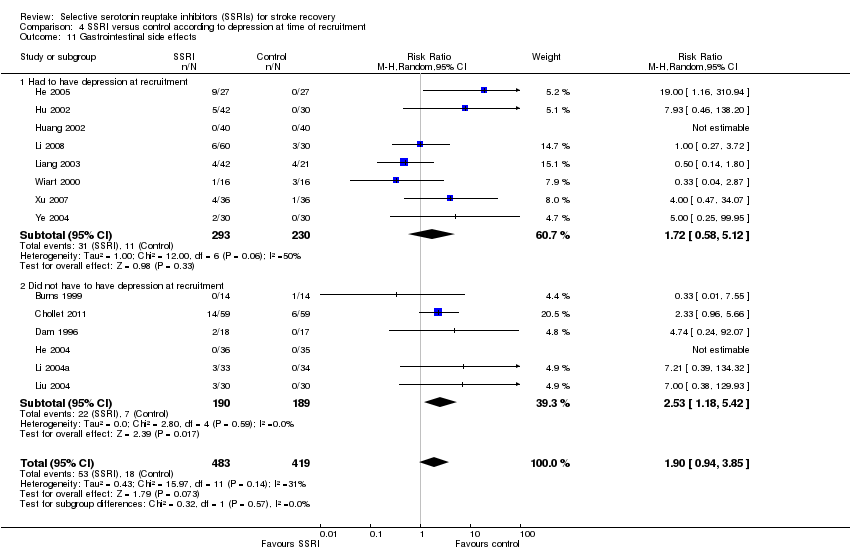
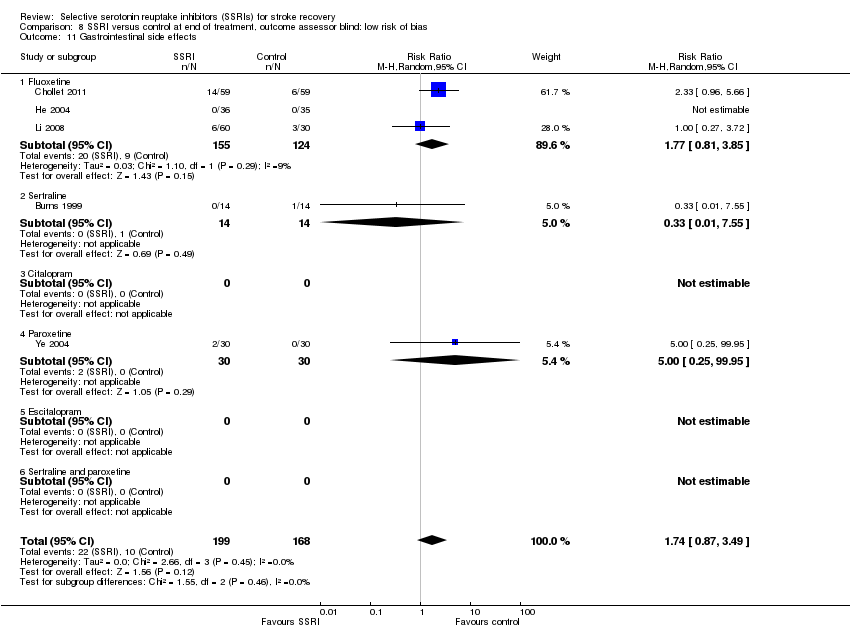
| 11 Gastrointestinal side effects Show forest plot | 14 | 902 | Risk Ratio (M‐H, Random, 95% CI) | 1.90 [0.94, 3.85] |
|
| 11.1 Time since stroke < 3 months | 11 | 767 | Risk Ratio (M‐H, Random, 95% CI) | 1.92 [0.83, 4.45] |
| 11.2 Time since stroke 3 to 6 months | 1 | 35 | Risk Ratio (M‐H, Random, 95% CI) | 4.74 [0.24, 92.07] |
| 11.3 Time since stroke 6 to 9 months | 0 | 0 | Risk Ratio (M‐H, Random, 95% CI) | 0.0 [0.0, 0.0] |
| 11.4 Time since stroke 9 to 12 months | 0 | 0 | Risk Ratio (M‐H, Random, 95% CI) | 0.0 [0.0, 0.0] |
| 11.5 Time since stroke unknown | 2 | 100 | Risk Ratio (M‐H, Random, 95% CI) | 1.51 [0.14, 16.29] |
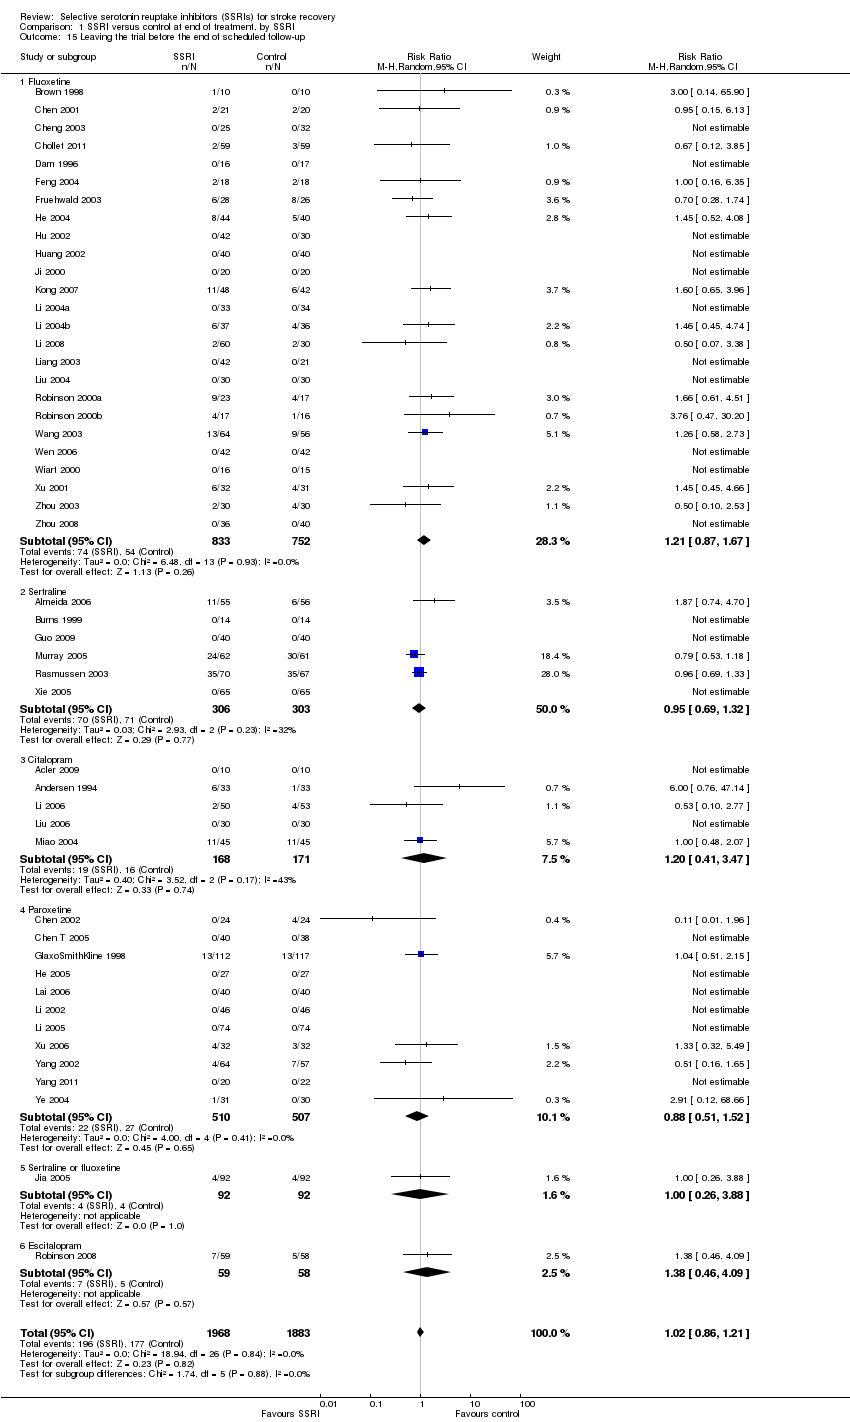
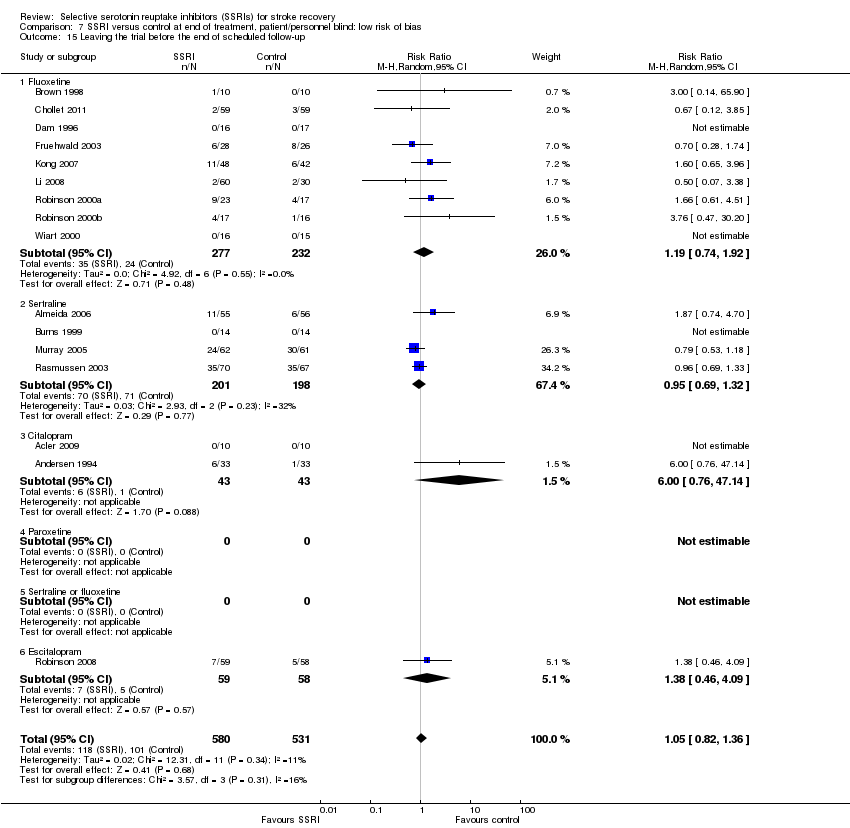
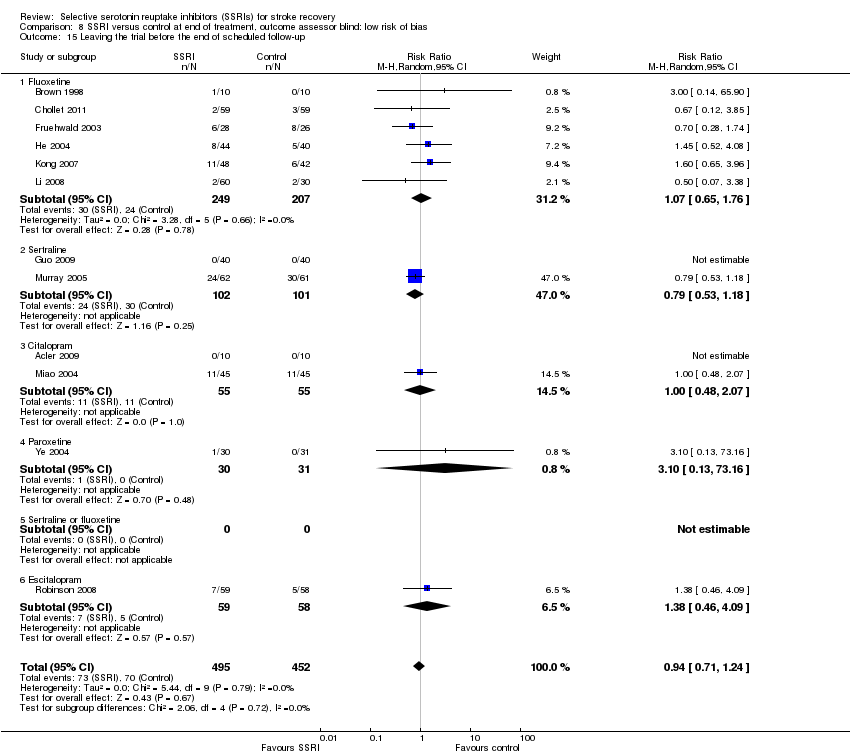
| 12 Leaving the trial early Show forest plot | 49 | 3851 | Risk Ratio (M‐H, Random, 95% CI) | 1.02 [0.86, 1.21] |
|
| 12.1 Time since stroke < 3 months | 34 | 2435 | Risk Ratio (M‐H, Random, 95% CI) | 1.12 [0.90, 1.40] |
| 12.2 Time since stroke 3 to 6 months | 3 | 246 | Risk Ratio (M‐H, Random, 95% CI) | 0.83 [0.59, 1.19] |
| 12.3 Time since stroke 6 to 9 months | 2 | 140 | Risk Ratio (M‐H, Random, 95% CI) | 0.0 [0.0, 0.0] |
| 12.4 Time since stroke 9 to 12 months | 0 | 0 | Risk Ratio (M‐H, Random, 95% CI) | 0.0 [0.0, 0.0] |
| 12.5 Time since stroke not known | 10 | 1030 | Risk Ratio (M‐H, Random, 95% CI) | 0.97 [0.62, 1.51] |
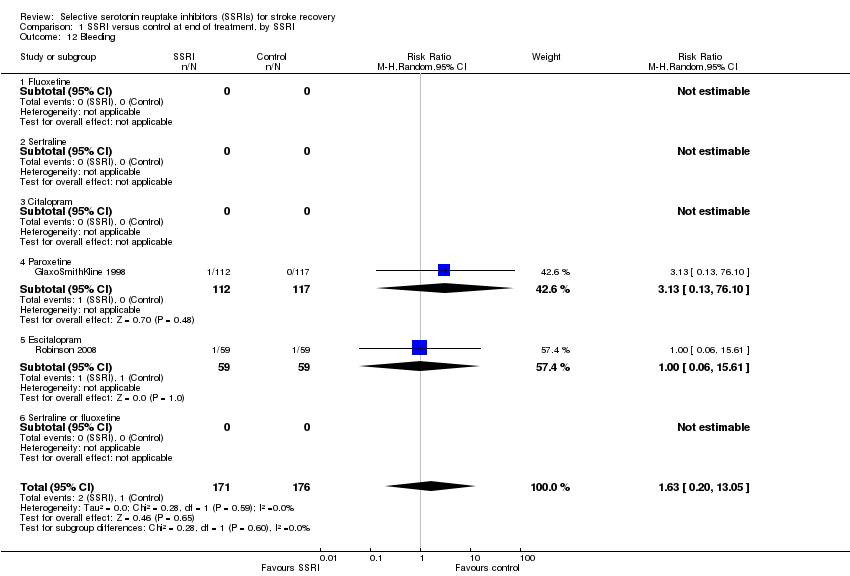
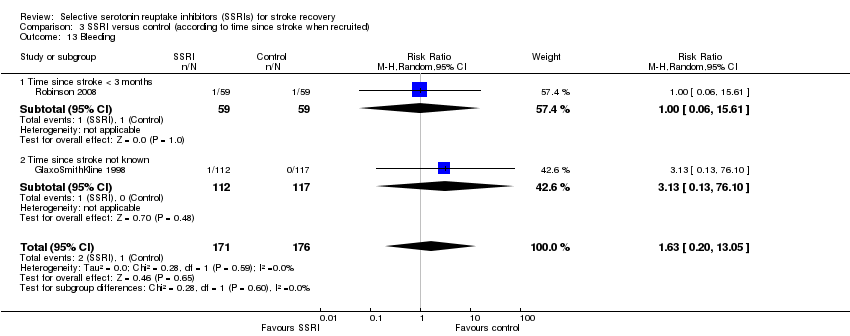
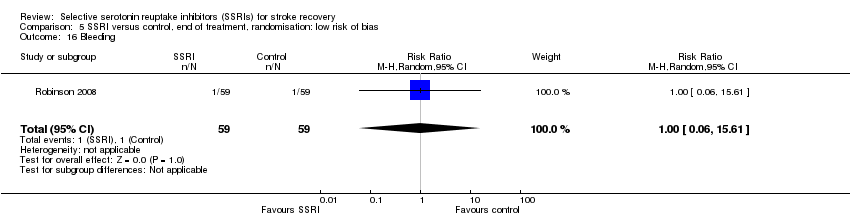
| 13 Bleeding Show forest plot | 2 | 347 | Risk Ratio (M‐H, Random, 95% CI) | 1.63 [0.20, 13.05] |
|
| 13.1 Time since stroke < 3 months | 1 | 118 | Risk Ratio (M‐H, Random, 95% CI) | 1.0 [0.06, 15.61] |
| 13.2 Time since stroke not known | 1 | 229 | Risk Ratio (M‐H, Random, 95% CI) | 3.13 [0.13, 76.10] |
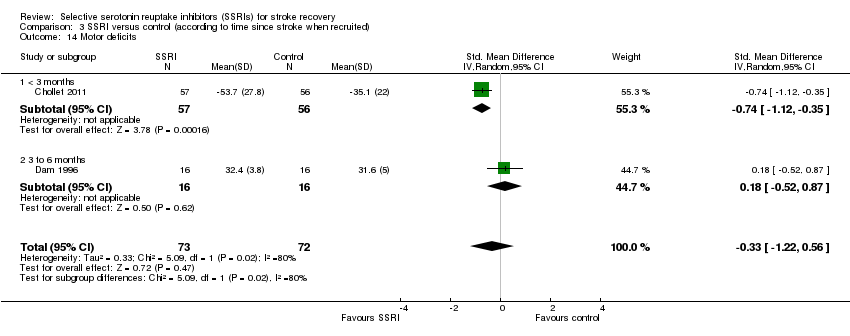
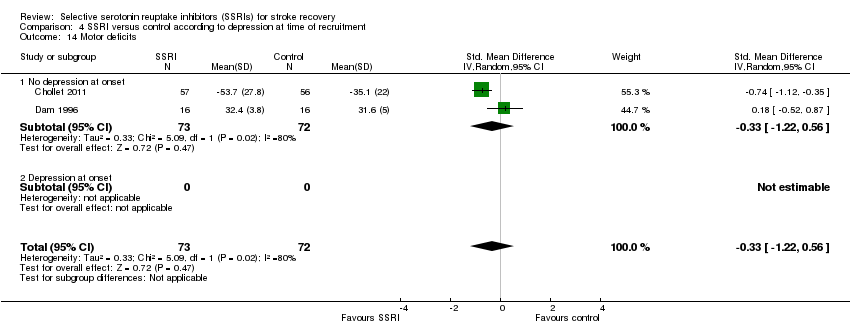
| 14 Motor deficits Show forest plot | 2 | 145 | Std. Mean Difference (IV, Random, 95% CI) | ‐0.33 [‐1.22, 0.56] |
|
| 14.1 < 3 months | 1 | 113 | Std. Mean Difference (IV, Random, 95% CI) | ‐0.74 [‐1.12, ‐0.35] |
| 14.2 3 to 6 months | 1 | 32 | Std. Mean Difference (IV, Random, 95% CI) | 0.18 [‐0.52, 0.87] |