Parto temprano programado versus manejo expectante para los trastornos hipertensivos de la semana 34 del embarazo al término
Resumen
Antecedentes
Los trastornos hipertensivos en el embarazo son contribuyentes significativos a la morbilidad y la mortalidad materna y perinatal. Estos trastornos incluyen la hipertensión crónica bien controlada, la hipertensión gestacional (hipertensión inducida por el embarazo) y la preeclampsia leve. El tratamiento definitivo de estos trastornos es el parto temprano planificado y la opción es seguir el embarazo de forma expectante si no existe hipertensión no controlada grave, con monitorización estrecha materna y fetal. Hay efectos beneficiosos y riesgos asociados con ambos, de manera que es importante establecer la opción más segura.
Objetivos
Evaluar los efectos beneficiosos y los riesgos de una política de parto temprano planificado versus una política de manejo expectante en las embarazadas con trastornos hipertensivos, a término o cerca del término (desde las 34 semanas en adelante).
Métodos de búsqueda
Se hicieron búsquedas en el registro de ensayos del Grupo Cochrane de Embarazo y Parto (Cochrane Pregnancy and Childbirth Group) (12 enero 2016) y en las listas de referencias de los estudios recuperados.
Criterios de selección
Ensayos aleatorios de una política de parto temprano planificado (por inducción del trabajo de parto o por cesárea) en comparación con una política de parto retardado ("manejo expectante") en las embarazadas con trastornos hipertensivos a partir de las 34 semanas de gestación. Los ensayos asignados al azar de forma grupal habrían sido elegibles para inclusión en esta revisión, pero no se encontraron.
Los estudios que utilizaron un diseño cruzado no se consideraron elegibles para inclusión en esta revisión. De igual manera, los estudios con un diseño cruzado no son elegibles para inclusión porque no son un diseño de estudio apropiado para la investigación de los trastornos hipertensivos en el embarazo.
Obtención y análisis de los datos
Dos autores de la revisión evaluaron de forma independiente la elegibilidad y los riesgos de sesgos. Dos autores de la revisión extrajeron los datos de forma independiente. Se verificó la exactitud de los datos.
Resultados principales
En esta revisión se incluyeron cinco estudios con 1819 mujeres.
Hubo un riesgo menor de mortalidad materna y morbilidad grave compuestas en las pacientes asignadas al azar a recibir parto temprano planificado (cociente de riesgos [CR] 0,69; intervalo de confianza [IC] del 95%: 0,57 a 0,83; dos estudios, 1459 mujeres [pruebas de alta calidad]). No hubo diferencias claras entre los subgrupos sobre la base del análisis de subgrupos por edad gestacional, semana de embarazo ni afección. El parto temprano planificado se asoció con un riesgo menor de síndrome HELLP (CR 0,40; IC del 95%: 0,17 a 0,93; 1628 mujeres; tres estudios) y insuficiencia renal grave (CR 0,36; IC del 95%: 0,14 a 0,92; 100 mujeres, un estudio).
No hubo información suficiente para establecer conclusiones acerca de los efectos sobre mortalidad infantil y morbilidad grave compuestas. Se observó un nivel alto de heterogeneidad entre los dos estudios en este análisis (dos estudios, 1459 lactantes, I2 = 87%, Tau2 = 0,98), por lo que no se agruparon los datos en un metanálisis. No hubo diferencias claras entre los subgrupos sobre la base del análisis de subgrupos por edad gestacional, semana de embarazo ni afección. El parto temprano planificado se asoció con niveles más altos de síndrome de dificultad respiratoria (CR 2,24; IC del 95%: 1,20 a 4,18; tres estudios, 1511 lactantes) e ingreso a la UCIN (CR 1,65; IC del 95%: 1,13 a 2,40; cuatro estudios, 1585 lactantes).
No hubo diferencias claras entre los grupos en la cesárea (CR 0,91; IC del 95%: 0,78 a 1,07; 1728 mujeres, cuatro estudios, pruebas de calidad moderada), ni en la duración de la estancia hospitalaria de la madre después del parto (diferencia de medias [DM] ‐0,16 días; IC del 95%: ‐0,46 a 0,15; dos estudios, 925 mujeres, pruebas de calidad moderada) ni del recién nacido (DM ‐0,20 días; IC del 95%: ‐0,57 a 0,17; un estudio, 756 lactantes, pruebas de calidad moderada).
Dos ensayos grandes bien diseñados y con riesgo general de sesgo bajo contribuyeron con la mayoría de las pruebas. Otros estudios presentaban un riesgo de sesgo bajo o incierto. Ningún estudio intentó realizar el cegamiento de las participantes ni de los médicos a la asignación a los grupos, lo que potencialmente introdujo sesgo ya que las pacientes y el personal habrían estado al tanto de la intervención y pudiera haber afectado aspectos de la atención y la toma de decisiones.
El nivel de las pruebas se consideró alto (mortalidad y morbilidad materna compuestas), moderado (cesárea, duración de la estancia hospitalaria de la madre después del parto y duración de la estancia hospitalaria del recién nacido después del parto) o bajo (mortalidad y morbilidad infantil compuestas). Cuando la calidad de las pruebas se disminuyó se debió principalmente a que los intervalos de confianza fueron amplios y cruzaron la línea de ningún efecto y de efectos beneficiosos o perjudiciales significativos.
Conclusiones de los autores
En las pacientes que presentan trastornos hipertensivos del embarazo después de las 34 semanas, el parto temprano planificado se asocia con menos morbilidad y mortalidad materna compuestas. No hay diferencias claras en el resultado compuesto de mortalidad infantil y morbilidad grave; sin embargo, este resultado se basa en datos limitados (de dos ensayos) que evaluaron todos los trastornos hipertensivos como un grupo.
Se necesitan estudios adicionales para considerar los diferentes tipos de enfermedades hipertensivas y el momento óptimo del parto en estas afecciones. Estos estudios también deben incluir resultados de morbilidad y mortalidad infantil y materna, cesárea, duración de la estancia hospitalaria de la madre después del parto y duración de la estancia hospitalaria del recién nacido después del parto.
Un metanálisis de pacientes individuales con los datos actualmente disponibles proporcionaría mayor información sobre los resultados de diferentes tipos de enfermedades hipertensivas encontradas en el embarazo.
PICO
Resumen en términos sencillos
¿Si la madre presenta hipertensión que no es persistentemente grave después de las 34 semanas de embarazo es más seguro el parto inmediato o esperar?
¿Cuál es el problema?
Las embarazadas que presentan niveles elevados de presión arterial (hipertensión) durante el embarazo o que desarrollan preeclampsia (hipertensión con proteína en la orina u otra afectación de sistemas de órganos, o ambas) pueden desarrollar complicaciones graves. Las posibles complicaciones de la madre son el empeoramiento de la preeclampsia, el desarrollo de crisis convulsivas y eclampsia, el síndrome HELLP (hemólisis, enzimas hepáticas elevadas y recuento plaquetario bajo), el desprendimiento de la placenta, la insuficiencia hepática, la insuficiencia renal y la dificultad para respirar debido al líquido en los pulmones.
Generalmente el parto impide que los niveles elevados de presión arterial de la madre empeoren, pero el feto que nace prematuramente puede tener otros problemas de salud como dificultad para respirar, porque los pulmones todavía están inmaduros. La inducción del trabajo de parto puede provocar la sobrestimulación de las contracciones y el sufrimiento fetal. La opción es esperar el parto con una vigilancia estrecha de la madre y el feto.
¿Por qué es esto importante?
Como hay efectos beneficiosos y riesgos del parto temprano planificado en comparación con la espera cuando la madre presenta niveles elevados de presión arterial al final del embarazo, se desea conocer cuál es la opción más segura. Se buscaron los ensayos clínicos que compararon el parto temprano planificado, mediante inducción del trabajo de parto o por cesárea, con una política de parto retardado.
¿Qué pruebas se encontraron?
Se buscaron pruebas el 12 de enero de 2016 y se encontraron cinco estudios aleatorios con 1819 pacientes. Dos fueron estudios grandes de alta calidad en pacientes con hipertensión gestacional, preeclampsia leve o hipertensión existente en deterioro a las 34 a 37 semanas (704 mujeres), o con hipertensión gestacional o preeclampsia leve a las 36 a 41 semanas (756 mujeres). Menos mujeres que tuvieron un parto temprano planificado presentaron resultados adversos graves (1459 mujeres, pruebas de alta calidad ). No hubo información suficiente para establecer conclusiones acerca de los efectos sobre el número de recién nacidos que nacieron con una salud deficiente, con un nivel alto de variabilidad entre los dos estudios (1459 lactantes, pruebas de baja calidad ). No hubo diferencias claras entre el parto temprano planificado y el parto retardado en el número de cesáreas (cuatro estudios, 1728 mujeres, pruebas de calidad moderada), ni en la duración de la estancia hospitalaria de la madre después del parto (dos estudios, 925 mujeres, pruebas de calidad moderada) (o del recién nacido [un estudio, 756 lactantes, pruebas de calidad moderada]). Más recién nacidos del grupo de parto temprano presentaron problemas respiratorios (síndrome de dificultad respiratoria, tres estudios, 1511 lactantes) o ingresaron a la unidad neonatal (cuatro estudios, 1585 lactantes). Menos pacientes del grupo de parto temprano desarrollaron síndrome HELLP (tres estudios, 1628 mujeres) o problemas renales graves (un estudio, 100 mujeres).
Dos estudios compararon pacientes a las que se les indujo el trabajo de parto a las 34 a 36 semanas y a las 34 a 37 semanas con un grupo de comparación que se vigiló hasta las 37 semanas, cuando se inició la inducción si el trabajo de parto no había comenzado espontáneamente. Tres estudios compararon la inducción del trabajo de parto al término o más cerca del término, a las 37 semanas completas y a las 36 a 41 semanas, con pacientes que se vigilaron hasta las 41 semanas cuando se inició la inducción si el trabajo de parto no había comenzado espontáneamente. Otros criterios de inclusión y exclusión también difirieron entre los cinco estudios.
Ningún estudio intentó cegar a las pacientes ni a los médicos con respecto al grupo en el que se incluyeron. Las pacientes y el personal estaban al tanto de la intervención, lo que puede haber afectado aspectos de la atención y la toma de decisiones. La mayoría de las pruebas fueron de calidad moderada, de manera que es posible tener una seguridad moderada acerca de los resultados.
¿Qué quiere decir esto?
En general, si la paciente tuviera el parto inmediatamente después de las 34 semanas, hubiera menos riesgo de una complicación de la madre y ninguna diferencia clara en la tasa general de complicaciones del recién nacido, pero la información fue limitada.
Estos resultados son aplicables a la práctica obstétrica general donde los trastornos hipertensivos durante el embarazo se consideran juntos. Se necesitan estudios adicionales para considerar los diferentes tipos de trastornos hipertensivos de manera individual.
Authors' conclusions
Summary of findings
| Planned early delivery versus expectant management for hypertensive disorders from 34 weeks' gestation to term | ||||||
| Patient or population: pregnant women with hypertensive disorders from 34 weeks' gestation to term | ||||||
| Outcomes | Anticipated absolute effects* (95% CI) | Relative effect | № of participants | Quality of the evidence | Comments | |
| Risk with placebo | Risk with GRADE | |||||
| Composite maternal mortality and morbidity | Study population | RR 0.69 | 1459 | ⊕⊕⊕⊕ | ||
| 242 per 1000 | 167 per 1000 | |||||
| Moderate | ||||||
| 235 per 1000 | 162 per 1000 | |||||
| Composite infant mortality and morbidity | not pooled | 1459 | This outcome was not pooled, due to substantial statistical heterogeneity (I2 = 87%, Tau2 = 0.98) | |||
| Caesarean section | Study population | RR 0.91 | 1728 | ⊕⊕⊕⊝ | ||
| 267 per 1000 | 243 per 1000 | |||||
| Moderate | ||||||
| 302 per 1000 | 275 per 1000 | |||||
| Duration of hospital stay after delivery for mother (days) | The mean duration of hospital stay after delivery for mother (days) was 0 | The mean duration of hospital stay after delivery for mother (days) in the intervention group was 0.16 fewer (0.46 fewer to 0.15 more) | ‐ | 925 | ⊕⊕⊕⊝ | |
| Duration of hospital stay after delivery for baby (days) | The mean duration of hospital stay after delivery for baby (days) was 0 | The mean duration of hospital stay after delivery for baby (days) in the intervention group was 0.2 days fewer (0.57 fewer to 0.17 more) | ‐ | 756 | ⊕⊕⊕⊝ | |
| *The risk in the intervention group (and its 95% confidence interval) is based on the assumed risk in the comparison group and the relative effect of the intervention (and its 95% CI). | ||||||
| GRADE Working Group grades of evidence | ||||||
| 1Wide confidence interval crossing the line of no effect. | ||||||
Background
Description of the condition
Hypertensive disorders in pregnancy are significant contributors to maternal and perinatal morbidity and mortality in low‐, middle‐ and high‐income countries (Khan 2006). They occur in up to 10% of all pregnancies (Dolea 2003; Saftlas 1990; Steegers 2010) and in up to 11% of first pregnancies (Villar 2003). There is wide variation in the incidence between different countries, and regional differences may exist (Abalos 2013). This may be explained by differences in maternal age distribution, the proportion of primiparous women among the populations (Hutcheon 2011), and dietary differences such as low‐calcium intake (Belizan 1980) and genetic characteristics.
There are a number of classification systems for the hypertensive disorders of pregnancy. The most recent classification system that has been published is from the International Society for the Study of Hypertensive Disorders in Pregnancy (ISSHP) (Magee 2014). Other commonly‐used classification systems are the National Institute for Health and Clinical Excellence (NICE) classification system (NICE 2010), which is currently under review, and the American College of Obstetricians and Gyneologists classification of Hypertensive disorders in pregnancy (ACOG Hypertension in Pregnancy 2013).
The ISSHP classification
Hypertension in pregnancy: office or in‐hospital systolic blood pressure (BP) greater than or equal to 140 mmHg and/or a diastolic blood pressure greater than or equal to 90 mmHg on the average of at least two measurements, taken at least 15 minutes apart, using the same arm.
Severe hypertension: systolic blood pressure greater than or equal to 160 mmHg or a diastolic blood pressure greater than or equal to 110 mmHg on the average of at least two measurements, taken at least 15 minutes apart, using the same arm.
Pre‐existing (chronic) hypertension: hypertension that predates the pregnancy or appears before 20 weeks' gestation.
Gestational hypertension: hypertension that appears at or after 20 weeks of gestation.
Pre‐eclampsia: gestational hypertension and new proteinuria or one or more adverse conditions or one or more serious complications (see Table 3 for definitions of adverse conditions and serious complications).
In this classification an adverse condition consists of maternal symptoms, signs, abnormal laboratory results and abnormal fetal monitoring that may herald the development of severe maternal or fetal complications and significant proteinuria is a value greater than or equal to 0.3 g/d in a complete 24‐hour urine collection or a spot (random) urine sample with greater than or equal to 30 mg/mmol urinary creatinine.
Severe pre‐eclampsia: pre‐eclampsia associated with a severe complication that warrants delivery regardless of gestational age.
NICE classification
Pre‐existing/chronic hypertension: hypertension defined as a systolic blood pressure above 140 mmHg or diastolic blood pressure above 90 mmHg prior to pregnancy or hypertension presenting in the first 20 weeks of pregnancy, (on at least two occasions) or hypertension persisting until at least 12 weeks postpartum or if the woman is already taking antihypertensive medication when referred to maternity services. It can be primary (essential hypertension) or secondary (to various medical conditions) in aetiology.
Gestational hypertension: elevated blood pressure (systolic blood pressure above 140 mmHg and diastolic blood pressure above 90 mmHg measured on two occasions at least four hours apart) in previously normotensive pregnant women presenting after 20 weeks of pregnancy without proteinuria.
Severe gestational hypertension: elevated systolic blood pressure of more than 160 mmHg and/or diastolic blood pressure of more than 110 mmHg at least four hours apart.
The diagnosis of gestational hypertension is temporary and becomes pre‐eclampsia if proteinuria develops, or chronic hypertension if blood pressure is still elevated at 12 weeks postpartum, or transient hypertension of pregnancy if the blood pressure is normal at 12 weeks postpartum (Magloire 2012). About 15% to 25% of women with gestational hypertension will develop pre‐eclampsia (Davis 2007). This may increase up to 46% the earlier the diagnosis of gestational hypertension is made (Barton 2001).
Pre‐eclampsia: hypertension (systolic blood pressure above 140 mmHg and diastolic blood pressure above 90 mmHg) measured on two occasions at least four hours apart presenting after 20 weeks with significant proteinuria (urinary protein: creatinine ratio greater than 30 mg/mmol or more than 0.3 g in a validated 24‐hour urine specimen).
Severe pre‐eclampsia: pre‐eclampsia with severe hypertension (systolic blood pressure above 160 mmHg and/or diastolic blood pressure above 110 mmHg) or other signs/symptoms such as symptoms of central nervous system dysfunction, liver capsule distension, liver impairment, thrombocytopenia (decrease in the number of platelets), severe proteinuria of more than 3 g in 24 hours or 3+ on dipstick, renal impairment, oliguria (less than 500 mL in 24 hours), pulmonary oedema, intrauterine growth restriction or reduced liquor volume (Duley 2009).
Pre‐eclampsia superimposed on pre‐existing hypertension: new onset of proteinuria after 20 weeks of pregnancy in a woman with pre‐existing hypertension. In cases where proteinuria is present in early pregnancy, pre‐eclampsia is defined as worsening of hypertension or development of symptoms/signs of severe pre‐eclampsia (August 2012).
Complications of hypertensive disorders during pregnancy are associated with worsening of pre‐eclampsia, development of eclampsia, HELLP syndrome (haemolysis, elevated liver enzymes and low platelet count), placental abruption, liver failure, renal failure, pulmonary oedema, and maternal death (Sibai 2005).
ACOG Hypertension in Pregnancy Classification
Pre‐eclampsia: Blood pressure greater than or equal to 140 mmHG systolic or greater than or equal to 90 mmHg diastolic on two occasions at least 4 hours apart after 20 weeks of gestation in a woman with a previously normal blood pressure OR a blood pressure greater than or equal to 160 mmHg systolic or greater than or equal to 110 mm Hg diastolic, confirmed within a short interval to facilitate timely antihypertensive therapy with proteinuria, defined as greater than or equal to 300 mg per 24‐hour urine collection or a protein/creatinine ratio greater than or equal to 0.3 mg/dL or a dipstick reading of 1+ if other quantitative methods are not available or in the absence of proteinuria, new onset hypertension with thrombocytopaenia, renal insufficiency, impaired liver function, pulmonary oedema or cerebral or visual symptoms.
Chronic hypertension: High blood pressure known to predate conception or detected before 20 weeks of gestation.
Chronic hypertension with superimposed pre‐eclampsia: Include the following scenarios:
1. Women with hypertension only in early gestation who develop proteinuria after 20 weeks of gestation.
2. Women with hypertension and proteinuria before 20 weeks who develop a sudden exacerbation of hypertension, suddenly manifest other signs and symptoms such as an increase in liver enzymes, present with thrombocytopaenia, manifest with symptoms of right upper quadrant pain and severe headaches, develop pulmonary oedema or congestion, develop renal insufficiency or have sudden substantial sustained increases in protein excretion.
Gestational hypertension: New onset hypertension after 20 weeks gestation in the absence of accompanying proteinuria.
Description of the intervention
The definitive treatment of hypertensive disorders related to pregnancy is planned early delivery. The alternative is to manage the pregnancy expectantly with close maternal and fetal monitoring. The generic Cochrane protocols on interventions for preventing (Meher 2005) and treating (Duley 2009) pre‐eclampsia and its consequences cite various Cochrane Reviews covering this subject. The World Health Organization (WHO) guidelines on prevention and treatment of pre‐eclampsia and eclampsia provide a summary of available evidence on various interventions (WHO 2011). There are currently no data from randomised controlled trials on interventions to monitor women with hypertensive disorders of pregnancy.
The general approach on management involves frequent blood pressure measurement, frequent assessment of maternal symptoms (headache, blurred vision, epigastric or abdominal pain, vaginal bleeding, decrease in fetal movements), urine analysis for protein with urine dipstick or ratio of protein to creatinine, and blood tests to assess renal and liver function, platelets and haemoglobin depending on the severity of the condition. For pre‐eclampsia bloods are taken at least twice weekly if the maternal condition is stable or more frequently if there is any suspicion of clinical deterioration. For chronic hypertension and gestational hypertension, bloods are not routinely taken. Fetal monitoring is done by assessing fetal movements felt by the mother, fetal heart rate monitoring and fetal ultrasound (amniotic fluid measurement, fetal growth, and Doppler velocimetry in the umbilical artery, middle cerebral artery and ductus venosus) (Norwitz 2013).
Indications for delivery of women being managed expectantly would include deterioration of blood pressure control despite antihypertensive treatment, new onset maternal symptoms which include severe headache, blurred vision, epigastric or abdominal pain, vaginal bleeding and a decrease in fetal movements, deterioration in blood tests and a change in fetal condition.
Bed rest (Meher 2005), dietary salt restriction (Meher 2005), vitamin D supplementation (De Regil 2011), vitamin C and E supplementation, and thiazide diuretics are not recommended for prevention of pre‐eclampsia (WHO 2011). Calcium supplementation is recommended in areas with low dietary calcium intake (Hofmeyr 2014). Low‐dose aspirin, started before 16 weeks, is recommended for the prevention of pre‐eclampsia in women who have risk factors for pre‐eclampsia (Bujold 2014). Based on expert opinion, severe hypertension during pregnancy should be treated with antihypertensive drugs and the choice of the drug is left to the clinician managing the woman (WHO 2011).
The timing of delivery is based on the severity of the maternal condition, gestational age and fetal condition. The indications for planned early delivery (or contraindications for expectant management) include: instability of maternal condition; persistent severe hypertension unresponsive to medical therapy; persistent progressive or severe headache; visual disturbances; eclampsia; cerebrovascular events; posterior reversible encephalopathy syndrome (PRES); epigastric or abdominal pain; left ventricular failure; pulmonary oedema; severe renal impairment with a creatinine level greater than or equal to 125 μmol/l; the need for dialysis or renal failure; abruptio placenta; non‐reassuring fetal testing (non‐reassuring fetal heart rate tracing, estimated fetal weight less than fifth centile, oligohydramnios, persistent absent or reversed end‐diastolic flow in umbilical artery Doppler); fetal demise; laboratory abnormalities (liver transaminases greater than or equal to 500 IU/L, progressive decrease in platelet count to less than 100 × 109/L, coagulopathy with an INR greater than 2 in the absence of an alternative cause); preterm labour; preterm premature rupture of membranes; HELLP syndrome (Norwitz 2013).
The potential implications for the mother and fetus of expectant management are weighed against the possible complications of an earlier delivery.
Traditionally, the management of hypertensive disorders in pregnancy at or near term (from 34 weeks onwards) has been a planned early delivery by induction of labour or caesarean section. Currently, there is a tendency in high‐income countries to continue with expectant management in the absence of severe pre‐eclampsia past 34 0/7 gestational weeks. Canadian guidelines recommend planned early delivery after 37 0/7 weeks in case of pre‐eclampsia and expectant management before 34 0/7 weeks. In case of non‐severe pre‐eclampsia there is insufficient evidence to recommend planned early delivery between 34 0/7 to 36 6/7 weeks (Magee 2008).
Based on a recent literature review by Spong 2011, planned early delivery is recommended:
-
at 38 to 39 weeks for women with chronic hypertension on no medications;
-
at 37 to 39 weeks for women with chronic hypertension controlled on medications;
-
at 36 to 37 weeks for women with chronic hypertension difficult to control;
-
at 37 to 38 weeks for women with gestational hypertension;
-
at diagnosis for women with severe pre‐eclampsia (at or after 34 weeks);
-
at 37 weeks for women with mild pre‐eclampsia.
How the intervention might work
Planned early delivery by induction of labour or indicated caesarean section is thought to have the following benefits:
-
prevention of severe maternal complications in women with hypertensive disorders in pregnancy;
-
prevention of poor fetal outcomes and stillbirth.
Potential risks of planned early delivery by induction of labour are:
-
increased risk of complications associated with induction of labour such as uterine hyperstimulation and fetal distress;
Potential risks of planned early delivery by induction of labour or caesarean section are:
-
concerns related to prematurity. Although the adverse outcomes due to prematurity are uncommon after 34 0/7 weeks of gestation, several recent reports have highlighted increased rates of neonatal morbidity related to respiratory distress syndrome, need for ventilation and neonatal intensive care admission when elective caesarean sections were performed before 39 0/7 weeks of gestation (Maslow 2000; Tita 2009; Wilmink 2010). Infants born between 37 0/7 and 38 6/7 weeks have greater neonatal morbidity during the first year of life in comparison with infants born between 39 0/7 and 41 0/7 weeks (Dietz 2012). Near‐term infants have significantly more health problems and increased healthcare costs compared with full‐term infants in the first year of life and later on (Boyle 2012; Wang 2004).
The intervention being investigated is timing of delivery. Prolonging gestation may be better for the fetus but it may increase the risks of complications for the mother.
Why it is important to do this review
There are benefits and risks associated with both policies (planned early delivery and expectant management) in women with hypertensive disorders of pregnancy. It is therefore important to establish the safest option associated with more favourable maternal and neonatal outcomes in such cases.
Management of severe pre‐eclampsia before term is dealt with in another Cochrane Review comparing interventionist and expectant care (Churchill 2013).
Objectives
To assess the benefits and risks of a policy of planned early delivery versus a policy of expectant management in pregnant women with hypertensive disorders, at or near term (from 34 weeks onwards).
Methods
Criteria for considering studies for this review
Types of studies
We included adequately randomised controlled trials comparing planned early delivery (induction of labour or caesarean section) with expectant management of women with hypertensive disorders from 34 weeks' gestation to term. We would have included cluster‐randomised trials but we found none. Studies using a quasi‐randomised design are not eligible for inclusion in this review. Similarly, studies using a cross‐over design are not eligible for inclusion, because they are not a suitable study design for investigating hypertensive disorders in pregnancy.
Types of participants
Women with hypertensive disorders at 34 weeks 0 days of gestation or longer.
Types of interventions
Comparison of a policy of planned early delivery (by induction of labour or by caesarean section) with a policy of delayed delivery (expectant management).
Types of outcome measures
Primary outcomes
-
Composite maternal outcome, including maternal mortality (death during pregnancy or up to 42 days after delivery) and severe morbidity (eclampsia; cerebral vascular event; pulmonary oedema as defined by trial authors; severe renal impairment, defined as a creatinine level greater than 125 μmol/l or a need for dialysis or urine output less than 0.5 mL/kg/hour for four hours unresponsive to hydration with two intravenous boluses, or as defined by trial authors; liver haematoma or rupture; liver failure, defined as the rapid impairment of synthetic function and development of encephalopathy or as defined by trial authors; haemolysis elevated liver enzymes and low platelets (HELLP) syndrome; disseminated intravascular coagulation (DIC); thromboembolic disease; and abruptio placentae, defined as a retroplacental clot of more than 15% of the maternal surface or as defined by trial authors).
-
Composite perinatal outcome, including fetal or neonatal death (within six weeks after the expected due date or as defined by trial authors); grade III or IV intraventricular or intracerebral haemorrhage; necrotising enterocolitis (NEC); acute respiratory distress syndrome (ARDS) or grade III/IV hyaline membrane disease; small‐for‐gestational age (growth below the 10th centile or as defined by trial authors); and neonatal seizures.
Secondary outcomes
Maternal
-
Maternal mortality as described above
-
Eclampsia
-
Cerebrovascular event
-
Pulmonary oedema as defined above
-
Severe renal impairment as defined above
-
Liver haematoma or rupture*
-
Liver failure as defined above
-
HELLP syndrome
-
DIC
-
Thromboembolic disease
-
Abruptio placentae
-
Antepartum haemorrhage
-
Postpartum haemorrhage (blood loss of more than 500 mL or more within 24 hours of delivery)
-
Severe hypertension (systolic blood pressure greater than or equal to 160 mmHg or a diastolic blood pressure greater than 110 mmHg)
-
Caesarean section
-
Assisted delivery (ventouse/forceps)
-
Maternal morbidity of caesarean section (wound infection, wound dehiscence, endometritis, postpartum haemorrhage (blood loss greater than 500 mL), urinary or bowel problems, venous thrombosis)
-
Maternal morbidity related to induction of labour (uterine hyperstimulation, uterine rupture, hyponatraemia, hypotension, chorioamnionitis, cord prolapse, failed induction)
-
Admission to a high care or intensive care unit*
-
Women's experiences and views on the interventions: pregnancy and childbirth experience, physical and psychological trauma, mother‐infant interaction and attachment
Fetal and neonatal
-
Fetal death
-
Neonatal death as defined above
-
Grade III or IV intraventricular or intracerebral haemorrhage
-
NEC
-
ARDS or grade III/IV hyaline membrane disease
-
Small‐for‐gestational age as defined by trial authors
-
Neonatal seizures
-
Apgar score less than seven at five minutes
-
Cord blood pH less than 7.1 or as defined by trial authors
-
Surfactant use*
-
Neonatal intensive care unit or high care unit admission*
-
Intubation and mechanical ventilation or continuous positive airway pressure support
-
Early neonatal sepsis*
Use of health‐service resources
-
Duration of hospital stay after delivery for mother
-
Duration of hospital stay after delivery for baby
Economic outcomes
-
Costs to health service resources: short‐term and long‐term for both mother and baby
-
Costs to the woman, her family, and society
* denotes that outcome was not specified in this review's protocol and was added at the review stage.
Search methods for identification of studies
The following Methods section of this review is based on a standard template used by Cochrane Pregnancy and Childbirth.
Electronic searches
We searched Cochrane Pregnancy and Childbirth’s Trials Register by contacting their Information Specialist (1 January 2016).
The Register is a database containing over 22,000 reports of controlled trials in the field of pregnancy and childbirth. For full search methods used to populate Pregnancy and Childbirth’s Trials Register including the detailed search strategies for CENTRAL, MEDLINE, Embase and CINAHL; the list of handsearched journals and conference proceedings, and the list of journals reviewed via the current awareness service, please follow this link to the editorial information about the Cochrane Pregnancy and Childbirth in the Cochrane Library and select the ‘Specialized Register ’ section from the options on the left side of the screen.
Briefly, Cochrane Pregnancy and Childbirth’s Trials Register is maintained by their Information Specialist and contains trials identified from:
-
monthly searches of the Cochrane Central Register of Controlled Trials (CENTRAL);
-
weekly searches of MEDLINE (Ovid);
-
weekly searches of Embase (Ovid);
-
monthly searches of CINAHL (EBSCO);
-
handsearches of 30 journals and the proceedings of major conferences;
-
weekly current awareness alerts for a further 44 journals plus monthly BioMed Central email alerts.
Search results are screened by two people and the full text of all relevant trial reports identified through the searching activities described above is reviewed. Based on the intervention described, each trial report is assigned a number that corresponds to a specific Pregnancy and Childbirth review topic (or topics), and is then added to the Register. The Information Specialist searches the Register for each review using this topic number rather than keywords. This results in a more specific search set which has been fully accounted for in the relevant review sections (Included studies; Excluded studies; Ongoing studies).
Searching other resources
We searched the reference lists of retrieved studies.
We did not apply any language or date restrictions.
Data collection and analysis
The following Methods section of this review is based on a standard template used by Cochrane Pregnancy and Childbirth.
Selection of studies
Two review authors independently assessed all the potential studies we identified as a result of the search strategy. We resolved any disagreement through discussion and did not need to consult a third person.
We included one study published in abstract only, as it was assessed as eligible (Majeed 2014).
Data extraction and management
We designed a form to extract data. For eligible studies, two review authors extracted the data using the agreed form. We resolved discrepancies through discussion and did not need to consult a third person. We entered data into Review Manager 5 software (RevMan 2014) and checked them for accuracy.
When information regarding any of the above was unclear, we attempted to contact authors of the original reports to provide further details.
Assessment of risk of bias in included studies
Two review authors independently assessed risks of bias for each study using the criteria outlined in the Cochrane Handbook for Systematic Reviews of Interventions (Higgins 2011). We resolved any disagreement by discussion and did not need to involve a third assessor.
(1) Random sequence generation (checking for possible selection bias)
We described for each included study the method used to generate the allocation sequence in sufficient detail to allow an assessment of whether it should produce comparable groups.
We assessed the method as:
-
low risk of bias (any truly random process, e.g. random number table; computer random number generator);
-
high risk of bias (any non‐random process, e.g. odd or even date of birth; hospital or clinic record number);
-
unclear risk of bias.
(2) Allocation concealment (checking for possible selection bias)
We described for each included study the method used to conceal allocation to interventions prior to assignment and assessed whether intervention allocation could have been foreseen in advance of or during recruitment, or changed after assignment.
We assessed the methods as:
-
low risk of bias (e.g. telephone or central randomisation; consecutively‐numbered sealed opaque envelopes);
-
high risk of bias (open random allocation; unsealed or non‐opaque envelopes; alternation; date of birth);
-
unclear risk of bias.
(3.1) Blinding of participants and personnel (checking for possible performance bias)
We described for each included study the methods used, if any, to blind study participants and personnel from knowledge of which intervention a participant received. We considered that studies are at low risk of bias if they were blinded, or we judged that the lack of blinding would be unlikely to affect results. We assessed blinding separately for different outcomes or classes of outcomes.
We assessed the methods as:
-
low, high or unclear risk of bias for participants;
-
low, high or unclear risk of bias for personnel.
(3.2) Blinding of outcome assessment (checking for possible detection bias)
We described for each included study the methods used, if any, to blind outcome assessors from knowledge of which intervention a participant received. We assessed blinding separately for different outcomes or classes of outcomes.
We assessed methods used to blind outcome assessment as:
-
low, high or unclear risk of bias.
(4) Incomplete outcome data (checking for possible attrition bias due to the amount, nature and handling of incomplete outcome data)
We described for each included study, and for each outcome or class of outcomes, the completeness of data including attrition and exclusions from the analysis. We stated whether attrition and exclusions were reported and the numbers included in the analysis at each stage (compared with the total randomised participants), reasons for attrition or exclusion where reported, and whether missing data were balanced across groups or were related to outcomes. Where sufficient information was reported, or could be supplied by the trial authors, we re‐included missing data in the analyses which we undertook.
We assessed methods as:
-
low risk of bias (e.g. no missing outcome data; missing outcome data balanced across groups and are unlikely to influence the outcome; missing data have been imputed using appropriate methods);
-
high risk of bias (e.g. numbers or reasons for missing data imbalanced across groups; ‘as treated’ analysis done with substantial departure of intervention received from that assigned at randomisation);
-
unclear risk of bias.
(5) Selective reporting (checking for reporting bias)
We described for each included study how we investigated the possibility of selective outcome reporting bias and what we found.
We assessed the methods as:
-
low risk of bias (where it is clear that all of the study’s prespecified outcomes and all expected outcomes of interest to the review have been reported);
-
high risk of bias (where not all the study’s prespecified outcomes have been reported; one or more reported primary outcomes were not prespecified; outcomes of interest are reported incompletely and so cannot be used; study fails to include results of a key outcome that would have been expected to have been reported);
-
unclear risk of bias.
(6) Other bias (checking for bias due to problems not covered by (1) to (5) above)
We described for each included study any important concerns we have about other possible sources of bias.
We assessed whether each study was free of other problems that could put it at risk of bias:
-
low risk of other bias;
-
high risk of other bias;
-
unclear whether there is risk of other bias.
(7) Overall risk of bias
We made explicit judgements about whether studies were at high risk of bias, according to the criteria given in the Cochrane Handbook (Higgins 2011). With reference to (1) to (6) above, we assessed the likely magnitude and direction of the bias and whether we considered it was likely to impact on the findings. We explored the impact of the level of bias through undertaking sensitivity analyses ‐ seeSensitivity analysis.
Assessment of the quality of the evidence using the GRADE approach
We assessed the quality of the evidence using the GRADE approach, as outlined in the GRADE Handbook in order to assess the quality of the body of evidence relating to the following outcomes for the main comparison (Planned early delivery versus expectant management (all women)):
-
Composite maternal outcome including maternal mortality (death during pregnancy or up to 42 days after delivery) and severe morbidity (eclampsia; cerebral vascular event; pulmonary oedema, as defined by trial authors; severe renal impairment, defined as a creatinine level greater than 125 μmol/l or a need for dialysis or urine output less than 0.5 mL/kg/hour for four hours unresponsive to hydration with two intravenous boluses, or as defined by trial authors; liver haematoma or rupture; liver failure, defined as the rapid impairment of synthetic function and development of encephalopathy or as defined by trial authors; haemolysis elevated liver enzymes and low platelets (HELLP) syndrome; disseminated intravascular coagulation (DIC); thromboembolic disease; and abruptio placentae, defined as a retroplacental clot of more than 15% of the maternal surface or as defined by trial authors).
-
Composite perinatal outcome including fetal or neonatal death (within six weeks after the expected due date or as defined by trial authors); grade III or IV intraventricular or intracerebral haemorrhage; necrotizing enterocolitis (NEC); acute respiratory distress syndrome (ARDS) or grade III/IV hyaline membrane disease; small‐for‐gestational age (growth below the 10th centile or as defined by trial authors); and neonatal seizures.
-
Caesarean section.
-
Duration of hospital stay for mother after delivery.
-
Duration of hospital stay for fetus after delivery.
GRADEpro Guideline Development Tool was used to import data from Review Manager 5 (RevMan 2014) in order to create ’Summary of findings’ tables. We produced a summary of the intervention effect and a measure of quality for each of the above outcomes, using the GRADE approach. The GRADE approach uses five considerations (study limitations, consistency of effect, imprecision, indirectness and publication bias) to assess the quality of the body of evidence for each outcome. The evidence can be downgraded from 'high quality' by one level for serious (or by two levels for very serious) limitations, depending on assessments for risk of bias, indirectness of evidence, serious inconsistency, imprecision of effect estimates or potential publication bias.
Measures of treatment effect
Dichotomous data
For dichotomous data, we present results as a summary risk ratio (RR) with a 95% confidence interval (CI).
Continuous data
For continuous data, we used the mean difference if outcomes were measured in the same way between trials. We used the standardised mean difference to combine trials that measure the same outcome, but using different methods.
Unit of analysis issues
Cluster‐randomised trials
We did not identify any cluster‐randomised trials in the analyses. If we had, we would have followed Chapter 16.3 of Cochrane Handbook for Systematic Reviews of Interventions (Higgins 2011) to perform analysis of cluster‐randomised trials. We would have calculated the intra‐cluster correlation coefficient (ICC) and design effect. We would have multiplied the standard error of the effect estimate (from analysis ignoring clustering) by the square root of the design effect. We would have performed meta‐analysis using the inflate variances and the generic inverse‐variance method (Chapter 16.3.6 Higgins 2011).
Cross‐over trials
Cross‐over trials are inappropriate for this intervention.
Multi‐armed trials
We did not identify any multi‐armed trials. If we had, we would have combined all relevant experimental intervention groups of the study into a single group and all relevant control intervention groups into a single control group when we analysed the data. If we had considered one of the arms irrelevant, we would have excluded it from analysis.
Dealing with missing data
For included studies, we noted levels of attrition. We did not need to explore the impact of including studies with high levels of missing data in the overall assessment of treatment effect by using sensitivity analysis.
For all outcomes, we carried out analyses, as far as possible, on an intention‐to‐treat basis, i.e. we attempted to include all participants randomised to each group in the analyses, and analysed all participants in the group to which they were allocated, regardless of whether or not they received the allocated intervention. The denominator for each outcome in each trial was the number randomised minus any participants whose outcomes are known to be missing.
Assessment of heterogeneity
We assessed statistical heterogeneity in each meta‐analysis using the T2, I2 and Chi2 statistics. We regarded heterogeneity as substantial if an I2 was greater than 30% and either a T2 was greater than zero, or there was a low P value (less than 0.10) in the Chi2 test for heterogeneity.
Assessment of reporting biases
There were fewer than 10 studies in the meta‐analysis. In future updates of this review, if there are 10 or more studies in a meta‐analysis, we will investigate reporting biases (such as publication bias) using funnel plots. We will assess funnel plot asymmetry visually. If asymmetry is suggested by a visual assessment, we will perform exploratory analyses to investigate it.
Data synthesis
We carried out statistical analysis using the Review Manager 5 software (RevMan 2014). We used a fixed‐effect meta‐analysis for combining data where it is reasonable to assume that studies are estimating the same underlying treatment effect, i.e. where trials are examining the same intervention, and the trials’ populations and methods are judged sufficiently similar. If there was clinical heterogeneity sufficient to expect that the underlying treatment effects differ between trials, or if we detected substantial statistical heterogeneity, we would have used a random‐effects meta‐analysis to produce an overall summary, if an average treatment effect across trials was considered clinically meaningful. We would have treated the random‐effects summary as the average range of possible treatment effects and we would have discussed the clinical implications of treatment effects differing between trials. If the average treatment effect was not clinically meaningful, we would not combine trials.
Where we use random‐effects analyses, we present the results as the average treatment effect with its 95% confidence interval, and the estimates of T2 and I2.
Subgroup analysis and investigation of heterogeneity
If we had identified substantial heterogeneity, we would have investigated it using subgroup analyses and sensitivity analyses. We would have considered whether an overall summary is meaningful, and if it was, we would have used random‐effects analysis to produce it.
We carried out the following subgroup analyses:
-
Women at 34 weeks 0 days to 36 weeks 6 days of gestation versus 37 weeks 0 days to 38 weeks 6 days versus more then 39 weeks of gestation.
-
Each gestational week.
-
Women with pre‐eclampsia only versus women with gestational hypertension (mild, not severe) only or pre‐existing hypertension only.
We used the following primary outcomes in subgroup analysis.
-
composite maternal
-
composite perinatal outcome
Broekhuijsen 2015 has not yet published the composite outcomes by gestational age, so we also carried out subgroup analysis using the outcome respiratory distress syndrome.
We assessed subgroup differences by interaction tests available within RevMan (RevMan 2014). We reported the results of subgroup analyses quoting the Chi2 statistic and P value, and the interaction test I2 value.
Sensitivity analysis
We did not need to perform sensitivity analysis for primary outcomes, as we did not identify substantial heterogeneity in the included studies.
It was not indicated to perform sensitivity analyses for aspects of the review that might affect the results; for example, where there is a risk of bias associated with the quality of some of the included trials; or to explore the effects of fixed‐effect or random‐effects analyses for outcomes with statistical heterogeneity; and to explore the effects of any assumptions made, such as the value of the ICC used for cluster‐randomised trials.
We would have used the following outcomes in sensitivity analyses.
-
Composite maternal outcome.
-
Composite perinatal outcome.
Results
Description of studies
Results of the search
The search of Cochrane Pregnancy and Childbirth's Register retrieved 24 trial reports, and we found one additional report through other sources. These reports corresponded to eight studies. Five of these studies (22 reports) fulfilled the eligibility criteria for the review (Broekhuijsen 2015; Hamed 2014; Koopmans 2009; Majeed 2014; Owens 2014). Two studies (two reports) were excluded (Ramrakhyani 2001; Tukur 2007), and one study (Shennan 2013) is ongoing and will be eligible for inclusion when it is complete (See:Figure 1).

Study flow diagram.
Included studies
We included five studies (involving 1819 women) in this review (Broekhuijsen 2015; Hamed 2014; Koopmans 2009; Majeed 2014; Owens 2014). SeeCharacteristics of included studies.
Design
All five of the included studies were two‐arm randomised controlled trials, comparing planned early delivery with expectant management for hypertensive disorders from 34 weeks to term.
Sample sizes
Two of the studies were large multicentre trials (Broekhuijsen 2015; Koopmans 2009), which recruited 704 and 756 women respectively. Hamed 2014 recruited 76 women at two hospitals. Two studies took place in a single centre, recruiting 100 women (Majeed 2014), and 183 women (Owens 2014).
Setting
The two large multicentre trials were conducted in the Netherlands (Broekhuijsen 2015; Koopmans 2009). Three smaller studies were carried out in India (Majeed 2014), USA (Owens 2014), and Saudi Arabia and Egypt (Hamed 2014).
Participants
The gestational age ranges of women eligible for the studies were 36 to 41 weeks (Koopmans 2009), 36 to 40 weeks (Majeed 2014), 34 to 37 weeks (Broekhuijsen 2015; Owens 2014), and 24 to 36 weeks (Hamed 2014).
The type of hypertensive disorder included varied between studies: Koopmans 2009 and Majeed 2014 included pregnant women with gestational hypertension or mild pre‐eclampsia, Owens 2014 included women with mild pre‐eclampsia only, Broekhuijsen 2015 recruited women with gestational hypertension, mild pre‐eclampsia or deteriorating chronic hypertension. Hamed 2014 was the only trial to concentrate on women with chronic hypertension (mild to moderate, without proteinuria, diagnosed before 20 weeks' gestation or if the woman was known to be hypertensive before pregnancy). Women were not eligible to participate in this study if they had gestational hypertension or new onset of pre‐eclampsia where previously normotensive, in contrast to Owens 2014 and Koopmans 2009 where only women who had newly identified hypertension could participate.
Of the studies that included women with pre‐eclampsia, they all excluded women with severe pre‐eclampsia. Broekhuijsen 2015 and Koopmans 2009 excluded women who had a diastolic blood pressure ≥ 110 mmHg despite medication, a systolic blood pressure ≥ 170 mmHg despite medication, proteinuria ≥ 5 g per 24 hours, eclampsia, HELLP syndrome, pulmonary oedema or cyanosis, oliguria less than 500 mL in 24 hours, renal disease, heart disease, and severe pre‐eclamptic complaints such as frontal headache or ruptured membranes. Majeed 2014 excluded women if the systolic blood pressure was above 160 mmHg, if the diastolic blood pressure was above 110 mmHg or if there was more than 5 g proteinuria per 24‐hour collection. Owens 2014 excluded all that did not have mild pre‐eclampsia.
Studies had different inclusion and exclusion criteria for participants, some concerning factors that may be related to, or result from, hypertensive disorders. For example, multiple pregnancies, pre‐existing diabetes, and suspected intrauterine growth restriction. Broekhuijsen 2015 had the most inclusive eligibility criteria, potentially meaning that the population of women recruited to this study were more representative of women with hypertensive disorders. Multiple pregnancies were excluded from Hamed 2014, Koopmans 2009 and Owens 2014, but not excluded in Broekhuijsen 2015. In this study, 44 participants out of 703 had multifetal gestations (18 out of 352 randomised to planned early delivery, 26 out of 351 randomised to expectant monitoring), and the infant outcomes were deemed present if at least one neonate was affected. Women with diabetes mellitus were excluded from Hamed 2014, Koopmans 2009 and Owens 2014, but not excluded from Broekhuijsen 2015. Women who had a previous caesarean section were excluded from Hamed 2014 and Koopmans 2009, but not excluded from Broekhuijsen 2015. Babies with suspected intrauterine growth restriction or small‐for‐gestational age were excluded from Koopmans 2009 and Owens 2014, but were not excluded from Broekhuijsen 2015. Women taking antihypertensive medication were excluded from Owens 2014, excluded if the medication was intravenous in Koopmans 2009, and eligible to participate in Broekhuijsen 2015. Majeed 2014 did not describe the exclusion criteria or detailed inclusion criteria.
Interventions
Two studies compared an intervention group who had labour induced before term: at 34 to 36 weeks' gestation (Broekhuijsen 2015) and at 34 to 37 weeks (Owens 2014), with a comparison group who were monitored until 37 weeks' gestation when induction began, if labour had not started spontaneously. Three studies compared induction of labour at term or closer to term: at 37 completed weeks (Hamed 2014) and at 36 to 41 weeks (Koopmans 2009; Majeed 2014) in the intervention group, with a comparison group who were monitored until 41 weeks when induction began, if labour had not started spontaneously.
In the intervention groups, infants were delivered by induction of labour, or by caesarean section if necessary. Three studies placed a time limit on this intervention, within 12 hours (Owens 2014) or 24 hours (Broekhuijsen 2015; Koopmans 2009) of randomisation.
Labour was induced and augmented with amniotomy and oxytocin (Broekhuijsen 2015; Hamed 2014; Koopmans 2009). If necessary cervical ripening was stimulated with intracervical or intravaginal prostaglandins or a balloon catheter (Broekhuijsen 2015; Koopmans 2009) or with vaginal misoprostol (Hamed 2014).
Women in the expectant management group were monitored as outpatients (Hamed 2014), inpatients (Owens 2014), or in an inpatient or outpatient setting depending on their condition (Broekhuijsen 2015; Koopmans 2009). Monitoring consisted of measuring maternal blood pressure and screening of urine for protein (Broekhuijsen 2015; Hamed 2014; Koopmans 2009), looking for signs of disease progression with severe features of pre‐eclampsia (Owens 2014), mother's assessment of fetal movements and electronic fetal heart rate monitoring (Broekhuijsen 2015; Koopmans 2009), non‐stress testing (Owens 2014), and ultrasound examination (Koopmans 2009). Majeed 2014 did not provide information on the nature of the monitoring.
Outcomes
The two largest trials (Broekhuijsen 2015; Koopmans 2009) reported the composite outcome for maternal mortality and morbidity, and a composite outcome for perinatal mortality and morbidity, defined as the primary outcomes in this review. In addition, these trials reported maternal and infant mortality and morbidity outcomes individually. Maternal mortality was not reported by the other three trials (Hamed 2014; Majeed 2014; Owens 2014), and two trials did not report perinatal mortality (Majeed 2014; Owens 2014).
All studies reported on disease progression, for example, the development of severe hypertension, defined in a variety of ways (Hamed 2014; Koopmans 2009; Owens 2014), eclampsia (Broekhuijsen 2015; Koopmans 2009), HELLP syndrome (Broekhuijsen 2015; Koopmans 2009; Owens 2014), and acute renal failure (Majeed 2014). Adverse infant outcomes were reported for all trials except Majeed 2014. These include possible consequences of early delivery for the infants, such as respiratory distress syndrome (Broekhuijsen 2015; Koopmans 2009; Owens 2014), and neonatal intensive care unit admission (Broekhuijsen 2015; Hamed 2014; Koopmans 2009; Owens 2014).
Majeed 2014 was presented as a poster abstract, and the data were therefore limited. We contacted the authors for additional information, but have not received a reply. The most comprehensive reporting of outcomes was by Broekhuijsen 2015 and Koopmans 2009, with both trials presented across multiple published reports.
Funding sources
Two studies (Broekhuijsen 2015; Koopmans 2009) were funded by ZonMw, the Netherlands Organisation for Health Research and Development. Hamed 2014 and Owens 2014 were both funded through their affiliated universities: Qassim University and the University of Mississippi Medical Centre, respectively. As Majeed 2014 was presented as a poster abstract, with limited information given, it is not clear who provided funding for this study.
Declarations of interest
None of the study authors declared any conflicts of interest. This was not mentioned in Majeed 2014.
Excluded studies
We excluded two studies (two reports); one because it was not a randomised controlled trial, with group allocation based on gestational age at presentation (Ramrakhyani 2001), and the other compared two methods of planned early delivery: caesarean section and induction with vaginal misoprostol (Tukur 2007). See Characteristics of excluded studies.
Ongoing studies
We found one ongoing study (Shennan 2013). This trial compares planned early delivery with monitoring until induction at 37 weeks' gestation, for pregnant women with pre‐eclampsia between 34 and 37 weeks of gestation. According to the protocol, recruitment started in April 2014, and it was anticipated that it will take approximately three years to recruit 900 women. See Characteristics of ongoing studies.
Risk of bias in included studies
Assessment of the methodological quality of the included studies was based on risk of bias in relation to selection bias (method of randomisation and allocation concealment), performance bias, detection bias, attrition bias (loss of participants from the analyses) and reporting bias. A summary of 'Risk of bias' assessments for each study, and for included trials overall, are set out in Figure 2 and Figure 3.

Risk of bias graph: review authors' judgements about each risk of bias item presented as percentages across all included studies.

Risk of bias summary: review authors' judgements about each risk of bias item for each included study.
Allocation
Generation of the randomisation sequence
Three studies reported using a computerised or web‐based random‐number generator to generate the randomisation sequence, which we judged were at low risk of bias (Broekhuijsen 2015; Hamed 2014; Koopmans 2009). We judged the remaining two studies to be at unclear risk of bias: Owens 2014 described using stratified and random permuted blocks of two but did not describe how the randomisation sequence was generated, and Majeed 2014 did not mention the method for determining the randomisation sequence.
Allocation concealment
In two of the studies, the method for concealing group allocation at the point of randomisation was not clear (Hamed 2014; Majeed 2014). Three studies were at low risk of bias: Owens 2014 concealed allocation in sealed envelopes, and the web‐based central allocation of Broekhuijsen 2015 and Koopmans 2009 concealed their allocation.
Blinding
The blinding of women and health professionals was not possible for this intervention. This may have had an effect on other treatment decisions. All included studies have consequently been assessed as high risk of bias due to lack of blinding.
Incomplete outcome data
We considered the risk of bias to be low in Broekhuijsen 2015, Hamed 2014 and Koopmans 2009, as all women were accounted for and there was little or no attrition. The number of women allocated to each group was not reported by Majeed 2014, so we judged the risk of bias to be unclear as we cannot assess whether data for all women are reported. There was some attrition from Owens 2014, and the data were not presented as intention‐to‐treat, so we considered that the risk of bias is also unclear for this trial.
Selective reporting
Protocols were available for Broekhuijsen 2015, Koopmans 2009 and Owens 2014. All prespecified outcomes were reported for these trials, so we judged these to be at a low risk of reporting bias. Reporting appeared to be good in Hamed 2014, however no protocol was available to assess whether all prespecified outcomes were reported, so risk of bias was unclear. Majeed 2014 was assessed from a poster‐presentation abstract, which only reported significant findings, and was therefore at high risk of bias.
Other potential sources of bias
Owens 2014 was stopped early due to a change in hospital policy, at 74% of the enrolment target, leaving the study underpowered to demonstrate statistically significant differences, with unclear implications for the risk of other bias. The baseline characteristics of women assigned to the planned delivery and expectant monitoring groups appear to be similar in all studies, so there is low risk of other potential sources of bias for Broekhuijsen 2015, Hamed 2014, Koopmans 2009, and Majeed 2014.
Effects of interventions
Planned early delivery versus expectant management
See summary of findings Table for the main comparison. We included five studies, involving 1819 women.
Primary outcomes
Two studies reported thecomposite maternal outcome, including maternal mortality and severe morbidity (Broekhuijsen 2015; Koopmans 2009). There was a lower risk of these severe adverse outcomes for women randomised to planned early delivery (risk ratio (RR) 0.69, 95% confidence interval (CI) 0.57 to 0.83, two studies, 1459 women, evidence graded high, Analysis 1.1). There were no clear differences between groups based on our subgroup analysis by gestational age, gestational week or condition (see Analysis 2.1; Analysis 3.1; Analysis 4.1).
The same two studies also reported the composite perinatal outcome (including fetal or neonatal death and serious morbidity). There was not enough information to draw any conclusions about the effects on neonatal mortality and serious morbidity. Meta‐analysis was not possible, due to substantial heterogeneity (I2 = 87%, Tau2 = 0.98) for this outcome between these two studies (1459 infants, Analysis 1.2). It is worth noting that Broekhuijsen 2015 found that infants in the planned early delivery group had a higher risk of respiratory distress syndrome than those in the expectant management group (RR 3.32, 95% CI 1.35 to 8.18, 703 infants, Analysis 2.2) with planned early delivery taking place at 34 to 37 weeks' gestation. However Koopmans 2009 showed no evidence of differences in composite infant mortality and morbidity (RR 0.77, 95% CI 0.46 to 1.28, 756 infants, Analysis 2.3) with planned early delivery taking place later, at 36 to 41 weeks' gestation. There were no clear differences between groups based on our subgroup analysis by gestational age or gestational week (see Analysis 2.3; Analysis 3.2; Analysis 3.3). However Broekhuijsen 2015 have not yet published the composite outcomes by gestational age, so any possible adverse effects on infants born at the earliest gestations have not yet been explored.
Secondary outcomes
Maternal
There were no incidences of maternal mortality in the two studies that reported it (1457 women, Analysis 1.3). We found no clear differences between delivery and expectant management for the number of women experiencing eclampsia (RR 0.20, 95% CI 0.01 to 4.14, 1459 women, two studies, Analysis 1.4). There were no events reported for pulmonary oedema (703 women, one study, Analysis 1.5). Women who were assigned planned early delivery had a lower risk of severe renal impairment (RR 0.36, 95% CI 0.14 to 0.92, 100 women, one study, Analysis 1.6), and HELLP syndrome (RR 0.40, 95% CI 0.17 to 0.93, 1628 women, three studies, Analysis 1.7) than women assigned to expectant management. We found no clear differences between planned early delivery and expectant management for the number of women experiencing thromboembolic disease (RR 1.67, 95% CI 0.22 to 12.58, 1459 women, two studies, Analysis 1.8), abruptio placentae (RR 0.64, 95% CI 0.17 to 2.34, 1535 women, three studies, Analysis 1.9), or postpartum haemorrhage (RR 0.88, 95% CI 0.57 to 1.35, 741 women, one study, Analysis 1.10).
There was high heterogeneity between studies for women developing severe hypertension (I2 = 79%, Tau2 = 0.83). There was not enough information to draw any conclusions about the effects on severe hypertension (995 women, three studies, Analysis 1.11). Two studies (919 women) reporting this outcome found that planned early delivery was less likely to result in the progression to severe hypertension, while one study (74 women) found no difference. The study that found no difference had recruited pregnant women with chronic hypertension (Hamed 2014), while the women in the other two studies had mild pre‐eclampsia (Owens 2014), gestational hypertension or mild pre‐eclampsia (Koopmans 2009).
We found no clear differences between planned early delivery and expectant management for caesarean section (RR 0.91, 95% CI 0.78 to 1.07, 1728 women, four studies, evidence graded moderate,Analysis 1.12), assisted delivery (ventouse/forceps) (RR 0.93, 95% CI 0.70 to 1.24, 1459 women, two studies, Analysis 1.13), or endometritis (maternal morbidity of caesarean section) (RR 0.75, 95% CI 0.17 to 3.35, 756 women, one study, Analysis 1.14). There were no events reported for uterine rupture (maternal morbidity related to induction of labour) (756 women, one study, Analysis 1.15). We found no clear differences between planned early delivery and expectant management for maternal admission to a high care or intensive care unit (RR 0.41, 95% CI 0.16 to 1.07, 708 women, one study, Analysis 1.16).
Women's experiences and views on the interventions were not reported in any of the included studies. However, Koopmans 2009 assessed women's health‐related quality of life after planned early delivery or expectant management. They administered the Short‐Form (SF‐36), European Quality of Life (EuroQoL 6D3L), Hospital Anxiety and Depression Scale (HADS), and Symptom Checklist (SCL‐90). Measurements were at baseline, six weeks postpartum and six months postpartum. They found no clear difference in these measures of health‐related quality of life. (The numeric results are not presented in this review, because the outcomes do not correspond to those prespecified in the protocol. However, as these are important issues we have included this narrative summary of the results).
Several of the outcomes for this review were not reported by trial authors: cerebrovascular event, liver haematoma or rupture, liver failure as defined above, dissemination intravascular coagulation, and antepartum haemorrhage.
Fetal and neonatal
One study reportedfetal death, with no events (756 infants, Analysis 1.17). There were very few events, and therefore not enough information to see if there was a difference in neonatal death (RR 2.00, 95% CI 0.19 to 21.14, 1535 infants, three studies, Analysis 1.18) and grade III or IV intraventricular or intracerebral haemorrhage (RR 6.92, 95% CI 0.36 to 133.41, 674 infants, one study, Analysis 1.19). We found no clear difference in the numbers of infants with nectrotising enterocolitis (RR 0.98, 95% CI 0.14 to 6.89, 1338 infants, two studies, Analysis 1.20). Babies allocated to planned early delivery had a higher risk of acute respiratory distress syndrome or grade III/IV hyaline membrane disease (RR 2.24, 95% CI 1.20 to 4.18, 1511 infants, three studies, Analysis 1.21). There was no clear difference between groups assigned to planned early delivery or expectant monitoring for small‐for‐gestational age as defined by trial authors (RR 1.58, 95% CI 0.89 to 2.79, 1001 infants, three studies, Analysis 1.22), neonatal seizures (RR 3.97, 95% CI 0.45 to 35.30, 699 infants, one study, Analysis 1.23), Apgar score less than seven at five minutes (RR 1.11, 95% CI 0.60 to 2.05, 1454 infants, two studies, Analysis 1.24), and cord blood pH less than 7.1 or as defined by trial authors (RR 0.58, 95% CI 0.31 to 1.09, 1145 infants, two studies, Analysis 1.25). In the one study that reported surfactant use, no infants required it (639 infants, Analysis 1.26). Babies in the group allocated to planned early delivery were more likely to be admitted to neonatal intensive care unit or high care unit than those allocated to expectant management (RR 1.65, 95% CI 1.13 to 2.40, 1585 infants, four studies, Analysis 1.27). Intubation and mechanical ventilation or continuous positive airway pressure support was not reported in any of the included studies. There was a substantial difference in the incidence of early neonatal sepsis between the two studies that reported it, so results have not been pooled (1455 infants, two studies, Analysis 1.28).
Use of health‐service resources
There was no clear difference in the duration of hospital stay after delivery for mother (mean difference (MD) ‐0.16 days, 95% CI ‐0.46 to 0.15; 925 women, two studies, evidence graded moderate,Analysis 1.29), and no clear difference in the duration of hospital stay after delivery for baby (MD ‐0.20 days, 95% CI ‐0.57 to 0.17, 756 infants, one study, evidence graded moderate,Analysis 1.30).
Economic outcomes
The costs to health service resources: short‐term and long‐term for both mother and baby and costs to the woman, her family, and society were not reported in the included studies.
Discussion
Summary of main results
We included five studies involving 1819 women, comparing planned early delivery versus expectant management for hypertensive disorders from 34 weeks to term.
Fewer women who had hypertensive disorders of pregnancy experienced severe adverse outcomes (composite maternal mortality and severe morbidity) when they were allocated to planned early delivery. Planned early delivery was also associated with lower levels of HELLP syndrome and severe renal impairment. There was no clear difference in any of the other maternal outcomes reported by the included studies.
There was not enough information to draw any conclusions about the effects on neonatal mortality and severe morbidity, as there were limited data assessing all hypertensive disorders as one group. Planned early delivery was associated with higher levels of respiratory distress syndrome, and NICU admission. There was no clear difference for other infant outcomes reported by the included studies.
No difference was shown between planned early delivery and expectant management in the proportion of women needing a caesarean section, and in the duration of hospital stay after delivery for mother or baby.
Overall completeness and applicability of evidence
The studies included in this review addressed the objective, which was to determine the risks and benefits of expectant management versus planned early delivery for the hypertensive disorders of pregnancy after 34 weeks gestation. The management of pre‐eclampsia diagnosed before 34 weeks is described in another Cochrane Review (Churchill 2013). The majority of women included in this review had mild pre‐eclampsia and gestational hypertension, with fewer women having chronic hypertension. Most of the women included came from the Netherlands, with smaller numbers from India, USA and Saudi Arabia, making the review globally applicable. The results are applicable to general obstetric practice when the hypertensive disorders of pregnancy are considered together, but an individual patient meta‐analysis may provide more answers as it would allow for more statistical power when reviewing the different types of hypertensive disorders in pregnancy.
Quality of the evidence
Two fairly large, well‐designed trials contributed the majority of the evidence to this review (Broekhuijsen 2015; Koopmans 2009). Due to the nature of the intervention, no studies attempted to blind participants or clinicians to group allocation. We did not downgrade studies for this; however, women and staff would have been aware of the intervention and this may have affected aspects of care and decision‐making, for example, whether to carry out a caesarean section.
We graded the level of evidence as high (composite maternal mortality and morbidity), moderate (caesarean section, duration of hospital stay after delivery for mother, and duration of hospital stay after delivery for baby), or low (composite infant mortality and morbidity) (see summary of findings Table for the main comparison). Where the evidence was downgraded, it was mostly because the CIs were wide, crossing both the line of no effect and appreciable benefit or harm.
Potential biases in the review process
The assessment of risk of bias involves subjective judgements. This potential limitation is minimised by following the procedures in the Cochrane Handbook for Systematic Reviews of Interventions (Higgins 2011), with review authors independently assessing studies and resolving any disagreement through discussion, and if required involving a third assessor in the decision.
Agreements and disagreements with other studies or reviews
The findings of this review show that planned early delivery for hypertensive disorders of pregnancy are associated with less severe maternal adverse outcomes. This analysis looks at all the hypertensive diseases, namely chronic hypertension, gestational hypertension and mild pre‐eclampsia as one group. The National Institute for Health and Clinical Excellence guidelines on hypertension in pregnancy: diagnosis and management (NICE 2010), the American College of Obstetricians and the Society for Maternal‐Fetal Medicine and Gynecologists Committee opinion number 560 on medically indicated late‐preterm and early term deliveries (ACOG No. 560 2013) and the Society of Obstetric Medicine of Australia and New Zealand guideline for the management of hypertensive disorders of pregnancy (Lowe 2014) set different gestational ages for delivery based on the hypertensive condition.

Study flow diagram.

Risk of bias graph: review authors' judgements about each risk of bias item presented as percentages across all included studies.

Risk of bias summary: review authors' judgements about each risk of bias item for each included study.
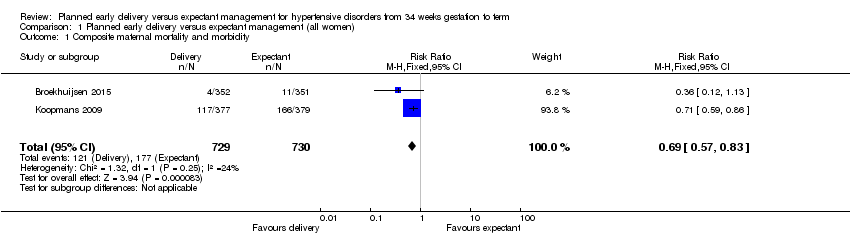
Comparison 1 Planned early delivery versus expectant management (all women), Outcome 1 Composite maternal mortality and morbidity.

Comparison 1 Planned early delivery versus expectant management (all women), Outcome 2 Composite infant mortality and morbidity.

Comparison 1 Planned early delivery versus expectant management (all women), Outcome 3 Maternal mortality.

Comparison 1 Planned early delivery versus expectant management (all women), Outcome 4 Eclampsia.

Comparison 1 Planned early delivery versus expectant management (all women), Outcome 5 Pulmonary oedema.
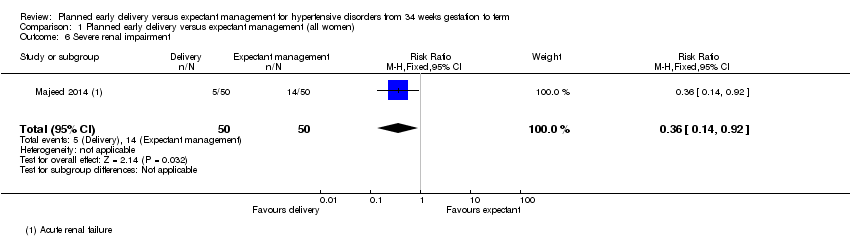
Comparison 1 Planned early delivery versus expectant management (all women), Outcome 6 Severe renal impairment.

Comparison 1 Planned early delivery versus expectant management (all women), Outcome 7 HELLP syndrome.
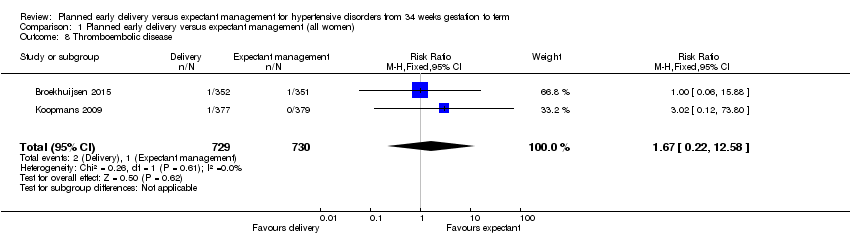
Comparison 1 Planned early delivery versus expectant management (all women), Outcome 8 Thromboembolic disease.

Comparison 1 Planned early delivery versus expectant management (all women), Outcome 9 Abruptio placentae.

Comparison 1 Planned early delivery versus expectant management (all women), Outcome 10 Postpartum haemorrhage.

Comparison 1 Planned early delivery versus expectant management (all women), Outcome 11 Severe hypertension.

Comparison 1 Planned early delivery versus expectant management (all women), Outcome 12 Caesarean section.

Comparison 1 Planned early delivery versus expectant management (all women), Outcome 13 Assisted delivery (ventouse/forceps).

Comparison 1 Planned early delivery versus expectant management (all women), Outcome 14 Maternal morbidity of caesarean section.

Comparison 1 Planned early delivery versus expectant management (all women), Outcome 15 Maternal morbidity related to induction of labour.

Comparison 1 Planned early delivery versus expectant management (all women), Outcome 16 Admission to a high care or intensive care unit.

Comparison 1 Planned early delivery versus expectant management (all women), Outcome 17 Fetal death.

Comparison 1 Planned early delivery versus expectant management (all women), Outcome 18 Neonatal death.

Comparison 1 Planned early delivery versus expectant management (all women), Outcome 19 Grade III or IV intraventricular or intracerebral haemorrhage.

Comparison 1 Planned early delivery versus expectant management (all women), Outcome 20 Nectrotising enterocolitis.

Comparison 1 Planned early delivery versus expectant management (all women), Outcome 21 Respiratory distress syndrome.

Comparison 1 Planned early delivery versus expectant management (all women), Outcome 22 Small‐for‐gestational age.

Comparison 1 Planned early delivery versus expectant management (all women), Outcome 23 Neonatal seizures.

Comparison 1 Planned early delivery versus expectant management (all women), Outcome 24 Apgar score less than seven at five minutes.

Comparison 1 Planned early delivery versus expectant management (all women), Outcome 25 Cord blood pH less than 7.1 or as defined by trial authors.

Comparison 1 Planned early delivery versus expectant management (all women), Outcome 26 Surfactant use.

Comparison 1 Planned early delivery versus expectant management (all women), Outcome 27 Neonatal intensive care unit or high care unit admission.
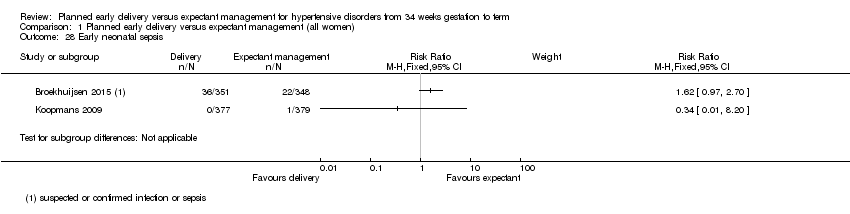
Comparison 1 Planned early delivery versus expectant management (all women), Outcome 28 Early neonatal sepsis.

Comparison 1 Planned early delivery versus expectant management (all women), Outcome 29 Duration of hospital stay after delivery for mother (days).

Comparison 1 Planned early delivery versus expectant management (all women), Outcome 30 Duration of hospital stay after delivery for baby (days).

Comparison 2 Planned early delivery versus expectant management (by gestational age), Outcome 1 Composite maternal mortality and morbidity.

Comparison 2 Planned early delivery versus expectant management (by gestational age), Outcome 2 Respiratory distress syndrome.

Comparison 2 Planned early delivery versus expectant management (by gestational age), Outcome 3 Composite infant mortality and morbidity.

Comparison 3 Planned early delivery versus expectant management (by each gestational week), Outcome 1 Composite maternal mortality and morbidity.

Comparison 3 Planned early delivery versus expectant management (by each gestational week), Outcome 2 Respiratory distress syndrome.

Comparison 3 Planned early delivery versus expectant management (by each gestational week), Outcome 3 Composite infant mortality and morbidity.
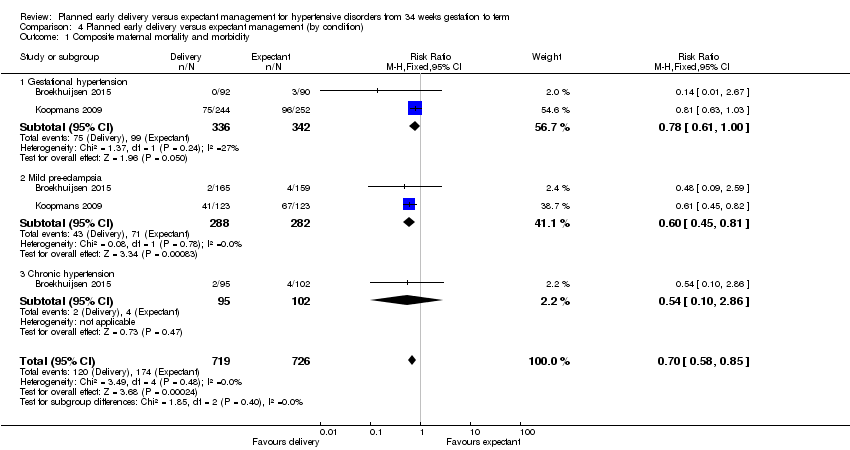
Comparison 4 Planned early delivery versus expectant management (by condition), Outcome 1 Composite maternal mortality and morbidity.

Comparison 4 Planned early delivery versus expectant management (by condition), Outcome 2 Respiratory distress syndrome.
| Planned early delivery versus expectant management for hypertensive disorders from 34 weeks' gestation to term | ||||||
| Patient or population: pregnant women with hypertensive disorders from 34 weeks' gestation to term | ||||||
| Outcomes | Anticipated absolute effects* (95% CI) | Relative effect | № of participants | Quality of the evidence | Comments | |
| Risk with placebo | Risk with GRADE | |||||
| Composite maternal mortality and morbidity | Study population | RR 0.69 | 1459 | ⊕⊕⊕⊕ | ||
| 242 per 1000 | 167 per 1000 | |||||
| Moderate | ||||||
| 235 per 1000 | 162 per 1000 | |||||
| Composite infant mortality and morbidity | not pooled | 1459 | This outcome was not pooled, due to substantial statistical heterogeneity (I2 = 87%, Tau2 = 0.98) | |||
| Caesarean section | Study population | RR 0.91 | 1728 | ⊕⊕⊕⊝ | ||
| 267 per 1000 | 243 per 1000 | |||||
| Moderate | ||||||
| 302 per 1000 | 275 per 1000 | |||||
| Duration of hospital stay after delivery for mother (days) | The mean duration of hospital stay after delivery for mother (days) was 0 | The mean duration of hospital stay after delivery for mother (days) in the intervention group was 0.16 fewer (0.46 fewer to 0.15 more) | ‐ | 925 | ⊕⊕⊕⊝ | |
| Duration of hospital stay after delivery for baby (days) | The mean duration of hospital stay after delivery for baby (days) was 0 | The mean duration of hospital stay after delivery for baby (days) in the intervention group was 0.2 days fewer (0.57 fewer to 0.17 more) | ‐ | 756 | ⊕⊕⊕⊝ | |
| *The risk in the intervention group (and its 95% confidence interval) is based on the assumed risk in the comparison group and the relative effect of the intervention (and its 95% CI). | ||||||
| GRADE Working Group grades of evidence | ||||||
| 1Wide confidence interval crossing the line of no effect. | ||||||
| Outcome or subgroup title | No. of studies | No. of participants | Statistical method | Effect size |
| 1 Composite maternal mortality and morbidity Show forest plot | 2 | 1459 | Risk Ratio (M‐H, Fixed, 95% CI) | 0.69 [0.57, 0.83] |
| 2 Composite infant mortality and morbidity Show forest plot | 2 | Risk Ratio (M‐H, Random, 95% CI) | Subtotals only | |
| 3 Maternal mortality Show forest plot | 2 | 1457 | Risk Ratio (M‐H, Fixed, 95% CI) | 0.0 [0.0, 0.0] |
| 4 Eclampsia Show forest plot | 2 | 1459 | Risk Ratio (M‐H, Fixed, 95% CI) | 0.20 [0.01, 4.14] |
| 5 Pulmonary oedema Show forest plot | 2 | 1459 | Risk Ratio (M‐H, Fixed, 95% CI) | 0.20 [0.01, 4.17] |
| 6 Severe renal impairment Show forest plot | 1 | 100 | Risk Ratio (M‐H, Fixed, 95% CI) | 0.36 [0.14, 0.92] |
| 7 HELLP syndrome Show forest plot | 3 | 1628 | Risk Ratio (M‐H, Fixed, 95% CI) | 0.40 [0.17, 0.93] |
| 8 Thromboembolic disease Show forest plot | 2 | 1459 | Risk Ratio (M‐H, Fixed, 95% CI) | 1.67 [0.22, 12.58] |
| 9 Abruptio placentae Show forest plot | 3 | 1535 | Risk Ratio (M‐H, Fixed, 95% CI) | 0.64 [0.17, 2.34] |
| 10 Postpartum haemorrhage Show forest plot | 1 | 741 | Risk Ratio (M‐H, Fixed, 95% CI) | 0.88 [0.57, 1.35] |
| 11 Severe hypertension Show forest plot | 3 | Risk Ratio (M‐H, Random, 95% CI) | Subtotals only | |
| 12 Caesarean section Show forest plot | 4 | 1728 | Risk Ratio (M‐H, Fixed, 95% CI) | 0.91 [0.78, 1.07] |
| 13 Assisted delivery (ventouse/forceps) Show forest plot | 2 | 1459 | Risk Ratio (M‐H, Fixed, 95% CI) | 0.93 [0.70, 1.24] |
| 14 Maternal morbidity of caesarean section Show forest plot | 1 | 756 | Risk Ratio (M‐H, Fixed, 95% CI) | 0.75 [0.17, 3.35] |
| 14.1 Endometritis | 1 | 756 | Risk Ratio (M‐H, Fixed, 95% CI) | 0.75 [0.17, 3.35] |
| 15 Maternal morbidity related to induction of labour Show forest plot | 1 | 756 | Risk Ratio (M‐H, Fixed, 95% CI) | 0.0 [0.0, 0.0] |
| 15.1 Uterine rupture | 1 | 756 | Risk Ratio (M‐H, Fixed, 95% CI) | 0.0 [0.0, 0.0] |
| 16 Admission to a high care or intensive care unit Show forest plot | 1 | 708 | Risk Ratio (M‐H, Fixed, 95% CI) | 0.41 [0.16, 1.07] |
| 17 Fetal death Show forest plot | 1 | 756 | Risk Ratio (M‐H, Fixed, 95% CI) | 0.0 [0.0, 0.0] |
| 18 Neonatal death Show forest plot | 3 | 1535 | Risk Ratio (M‐H, Fixed, 95% CI) | 2.0 [0.19, 21.14] |
| 19 Grade III or IV intraventricular or intracerebral haemorrhage Show forest plot | 1 | 674 | Risk Ratio (M‐H, Fixed, 95% CI) | 6.92 [0.36, 133.41] |
| 20 Nectrotising enterocolitis Show forest plot | 2 | 1338 | Risk Ratio (M‐H, Fixed, 95% CI) | 0.98 [0.14, 6.89] |
| 21 Respiratory distress syndrome Show forest plot | 3 | 1511 | Risk Ratio (M‐H, Fixed, 95% CI) | 2.24 [1.20, 4.18] |
| 22 Small‐for‐gestational age Show forest plot | 3 | 1001 | Risk Ratio (M‐H, Fixed, 95% CI) | 1.58 [0.89, 2.79] |
| 23 Neonatal seizures Show forest plot | 1 | 699 | Risk Ratio (M‐H, Fixed, 95% CI) | 3.97 [0.45, 35.30] |
| 24 Apgar score less than seven at five minutes Show forest plot | 2 | 1454 | Risk Ratio (M‐H, Fixed, 95% CI) | 1.11 [0.60, 2.05] |
| 25 Cord blood pH less than 7.1 or as defined by trial authors Show forest plot | 2 | 1145 | Risk Ratio (M‐H, Fixed, 95% CI) | 0.58 [0.31, 1.09] |
| 26 Surfactant use Show forest plot | 1 | 639 | Risk Ratio (M‐H, Fixed, 95% CI) | 0.0 [0.0, 0.0] |
| 27 Neonatal intensive care unit or high care unit admission Show forest plot | 4 | 1585 | Risk Ratio (M‐H, Fixed, 95% CI) | 1.65 [1.13, 2.40] |
| 28 Early neonatal sepsis Show forest plot | 2 | Risk Ratio (M‐H, Fixed, 95% CI) | Subtotals only | |
| 29 Duration of hospital stay after delivery for mother (days) Show forest plot | 2 | 925 | Mean Difference (IV, Fixed, 95% CI) | ‐0.16 [‐0.46, 0.15] |
| 30 Duration of hospital stay after delivery for baby (days) Show forest plot | 1 | 756 | Mean Difference (IV, Fixed, 95% CI) | ‐0.20 [‐0.57, 0.17] |
| Outcome or subgroup title | No. of studies | No. of participants | Statistical method | Effect size |
| 1 Composite maternal mortality and morbidity Show forest plot | 2 | 1459 | Risk Ratio (M‐H, Fixed, 95% CI) | 0.68 [0.57, 0.83] |
| 1.1 34 + 0 to 36 + 6 weeks GA at randomisation | 2 | 778 | Risk Ratio (M‐H, Fixed, 95% CI) | 0.77 [0.48, 1.24] |
| 1.2 37 + 0 to 38 + 6 weeks GA at randomisation | 1 | 380 | Risk Ratio (M‐H, Fixed, 95% CI) | 0.69 [0.53, 0.90] |
| 1.3 39 + 0 to 41 + 0 weeks GA at randomisation | 1 | 301 | Risk Ratio (M‐H, Fixed, 95% CI) | 0.64 [0.47, 0.88] |
| 2 Respiratory distress syndrome Show forest plot | 2 | 1459 | Risk Ratio (M‐H, Fixed, 95% CI) | 2.53 [1.16, 5.55] |
| 2.1 34 + 0 to 36 + 6 weeks GA at randomisation | 2 | 778 | Risk Ratio (M‐H, Fixed, 95% CI) | 3.32 [1.35, 8.18] |
| 2.2 37 + 0 to 38 + 6 weeks GA at randomisation | 1 | 380 | Risk Ratio (M‐H, Fixed, 95% CI) | 0.32 [0.01, 7.72] |
| 2.3 39 + 0 to 41 + 0 weeks GA at randomisation | 1 | 301 | Risk Ratio (M‐H, Fixed, 95% CI) | 1.12 [0.07, 17.74] |
| 3 Composite infant mortality and morbidity Show forest plot | 1 | 756 | Risk Ratio (M‐H, Fixed, 95% CI) | 0.77 [0.46, 1.28] |
| 3.1 36 + 0 to 36 + 6 weeks GA at randomisation | 1 | 75 | Risk Ratio (M‐H, Fixed, 95% CI) | 2.63 [0.29, 24.10] |
| 3.2 37 + 0 to 38 + 6 weeks GA at randomisation | 1 | 380 | Risk Ratio (M‐H, Fixed, 95% CI) | 0.68 [0.31, 1.49] |
| 3.3 39 + 0 to 41 + 0 weeks GA at randomisation | 1 | 301 | Risk Ratio (M‐H, Fixed, 95% CI) | 0.72 [0.35, 1.49] |
| Outcome or subgroup title | No. of studies | No. of participants | Statistical method | Effect size |
| 1 Composite maternal mortality and morbidity Show forest plot | 2 | 1459 | Risk Ratio (M‐H, Fixed, 95% CI) | 0.69 [0.57, 0.83] |
| 1.1 34 + 0 to 34 + 6 weeks GA at randomisation | 1 | 154 | Risk Ratio (M‐H, Fixed, 95% CI) | 4.75 [0.23, 97.34] |
| 1.2 35 + 0 to 35 + 6 weeks GA at randomisation | 1 | 236 | Risk Ratio (M‐H, Fixed, 95% CI) | 0.14 [0.02, 1.10] |
| 1.3 36 + 0 to 36 + 6 weeks GA at randomisation | 2 | 388 | Risk Ratio (M‐H, Fixed, 95% CI) | 0.98 [0.59, 1.62] |
| 1.4 37 + 0 to 37 + 6 weeks GA at randomisation | 1 | 188 | Risk Ratio (M‐H, Fixed, 95% CI) | 0.75 [0.52, 1.08] |
| 1.5 38 + 0 to 38 + 6 weeks GA at randomisation | 1 | 192 | Risk Ratio (M‐H, Fixed, 95% CI) | 0.63 [0.43, 0.94] |
| 1.6 39 + 0 to 39 + 6 weeks GA at randomisation | 1 | 186 | Risk Ratio (M‐H, Fixed, 95% CI) | 0.78 [0.53, 1.14] |
| 1.7 40 + 0 to 41 + 0 weeks GA at randomisation | 1 | 115 | Risk Ratio (M‐H, Fixed, 95% CI) | 0.46 [0.26, 0.79] |
| 2 Respiratory distress syndrome Show forest plot | 1 | 703 | Risk Ratio (M‐H, Fixed, 95% CI) | 3.32 [1.38, 8.01] |
| 2.1 34 + 0 to 34 + 6 weeks GA at randomisation | 1 | 154 | Risk Ratio (M‐H, Fixed, 95% CI) | 2.37 [0.78, 7.24] |
| 2.2 35 + 0 to 35 + 6 weeks GA at randomisation | 1 | 236 | Risk Ratio (M‐H, Fixed, 95% CI) | 7.62 [0.93, 62.27] |
| 2.3 36 + 0 to 36 + 6 weeks GA at randomisation | 1 | 313 | Risk Ratio (M‐H, Fixed, 95% CI) | 3.41 [0.39, 30.15] |
| 3 Composite infant mortality and morbidity Show forest plot | 1 | 756 | Risk Ratio (M‐H, Fixed, 95% CI) | 0.77 [0.46, 1.29] |
| 3.1 36 + 0 to 36 + 6 weeks GA at randomisation | 1 | 75 | Risk Ratio (M‐H, Fixed, 95% CI) | 2.63 [0.29, 24.10] |
| 3.2 37 + 0 to 37 + 6 weeks GA at randomisation | 1 | 188 | Risk Ratio (M‐H, Fixed, 95% CI) | 0.48 [0.17, 1.35] |
| 3.3 38 + 0 to 38 + 6 weeks GA at randomisation | 1 | 192 | Risk Ratio (M‐H, Fixed, 95% CI) | 1.17 [0.33, 4.24] |
| 3.4 39 + 0 to 39 + 6 weeks GA at randomisation | 1 | 186 | Risk Ratio (M‐H, Fixed, 95% CI) | 0.79 [0.32, 1.95] |
| 3.5 40 + 0 to 41 + 0 weeks GA at randomisation | 1 | 115 | Risk Ratio (M‐H, Fixed, 95% CI) | 0.63 [0.19, 2.12] |
| Outcome or subgroup title | No. of studies | No. of participants | Statistical method | Effect size |
| 1 Composite maternal mortality and morbidity Show forest plot | 2 | 1445 | Risk Ratio (M‐H, Fixed, 95% CI) | 0.70 [0.58, 0.85] |
| 1.1 Gestational hypertension | 2 | 678 | Risk Ratio (M‐H, Fixed, 95% CI) | 0.78 [0.61, 1.00] |
| 1.2 Mild pre‐eclampsia | 2 | 570 | Risk Ratio (M‐H, Fixed, 95% CI) | 0.60 [0.45, 0.81] |
| 1.3 Chronic hypertension | 1 | 197 | Risk Ratio (M‐H, Fixed, 95% CI) | 0.54 [0.10, 2.86] |
| 2 Respiratory distress syndrome Show forest plot | 1 | 703 | Risk Ratio (M‐H, Fixed, 95% CI) | 3.36 [1.36, 8.31] |
| 2.1 Gestational hypertension | 1 | 182 | Risk Ratio (M‐H, Fixed, 95% CI) | 3.91 [0.45, 34.34] |
| 2.2 Mild pre‐eclampsia | 1 | 324 | Risk Ratio (M‐H, Fixed, 95% CI) | 4.82 [1.07, 21.65] |
| 2.3 Chronic hypertension | 1 | 197 | Risk Ratio (M‐H, Fixed, 95% CI) | 2.15 [0.55, 8.35] |