Parto temprano programado versus manejo expectante para los trastornos hipertensivos de la semana 34 del embarazo al término
Información
- DOI:
- https://doi.org/10.1002/14651858.CD009273.pub2Copiar DOI

- Base de datos:
-
- Cochrane Database of Systematic Reviews
- Versión publicada:
-
- 15 enero 2017see what's new
- Tipo:
-
- Intervention
- Etapa:
-
- Review
- Grupo Editorial Cochrane:
-
Grupo Cochrane de Embarazo y parto
- Copyright:
-
- Copyright © 2017 The Cochrane Collaboration. Published by John Wiley & Sons, Ltd.
Cifras del artículo
Altmetric:
Citado por:
Autores
Contributions of authors
CC helped develop the protocol, extracted the data, checked data entry, helped write the review and is the guarantor for the review.
NN prepared the original protocol assisted and with the preparation of this review.
CK assisted with the preparation the protocol and review.
HW extracted the data, entered the data and helped write this review.
Sources of support
Internal sources
-
(NN) Walter Sisulu Univeristy, East London Hospital Complex, South Africa.
NN was employed by East London Hospital Complex attached to Walter Sisulu University.
-
(HW) Cochrane Pregnancy and Childbirth Group, Department of Women's and Children's Health, The University of Liverpool, Liverpool, UK.
-
(CC) Stellenbosch University, Cape Town, South Africa.
Cathy Cluver is registered for PhD at Stellenbosch University
External sources
-
NIHR Cochrane Programme Grant Project: 13/89/05 – Pregnancy and childbirth systematic reviews to support clinical guidelines, UK.
-
(CC) Discovery Foundation, South Africa.
CC has been awarded the Discovery Accademic Fellowship
-
(CC) South African Medical Association, South Africa.
CC has been awarded the SAMA Fellowship
Declarations of interest
CK is an author of an included study in this review (Koopmans 2009). All decisions relating to this study (assessment for inclusion/exclusion, risk of bias and data extraction) were carried out by the other members of the review team who are not directly involved in the study.
HW is paid to work on Cochrane reviews by a grant to Cochrane Pregnancy and Childbirth. The views and opinions expressed therein are those of the authors and do not necessarily reflect those of the Systematic Reviews Programme, NIHR, NHS or the Department of Health.
CC: none known.
NN: none known.
Acknowledgements
Denise Atherton for administrative assistance; Lynn Hampson for the literature search.
CC's contribution to this project was supported by the Discovery Foundation and the South African Medical Association.
HW's contribution to this project was supported by the National Institute for Health Research, via Cochrane Programme Grant funding to Cochrane Pregnancy and Childbirth. The views and opinions expressed therein are those of the authors and do not necessarily reflect those of the Systematic Reviews Programme, NIHR, NHS or the Department of Health.
The Cochrane generic protocol on Interventions for preventing pre‐eclampsia and its consequences (Meher 2005) was used in preparation of the protocol for this review.
As part of the pre‐publication editorial process, this review has been commented on by three peers (an editor and two referees who are external to the editorial team) and the Group's Statistical Adviser.
This project was supported by the National Institute for Health research, via Cochrane Infrastructure and Cochrane Programme Grant funding to Cochrane Pregnancy and Childbirth. The views and opinions expressed therein are those of the authors and do not necessarily reflect those of the Systematic Reviews Programme, NIHR, NHS or the Department of Health.
Version history
| Published | Title | Stage | Authors | Version |
| 2017 Jan 15 | Planned early delivery versus expectant management for hypertensive disorders from 34 weeks gestation to term | Review | Catherine Cluver, Natalia Novikova, Corine M Koopmans, Helen M West | |
| 2011 Aug 10 | Delivery versus expectant management for hypertensive disorders from 34 weeks gestation to term | Protocol | Natalia Novikova, Catherine Cluver, Corine M Koopmans | |
Differences between protocol and review
We have edited the review title from 'Delivery versus expectant management for hypertensive disorders from 34 weeks gestation to term' to 'Planned early delivery versus expectant management for hypertensive disorders from 34 weeks gestation to term'.
Our Types of studies and Types of interventions sections have been edited to incorporate 'planned early delivery' as per the modified title.
The methods have been updated to reflect current standard methods text of Cochrane Pregnancy and Childbirth and we have updated some sections of the background.
We have used the GRADEpro Guideline Development Tool to assess the quality of the evidence included in this review. We have also include a summary of findings Table for the main comparison.
Respiratory distress syndrome was analysed by subgroup, in addition to the prespecified composite maternal and infant outcomes, as the composite infant outcomes is not yet available by gestational age for Broekhuijsen 2015.
Changes to outcomes
Changes to maternal outcomes
We have made a number of changes to our protocol outcomes for maternal outcomes.
Primary outcome
The nature of the maternal composite outcome has been further clarified at the review stage:
-
Protocol = Composite maternal outcome including maternal mortality (death during pregnancy or up to 42 days after end of pregnancy) and severe morbidity (eclampsia, stroke, renal or liver failure as defined below), haemolysis, elevated liver enzymes and low platelets syndrome (HELLP), disseminated intravascular coagulation (DIC), pulmonary oedema, thromboembolic disease, cardiac arrest, abruption of the placenta or antepartum haemorrhage).
-
Review = ' Composite maternal outcome including maternal mortality (death during pregnancy or up to 42 days after delivery) and severe morbidity (eclampsia, cerebral vascular event, pulmonary oedema as defined by trial authors, severe renal impairment defined as a creatinine level greater than 125 μmol/l or a need for dialysis or urine output less than 0.5 mL/kg/hour for four hours unresponsive to hydration with two intravenous boluses, or as defined by trial authors, liver haematoma or rupture, liver failure defined as the rapid impairment of synthetic function and development of encephalopathy or as defined by trial authors, haemolysis elevated liver enzymes and low platelets (HELLP) syndrome, disseminated intravascular coagulation (DIC), thromboembolic disease and abruptio placentae defined as a retroplacental clot of more than 15% of the maternal surface or as defined by trial authors.
Secondary outcomes
Our secondary outcomes edited accordingly:
-
'Death as defined above' has been edited to 'Maternal mortality as described above'
-
'Eclampsia (fitting)' has been edited to 'Eclampsia'
-
Stroke (brain damage) has been edited to 'Cerebrovascular event'
-
'Pulmonary oedema (fluid in the lungs)' has been edited to 'Pulmonary oedema'
-
'Kidney failure (defined as rise in serum creatine concentration by > 1 mg/dL over baseline) and/or urine output less than 0.5 mL/kg/hr for two hours unresponsive to hydration with two intravenous boluses of 500 mL fluid), or as defined by trial authors' has been edited to 'Severe renal impairment as defined above'
-
'Liver failure (the rapid impairment of synthetic function and development of encephalopathy) or as defined by trial authors' has been edited to 'Liver failure as defined above'
-
'Abruption of the placenta or antepartum haemorrhage' has been split into two separate outcomes, 'Abruptio placentae' and 'Antepartum haemorrhage'
-
'Postpartum haemorrhage (blood loss 500 mL or more' has been edited to 'Postpartum haemorrhage (blood loss of more than 500 mL within 24 hours of delivery'
The following secondary outcomes have been added at the review stage:
-
'Liver haematoma or rupture'
-
'Admission to a high care or intensive care unit'
Changes to fetal/neonatal outcomes
We have made a number of changes to our protocol outcomes for fetal/neonatal outcomes:
Primary outcome
The nature of the perinatal composite outcome has been further clarified at the review stage:
-
Protocol = Composite perinatal outcome (perinatal death (stillbirth or death in the first seven days of life), small‐for‐gestational age (growth below the third centile or lowest centile reported), acute respiratory distress syndrome (ARDS), necrotising enterocolitis (NEC), cerebral haemorrhage, Apgar score less than seven or very low (less than four) at five minutes, cord blood pH less than 7.1, neonatal seizures, intraventricular haemorrhage)
-
Review = 'Composite perinatal outcome including fetal or neonatal death (within six weeks after the expected due date or as defined by trial authors), grade III or IV intraventricular or intracerebral haemorrhage, necrotising enterocolitis (NEC), acute respiratory distress syndrome (ARDS) or grade III/IV hyaline membrane disease, small‐for‐gestational age (growth below the 10th centile or as defined by trial authors) and neonatal seizures.
Secondary outcomes
Our secondary outcomes edited accordingly:
-
'Stillbirth', 'perinatal death' and 'neonatal death' have been replaced with 'fetal death', neonatal death (as defined in the primary outcome above).
-
'Intraventricular haemorrhage' has been edited to 'Grade III or IV intraventricular or intracerebral haemorrhage'.
-
'ARDS' has been edited to 'ARDS or grade III/IV hyaline membrane disease'
-
The outcome 'small‐for‐gestational age' was changed to 'small‐for‐gestational age as defined by trial authors', with definitions given in the footnotes of the data
-
'Apgar score at five minutes: low (less than seven), very low (less than four) or lowest reported' has been replaced with 'Apgar score less than seven at five minutes'
-
'Cord blood pH less than 7.1' has been edited to 'Cord blood pH less than 7.1 or as defined by the trial authors'
-
'Endotracheal intubation or use of mechanical ventilation' has been edited to 'Intubation and mechanical ventilation or continuous positive airway pressure support'
The following secondary outcomes have been added at the review stage:
-
'Early neonatal sepsis'
-
'Surfactant use'
-
'Neonatal intensive care unit use or high care unit admission'
Keywords
MeSH
Medical Subject Headings (MeSH) Keywords
- *Cesarean Section [statistics & numerical data];
- *Hypertension;
- *Labor, Induced [statistics & numerical data];
- *Pregnancy Complications, Cardiovascular;
- *Watchful Waiting;
- Delivery, Obstetric;
- Gestational Age;
- Infant Mortality;
- Length of Stay;
- Maternal Mortality;
- Pre‐Eclampsia;
- Randomized Controlled Trials as Topic;
Medical Subject Headings Check Words
Female; Humans; Infant; Infant, Newborn; Pregnancy;
PICO

Study flow diagram.

Risk of bias graph: review authors' judgements about each risk of bias item presented as percentages across all included studies.

Risk of bias summary: review authors' judgements about each risk of bias item for each included study.
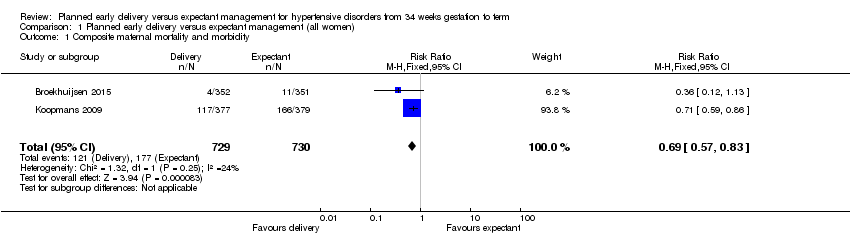
Comparison 1 Planned early delivery versus expectant management (all women), Outcome 1 Composite maternal mortality and morbidity.

Comparison 1 Planned early delivery versus expectant management (all women), Outcome 2 Composite infant mortality and morbidity.

Comparison 1 Planned early delivery versus expectant management (all women), Outcome 3 Maternal mortality.

Comparison 1 Planned early delivery versus expectant management (all women), Outcome 4 Eclampsia.

Comparison 1 Planned early delivery versus expectant management (all women), Outcome 5 Pulmonary oedema.
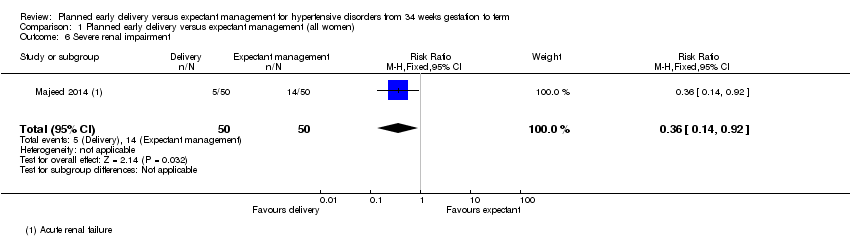
Comparison 1 Planned early delivery versus expectant management (all women), Outcome 6 Severe renal impairment.

Comparison 1 Planned early delivery versus expectant management (all women), Outcome 7 HELLP syndrome.
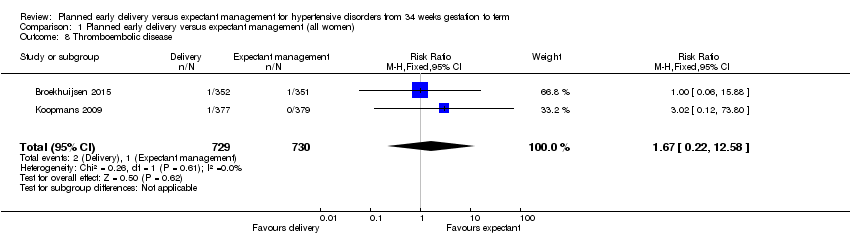
Comparison 1 Planned early delivery versus expectant management (all women), Outcome 8 Thromboembolic disease.

Comparison 1 Planned early delivery versus expectant management (all women), Outcome 9 Abruptio placentae.

Comparison 1 Planned early delivery versus expectant management (all women), Outcome 10 Postpartum haemorrhage.

Comparison 1 Planned early delivery versus expectant management (all women), Outcome 11 Severe hypertension.

Comparison 1 Planned early delivery versus expectant management (all women), Outcome 12 Caesarean section.

Comparison 1 Planned early delivery versus expectant management (all women), Outcome 13 Assisted delivery (ventouse/forceps).

Comparison 1 Planned early delivery versus expectant management (all women), Outcome 14 Maternal morbidity of caesarean section.

Comparison 1 Planned early delivery versus expectant management (all women), Outcome 15 Maternal morbidity related to induction of labour.

Comparison 1 Planned early delivery versus expectant management (all women), Outcome 16 Admission to a high care or intensive care unit.

Comparison 1 Planned early delivery versus expectant management (all women), Outcome 17 Fetal death.

Comparison 1 Planned early delivery versus expectant management (all women), Outcome 18 Neonatal death.

Comparison 1 Planned early delivery versus expectant management (all women), Outcome 19 Grade III or IV intraventricular or intracerebral haemorrhage.

Comparison 1 Planned early delivery versus expectant management (all women), Outcome 20 Nectrotising enterocolitis.

Comparison 1 Planned early delivery versus expectant management (all women), Outcome 21 Respiratory distress syndrome.

Comparison 1 Planned early delivery versus expectant management (all women), Outcome 22 Small‐for‐gestational age.

Comparison 1 Planned early delivery versus expectant management (all women), Outcome 23 Neonatal seizures.

Comparison 1 Planned early delivery versus expectant management (all women), Outcome 24 Apgar score less than seven at five minutes.

Comparison 1 Planned early delivery versus expectant management (all women), Outcome 25 Cord blood pH less than 7.1 or as defined by trial authors.

Comparison 1 Planned early delivery versus expectant management (all women), Outcome 26 Surfactant use.

Comparison 1 Planned early delivery versus expectant management (all women), Outcome 27 Neonatal intensive care unit or high care unit admission.
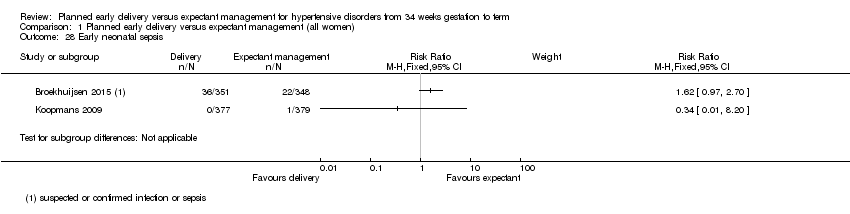
Comparison 1 Planned early delivery versus expectant management (all women), Outcome 28 Early neonatal sepsis.

Comparison 1 Planned early delivery versus expectant management (all women), Outcome 29 Duration of hospital stay after delivery for mother (days).

Comparison 1 Planned early delivery versus expectant management (all women), Outcome 30 Duration of hospital stay after delivery for baby (days).

Comparison 2 Planned early delivery versus expectant management (by gestational age), Outcome 1 Composite maternal mortality and morbidity.

Comparison 2 Planned early delivery versus expectant management (by gestational age), Outcome 2 Respiratory distress syndrome.

Comparison 2 Planned early delivery versus expectant management (by gestational age), Outcome 3 Composite infant mortality and morbidity.

Comparison 3 Planned early delivery versus expectant management (by each gestational week), Outcome 1 Composite maternal mortality and morbidity.

Comparison 3 Planned early delivery versus expectant management (by each gestational week), Outcome 2 Respiratory distress syndrome.

Comparison 3 Planned early delivery versus expectant management (by each gestational week), Outcome 3 Composite infant mortality and morbidity.
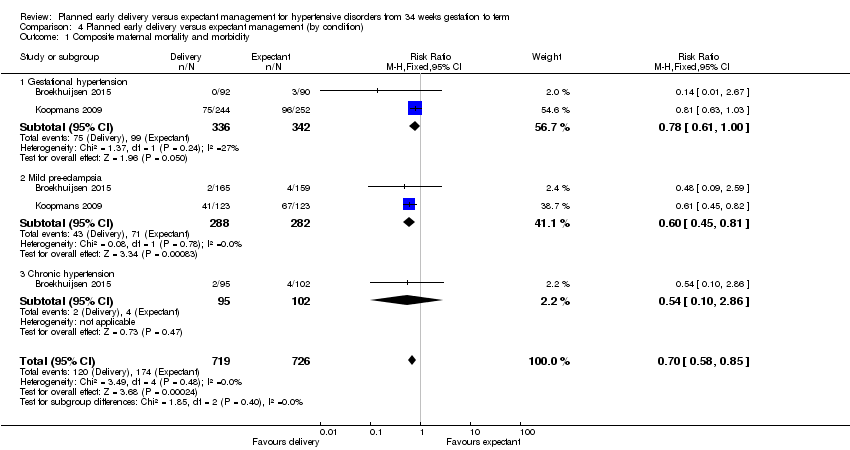
Comparison 4 Planned early delivery versus expectant management (by condition), Outcome 1 Composite maternal mortality and morbidity.

Comparison 4 Planned early delivery versus expectant management (by condition), Outcome 2 Respiratory distress syndrome.
| Planned early delivery versus expectant management for hypertensive disorders from 34 weeks' gestation to term | ||||||
| Patient or population: pregnant women with hypertensive disorders from 34 weeks' gestation to term | ||||||
| Outcomes | Anticipated absolute effects* (95% CI) | Relative effect | № of participants | Quality of the evidence | Comments | |
| Risk with placebo | Risk with GRADE | |||||
| Composite maternal mortality and morbidity | Study population | RR 0.69 | 1459 | ⊕⊕⊕⊕ | ||
| 242 per 1000 | 167 per 1000 | |||||
| Moderate | ||||||
| 235 per 1000 | 162 per 1000 | |||||
| Composite infant mortality and morbidity | not pooled | 1459 | This outcome was not pooled, due to substantial statistical heterogeneity (I2 = 87%, Tau2 = 0.98) | |||
| Caesarean section | Study population | RR 0.91 | 1728 | ⊕⊕⊕⊝ | ||
| 267 per 1000 | 243 per 1000 | |||||
| Moderate | ||||||
| 302 per 1000 | 275 per 1000 | |||||
| Duration of hospital stay after delivery for mother (days) | The mean duration of hospital stay after delivery for mother (days) was 0 | The mean duration of hospital stay after delivery for mother (days) in the intervention group was 0.16 fewer (0.46 fewer to 0.15 more) | ‐ | 925 | ⊕⊕⊕⊝ | |
| Duration of hospital stay after delivery for baby (days) | The mean duration of hospital stay after delivery for baby (days) was 0 | The mean duration of hospital stay after delivery for baby (days) in the intervention group was 0.2 days fewer (0.57 fewer to 0.17 more) | ‐ | 756 | ⊕⊕⊕⊝ | |
| *The risk in the intervention group (and its 95% confidence interval) is based on the assumed risk in the comparison group and the relative effect of the intervention (and its 95% CI). | ||||||
| GRADE Working Group grades of evidence | ||||||
| 1Wide confidence interval crossing the line of no effect. | ||||||
| Outcome or subgroup title | No. of studies | No. of participants | Statistical method | Effect size |
| 1 Composite maternal mortality and morbidity Show forest plot | 2 | 1459 | Risk Ratio (M‐H, Fixed, 95% CI) | 0.69 [0.57, 0.83] |
| 2 Composite infant mortality and morbidity Show forest plot | 2 | Risk Ratio (M‐H, Random, 95% CI) | Subtotals only | |
| 3 Maternal mortality Show forest plot | 2 | 1457 | Risk Ratio (M‐H, Fixed, 95% CI) | 0.0 [0.0, 0.0] |
| 4 Eclampsia Show forest plot | 2 | 1459 | Risk Ratio (M‐H, Fixed, 95% CI) | 0.20 [0.01, 4.14] |
| 5 Pulmonary oedema Show forest plot | 2 | 1459 | Risk Ratio (M‐H, Fixed, 95% CI) | 0.20 [0.01, 4.17] |
| 6 Severe renal impairment Show forest plot | 1 | 100 | Risk Ratio (M‐H, Fixed, 95% CI) | 0.36 [0.14, 0.92] |
| 7 HELLP syndrome Show forest plot | 3 | 1628 | Risk Ratio (M‐H, Fixed, 95% CI) | 0.40 [0.17, 0.93] |
| 8 Thromboembolic disease Show forest plot | 2 | 1459 | Risk Ratio (M‐H, Fixed, 95% CI) | 1.67 [0.22, 12.58] |
| 9 Abruptio placentae Show forest plot | 3 | 1535 | Risk Ratio (M‐H, Fixed, 95% CI) | 0.64 [0.17, 2.34] |
| 10 Postpartum haemorrhage Show forest plot | 1 | 741 | Risk Ratio (M‐H, Fixed, 95% CI) | 0.88 [0.57, 1.35] |
| 11 Severe hypertension Show forest plot | 3 | Risk Ratio (M‐H, Random, 95% CI) | Subtotals only | |
| 12 Caesarean section Show forest plot | 4 | 1728 | Risk Ratio (M‐H, Fixed, 95% CI) | 0.91 [0.78, 1.07] |
| 13 Assisted delivery (ventouse/forceps) Show forest plot | 2 | 1459 | Risk Ratio (M‐H, Fixed, 95% CI) | 0.93 [0.70, 1.24] |
| 14 Maternal morbidity of caesarean section Show forest plot | 1 | 756 | Risk Ratio (M‐H, Fixed, 95% CI) | 0.75 [0.17, 3.35] |
| 14.1 Endometritis | 1 | 756 | Risk Ratio (M‐H, Fixed, 95% CI) | 0.75 [0.17, 3.35] |
| 15 Maternal morbidity related to induction of labour Show forest plot | 1 | 756 | Risk Ratio (M‐H, Fixed, 95% CI) | 0.0 [0.0, 0.0] |
| 15.1 Uterine rupture | 1 | 756 | Risk Ratio (M‐H, Fixed, 95% CI) | 0.0 [0.0, 0.0] |
| 16 Admission to a high care or intensive care unit Show forest plot | 1 | 708 | Risk Ratio (M‐H, Fixed, 95% CI) | 0.41 [0.16, 1.07] |
| 17 Fetal death Show forest plot | 1 | 756 | Risk Ratio (M‐H, Fixed, 95% CI) | 0.0 [0.0, 0.0] |
| 18 Neonatal death Show forest plot | 3 | 1535 | Risk Ratio (M‐H, Fixed, 95% CI) | 2.0 [0.19, 21.14] |
| 19 Grade III or IV intraventricular or intracerebral haemorrhage Show forest plot | 1 | 674 | Risk Ratio (M‐H, Fixed, 95% CI) | 6.92 [0.36, 133.41] |
| 20 Nectrotising enterocolitis Show forest plot | 2 | 1338 | Risk Ratio (M‐H, Fixed, 95% CI) | 0.98 [0.14, 6.89] |
| 21 Respiratory distress syndrome Show forest plot | 3 | 1511 | Risk Ratio (M‐H, Fixed, 95% CI) | 2.24 [1.20, 4.18] |
| 22 Small‐for‐gestational age Show forest plot | 3 | 1001 | Risk Ratio (M‐H, Fixed, 95% CI) | 1.58 [0.89, 2.79] |
| 23 Neonatal seizures Show forest plot | 1 | 699 | Risk Ratio (M‐H, Fixed, 95% CI) | 3.97 [0.45, 35.30] |
| 24 Apgar score less than seven at five minutes Show forest plot | 2 | 1454 | Risk Ratio (M‐H, Fixed, 95% CI) | 1.11 [0.60, 2.05] |
| 25 Cord blood pH less than 7.1 or as defined by trial authors Show forest plot | 2 | 1145 | Risk Ratio (M‐H, Fixed, 95% CI) | 0.58 [0.31, 1.09] |
| 26 Surfactant use Show forest plot | 1 | 639 | Risk Ratio (M‐H, Fixed, 95% CI) | 0.0 [0.0, 0.0] |
| 27 Neonatal intensive care unit or high care unit admission Show forest plot | 4 | 1585 | Risk Ratio (M‐H, Fixed, 95% CI) | 1.65 [1.13, 2.40] |
| 28 Early neonatal sepsis Show forest plot | 2 | Risk Ratio (M‐H, Fixed, 95% CI) | Subtotals only | |
| 29 Duration of hospital stay after delivery for mother (days) Show forest plot | 2 | 925 | Mean Difference (IV, Fixed, 95% CI) | ‐0.16 [‐0.46, 0.15] |
| 30 Duration of hospital stay after delivery for baby (days) Show forest plot | 1 | 756 | Mean Difference (IV, Fixed, 95% CI) | ‐0.20 [‐0.57, 0.17] |
| Outcome or subgroup title | No. of studies | No. of participants | Statistical method | Effect size |
| 1 Composite maternal mortality and morbidity Show forest plot | 2 | 1459 | Risk Ratio (M‐H, Fixed, 95% CI) | 0.68 [0.57, 0.83] |
| 1.1 34 + 0 to 36 + 6 weeks GA at randomisation | 2 | 778 | Risk Ratio (M‐H, Fixed, 95% CI) | 0.77 [0.48, 1.24] |
| 1.2 37 + 0 to 38 + 6 weeks GA at randomisation | 1 | 380 | Risk Ratio (M‐H, Fixed, 95% CI) | 0.69 [0.53, 0.90] |
| 1.3 39 + 0 to 41 + 0 weeks GA at randomisation | 1 | 301 | Risk Ratio (M‐H, Fixed, 95% CI) | 0.64 [0.47, 0.88] |
| 2 Respiratory distress syndrome Show forest plot | 2 | 1459 | Risk Ratio (M‐H, Fixed, 95% CI) | 2.53 [1.16, 5.55] |
| 2.1 34 + 0 to 36 + 6 weeks GA at randomisation | 2 | 778 | Risk Ratio (M‐H, Fixed, 95% CI) | 3.32 [1.35, 8.18] |
| 2.2 37 + 0 to 38 + 6 weeks GA at randomisation | 1 | 380 | Risk Ratio (M‐H, Fixed, 95% CI) | 0.32 [0.01, 7.72] |
| 2.3 39 + 0 to 41 + 0 weeks GA at randomisation | 1 | 301 | Risk Ratio (M‐H, Fixed, 95% CI) | 1.12 [0.07, 17.74] |
| 3 Composite infant mortality and morbidity Show forest plot | 1 | 756 | Risk Ratio (M‐H, Fixed, 95% CI) | 0.77 [0.46, 1.28] |
| 3.1 36 + 0 to 36 + 6 weeks GA at randomisation | 1 | 75 | Risk Ratio (M‐H, Fixed, 95% CI) | 2.63 [0.29, 24.10] |
| 3.2 37 + 0 to 38 + 6 weeks GA at randomisation | 1 | 380 | Risk Ratio (M‐H, Fixed, 95% CI) | 0.68 [0.31, 1.49] |
| 3.3 39 + 0 to 41 + 0 weeks GA at randomisation | 1 | 301 | Risk Ratio (M‐H, Fixed, 95% CI) | 0.72 [0.35, 1.49] |
| Outcome or subgroup title | No. of studies | No. of participants | Statistical method | Effect size |
| 1 Composite maternal mortality and morbidity Show forest plot | 2 | 1459 | Risk Ratio (M‐H, Fixed, 95% CI) | 0.69 [0.57, 0.83] |
| 1.1 34 + 0 to 34 + 6 weeks GA at randomisation | 1 | 154 | Risk Ratio (M‐H, Fixed, 95% CI) | 4.75 [0.23, 97.34] |
| 1.2 35 + 0 to 35 + 6 weeks GA at randomisation | 1 | 236 | Risk Ratio (M‐H, Fixed, 95% CI) | 0.14 [0.02, 1.10] |
| 1.3 36 + 0 to 36 + 6 weeks GA at randomisation | 2 | 388 | Risk Ratio (M‐H, Fixed, 95% CI) | 0.98 [0.59, 1.62] |
| 1.4 37 + 0 to 37 + 6 weeks GA at randomisation | 1 | 188 | Risk Ratio (M‐H, Fixed, 95% CI) | 0.75 [0.52, 1.08] |
| 1.5 38 + 0 to 38 + 6 weeks GA at randomisation | 1 | 192 | Risk Ratio (M‐H, Fixed, 95% CI) | 0.63 [0.43, 0.94] |
| 1.6 39 + 0 to 39 + 6 weeks GA at randomisation | 1 | 186 | Risk Ratio (M‐H, Fixed, 95% CI) | 0.78 [0.53, 1.14] |
| 1.7 40 + 0 to 41 + 0 weeks GA at randomisation | 1 | 115 | Risk Ratio (M‐H, Fixed, 95% CI) | 0.46 [0.26, 0.79] |
| 2 Respiratory distress syndrome Show forest plot | 1 | 703 | Risk Ratio (M‐H, Fixed, 95% CI) | 3.32 [1.38, 8.01] |
| 2.1 34 + 0 to 34 + 6 weeks GA at randomisation | 1 | 154 | Risk Ratio (M‐H, Fixed, 95% CI) | 2.37 [0.78, 7.24] |
| 2.2 35 + 0 to 35 + 6 weeks GA at randomisation | 1 | 236 | Risk Ratio (M‐H, Fixed, 95% CI) | 7.62 [0.93, 62.27] |
| 2.3 36 + 0 to 36 + 6 weeks GA at randomisation | 1 | 313 | Risk Ratio (M‐H, Fixed, 95% CI) | 3.41 [0.39, 30.15] |
| 3 Composite infant mortality and morbidity Show forest plot | 1 | 756 | Risk Ratio (M‐H, Fixed, 95% CI) | 0.77 [0.46, 1.29] |
| 3.1 36 + 0 to 36 + 6 weeks GA at randomisation | 1 | 75 | Risk Ratio (M‐H, Fixed, 95% CI) | 2.63 [0.29, 24.10] |
| 3.2 37 + 0 to 37 + 6 weeks GA at randomisation | 1 | 188 | Risk Ratio (M‐H, Fixed, 95% CI) | 0.48 [0.17, 1.35] |
| 3.3 38 + 0 to 38 + 6 weeks GA at randomisation | 1 | 192 | Risk Ratio (M‐H, Fixed, 95% CI) | 1.17 [0.33, 4.24] |
| 3.4 39 + 0 to 39 + 6 weeks GA at randomisation | 1 | 186 | Risk Ratio (M‐H, Fixed, 95% CI) | 0.79 [0.32, 1.95] |
| 3.5 40 + 0 to 41 + 0 weeks GA at randomisation | 1 | 115 | Risk Ratio (M‐H, Fixed, 95% CI) | 0.63 [0.19, 2.12] |
| Outcome or subgroup title | No. of studies | No. of participants | Statistical method | Effect size |
| 1 Composite maternal mortality and morbidity Show forest plot | 2 | 1445 | Risk Ratio (M‐H, Fixed, 95% CI) | 0.70 [0.58, 0.85] |
| 1.1 Gestational hypertension | 2 | 678 | Risk Ratio (M‐H, Fixed, 95% CI) | 0.78 [0.61, 1.00] |
| 1.2 Mild pre‐eclampsia | 2 | 570 | Risk Ratio (M‐H, Fixed, 95% CI) | 0.60 [0.45, 0.81] |
| 1.3 Chronic hypertension | 1 | 197 | Risk Ratio (M‐H, Fixed, 95% CI) | 0.54 [0.10, 2.86] |
| 2 Respiratory distress syndrome Show forest plot | 1 | 703 | Risk Ratio (M‐H, Fixed, 95% CI) | 3.36 [1.36, 8.31] |
| 2.1 Gestational hypertension | 1 | 182 | Risk Ratio (M‐H, Fixed, 95% CI) | 3.91 [0.45, 34.34] |
| 2.2 Mild pre‐eclampsia | 1 | 324 | Risk Ratio (M‐H, Fixed, 95% CI) | 4.82 [1.07, 21.65] |
| 2.3 Chronic hypertension | 1 | 197 | Risk Ratio (M‐H, Fixed, 95% CI) | 2.15 [0.55, 8.35] |