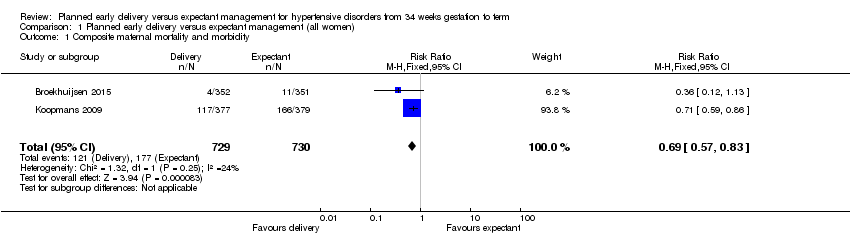
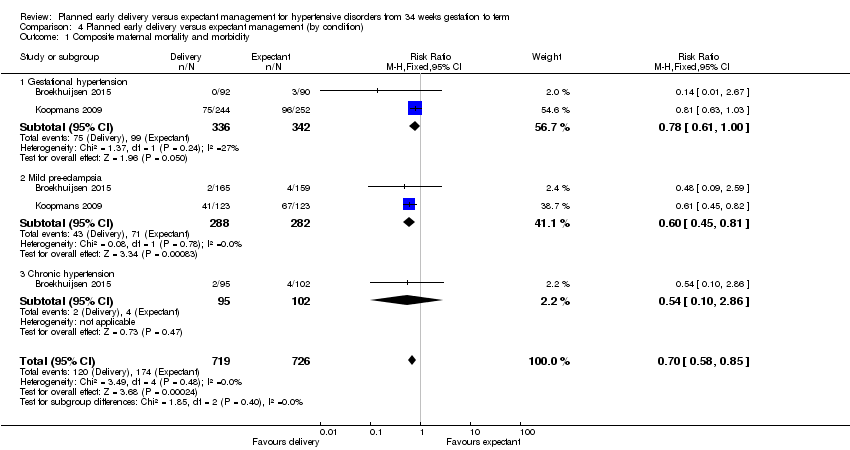
| 1 Composite maternal mortality and morbidity Show forest plot | 2 | 1459 | Risk Ratio (M‐H, Fixed, 95% CI) | 0.69 [0.57, 0.83] |
|
| 2 Composite infant mortality and morbidity Show forest plot | 2 | | Risk Ratio (M‐H, Random, 95% CI) | Subtotals only |
|
| 3 Maternal mortality Show forest plot | 2 | 1457 | Risk Ratio (M‐H, Fixed, 95% CI) | 0.0 [0.0, 0.0] |
|
| 4 Eclampsia Show forest plot | 2 | 1459 | Risk Ratio (M‐H, Fixed, 95% CI) | 0.20 [0.01, 4.14] |
|
| 5 Pulmonary oedema Show forest plot | 2 | 1459 | Risk Ratio (M‐H, Fixed, 95% CI) | 0.20 [0.01, 4.17] |
|
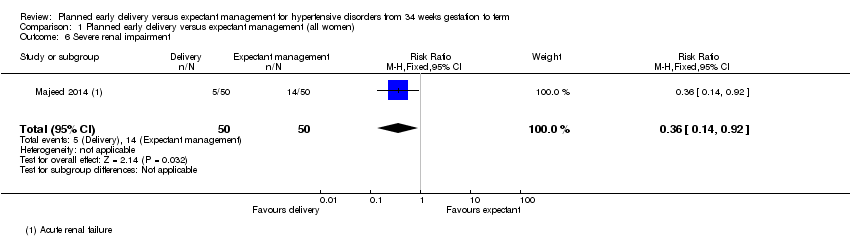
| 6 Severe renal impairment Show forest plot | 1 | 100 | Risk Ratio (M‐H, Fixed, 95% CI) | 0.36 [0.14, 0.92] |
|
| 7 HELLP syndrome Show forest plot | 3 | 1628 | Risk Ratio (M‐H, Fixed, 95% CI) | 0.40 [0.17, 0.93] |
|
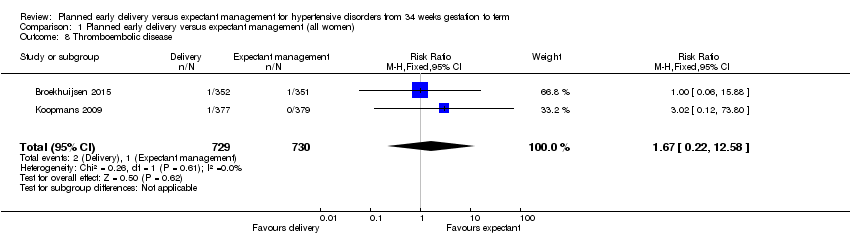
| 8 Thromboembolic disease Show forest plot | 2 | 1459 | Risk Ratio (M‐H, Fixed, 95% CI) | 1.67 [0.22, 12.58] |
|
| 9 Abruptio placentae Show forest plot | 3 | 1535 | Risk Ratio (M‐H, Fixed, 95% CI) | 0.64 [0.17, 2.34] |
|
| 10 Postpartum haemorrhage Show forest plot | 1 | 741 | Risk Ratio (M‐H, Fixed, 95% CI) | 0.88 [0.57, 1.35] |
|
| 11 Severe hypertension Show forest plot | 3 | | Risk Ratio (M‐H, Random, 95% CI) | Subtotals only |
|
| 12 Caesarean section Show forest plot | 4 | 1728 | Risk Ratio (M‐H, Fixed, 95% CI) | 0.91 [0.78, 1.07] |
|
| 13 Assisted delivery (ventouse/forceps) Show forest plot | 2 | 1459 | Risk Ratio (M‐H, Fixed, 95% CI) | 0.93 [0.70, 1.24] |
|
| 14 Maternal morbidity of caesarean section Show forest plot | 1 | 756 | Risk Ratio (M‐H, Fixed, 95% CI) | 0.75 [0.17, 3.35] |
|
| 14.1 Endometritis | 1 | 756 | Risk Ratio (M‐H, Fixed, 95% CI) | 0.75 [0.17, 3.35] |
| 15 Maternal morbidity related to induction of labour Show forest plot | 1 | 756 | Risk Ratio (M‐H, Fixed, 95% CI) | 0.0 [0.0, 0.0] |
|
| 15.1 Uterine rupture | 1 | 756 | Risk Ratio (M‐H, Fixed, 95% CI) | 0.0 [0.0, 0.0] |
| 16 Admission to a high care or intensive care unit Show forest plot | 1 | 708 | Risk Ratio (M‐H, Fixed, 95% CI) | 0.41 [0.16, 1.07] |
|
| 17 Fetal death Show forest plot | 1 | 756 | Risk Ratio (M‐H, Fixed, 95% CI) | 0.0 [0.0, 0.0] |
|
| 18 Neonatal death Show forest plot | 3 | 1535 | Risk Ratio (M‐H, Fixed, 95% CI) | 2.0 [0.19, 21.14] |
|
| 19 Grade III or IV intraventricular or intracerebral haemorrhage Show forest plot | 1 | 674 | Risk Ratio (M‐H, Fixed, 95% CI) | 6.92 [0.36, 133.41] |
|
| 20 Nectrotising enterocolitis Show forest plot | 2 | 1338 | Risk Ratio (M‐H, Fixed, 95% CI) | 0.98 [0.14, 6.89] |
|
| 21 Respiratory distress syndrome Show forest plot | 3 | 1511 | Risk Ratio (M‐H, Fixed, 95% CI) | 2.24 [1.20, 4.18] |
|
| 22 Small‐for‐gestational age Show forest plot | 3 | 1001 | Risk Ratio (M‐H, Fixed, 95% CI) | 1.58 [0.89, 2.79] |
|
| 23 Neonatal seizures Show forest plot | 1 | 699 | Risk Ratio (M‐H, Fixed, 95% CI) | 3.97 [0.45, 35.30] |
|
| 24 Apgar score less than seven at five minutes Show forest plot | 2 | 1454 | Risk Ratio (M‐H, Fixed, 95% CI) | 1.11 [0.60, 2.05] |
|
| 25 Cord blood pH less than 7.1 or as defined by trial authors Show forest plot | 2 | 1145 | Risk Ratio (M‐H, Fixed, 95% CI) | 0.58 [0.31, 1.09] |
|
| 26 Surfactant use Show forest plot | 1 | 639 | Risk Ratio (M‐H, Fixed, 95% CI) | 0.0 [0.0, 0.0] |
|
| 27 Neonatal intensive care unit or high care unit admission Show forest plot | 4 | 1585 | Risk Ratio (M‐H, Fixed, 95% CI) | 1.65 [1.13, 2.40] |
|
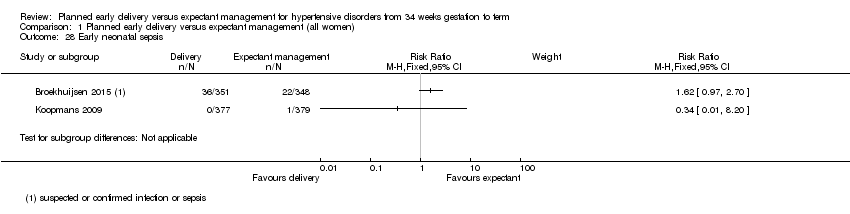
| 28 Early neonatal sepsis Show forest plot | 2 | | Risk Ratio (M‐H, Fixed, 95% CI) | Subtotals only |
|
| 29 Duration of hospital stay after delivery for mother (days) Show forest plot | 2 | 925 | Mean Difference (IV, Fixed, 95% CI) | ‐0.16 [‐0.46, 0.15] |
|
| 30 Duration of hospital stay after delivery for baby (days) Show forest plot | 1 | 756 | Mean Difference (IV, Fixed, 95% CI) | ‐0.20 [‐0.57, 0.17] |
|