Intervención conductual intensiva temprana para niños pequeños con trastornos del espectro autista
Información
- DOI:
- https://doi.org/10.1002/14651858.CD009260.pub3Copiar DOI

- Base de datos:
-
- Cochrane Database of Systematic Reviews
- Versión publicada:
-
- 09 mayo 2018see what's new
- Tipo:
-
- Intervention
- Etapa:
-
- Review
- Grupo Editorial Cochrane:
-
Grupo Cochrane de Problemas de desarrollo, psicosociales y de aprendizaje
- Copyright:
-
- Copyright © 2018 The Cochrane Collaboration. Published by John Wiley & Sons, Ltd.
Cifras del artículo
Altmetric:
Citado por:
Autores
Contributions of authors
BR has overall responsibility for this update and is the guarantor of the review.
BR, KH, EB, and BB contributed to the development of the review protocol.
For this update, BB and KH screened the abstracts and titles, retrieved potentially eligible papers, and made decisions about eligibility, which were confirmed by BR or EB. BR and EB independently extracted data and conducted the meta‐analyses. BR, EB, BB, and KH drafted and approved the full review.
Sources of support
Internal sources
-
University of Florida, USA.
Dr Reichow received salary support from the University of Florida during this update
External sources
-
None, Other.
Declarations of interest
Brian Reichow (BR) receives royalties for two Springer books on autism and one Springer book on early childhood special education, and honoraria from lectures on autism. BR's institution receives intervention‐specific grants funded by the Institute of Education Sciences, US Department of Education. BR receives payment from Springer for his role as Associate Editor for the Journal of Autism and Developmental Disorders. The World Health Organization cover travel costs for BR to meetings related to interventions for autism.
Kara Hume (KH) received monies to provide lectures on autism. KH's institution receives intervention‐specific or autism‐related grants funded by the Institute of Education Sciences, US Department of Education, and the US Maternal and Child Health Bureau.
Erin E Barton (EB) receives royalties for a Sage/Corwin Press book on educating young children with autism, a Brookes Publishing book on preschool inclusion, and a Springer book on early childhood special education. EB's institution receives intervention‐specific grants funded by the Institute of Education Sciences, US Department of Education. EB received a student loan repayment funding from the National Institute of Child Health and Human Development, US National Institutes of Health.
Brian A Boyd (BB) receives royalties for a Springer book on early childhood special education. BB's institution receives intervention‐specific or autism‐related grants funded through the following federal agencies: the Institute of Education Sciences, US Department of Education, US Maternal and Child Health Bureau, and the US National Institutes of Health. BB received monies to provide lectures on autism from the Contemporary Forums on Autism and University of Illinois‐Urbana Champaign.
Acknowledgements
We thank Margaret Anderson, Information Specialist of Cochrane Developmental, Psychosocial and Learning Problems (CDPLP), for searching relevant databases, and Geraldine Macdonald, Joanne Wilson, Steve Milan, Laura Macdonald (former member), and other members of CDPLP for their assistance and guidance throughout the review process.
Version history
| Published | Title | Stage | Authors | Version |
| 2018 May 09 | Early intensive behavioral intervention (EIBI) for young children with autism spectrum disorders (ASD) | Review | Brian Reichow, Kara Hume, Erin E Barton, Brian A Boyd | |
| 2012 Oct 17 | Early intensive behavioral intervention (EIBI) for young children with autism spectrum disorders (ASD) | Review | Brian Reichow, Erin E Barton, Brian A Boyd, Kara Hume | |
| 2011 Aug 10 | Early Intensive Behavioral Intervention for increasing functional behaviors and skills for young children with autism spectrum disorders (ASD) | Protocol | Brian Reichow, Erin E Barton, Brian A Boyd, Kara Hume | |
Differences between protocol and review
-
Background: we made minor edits to the background to improve clarity.
-
Types of outcome measures: we specified that "autism symptom severity, as rated by parents on autism screening and diagnostic instruments" is a primary outcome.
-
-
We searched two additional Ovid MEDLINE segments, which are updated daily, to ensure our search was as up to date as possible (MEDLINE IN‐Process & Other Non‐Indexed Citations and MEDLINE Epub Ahead of Print).
-
We added Conference Proceedings Citation Index — Social Sciences & Humanities (a database of conference abstracts) to comply with updated Cochrane standards which require searches of grey literature.
-
The final issue of DARE was published in 2015. We replaced it with Epistemonikos, as a source of systematic reviews.
-
We replaced the metaRegister of Controlled Trials, which was under review, with ClinicalTrials.gov and the World Health Organization International Clinical Trials Registry Platform.
-
We did not search Networked Digital Library of Theses and Dissertations (NDLTD) because it returned a large volume of irrelevant records, that could not be refined further.
-
-
Follow‐up data two and five years after the conclusion of treatment were available for the Magiati 2007 and Remington 2007 studies. Since only one study reported data at each follow‐up time point, we decided a meta‐analysis was not appropriate. See Data synthesis.
-
Summary of findings:
-
We added a new section describing the 'Summary of findings' method, beneath the Data synthesis section.
-
We consolodated multiple 'Summary of findings' tables into one 'Summary of findings' to report key primary and secondary outcomes (i.e., adaptive behavior, autism symptom severity, IQ, expressive language, receptive language, and problem behavior).
-
-
Effects of interventions: for this update, the comparison group for the Howard 2014 study was an average of the two community treatment‐as‐usual groups; this change was made between the original review and the update because children who were in the control conditions moved between two different types of community conditions.
-
In Table 2, we specified that we examined chronological age, IQ, adaptive behavior skills, and communication skills for the 'Risk of bias' assessment for baseline measurement.
-
We added a table detailing protocol decisions that were not needed or used in this review update (see Table 3).
Keywords
MeSH
Medical Subject Headings (MeSH) Keywords
Medical Subject Headings Check Words
Child, Preschool; Humans;
PICO

Study flow diagram.
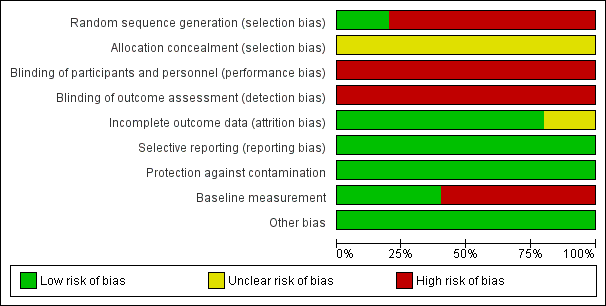
Risk of bias graph: review authors' judgements about each risk of bias item presented as percentages across all included studies.
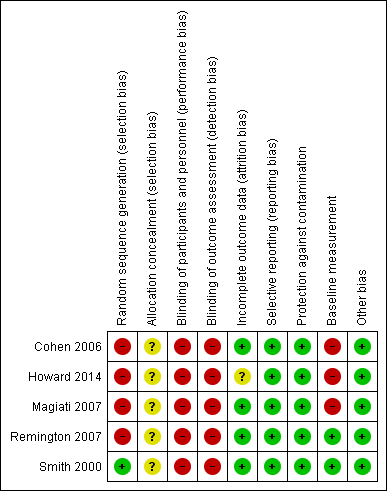
Risk of bias summary: review authors' judgements about each risk of bias item for each included study.

Forest plot of comparison: 1 Adaptive behavior, outcome: 1.1 Vineland Adaptive Behavior Scales Composite

Comparison 1 Early intensive behavioral intervention (EIBI) compared to for young children with autism spectrum disorders (ASD), Outcome 1 Adaptive behavior.

Comparison 1 Early intensive behavioral intervention (EIBI) compared to for young children with autism spectrum disorders (ASD), Outcome 2 Autism symptom severity.

Comparison 1 Early intensive behavioral intervention (EIBI) compared to for young children with autism spectrum disorders (ASD), Outcome 3 Intelligence.
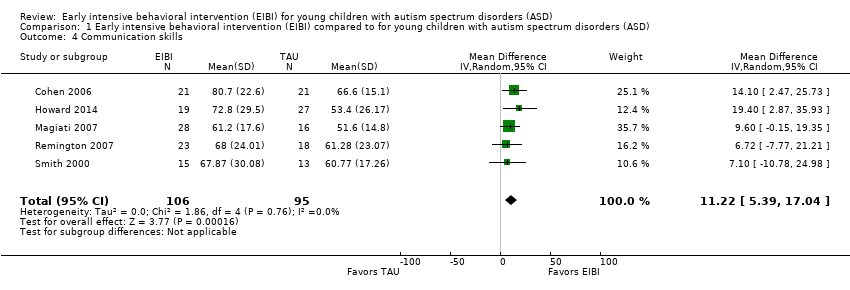
Comparison 1 Early intensive behavioral intervention (EIBI) compared to for young children with autism spectrum disorders (ASD), Outcome 4 Communication skills.

Comparison 1 Early intensive behavioral intervention (EIBI) compared to for young children with autism spectrum disorders (ASD), Outcome 5 Language skills.

Comparison 1 Early intensive behavioral intervention (EIBI) compared to for young children with autism spectrum disorders (ASD), Outcome 6 Social competence.

Comparison 1 Early intensive behavioral intervention (EIBI) compared to for young children with autism spectrum disorders (ASD), Outcome 7 Daily living skills.

Comparison 1 Early intensive behavioral intervention (EIBI) compared to for young children with autism spectrum disorders (ASD), Outcome 8 Problem behavior.
| Study | EIBI N | EIBI N for general education with no extra support | EIBI N for general education with support | TAU N | TAU N for general education with no extra support | TAU N for general education with support |
| Cohen 2006 | 21 | 6 | 11 | 21 | 0 | 1 |
| Smith 2000 | 15 | 4 | 2 | 13 | 0 | 3 |
Comparison 1 Early intensive behavioral intervention (EIBI) compared to for young children with autism spectrum disorders (ASD), Outcome 9 Academic placement.
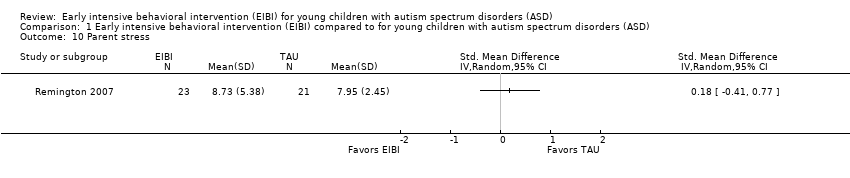
Comparison 1 Early intensive behavioral intervention (EIBI) compared to for young children with autism spectrum disorders (ASD), Outcome 10 Parent stress.
| Early intensive behavioral intervention (EIBI) for young children with autism spectrum disorders (ASD) | ||||||
| Patient or population: patients with young children (less than six years old) with autism spectrum disorders (ASD) | ||||||
| Outcomes | Illustrative comparative risks* (95% CI) | Relative effect | Number of participants | Quality of the evidence | Comments | |
| Assumed risk | Corresponding risk | |||||
| TAU | EIBI | |||||
| Adaptive behavior | The mean adaptive behavior score ranged across control groups from 48.60 points to 67.10 points | The mean adaptive behavior score in the intervention groups was, on average, 9.58 points higher (5.57 points higher to 13.6 points higher) | ‐ | 202 | ⊕⊕⊝⊝ | ‐ |
| Autism symptom severity | ‐ | The mean autism symptom severity score in the intervention groups was 0.34 standard deviations lower | ‐ | 81 | ⊕⊝⊝⊝ | General guidelines for the magnitude of an effect suggest that effect sizes of 0.20 to 0.50 are considered to have a small effect, effect sizes of 0.50 to 0.80 are considered to have a medium effect, and effect sizes greater than 0.80 are considered to have a large effect (Cohen 1988) |
| Adverse effects Measured by: worsening of adaptive behavior or autism symptom severity Follow‐up: 2 to 3 years | No adverse events were reported in any study | |||||
| Intelligence | The mean IQ score ranged across control groups from 49.67 points to 73.20 points | The mean IQ score in the intervention groups was, on average, 15.44 higher (9.29 points higher to 21.59 points higher) | ‐ | 202 | ⊕⊕⊝⊝ | ‐ |
| Communication and language skills: expressive language | ‐ | The mean expressive language score in the intervention groups was 0.51 standard deviations higher | ‐ | 165 | ⊕⊕⊝⊝ | General guidelines for the magnitude of an effect suggest that effect sizes of 0.20 to 0.50 are considered to have a small effect, effect sizes of 0.50 to 0.80 are considered to have a medium effect, and effect sizes greater than 0.80 are considered to have a large effect (Cohen 1988) |
| Communication and language skills: receptive language | ‐ | The mean receptive language score in the intervention groups was 0.55 standard deviations higher (0.23 standard deviations higher to 0.87 standard deviations higher) | ‐ | 164 | ⊕⊕⊝⊝ | General guidelines for the magnitude of an effect suggest that effect sizes of 0.20 to 0.50 are considered to have a small effect, effect sizes of 0.50 to 0.80 are considered to have a medium effect, and effect sizes greater than 0.80 are considered to have a large effect (Cohen 1988) |
| Problem behavior | ‐ | The mean problem behavior score in the intervention groups was 0.58 standard deviations lower (1.24 standard deviations lower to 0.07 standard deviations higher) | ‐ | 67 | ⊕⊝⊝⊝ | General guidelines for the magnitude of an effect suggest that effect sizes of 0.20 to 0.50 are considered to have a small effect, effect sizes of 0.50 to 0.80 are considered to have a medium effect, and effect sizes greater than 0.80 are considered to have a large effect (Cohen 1988) |
| *The basis for the assumed risk (e.g. the median control group risk across studies) is provided in footnotes. The corresponding risk (and its 95% CI) is based on the assumed risk in the comparison group and the relative effect of the intervention (and its 95% CI). ASD: autism spectrum disorders; CCT: clinical controlled trial; CI: Confidence interval; EIBI: early intensive behavioral intervention; IQ: intelligence quotient; RCT: randomized controlled trial | ||||||
| GRADE Working Group grades of evidence | ||||||
| 1One study was conducted using an RCT design (Smith 2000) and four studies were conducted using a CCT design (Cohen 2006; Howard 2014; Magiati 2007; Remington 2007). Quality of evidence rating downgraded two levels due to inclusion of non‐randomized studies and associated risks of bias. | ||||||
|
| Treatment Groups | Comparison Groups | ||||
| Study | Outcomes | Pre‐Treatment | Post‐Treatment | Pre‐Treatment | Post‐Treatment | |
| Primary | Adaptive behavior | VABS composite | VABS composite | VABS composite | VABS composite | |
| Autism severity | NA | NA | NA | NA | ||
| Secondary | IQ | BSID‐II; WPPSI‐R | BSID‐II; WPPSI‐R | BSID; WPPSI‐R | BSID‐II; WPPSI‐R | |
| Non‐verbal IQ | MPS | MPS | MPS | MPS | ||
| Non‐verbal social communication | NA | NA | NA | NA | ||
| Expressive communication | RDLS | RDLS | RDLS | RDLS | ||
| Receptive communication | RDLS | RDLS | RDLS | RDLS | ||
| Play | NA | NA | NA | NA | ||
| Social competence | VABS socialization domain | VABS socialization domain | VABS socialization domain | VABS socialization domain | ||
| Daily living skills | VABS daily living skills domain | VABS daily living skills domain | VABS daily living skills domain | VABS daily living skills domain | ||
| Academic achievement | NA | NA | NA | NA | ||
| Problem behavior | NA | NA | NA | NA | ||
| Parent stress | NA | NA | NA | NA | ||
| Academic placement | NA | Class placement | NA | Class placement | ||
| Quality of life | NA | NA | NA | NA | ||
| Primary | Adaptive behavior | VABS composite; Denver; DP‐II; RIDES | VABS composite; Denver; DP‐II; RIDES | VABS composite | VABS composite | |
| Autism severity | # of DSM‐IV criteria (APA 1994) | NA | # of DSM‐IV criteria | NA | ||
| Secondary | IQ | WPPSI‐R; BSID‐II; S‐B; DAYC; PEP‐R; DAS; DP‐II | WPPSI‐R, BSID‐II, S‐B; DAYC, PEP‐R, DAS | WPPSI‐R, BSID‐II, S‐B; DAS | WPPSI‐R, BSID‐II, S‐B; DAS | |
| Non‐verbal IQ | MPS; S‐B | MPS; S‐B; Leiter‐R | MPS; S‐B | MPS; S‐B; Leiter‐R | ||
| Non‐verbal social communication | NA | NA | NA | NA | ||
| Expressive communication | RDLS; ITLS; REEL‐R; PLS‐3; ITDA; EVT; DP‐II | RDLS; ITLS; REEL‐R; PLS‐3; ITDA; EVT; EOWPVT | RDLS; ITLS; REEL‐R; PLS‐3; ITDA; EVT; DP‐II | RDLS; ITLS; REEL‐R; PLS‐3; ITDA; EVT; EOWPVT | ||
| Receptive communication | RDLS; ITLS; REEL‐R; PLS‐3; ITDA; PPVT‐III; DP‐II | RDLS; ITLS; REEL‐R; PLS‐3; PPVT‐III; ROWPVT; ITDA‐1 | RDLS; ITLS; REEL‐R; PLS‐3; PPVT‐III; DP‐II; ITDA‐1 | RDLS; ITLS; REEL‐R; PLS‐3; PPVT‐III, ROWPVT; ITDA‐1 | ||
| Play | NA | NA | NA | NA | ||
| Social competence | VABS socialization domain | VABS socialization domain | VABS socialization domain | VABS socialization domain | ||
| Daily living skills | VABS daily living skills domain | VABS daily living skills domain | VABS daily living skills domain | VABS daily living skills domain | ||
| Academic achievement | NA | NA | NA | NA | ||
| Problem behavior | NA | NA | NA | NA | ||
| Parent stress | NA | NA | NA | NA | ||
| Academic placement | NA | NA | NA | NA | ||
| Quality of life | NA | NA | NA | NA | ||
| Primary | Adaptive behavior | VABS composite | VABS composite | VABS composite | VABS composite | |
| Autism severity | ADI‐R | ADI‐R | ADI‐R | ADI‐R | ||
| Secondary | IQ | WPPSI‐R; BSID‐R; MPS | WPPSI‐R; BSID‐R; MPS | WPPSI‐R; BSID‐R; MPS | WPPSI‐R; BSID‐R; MPS | |
| Non‐verbal IQ | NA | NA | NA | NA | ||
| Non‐verbal social communication | NA | NA | NA | NA | ||
| Expressive communication | EOWPVT‐R | EOWPVT‐R | EOWPVT‐R | EOWPVT‐R | ||
| Receptive communication | BPVS‐II | BPVS‐II | BPVS‐II | BPVS‐II | ||
| Play | SPT‐II | SPT‐II | SPT‐II | SPT‐II | ||
| Social competence | VABS socialization domain | VABS socialization domain | VABS socialization domain | VABS socialization domain | ||
| Daily living skills | VABS daily living skills domain | VABS daily living skills domain | VABS daily living skills domain | VABS daily living skills domain | ||
| Academic achievement | NA | NA | NA | NA | ||
| Problem behavior | NA | NA | NA | NA | ||
| Parent stress | NA | NA | NA | NA | ||
| Academic placement | NA | NA | NA | NA | ||
| Quality of life | NA | NA | NA | NA | ||
| Primary | Adaptive behavior | VABS composite | VABS composite | VABS composite | VABS composite | |
| Autism severity | ASQ | ASQ | ASQ | ASQ | ||
| Secondary | IQ | BSID‐R; S‐B | BSID‐R; S‐B | BSID‐R; S‐B | BSID‐R; S‐B | |
| Non‐verbal IQ | NA | NA | NA | NA | ||
| Non‐verbal social communication | ESCS | ESCS | ESCS | ESCS | ||
| Expressive communication | RDLS | RDLS | RDLS | RDLS | ||
| Receptive communication | RDLS | RDLS | RDLS | RDLS | ||
| Play | NA | NA | NA | NA | ||
| Social competence | VABS socialization domain | VABS socialization domain | VABS socialization domain | VABS socialization domain | ||
| Daily living skills | VABS daily living skills domain | VABS daily living skills domain | VABS daily living skills domain | VABS daily living skills domain | ||
| Academic achievement | NA | NA | NA | NA | ||
| Problem behavior | DCBC | DCBC | DCBD | DCBD | ||
| Parent stress | QRS‐F parent and family problems subscale | QRS‐F parent and family problems subscale | QRS‐F parent and family problems subscale | QRS‐F parent and family problems subscale | ||
| Academic placement | NA | NA | NA | NA | ||
| Quality of life | NA | NA | NA | NA | ||
| Primary | Adaptive behavior | VABS composite | VABS composite | VABS composite | VABS composite | |
| Autism severity | NA | NA | NA | NA | ||
| Secondary | IQ | BSID‐R; S‐B | BSID‐R; S‐B | BSID‐R; S‐B | BSID‐R; S‐B | |
| Non‐verbal IQ | MPS | MPS | MPS | MPS | ||
| Non‐verbal social communication | NA | NA | NA | NA | ||
| Expressive communication | RDLS | RDLS | RDLS | RDLS | ||
| Receptive communication | RDLS | RDLS | RDLS | RDLS | ||
| Play | NA | NA | NA | NA | ||
| Social competence | VABS socialization domain | VABS socialization domain | VABS socialization domain | VABS socialization domain | ||
| Daily living skills | VABS daily living skills domain | VABS daily living skills domain | VABS daily living skills domain | VABS daily living skills domain | ||
| Academic achievement | WIAT; ELM | WIAT | WIAT | WIAT | ||
| Problem behavior | CBCL | CBCL | CBCL | CBCL | ||
| Parent stress | NA | NA | NA | NA | ||
| Academic placement | Class placement | Class placement | Class placement | Class placement | ||
| Quality of life | NA | NA | NA | NA | ||
| ADI‐R: Autism Diagnostic Interview ‐ Revised (Lord 1994) | ||||||
| 'Risk of bias' item | Question | How risk of bias was assessed |
| Sequence generation | Was the sequence generation method used adequate? | We judged the risk of bias as follows:
|
| Allocation concealment | Was allocation adequately concealed? | We judged the risk of bias as follows:
|
| Blinding of participants and personnel | Were participants and personnel blind to which participants were in the treatment group? | We judged the risk of bias as follows:
|
| Blinding of outcome assessment | Were outcome assessors blind to which participants were in the treatment group? | We judged the risk of bias as follows:
|
| Incomplete outcome data | Did the trial authors deal adequately with missing data? | We judged the risk of bias as follows:
|
| Selective outcome reporting | Did the authors of the trial omit to report on any of their outcomes? | We judged the risk of bias as follows:
|
| Protection against contamination | Could the control group also have received the intervention? | We judged the risk of bias as follows:
|
| Baseline measurements | Were the intervention and control groups similar at baseline for chronological age, IQ, adaptive behavior skills, and communication skills? | We judged the risk of bias as follows:
|
| Other potential sources of bias | Through assessment, we determined whether any other source of bias was present in the trial, such as changing methods during the trial, or other anomalies. | We judged the risk of bias as follows:
|
| IQ: intelligence quotient | ||
| Analysis | Description of method | Reason not used |
| Measurement of treatment effect | Continuous data If outcomes are measured on a consistent scale across studies, we will calculate the effect of each study using the mean difference effect size. | As we needed to use the standardized mean difference (SMD) across most outcomes, we decided to report all effect sizes using the SMD effect size. |
| Dichotomous data If we locate dichotomous data, we will calculate a risk ratio with a 95% confidence interval for each outcome in each trial (Deeks 2017). | We did not locate dichotomous data. | |
| Unit of analysis issues | Cluster‐randomized trials If we locate cluster‐randomized trials, we will analyze them in accordance with the methods outlined in the Cochrane Handbook for Systematic Reviews of Interventions (Higgins 2011, 16.3). | We did not find cluster‐randomized trials. |
| Multiple treatment groups If we locate data from studies with multiple treatment groups, we will analyze each intervention group separately by dividing the sample size for the common comparator groups proportionately across each comparison (Higgins 2011, 16.5.5). | ||
| Assessment of reporting bias | If we identify 10 or more studies, we will draw funnel plots (estimated differences in treatment effects against their standard error). Asymmetry could be due to publication bias, but could also be due to a real relation between trial and effect size, such as when larger trials have lower compliance and compliance is positively related to effect size (Sterne 2011). If we find such a relation, we will examine clinical variation between the studies (Sterne 2011, 10.4). As a direct test for publication bias, we will conduct sensitivity analyses to compare the results from published data with data from other sources. We will do a funnel plot in an update of the review if enough additional trials are located. | We did not locate enough studies to assess reporting bias. |
| Subgroup analyses | If we locate enough trials, we will examine possible clinical and methodological heterogeneity using subgroup analyses. The possible subgroups that we will examine, if present, are: intervention density (intensity) and duration; type of comparison group (for example, home‐based TAU, school‐based TAU, no treatment control), and pre‐treatment participant characteristics (for example, chronological age, symptom severity, IQ, communicative ability, and level of adaptive behavior). | We did not conduct subgroup analyses due to the small number of included trials. |
| Sensitivity analyses | If we locate enough trials, we will explore the impact of studies with high risk of bias on the robustness of the results of the review in sensitivity analyses by removing studies with a high risk of bias on baseline measurements and blinding of outcome assessment, and reanalyzing the remaining studies to determine whether these factors affected the results. | We did not conduct sensitivity analyses due to the small number of included trials. |
| CCTs: controlled clinical trials | ||
| Outcome or subgroup title | No. of studies | No. of participants | Statistical method | Effect size |
| 1 Adaptive behavior Show forest plot | 5 | 202 | Mean Difference (IV, Random, 95% CI) | 9.58 [5.57, 13.60] |
| 2 Autism symptom severity Show forest plot | 2 | 81 | Std. Mean Difference (IV, Random, 95% CI) | ‐0.34 [‐0.79, 0.11] |
| 3 Intelligence Show forest plot | 5 | 202 | Mean Difference (IV, Random, 95% CI) | 15.44 [9.29, 21.59] |
| 4 Communication skills Show forest plot | 5 | 201 | Mean Difference (IV, Random, 95% CI) | 11.22 [5.39, 17.04] |
| 5 Language skills Show forest plot | 4 | Std. Mean Difference (IV, Random, 95% CI) | Subtotals only | |
| 5.1 Expressive language | 4 | 165 | Std. Mean Difference (IV, Random, 95% CI) | 0.51 [0.12, 0.90] |
| 5.2 Receptive language | 4 | 164 | Std. Mean Difference (IV, Random, 95% CI) | 0.55 [0.23, 0.87] |
| 6 Social competence Show forest plot | 5 | 201 | Mean Difference (IV, Random, 95% CI) | 6.56 [1.52, 11.61] |
| 7 Daily living skills Show forest plot | 5 | 201 | Mean Difference (IV, Random, 95% CI) | 7.77 [3.75, 11.79] |
| 8 Problem behavior Show forest plot | 2 | 67 | Std. Mean Difference (IV, Random, 95% CI) | ‐0.58 [‐1.24, 0.07] |
| 9 Academic placement Show forest plot | Other data | No numeric data | ||
| 10 Parent stress Show forest plot | 1 | Std. Mean Difference (IV, Random, 95% CI) | Totals not selected | |