| | Treatment Groups | Comparison Groups |
| Study | Outcomes | Pre‐Treatment | Post‐Treatment | Pre‐Treatment | Post‐Treatment |
| Cohen 2006 | Primary | Adaptive behavior | VABS composite | VABS composite | VABS composite | VABS composite |
| Autism severity | NA | NA | NA | NA |
| Secondary | IQ | BSID‐II; WPPSI‐R | BSID‐II; WPPSI‐R | BSID; WPPSI‐R | BSID‐II; WPPSI‐R |
| Non‐verbal IQ | MPS | MPS | MPS | MPS |
| Non‐verbal social communication | NA | NA | NA | NA |
| Expressive communication | RDLS | RDLS | RDLS | RDLS |
| Receptive communication | RDLS | RDLS | RDLS | RDLS |
| Play | NA | NA | NA | NA |
| Social competence | VABS socialization domain | VABS socialization domain | VABS socialization domain | VABS socialization domain |
| Daily living skills | VABS daily living skills domain | VABS daily living skills domain | VABS daily living skills domain | VABS daily living skills domain |
| Academic achievement | NA | NA | NA | NA |
| Problem behavior | NA | NA | NA | NA |
| Parent stress | NA | NA | NA | NA |
| Academic placement | NA | Class placement | NA | Class placement |
| Quality of life | NA | NA | NA | NA |
| Howard 2014 | Primary | Adaptive behavior | VABS composite; Denver; DP‐II; RIDES | VABS composite; Denver; DP‐II; RIDES | VABS composite | VABS composite |
| Autism severity | # of DSM‐IV criteria (APA 1994) | NA | # of DSM‐IV criteria | NA |
| Secondary | IQ | WPPSI‐R; BSID‐II; S‐B; DAYC; PEP‐R; DAS; DP‐II | WPPSI‐R, BSID‐II, S‐B; DAYC, PEP‐R, DAS | WPPSI‐R, BSID‐II, S‐B; DAS | WPPSI‐R, BSID‐II, S‐B; DAS |
| Non‐verbal IQ | MPS; S‐B | MPS; S‐B; Leiter‐R | MPS; S‐B | MPS; S‐B; Leiter‐R |
| Non‐verbal social communication | NA | NA | NA | NA |
| Expressive communication | RDLS; ITLS; REEL‐R; PLS‐3; ITDA; EVT; DP‐II | RDLS; ITLS; REEL‐R; PLS‐3; ITDA; EVT; EOWPVT | RDLS; ITLS; REEL‐R; PLS‐3; ITDA; EVT; DP‐II | RDLS; ITLS; REEL‐R; PLS‐3; ITDA; EVT; EOWPVT |
| Receptive communication | RDLS; ITLS; REEL‐R; PLS‐3; ITDA; PPVT‐III; DP‐II | RDLS; ITLS; REEL‐R; PLS‐3; PPVT‐III; ROWPVT; ITDA‐1 | RDLS; ITLS; REEL‐R; PLS‐3; PPVT‐III; DP‐II; ITDA‐1 | RDLS; ITLS; REEL‐R; PLS‐3; PPVT‐III, ROWPVT; ITDA‐1 |
| Play | NA | NA | NA | NA |
| Social competence | VABS socialization domain | VABS socialization domain | VABS socialization domain | VABS socialization domain |
| Daily living skills | VABS daily living skills domain | VABS daily living skills domain | VABS daily living skills domain | VABS daily living skills domain |
| Academic achievement | NA | NA | NA | NA |
| Problem behavior | NA | NA | NA | NA |
| Parent stress | NA | NA | NA | NA |
| Academic placement | NA | NA | NA | NA |
| Quality of life | NA | NA | NA | NA |
| Magiati 2007 | Primary | Adaptive behavior | VABS composite | VABS composite | VABS composite | VABS composite |
| Autism severity | ADI‐R | ADI‐R | ADI‐R | ADI‐R |
| Secondary | IQ | WPPSI‐R; BSID‐R; MPS | WPPSI‐R; BSID‐R; MPS | WPPSI‐R; BSID‐R; MPS | WPPSI‐R; BSID‐R; MPS |
| Non‐verbal IQ | NA | NA | NA | NA |
| Non‐verbal social communication | NA | NA | NA | NA |
| Expressive communication | EOWPVT‐R | EOWPVT‐R | EOWPVT‐R | EOWPVT‐R |
| Receptive communication | BPVS‐II | BPVS‐II | BPVS‐II | BPVS‐II |
| Play | SPT‐II | SPT‐II | SPT‐II | SPT‐II |
| Social competence | VABS socialization domain | VABS socialization domain | VABS socialization domain | VABS socialization domain |
| Daily living skills | VABS daily living skills domain | VABS daily living skills domain | VABS daily living skills domain | VABS daily living skills domain |
| Academic achievement | NA | NA | NA | NA |
| Problem behavior | NA | NA | NA | NA |
| Parent stress | NA | NA | NA | NA |
| Academic placement | NA | NA | NA | NA |
| Quality of life | NA | NA | NA | NA |
| Remington 2007 | Primary | Adaptive behavior | VABS composite | VABS composite | VABS composite | VABS composite |
| Autism severity | ASQ | ASQ | ASQ | ASQ |
| Secondary | IQ | BSID‐R; S‐B | BSID‐R; S‐B | BSID‐R; S‐B | BSID‐R; S‐B |
| Non‐verbal IQ | NA | NA | NA | NA |
| Non‐verbal social communication | ESCS | ESCS | ESCS | ESCS |
| Expressive communication | RDLS | RDLS | RDLS | RDLS |
| Receptive communication | RDLS | RDLS | RDLS | RDLS |
| Play | NA | NA | NA | NA |
| Social competence | VABS socialization domain | VABS socialization domain | VABS socialization domain | VABS socialization domain |
| Daily living skills | VABS daily living skills domain | VABS daily living skills domain | VABS daily living skills domain | VABS daily living skills domain |
| Academic achievement | NA | NA | NA | NA |
| Problem behavior | DCBC | DCBC | DCBD | DCBD |
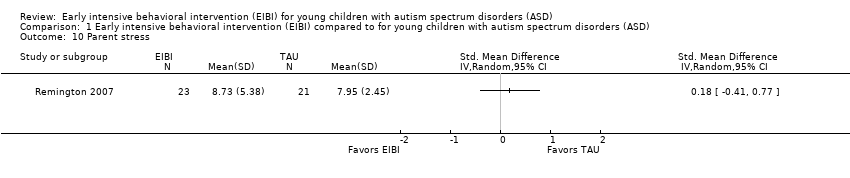
| Parent stress | QRS‐F parent and family problems subscale | QRS‐F parent and family problems subscale | QRS‐F parent and family problems subscale | QRS‐F parent and family problems subscale |
| Academic placement | NA | NA | NA | NA |
| Quality of life | NA | NA | NA | NA |
| Smith 2000 | Primary | Adaptive behavior | VABS composite | VABS composite | VABS composite | VABS composite |
| Autism severity | NA | NA | NA | NA |
| Secondary | IQ | BSID‐R; S‐B | BSID‐R; S‐B | BSID‐R; S‐B | BSID‐R; S‐B |
| Non‐verbal IQ | MPS | MPS | MPS | MPS |
| Non‐verbal social communication | NA | NA | NA | NA |
| Expressive communication | RDLS | RDLS | RDLS | RDLS |
| Receptive communication | RDLS | RDLS | RDLS | RDLS |
| Play | NA | NA | NA | NA |
| Social competence | VABS socialization domain | VABS socialization domain | VABS socialization domain | VABS socialization domain |
| Daily living skills | VABS daily living skills domain | VABS daily living skills domain | VABS daily living skills domain | VABS daily living skills domain |
| Academic achievement | WIAT; ELM | WIAT | WIAT | WIAT |
| Problem behavior | CBCL | CBCL | CBCL | CBCL |
| Parent stress | NA | NA | NA | NA |
| Academic placement | Class placement | Class placement | Class placement | Class placement |
| Quality of life | NA | NA | NA | NA |