Inhibidores de la enzima convertidora de angiotensina o bloqueadores de los receptores de angiotensina II tipo 1 perioperatorios para la prevención de la mortalidad y la morbilidad en adultos
Appendices
Appendix 1. Search strategies
MEDLINE (Ovid SP)
1. exp angiotensin‐converting‐enzyme‐inhibitors/ or (alacepril or benazepril* or captopril or ceranapril or cilazapril*or delapril or enalapril* or fosinopril* or imidapril or libenzapril or quinaprilat or ramipril* or rentiapril or saralasin or spirapril or temocapril hydrochloride or teprotide or trandolapril or zofenopril or cozaar or valsartan or diovan or telmisartan or micardis or candesartan or tasosartan or verdia or eprosartan or irbesartan).mp. or exp ramipril/ or exp receptors, angiotensin/ or exp losartan/
2. (surg* or perioperative or preoperative or intraoperative or postoperative).mp.
3. ((randomized controlled trial or controlled clinical trial).pt. or randomized.ab. or placebo.ab. or clinical trials as topic.sh. or randomly.ab. or trial.ti.) not (animals not (humans and animals)).sh.
4. 1 and 2 and 3
EMBASE (Ovid SP)
1. angiotensin‐converting‐enzyme‐inhibitors/ or alacepril/ or alacepril.mp. or benazepril/ or benazepril*.mp. or captopril/ or captopril.mp. or ceranapril/ or ceranapril*.mp. or cilazapril/ or cilazapril*.mp. or cilazaprilat/ or delapril/ or delapril.mp. or enalapril/ or enalapril*.mp. or enalaprilat/ or fosinopril/ or fosinopril*.mp. or fosinoprilic acid/ or fosinoprilic acid.mp. or imidapril/ or imidapril.mp. or libenzapril/ or libenzapril.mp. or quinaprilat/ or quinaprilat.mp. or ramipril/ or ramipril*.mp. or ramiprilat/ or rentiapril/ or rentiapril*.mp. or saralasin/ or saralasin.mp. or spirapril/ or spirapril.mp. or temocapril hydrochloride/ or temocapril hydrochloride.mp. or teprotide/ or teprotide.mp. or trandolapril/ or trandolapril.mp. or zofenopril/ or zofenopril.mp. or angiotensin II receptor blocker/ or losartan/ or losartan.mp. or cozaar/ or cozaar.mp. or valsartan/ or valsartan.mp. or diovan/ or diovan.mp. or telmisartan/ or telmisartan.mp. or micardis/ or micardis.mp. or candesartan/ or candesartan.mp. or tasosartan/ or tasosartan.mp. or verdia/ or verdia.mp. or eprosartan/ or eprosartan.mp. or irbesartan/ or irbesartan.mp.
2. (surg* or perioperative or preoperative or intraoperative or postoperative).ti,ab.
3. (placebo.sh. or controlled study.ab. or random*.ti,ab. or trial*.ti,ab. or ((singl* or doubl* or trebl* or tripl*) adj3 (blind* or mask*)).ti,ab.) not (animals not (humans and animals)).sh.
4. 1 and 2 and 3
The Cochrane Central Register of Controlled Trials (CENTRAL, the Cochrane Library)
#1 MeSH descriptor: [Angiotensin‐Converting Enzyme Inhibitors] explode all trees
#2 alacepril or benazepril* or captopril or ceranapril or cilazapril*or delapril or enalapril* or fosinopril* or imidapril or libenzapril or quinaprilat or ramipril* or rentiapril or saralasin or spirapril or temocapril hydrochloride or teprotide or trandolapril or zofenopril or cozaar or valsartan or diovan or telmisartan or micardis or candesartan or tasosartan or verdia or eprosartan or irbesartan
#3 MeSH descriptor: [Ramipril] explode all trees
#4 MeSH descriptor: [Receptors, Angiotensin] explode all trees
#5 MeSH descriptor: [Losartan] explode all trees
#6 #1 or #2 or #3 or #4
#7 surg* or perioperative or preoperative or intraoperative or postoperative
#8 #6 and #7
Appendix 2. Data extraction form
Study Selection, Quality Assessment & Data Extraction Form
| First author | Journal/Conference Proceedings etc | Year |
|
|
|
|
Study eligibility
| RCT/Quasi/CCT (delete as appropriate) | Relevant participants | Relevant interventions | Relevant outcomes |
|
Yes / No / Unclear |
Yes / No / Unclear |
Yes / No / Unclear |
Yes / No* / Unclear
|
* Issue relates to selective reporting, when authors may have taken measurements for particular outcomes, but not reported these within the paper(s). Reviewers should contact trialists for information on possible non‐reported outcomes & reasons for exclusion from publication. Study should be listed in Studies awaiting assessment until clarified. If no clarification is received after three attempts, study should then be excluded.
| Do not proceed if any of the above answers are 'No'. If study to be included in 'Excluded studies' section of the review, record below the information to be inserted into 'Table of excluded studies' |
| Freehand space for comments on study design and treatment: |
References to trial
Check other references identified in searches. If there are further references to this trial link the papers now & list below. All references to a trial should be linked under one Study ID in RevMan.
| Code each paper | Author(s) | Journal/Conference Proceedings etc | Year |
Participants and trial characteristics
| Participant characteristics | |
|
| Further details |
| Age (mean, median, range, etc) |
|
| Sex of participants (numbers / %, etc) |
|
| Disease status / type, etc 02(if applicable) |
|
| Comorbidities (diabetes, hypertension, etc) |
|
| Prior drug therapy (beta‐blockers, statins, ACEIs/ ARBs and other antihypertensive drugs) |
|
| Other |
|
Trial characteristics
seeAppendix 1, usually just completed by one reviewer
Methodological quality
|
| ||
| State here method used to generate allocation and reasons for grading | Grade (circle) |
|
|
| Low risk of bias |
|
|
| High risk of bias |
|
|
| Unclear |
|
|
| Blinding |
|
|
| Person responsible for participants care | Low/high/unclear |
|
| Participant | Low/high/unclear |
|
| Outcome assessor | Low/high/unclear |
|
| Other (please specify) | Low/high/unclear |
|
| Intention‐to‐treat An intention‐to‐treat analysis is one in which all the participants in a trial are analysed according to the intervention to which they were allocated, whether they received it or not. |
|
|
| All participants entering trial |
|
|
| 15% or fewer excluded |
|
|
| More than 15% excluded |
|
|
| Not analysed as 'intention‐to‐treat' |
|
|
| Unclear |
|
Were withdrawals described? Yes ? No ? not clear ?
Discuss if appropriate
Data extraction
| Outcomes relevant to your review Copy and paste from ‘Types of outcome measures’ | |
|
| Reported in paper (circle) |
| All cause mortality (up to 30 days postoperatively) | Yes / No |
| Long term all cause mortality | Yes / No |
| Rate of acute myocardial infarction (AMI) | Yes / No |
| Myocardial ischaemia | Yes / No |
| Cerebrovascular complications | Yes / No |
| Congestive heart failure | Yes / No |
| Length of hospital stay | Yes / No |
| For Continuous data | |||||||
| Code of paper |
Outcomes (rename) | Unit of measurement | Intervention group | Control group | Details if outcome only described in text | ||
|
|
|
| n | Mean (SD) | n | Mean (SD) |
|
| A etc | Length of hospital stay |
|
|
|
|
|
|
| For Dichotomous data | |||
| Code of paper | Outcomes (rename) | Intervention group (n) n = number of participants, not number of events | Control group (n) n = number of participants, not number of events |
| A | All cause mortality (up to 30 days postoperatively) |
|
|
|
| Long term all cause mortality |
|
|
|
| Rate of acute myocardial infarction (AMI) |
|
|
|
| Myocardial ischaemia |
|
|
|
| Cerebrovascular complications |
|
|
|
| Congestive heart failure |
|
|
| Other information which you feel is relevant to the results Indicate if: any data were obtained from the primary author; if results were estimated from graphs etc; or calculated by you using a formula (this should be stated and the formula given). In general if results not reported in paper(s) are obtained this should be made clear here to be cited in review. |
| Freehand space for writing actions such as contact with study authors and changes |
References to other trials
| Did this report include any references to published reports of potentially eligible trials not already identified for this review? | ||
| First author | Journal / Conference | Year of publication |
|
|
|
|
| Did this report include any references to unpublished data from potentially eligible trials not already identified for this review? If yes, give list contact name and details | ||
|
| ||
| Trial characteristics | |
|
| Further details |
| Single centre / multicentre |
|
| Country / Countries |
|
| How was participant eligibility defined?
|
|
| How many people were randomized? |
|
| Number of participants in each intervention group |
|
| Number of participants who received intended treatment |
|
| Number of participants who were analysed |
|
| Drug treatment(s) used |
|
| Dose / frequency of administration |
|
| Duration of treatment (State weeks / months, etc, if cross‐over trial give length of time in each arm) |
|
| Median (range) length of follow‐up reported in this paper (state weeks, months or years or if not stated) |
|
| Time‐points when measurements were taken during the study |
|
| Time‐points reported in the study |
|
| Time‐points you are using in RevMan |
|
| Trial design (e.g. parallel / cross‐over*) |
|
| Other |
|
* If cross‐over design, please refer to the Cochrane Editorial Office for further advice on how to analyse these data
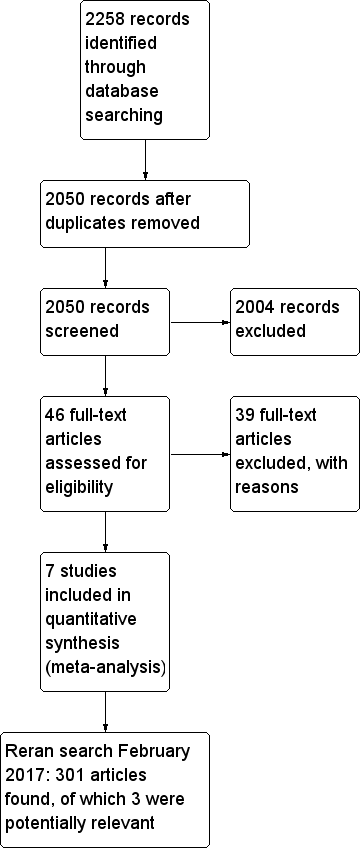
Flow diagram of study selection process.
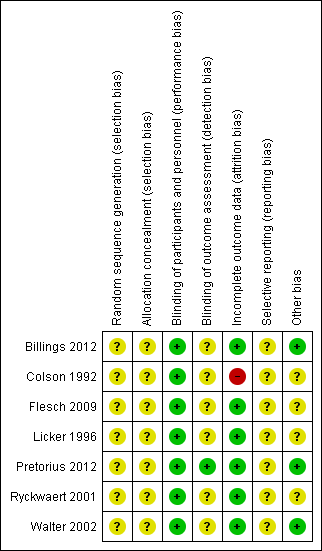
Risk of bias summary: review authors' judgements about each risk of bias item for each included study.

Risk of bias graph: review authors' judgements about each risk of bias item presented as percentages across all included studies.
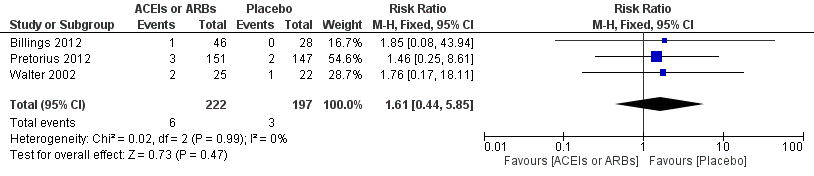
Forest plot of comparison: 1 All‐cause mortality, outcome: 1.1 All‐cause mortality.
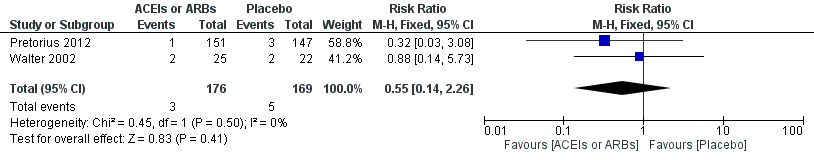
Forest plot of comparison: 1 ACEIs or ARBs versus placebo, outcome: 1.2 ST‐elevation or new Q wave in ECG test.
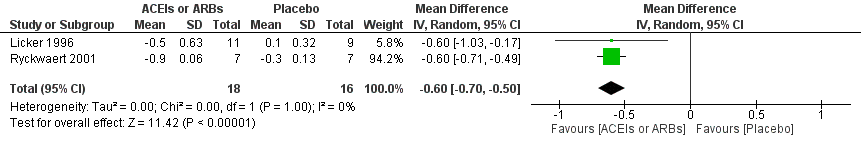
Forest plot of comparison: 1 ACEIs or ARBs versus placebo, outcome: 1.3 Cardiac index.

Forest plot of comparison: 1 ACEIs or ARBs versus placebo, outcome: 1.4 Rate of perioperative cerebrovascular complications.

Forest plot of comparison: 1 ACEIs or ARBs versus placebo, outcome: 1.5 Length of hospital stay.

Comparison 1 ACEIs or ARBs versus placebo, Outcome 1 All cause mortality.
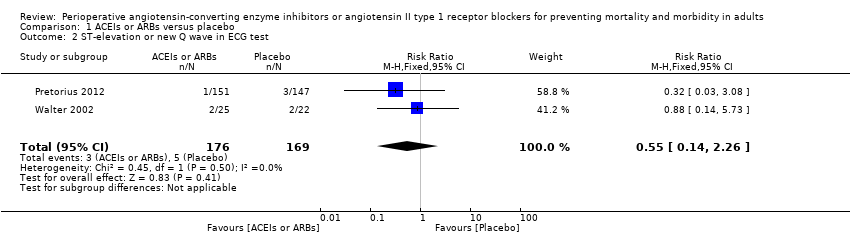
Comparison 1 ACEIs or ARBs versus placebo, Outcome 2 ST‐elevation or new Q wave in ECG test.

Comparison 1 ACEIs or ARBs versus placebo, Outcome 3 Cardiac index.
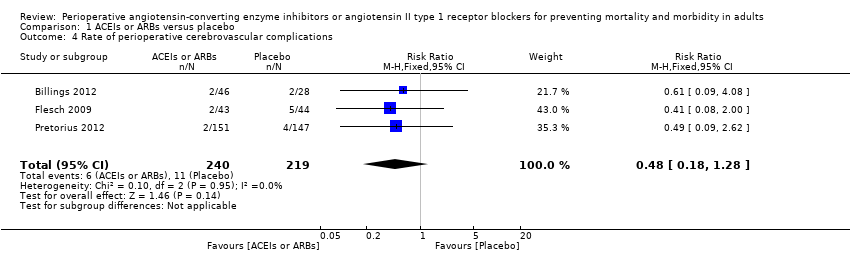
Comparison 1 ACEIs or ARBs versus placebo, Outcome 4 Rate of perioperative cerebrovascular complications.

Comparison 1 ACEIs or ARBs versus placebo, Outcome 5 Length of hospital stay.
| ACEIs or ARBs compared to placebo for preventing surgery‐related mortality and morbidity in adults | ||||||
| Patient or population: Patients undergoing any type of surgery under general anaesthesia receiving ACEIs or ARBs perioperatively | ||||||
| Outcomes | Illustrative comparative risks* (95% CI) | Relative effect | No of Participants | Quality of the evidence | Comments | |
| Assumed risk | Corresponding risk | |||||
| Placebo | ACEIs or ARBs | |||||
| All‐cause mortality | Study population | RR 1.61 | 419 | ⊕⊝⊝⊝ | All the included trials were at high risk of bias. Total sample size is lower than the calculated. Duration of follow‐up: until discharge from hospital | |
| 16 per 1000 | 25 per 1000 | |||||
| Moderate | ||||||
| 7 per 1000 | 11 per 1000 | |||||
| Risk of acute myocardial ischaemia | Study population | RR 0.55 | 345 | ⊕⊝⊝⊝ | All the included trials were at high risk of bias. Total sample size is lower than the calculated. Duration of follow‐up: until discharge from hospital | |
| 30 per 1000 | 16 per 1000 | |||||
| Moderate | ||||||
| 56 per 1000 | 31 per 1000 | |||||
| Congestive heart failure | The mean cardiac index in the intervention groups was | ‐ | 34 | ⊕⊝⊝⊝ | All the included trials were at high risk of bias. Total population size is less than 400. Duration of follow‐up: not specified | |
| Hypotension | ‐ | RR 1.95 (0.86 to 4.41) | 298 (1 study) | ⊕⊝⊝⊝ | All the included trials were at high risk of bias. Total population size is less than 400. Duration of follow‐up: not specified | |
| Rate of perioperative cerebrovascular complications | Study population | RR 0.48 | 459 | ⊕⊝⊝⊝ | All the included trials were at high risk of bias. Duration of follow‐up: until discharge from hospital (Billings 2012; Pretorius 2012); 90 days after surgery (Flesch 2009) | |
| 50 per 1000 | 24 per 1000 | |||||
| Moderate | ||||||
| 71 per 1000 | 34 per 1000 | |||||
| Length of hospital stay | The mean length of hospital stay in the intervention groups was | ‐ | 372 | ⊕⊝⊝⊝ | All the included trials were at high risk of bias. Total population size is less than 400. Duration of follow‐up: until discharge from hospital | |
| Treatment related adverse events | ‐ | ‐ | ‐ | 385 (2 studies) | ⊕⊝⊝⊝ | All the included trials were at high risk of bias. Total population size is less than 400. Authors did not provided detailed information on adverse events, which made the synthesis of the results less clinically relevant. |
| *The basis for the assumed risk (e.g. the median control group risk across studies) is provided in footnotes. The corresponding risk (and its 95% confidence interval) is based on the assumed risk in the comparison group and the relative effect of the intervention (and its 95% CI). | ||||||
| GRADE Working Group grades of evidence | ||||||
| 1Downgraded by three levels due to very serious study limitations (all the trials included were at high risk of bias) and serious imprecision (total population size is less than 400). | ||||||
| Outcome or subgroup | Studies | Participants | Statistical method | Effect estimate |
| Rate of hypotension | 1 | 298 | Risk Ratio (M‐H, Fixed, 95% CI) | 1.95 [0.86, 4.41] |
| Risk ratio < 1 favours angiotensin‐converting enzyme inhibitors and angiotensin II type 1 receptor blockers group. Risk ratio > 1 favours control group. | ||||
| Outcome or subgroup | Studies | Participants | Statistical method | Effect estimate |
| Glomerular filtration rate | 1 | 16 | Mean Difference (IV, Random, 95% CI) | ‐1.40 [‐10.30, 7.50] |
| IV ‐ inverse variance IV: intravenous | ||||
| Outcome or subgroup title | No. of studies | No. of participants | Statistical method | Effect size |
| 1 All cause mortality Show forest plot | 3 | 419 | Risk Ratio (M‐H, Fixed, 95% CI) | 1.61 [0.44, 5.85] |
| 2 ST‐elevation or new Q wave in ECG test Show forest plot | 2 | 345 | Risk Ratio (M‐H, Fixed, 95% CI) | 0.55 [0.14, 2.26] |
| 3 Cardiac index Show forest plot | 2 | 34 | Mean Difference (IV, Random, 95% CI) | ‐0.60 [‐0.70, ‐0.50] |
| 4 Rate of perioperative cerebrovascular complications Show forest plot | 3 | 459 | Risk Ratio (M‐H, Fixed, 95% CI) | 0.48 [0.18, 1.28] |
| 5 Length of hospital stay Show forest plot | 2 | 372 | Mean Difference (IV, Fixed, 95% CI) | ‐0.54 [‐0.93, ‐0.16] |