Scolaris Content Display Scolaris Content Display

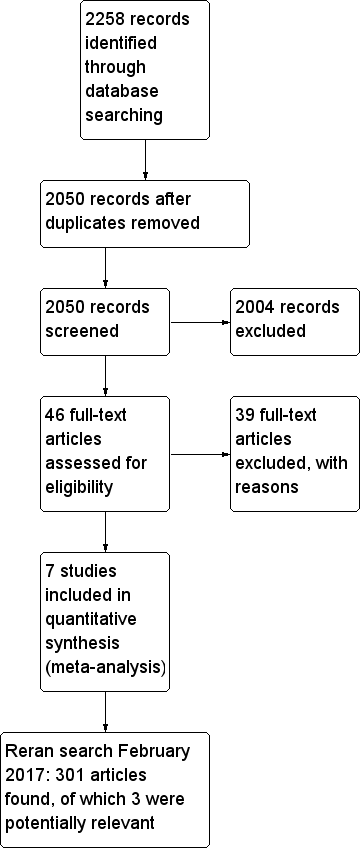
Flow diagram of study selection process.
Figuras y tablas -
Figure 1

Flow diagram of study selection process.

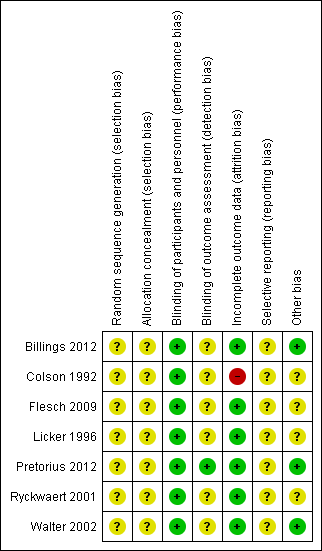
Risk of bias summary: review authors' judgements about each risk of bias item for each included study.
Figuras y tablas -
Figure 2

Risk of bias summary: review authors' judgements about each risk of bias item for each included study.

Risk of bias graph: review authors' judgements about each risk of bias item presented as percentages across all included studies.
Figuras y tablas -
Figure 3

Risk of bias graph: review authors' judgements about each risk of bias item presented as percentages across all included studies.

Forest plot of comparison: 1 All‐cause mortality, outcome: 1.1 All‐cause mortality.
Figuras y tablas -
Figure 4

Forest plot of comparison: 1 All‐cause mortality, outcome: 1.1 All‐cause mortality.

Forest plot of comparison: 1 ACEIs or ARBs versus placebo, outcome: 1.2 ST‐elevation or new Q wave in ECG test.
Figuras y tablas -
Figure 5

Forest plot of comparison: 1 ACEIs or ARBs versus placebo, outcome: 1.2 ST‐elevation or new Q wave in ECG test.

Forest plot of comparison: 1 ACEIs or ARBs versus placebo, outcome: 1.3 Cardiac index.
Figuras y tablas -
Figure 6

Forest plot of comparison: 1 ACEIs or ARBs versus placebo, outcome: 1.3 Cardiac index.

Forest plot of comparison: 1 ACEIs or ARBs versus placebo, outcome: 1.4 Rate of perioperative cerebrovascular complications.
Figuras y tablas -
Figure 7

Forest plot of comparison: 1 ACEIs or ARBs versus placebo, outcome: 1.4 Rate of perioperative cerebrovascular complications.

Forest plot of comparison: 1 ACEIs or ARBs versus placebo, outcome: 1.5 Length of hospital stay.
Figuras y tablas -
Figure 8

Forest plot of comparison: 1 ACEIs or ARBs versus placebo, outcome: 1.5 Length of hospital stay.

Comparison 1 ACEIs or ARBs versus placebo, Outcome 1 All cause mortality.
Figuras y tablas -
Analysis 1.1

Comparison 1 ACEIs or ARBs versus placebo, Outcome 1 All cause mortality.

Comparison 1 ACEIs or ARBs versus placebo, Outcome 2 ST‐elevation or new Q wave in ECG test.
Figuras y tablas -
Analysis 1.2

Comparison 1 ACEIs or ARBs versus placebo, Outcome 2 ST‐elevation or new Q wave in ECG test.

Comparison 1 ACEIs or ARBs versus placebo, Outcome 3 Cardiac index.
Figuras y tablas -
Analysis 1.3

Comparison 1 ACEIs or ARBs versus placebo, Outcome 3 Cardiac index.

Comparison 1 ACEIs or ARBs versus placebo, Outcome 4 Rate of perioperative cerebrovascular complications.
Figuras y tablas -
Analysis 1.4

Comparison 1 ACEIs or ARBs versus placebo, Outcome 4 Rate of perioperative cerebrovascular complications.

Comparison 1 ACEIs or ARBs versus placebo, Outcome 5 Length of hospital stay.
Figuras y tablas -
Analysis 1.5

Comparison 1 ACEIs or ARBs versus placebo, Outcome 5 Length of hospital stay.

Summary of findings for the main comparison. ACEIs or ARBs compared to placebo for preventing surgery‐related mortality and morbidity in adults

ACEIs or ARBs compared to placebo for preventing surgery‐related mortality and morbidity in adults

Patient or population: Patients undergoing any type of surgery under general anaesthesia receiving ACEIs or ARBs perioperatively
Settings: All settings
Intervention: ACEIs or ARBs
Comparison: Placebo

Outcomes

Illustrative comparative risks* (95% CI)

Relative effect
(95% CI)

No of Participants
(studies)

Quality of the evidence
(GRADE)

Comments

Assumed risk

Corresponding risk

Placebo

ACEIs or ARBs

All‐cause mortality

Study population

RR 1.61
(0.44 to 5.85)

419
(3 studies)

⊕⊝⊝⊝
very low1

All the included trials were at high risk of bias.

Total sample size is lower than the calculated.

Duration of follow‐up: until discharge from hospital

16 per 1000

25 per 1000
(7 to 90)

Moderate

7 per 1000

11 per 1000
(3 to 41)

Risk of acute myocardial ischaemia

Study population

RR 0.55
(0.14 to 2.26)

345
(2 studies)

⊕⊝⊝⊝
very low1

All the included trials were at high risk of bias.

Total sample size is lower than the calculated.

Duration of follow‐up: until discharge from hospital

30 per 1000

16 per 1000
(4 to 67)

Moderate

56 per 1000

31 per 1000
(8 to 127)

Congestive heart failure

The mean cardiac index in the intervention groups was
0.6 higher
(0.7 to 0.5 higher)

34
(2 studies)

⊕⊝⊝⊝
very low1

All the included trials were at high risk of bias.

Total population size is less than 400.

Duration of follow‐up: not specified

Hypotension

RR 1.95 (0.86 to 4.41)

298 (1 study)

⊕⊝⊝⊝
very low1

All the included trials were at high risk of bias.

Total population size is less than 400.

Duration of follow‐up: not specified

Rate of perioperative cerebrovascular complications

Study population

RR 0.48
(0.18 to 1.28)

459
(3 studies)

⊕⊝⊝⊝
very low1

All the included trials were at high risk of bias.

Duration of follow‐up: until discharge from hospital (Billings 2012; Pretorius 2012); 90 days after surgery (Flesch 2009)

50 per 1000

24 per 1000
(9 to 65)

Moderate

71 per 1000

34 per 1000
(13 to 92)

Length of hospital stay

The mean length of hospital stay in the intervention groups was
0.54 lower
(0.93 lower to 0.16 lower)

372
(2 studies)

⊕⊝⊝⊝
very low1

All the included trials were at high risk of bias.

Total population size is less than 400.

Duration of follow‐up: until discharge from hospital

Treatment related adverse events

385 (2 studies)

⊕⊝⊝⊝
very low1

All the included trials were at high risk of bias.

Total population size is less than 400.

Authors did not provided detailed information on adverse events, which made the synthesis of the results less clinically relevant.

*The basis for the assumed risk (e.g. the median control group risk across studies) is provided in footnotes. The corresponding risk (and its 95% confidence interval) is based on the assumed risk in the comparison group and the relative effect of the intervention (and its 95% CI).
ACEIs: angiotensin‐converting enzyme inhibitors; ARBs: angiotensin II type 1 receptor blockers; CI: confidence interval; ECG: electrocardiograph; RR: risk ratio

GRADE Working Group grades of evidence
High quality: Further research is very unlikely to change our confidence in the estimate of effect.
Moderate quality: Further research is likely to have an important impact on our confidence in the estimate of effect and may change the estimate.
Low quality: Further research is very likely to have an important impact on our confidence in the estimate of effect and is likely to change the estimate.
Very low quality: We are very uncertain about the estimate.

1Downgraded by three levels due to very serious study limitations (all the trials included were at high risk of bias) and serious imprecision (total population size is less than 400).

Figuras y tablas -
Summary of findings for the main comparison. ACEIs or ARBs compared to placebo for preventing surgery‐related mortality and morbidity in adults
Table 1. Rate of hypotension

Outcome or subgroup

Studies

Participants

Statistical method

Effect estimate

Rate of hypotension

1

298

Risk Ratio (M‐H, Fixed, 95% CI)

1.95 [0.86, 4.41]

Risk ratio < 1 favours angiotensin‐converting enzyme inhibitors and angiotensin II type 1 receptor blockers group. Risk ratio > 1 favours control group.

Figuras y tablas -
Table 1. Rate of hypotension
Table 2. Glomerular filtration rate

Outcome or subgroup

Studies

Participants

Statistical method

Effect estimate

Glomerular filtration rate

1

16

Mean Difference (IV, Random, 95% CI)

‐1.40 [‐10.30, 7.50]

IV ‐ inverse variance

IV: intravenous

Figuras y tablas -
Table 2. Glomerular filtration rate
Comparison 1. ACEIs or ARBs versus placebo

Outcome or subgroup title

No. of studies

No. of participants

Statistical method

Effect size

1 All cause mortality Show forest plot

3

419

Risk Ratio (M‐H, Fixed, 95% CI)

1.61 [0.44, 5.85]

2 ST‐elevation or new Q wave in ECG test Show forest plot

2

345

Risk Ratio (M‐H, Fixed, 95% CI)

0.55 [0.14, 2.26]

3 Cardiac index Show forest plot

2

34

Mean Difference (IV, Random, 95% CI)

‐0.60 [‐0.70, ‐0.50]

4 Rate of perioperative cerebrovascular complications Show forest plot

3

459

Risk Ratio (M‐H, Fixed, 95% CI)

0.48 [0.18, 1.28]

5 Length of hospital stay Show forest plot

2

372

Mean Difference (IV, Fixed, 95% CI)

‐0.54 [‐0.93, ‐0.16]

Figuras y tablas -
Comparison 1. ACEIs or ARBs versus placebo