Intervenciones no farmacológicas para el dolor crónico en pacientes con lesión de la médula espinal
Resumen
Antecedentes
El dolor crónico es frecuente en los pacientes que presentan lesión de la médula espinal (LME). Convencionalmente, el dolor se trata con fármacos, no obstante, la medicación para el dolor a largo plazo a menudo no es eficaz y se asocia con efectos secundarios. Con frecuencia se recomiendan intervenciones no farmacológicas, aunque los perfiles de beneficios y de efectos perjudiciales de estos tratamientos no están bien establecidos, en parte debido a los defectos metodológicos de los estudios disponibles.
Objetivos
Evaluar de forma crítica y sintetizar las pruebas de investigación disponibles sobre los efectos de las intervenciones no farmacológicas para el tratamiento del dolor crónico neuropático y nociceptivo en pacientes que presentan LME.
Métodos de búsqueda
La búsqueda se realizó el 1 de marzo 2011. Se hicieron búsquedas en el registro especializado del Grupo Cochrane de Lesiones (Cochrane Injuries Group), Registro Cochrane Central de Ensayos Controlados (Cochrane Central Register of Controlled Trials) (CENTRAL), MEDLINE (OvidSP), Embase (OvidSP), PsycINFO (OvidSP), en otras cuatro bases de datos y en registros de ensayos clínicos. Además, se realizaron búsquedas manuales en las actas de tres conferencias científicas principales sobre LME. Se actualizó esta búsqueda en noviembre 2014, pero estos resultados aún no han sido incorporados.
Criterios de selección
Ensayos controlados aleatorios de cualquier intervención que no incluyera la administración de medicación u otras sustancias activas para tratar el dolor crónico en pacientes con LME.
Obtención y análisis de los datos
Dos autores de la revisión, de forma independiente, extrajeron los datos y evaluaron el riesgo de sesgo de los estudios incluidos. El resultado primario fue cualquier medida de la intensidad del dolor o el alivio del dolor. Los resultados secundarios incluyeron eventos adversos, ansiedad, depresión y calidad de vida. De ser posible, se realizaron metanálisis para calcular las diferencias de medias estandarizadas para cada tipo de intervención.
Resultados principales
Se identificaron 16 ensayos con un total de 616 participantes. Se estudiaron ocho tipos diferentes de intervenciones. Ocho ensayos investigaron los efectos de la estimulación eléctrica cerebral (estimulación transcraneal con corriente directa [ETCD] y estimulación craneal con electroterapia [ECE]; cinco ensayos) o la estimulación magnética transcraneal repetitiva (EMTr; tres ensayos). Las intervenciones en los estudios restantes incluyeron programas de ejercicios (tres ensayos); acupuntura (dos ensayos); autohipnosis (un ensayo); estimulación nerviosa eléctrica transcutánea (ENET) (un ensayo); y un programa cognitivo conductual (un ensayo). Se consideró que ninguno de los ensayos incluidos presentó riesgo general bajo de sesgo. Doce estudios tenían alto riesgo de sesgo general, y en cuatro estudios, el riesgo de sesgo era incierto. La calidad general de los estudios incluidos fue débil. La validez de los mismos se vio deteriorada por defectos metodológicos, como la elección inapropiada de los grupos de control. Una búsqueda adicional en noviembre 2014 identificó estudios más recientes que se incluirán en una actualización de esta revisión.
Para la ETCD la diferencia de medias agrupada entre los grupos de intervención y de control en las puntuaciones del dolor en una escala analógica visual de 11 puntos (EAV) (0‐10) fue una reducción de ‐1,90 unidades (intervalo de confianza [IC] del 95%: ‐3,48 a ‐0,33; valor de P 0,02) a corto plazo y de ‐1,87 (IC del 95%: ‐3,30 a ‐0,45; valor de P 0,01) a plazo medio. Los programas de ejercicios dieron lugar a reducciones medias del dolor del hombro crónico de ‐1,9 puntos en la puntuación para el Short Form‐36 (SF‐36) de 36 ítems en cuanto a la experiencia del dolor (IC del 95%: ‐3,4 a ‐0,4; valor de P 0,01) y de ‐2,8 unidades en la EAV del dolor (IC del 95%: ‐3,77 a ‐1,83; Valor de p < 0,00001); esta reducción representó los efectos de tratamiento más significativos que se observaron en los estudios incluidos. Los ensayos que utilizaron EMTr, ECE, acupuntura, autohipnosis, ENET o un programa cognitivo conductual no proporcionaron pruebas de que estas intervenciones alivien el dolor crónico. Diez ensayos examinaron variables de evaluación diferentes del dolor, incluida la ansiedad, la depresión y la calidad de vida, aunque los datos disponibles fueron demasiado escasos para establecer conclusiones firmes. En cuatro ensayos no se informaron efectos secundarios de las intervenciones en estudio. Cinco ensayos informaron efectos secundarios leves transitorios. En términos generales, se encontró una escasez de pruebas sobre cualquier efecto secundario grave o duradero de las intervenciones.
Conclusiones de los autores
Las pruebas son insuficientes para sugerir que los tratamientos no farmacológicos son efectivos para aliviar el dolor crónico en pacientes que presentan LME. Los efectos beneficiosos y perjudiciales de los tratamientos no farmacológicos para el dolor utilizados comúnmente deben investigarse en ensayos controlados aleatorios con tamaños de la muestra y metodología de estudio adecuados.
PICO
Resumen en términos sencillos
Tratamientos diferentes de la medicación para pacientes con dolor crónico después de una lesión de la médula espinal
Muchos pacientes que conviven con una lesión de la médula espinal (LME) presentan dolor crónico. Además de fármacos para el dolor, se ofrecen habitualmente otras posibilidades de tratamiento. Esta revisión sistemática procura resumir las pruebas disponibles sobre la efectividad y los efectos secundarios posibles de otras formas de tratamiento.
Se realizaron búsquedas en bases de datos electrónicas hasta marzo de 2011 y se encontraron 16 ensayos controlados aleatorios con un total de 616 participantes. Se agruparon estos estudios por tipo de tratamiento en ocho grupos: Ocho estudios examinaron la estimulación cerebral, de los cuales cinco utilizaron estimulación electrónica y tres, estimulación magnética. Tres estudios examinaron programas de ejercicios, dos acupuntura, uno autohipnosis, y uno la estimulación nerviosa eléctrica transcutánea (ENET) y un programa cognitivo conductual. Los estudios incluidos usaron una variedad de métodos diferentes para medir el dolor y otros resultados. Los grupos de comparación también variaron e incluyeron intervenciones de simulacro, listas de espera y otros tratamientos para el dolor.
Para cualquier tipo determinado de intervención, se encontraron solamente unos pocos estudios que incluían un número reducido de participantes. Con frecuencia, los detalles informados fueron insuficientes. La calidad general de los estudios fue baja. Por ejemplo, varios estudios usaron grupos de comparación inapropiados como las listas de espera. En consecuencia, la eficacia de los tratamientos es incierta. Una búsqueda adicional en noviembre 2014 identificó estudios más recientes que se incluirán en una actualización de esta revisión.
Para un tipo de tratamiento, estimulación transcraneal con corriente directa (ETCD), los resultados de dos estudios pudieron combinarse. Los resultados agrupados indican que la ETCD alivió el dolor a corto plazo y a plazo medio. Además, los programas de ejercicio para el dolor del hombro crónico proporcionaron alivio del dolor. No se hallaron pruebas para sugerir que la estimulación magnética transcraneal repetitiva (EMTr), la estimulación craneal con electroterapia (ECE), la acupuntura, la autohipnosis o la ENET son mejores que las intervenciones de control respectivas para aliviar el dolor crónico. Con respecto a los resultados diferentes del dolor, como la ansiedad, la depresión o la calidad de vida, así como los efectos secundarios duraderos, no fue posible establecer ninguna conclusión general debido a que los datos fueron escasos. Los estudios incluidos no permiten extraer conclusiones firmes con respecto a si los tratamientos diferentes de la medicación para el dolor causado por una LME crónica son efectivos y seguros. Se necesitan ensayos con números mayores de participantes y una mejor calidad de estudio para determinar la efectividad y la seguridad de dichos tratamientos.
Authors' conclusions
Background
Relevance
Chronic pain is a frequent and serious health problem for people living with spinal cord injury (SCI). Depending on the definition of pain and the study population, between 30% and 90% of people with SCI experience pain and describe it as a problem (Ballinger 2000; Salisbury 2003; Sie 1992). About one‐third of affected people experience pain as severe and debilitating (Siddall 2006). Pain has a significant impact on the physical, cognitive and emotional functioning of persons with SCI (Jensen 2007; Putzke 2002; Widerstrom‐Noga 2008). In addition, it substantially affects their quality of life and independence in activities of daily living (ADLs) and work. For instance, persons experiencing chronic shoulder pain frequently need substantially more physical assistance and incur greater risk of unemployment than those without such pain (Jensen 2005).
Classification
In able‐bodied individuals, chronic pain is defined as pain that persists past the normal time of healing and is present continuously or intermittently for at least three to six months (Dijkers 2009; Merskey 1994). To discriminate between acute and chronic pain, a cutoff of three months is often used in clinical practice, and a minimum duration of six months is preferable for research purposes. Unfortunately many published studies fail to provide an operational definition of chronic pain (Dijkers 2009).
Commonly used classification systems for SCI pain are based on aetiology (neuropathic/nociceptive pain), anatomical level of the injury or quality of pain (e.g. burning, dull). A literature review identified 28 different classification schemes used between 1949 and 2000 (Hicken 2002). In the absence of consensus on the classification of chronic SCI pain, previous pain studies have employed several different classifications. For the purpose of this systematic review, we employed the framework proposed by the Task Force for Pain Following Spinal Cord Injury of the International Association for the Study of Pain (Siddall 2000; Siddall 2001), which broadly distinguishes neuropathic and nociceptive pain.
Neuropathic pain is usually generated within the central nervous system, for instance following a spinal cord lesion or a pathological process, and is sometimes called ‘central pain.’ Less frequently, it has a peripheral origin, for instance, when a disease affects the nerve roots. Neuropathic pain typically continues long after elimination of the peripheral cause of acute pain and can be localised at the level of the neurological lesion or below. Generally, at‐level pain refers to pain occurring anywhere within the dermatome of the neurological injury and up to three levels below it. Below‐level pain occurs diffusely more than three dermatomes below the level of the neurological lesion. Pain that is at‐level or below‐level pain is usually described as burning, electrical or shooting. This pain may be unilateral or bilateral and may be associated with allodynia or hyperalgesia. Besides pain originating in the spinal cord lesion or from a spinal cord disease, other types of neuropathic pain may occur above or below the neurological level of injury, for example, as a symptom of diabetic neuropathy or compressive mononeuropathy (Widerstrom‐Noga 2008; Widerström‐Noga 2009).
Nociceptive pain is generally related to the musculoskeletal system and often is associated with movement. It is usually located at or above the neurological level of the SCI and is described as dull or aching. Nociceptive pain is frequently due to overuse of the shoulders or wrists. It may also originate in the visceral structures of the abdomen or thorax. Visceral nociceptive pain is frequently an indicator of an underlying pathology or dysfunction, such as infection or obstruction. Other types of nociceptive pain include headache and pain related to skin ulcers (Widerstrom‐Noga 2008; Widerström‐Noga 2009).
Interventions
For both neuropathic and nociceptive types of pain, pharmacological and non‐pharmacological interventions are available. Several studies have shown that chronic pain after SCI is often refractory to pharmacological treatment (SCIRE 2010). In addition, long‐term pain medication is associated with unwanted side effects such as constipation or toxicity and increased risk of addiction or abuse. Consequently, many people living with SCI and their attending healthcare professionals consider non‐pharmacological therapies as an alternative or adjunctive pain treatment (Cardenas 2006; Nayak 2001). However, the benefit and harm profile of these treatments remains unclear (Siddall 2006a). A paucity of well‐designed interventional studies have explored the effects of non‐pharmacological interventions for the treatment of chronic pain. A particular problem is the use of inappropriate control interventions such as waiting lists. It has been shown that in direct comparisons, placebo interventions tend to be superior to control interventions with no treatment or with waiting lists, in particular for pain outcomes (Hróbjartsson 2010). Currently, it is therefore difficult to make evidence‐based decisions on the use of non‐pharmacological treatments for chronic pain in persons with SCI.
Objectives
To critically appraise and synthesise available research evidence on the effects of non‐pharmacological interventions for the treatment of chronic neuropathic and nociceptive pain in people living with SCI.
Methods
Criteria for considering studies for this review
Types of studies
We included published and unpublished randomised controlled trials (RCTs) with and without blinding of participants and/or investigators.
Types of participants
We included trials conducted in people living with SCI irrespective of their age, gender and severity of disability. Both traumatic and non‐traumatic SCI aetiologies were considered. Studies were considered to focus on chronic pain if (1) the publication stated that the study was conducted to explore chronic pain, or (2) most participants with the pain problem lived in a community setting or (3) most participants suffered from pain longer than three months. Given that definitions for pain chronicity varied in the primary studies, we used the shorter minimal pain duration of three months (as compared with six months) to be inclusive.
Studies that included individuals with conditions other than SCI were included only if data from the SCI subgroup could be extracted separately by using the published data or by using additional data obtained from the study authors upon request.
Types of interventions
Experimental interventions
Non‐pharmacological study interventions were defined as experimental pain therapies that do not involve taking medicine or any other active substance. Eligible therapies included surgical interventions, exercise, acupuncture, massage, joint mobilisation, relaxation training, thermotherapy (warm or cold pack application), transcutaneous electrical nerve stimulation (TENS), static magnetic field therapy, brain stimulation and psychological or behavioural therapies (e.g. cognitive behavioural therapy, visual imaging, hypnotic therapy). Studies on other interventions, such as use of durable equipment, were considered only if the focus was on treatment of individuals with chronic pain.
Control interventions
Control interventions included active pharmacological or non‐pharmacological treatments, placebo and sham interventions or waiting list groups.
Types of outcome measures
Primary outcomes
Primary outcome measures consisted of any measure of pain on scales for pain intensity or pain relief. Included studies used various pain measures and measurement schemes during follow‐up, including numerical rating scales (NRSs), visual analogue scales (VASs) and pain questionnaires (e.g. McGill Pain Questionnaire, Wheelchair User's Shoulder Pain Index (WUSPI), Short Form (SF)‐36). Details on the observation period were extracted from the original reports. From studies that reported several outcome measures of pain, we extracted data for all measures and selected the most frequently reported measure across included studies for use in meta‐analysis. However, if we found a serious imbalance among baseline pain scores between intervention and control groups for the most common measure, we chose a pain measure without imbalance for further analysis.
Secondary outcomes
Secondary outcomes were measures of anxiety, depression or quality of life, as well as data on adverse events. The included studies used various instruments for measurement including NRSs or VASs for anxiety, and validated questionnaires for quality of life and depression, such as the Beck Depression Inventory (BDI), the Subjective Quality of Life Scale (SQOL) and the Perceived Quality of Life Scale (PQOL).
Search methods for identification of studies
In order to reduce publication and retrieval bias we did not restrict our search by language, date or publication status.
Electronic searches
The Cochrane Injuries Group Trials Search Co‐ordinator searched the following:
-
Cochrane Injuries Group Specialised Register (28 February 2011);
-
Cochrane Central Register of Controlled Trials (CENTRAL) (2011, Issue 1 of 12);
-
MEDLINE(OvidSP) (1948 to February week3 2011);
-
Embase (OvidSP) (1974 to 2011 Week 08);
-
PsycINFO (OvidSP) (1980 to 2011 week 7);
-
ISI Web of Science: Science Citation Index Expanded (SCI‐EXPANDED) (1970 to February 2011);
-
ISI Web of Science: Conference Proceedings Citation Index‐Science (CPCI‐S) (1990 to February 2011);
-
CINAHL Plus (EBSCO Host) (1939 to February 2011);
-
Physiotherapy Evidence Database (PEDro) (February 2011);
-
Allied and Complementary Medicine Database (AMED) (1996 to February 2011).
Search strategies are listed in Appendix 1.
We performed a further search in November 2014. Those results have been added to Studies awaiting classification and will be incorporated into the review at the next update.
Searching other resources
We screened the reference lists of included studies and other relevant papers (e.g. review articles) for additional eligible studies. We contacted two experts in the field and asked them to identify additional studies. We also manually searched the proceedings of three major scientific conferences on SCI: the meetings of the American Paraplegia Society (APS; 2001, 2004 to 2009), the American Spinal Injury Association (ASIA; 1998 to 2001, 2004 to 2010) and the International Spinal Cord Society (ISCOS; 2005 to 2010). We also searched the World Health Organization (WHO) International Clinical Trials Registry Platform (ICTRP) (to 16 March 2011).
Data collection and analysis
The Cochrane Injuries Group Trials Search Co‐ordinator designed the search strategy, ran the searches described above and collated the search results in an Endnote database. Duplicates were removed before search results were sent to the review authors.
Selection of studies
Two review authors (EvE and IB) screened the titles and abstracts of studies identified in the literature search for eligibility. One review author (IB) made an initial selection of eligible references and excluded those that were clearly not eligible. Based on titles and abstracts, both review authors independently selected studies for further consideration. Differences in selection were discussed and decisions made by consensus. Full‐text versions of selected articles were retrieved from the library and again were rated independently by both review authors for inclusion or exclusion. Studies were included by joint decision. Studies with uncertain inclusion status at this stage were read by an additional review author (MWGB or IEH). The three review authors then discussed inclusion of this study until agreement could be reached. At both stages of study selection, initial disagreement was due to neglect of a selection criterion by one review author. If a study was excluded at this stage, we kept a copy of the article. References and reasons for exclusion are listed under Characteristics of excluded studies.
Data extraction and management
For each included trial, two review authors (IB and one of EvE, IEH or MWGB) independently extracted study data using a standardised data extraction form. Data extraction comprised the following.
-
Year of study conduct and year of publication, along with geographical location of the study.
-
Number, age and gender of participants and type of SCI.
-
Type of pain (neuropathic/nociceptive) targeted by the study intervention.
-
Type of study intervention and treatment duration.
-
Type of control intervention and treatment duration.
-
Duration of study recruitment and follow‐up.
-
Occurrence and types of adverse events.
-
Number of and reasons for withdrawals.
-
Whether the study was specifically designed to measure pain in SCI.
-
Relevant criteria for assessment of methodological study quality using the risk of bias tool of The Cochrane Collaboration.
-
Measures of treatment effect (outcome measures).
None of the included studies provided sufficient data for review authors to use the benchmarks of the IMMPACT (Initiative on Methods, Measurement and Pain Assessment in Clinical Trials) recommendations (Dworkin 2008) to interpret the clinical importance of pain relief.
Assessment of risk of bias in included studies
We used the risk of bias tool of The Cochrane Collaboration to assess risk of bias, as described in the Cochrane Handbook for Systematic Reviews of Interventions (version 5.1.0) (Table 8.5.d) (Higgins 2011). Risk of bias was assessed by two review authors independently (IB and one of EvE, IEH or MWGB). We assessed the following domains: random sequence generation, allocation concealment, blinding of participants and personnel, blinding of outcome assessment, incomplete outcome data, selective reporting and other sources of bias. We deemed studies with high risk of bias in any single domain as having high overall risk of bias. For each domain, each investigator rated the risk of bias independently as 'low risk,' 'high risk' or ‘unclear risk’ (Higgins 2011). Criteria for study validity further included duration of the intervention and duration of follow‐up after the intervention (Moore 2010). We also looked for imbalance in baseline pain scores between intervention and control groups.
Measures of treatment effect
Data for measures of treatment effect were extracted for the time points of baseline measurement, last intervention and during follow‐up. To account for the effective time span of measurement after the last time of intervention in evaluating the durability of pain relief, we distinguished between short‐term, medium‐term and long‐term effects, if assessments covered the first week, week two to six or week seven or later, respectively. If outcome data were reported for several time points within one of these time periods, we extracted data for the last measurement time point in this time period.
The size of the treatment effect was expressed as the (standardised) mean difference of measures between intervention and control groups for each instrument used.
Unit of analysis issues
All studies used the individual participant as the unit of analysis. When appropriate, we aimed to combine data from cross‐over trials with those from other trials, as described in the Cochrane Handbook for Systematic Reviews of Interventions (Chapter 16.4.5) (Higgins 2011) (i.e. cross‐over trials would have been included in any meta‐analyses if the trial report indicated low risk of carry‐over effects and complete retention of participants during the intervention periods). In the end, none of the three cross‐over trials was included in any meta‐analyses because of large differences in study methods.
Dealing with missing data
When data were missing, we contacted the lead authors of the trial by email and asked them for needed data. If we were not able to obtain the missing data, the trial was not included in the meta‐analysis.
Assessment of heterogeneity
Clinical heterogeneity was assessed on the basis of study design, population and intervention. We initially aimed to distinguish comparisons of active interventions versus placebo or sham interventions versus those with no treatment groups. However, because of the paucity of studies for each type of intervention, this analysis could not be carried out. When applicable, we assessed statistical heterogeneity among studies before meta‐analysis using the I² statistic, with values of 50% or greater considered as showing substantial heterogeneity (Higgins 2002; Higgins 2003), and the Chi2 test, with a threshold P value < 0.1. When significant heterogeneity was found, we aimed to perform subgroup analyses to further investigate sources of heterogeneity.
Assessment of reporting biases
We initially planned to use graphical or formal statistical assessments to detect reporting bias but refrained from doing this because in all eight groups of trials by type of intervention, fewer than 10 trials were included.
Data synthesis
Each type of intervention (e.g. acupuncture, exercise programme) was analysed separately. All analyses were done using Review Manager 5.1 software. When possible, meta‐analysis was conducted using the random‐effects model. The fixed‐effect model was used to combine in two meta‐analyses data from pairs of similar study groups from two factorial trials (Doctor 1996; Soler 2010). All included studies were used in the primary analysis regardless of their risk of bias. For the purpose of meta‐analysis, ordinal outcome data were treated as continuous variables. Forest plots were created when data from two or more included studies could be combined.
Subgroup analysis and investigation of heterogeneity
Ancillary subgroup analyses for adult versus paediatric studies were not feasible because trials in children with SCI could not be found. Another pre‐specified subgroup analysis by SCI lesion level (paraplegia/tetraplegia) has not been carried out because the included trial reports did not contain sufficient data on the level of SCI. Only one trial provided data separately for tetraplegic and paraplegic participants (Curtis 1999).
Sensitivity analysis
In a planned sensitivity analysis, we explored whether the methodological quality of the included studies had any effect on combined estimates. For this purpose, studies with high overall risk of bias were excluded.
Results
Description of studies
For a detailed description of studies, see the sections Characteristics of included studies, Characteristics of excluded studies and Characteristics of studies awaiting classification.
Results of the search
This review fully incorporates the results of searches conducted up to March 2011. A further 485 potentially eligible reports were identified by a search update conducted in November 2014, but these studies have not yet been incorporated into the results and will be addressed in the next update. See the Characteristics of studies awaiting classification section for details.
We identified 1602 potentially eligible references through electronic literature searches (Figure 1). After duplicate references were removed, 1301 unique references were left. We excluded 1140 references after screening titles and abstracts. Of the remaining 161 references, an additional 125 references were excluded after consultation with a second review author (EvE or IEH); 36 references were assessed for eligibility and read in full. A total of 20 publications met the inclusion criteria. Three articles reported on the same trial (Hicks 2003). We identified Hicks 2003 as the principal paper providing all relevant data and disregarded the other two publications.

Study flow diagram for search run in March 2011.
Three articles reported on a series of investigations conducted by the same research group (Lefaucheur 2007) in study populations with various health conditions including SCI. Investigators provided us with individual data for the participants with SCI. Outcome data on some participants were used in two of the three publications. We regarded this as one set of data for each individual and considered the data as resulting from a single trial with a total of 19 participants. We refer to the combined dataset as Lefaucheur 2007. Consequently, 16 individual trials involving 616 people were included in the review.
Included studies
Country of origin, setting and language of publication
The included studies were conducted in Brazil, Canada, France, Israel, the Netherlands, UK, USA, Spain and South Korea. Interventions took place at rehabilitation centres, inpatient or outpatient clinics of general hospitals and research institutions. All study reports were written in English.
Type of interventions
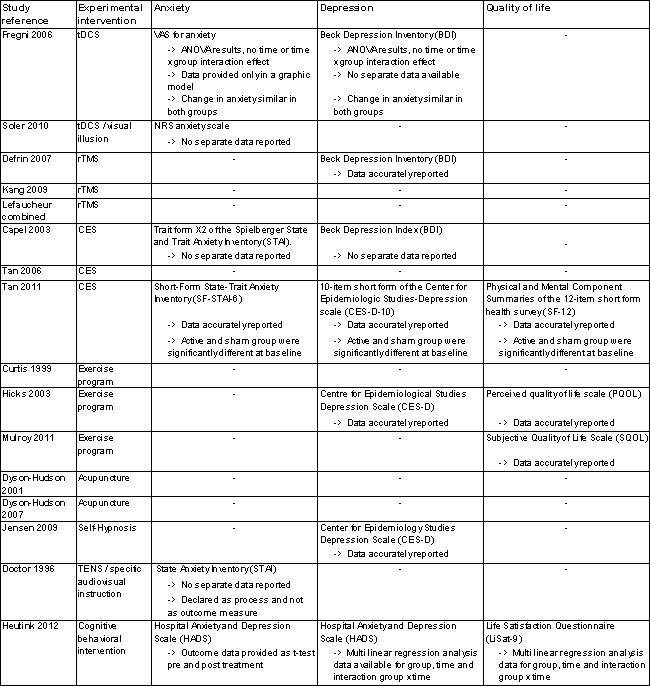
Types of interventions and controls are listed in Figure 2. Overall, interventions used in the included trials were diverse and ranged from experimental brain stimulation techniques to exercise programmes and self‐hypnosis. As a result of this clinical heterogeneity in the included studies, we regarded pooling of all outcome data in one meta‐analysis as inappropriate and decided to combine outcome data by type of intervention only.

Main characteristics of included studies.
The effects of transcranial direct current stimulation (tDCS) were investigated in two trials (Fregni 2006; Soler 2010). This therapy uses constant, low current delivered directly to the brain area of interest via small electrodes.
Three trials investigated the effects of repetitive transcranial magnetic stimulation (rTMS) (Defrin 2007; Kang 2009; Lefaucheur 2007). This technique uses a magnet instead of an electrical current to activate the brain; a device is used to generate short pulses of magnetic fields to stimulate areas of the brain thought to be associated with pain.
Three studies looked at cranial electrotherapy stimulation (CES), also called transcranial electrotherapy (TCET), which uses a small, pulsed electrical current applied across a patient's head (Capel 2003; Tan 2006; Tan 2011).
Three studies investigated the effects of exercise programmes on chronic pain (Curtis 1999; Hicks 2003; Mulroy 2011). Two studies investigated the effects of acupuncture (Dyson‐Hudson 2001; Dyson‐Hudson 2007) and one the effect of self‐hypnosis (Jensen 2009). One study examined the effects of transcutaneous electrical nerve stimulation (TENS), which uses electrodes applied to the skin to deliver intermittent stimulation to surface nerves, thus blocking the transmission of pain signals (Doctor 1996). Finally, one study used an intervention programme comprising educational, cognitive and behavioural elements targeted at coping with chronic pain (Heutink 2012).
Type of controls
Ten of the included studies used sham interventions in the control group (Capel 2003; Defrin 2007; Doctor 1996; Dyson‐Hudson 2007; Fregni 2006; Kang 2009; Lefaucheur 2007; Soler 2010; Tan 2006; Tan 2011). Two studies used a waiting list (Heutink 2012; Hicks 2003), one had a 'no treatment' group (Curtis 1999) and another a control group with a minimal intervention that can be considered 'no treatment' (Mulroy 2011). An additional two studies provided active control interventions: Dyson‐Hudson 2001 used Trager integration treatment, and Jensen 2009 used electromyography (EMG) biofeedback. Three studies were cross‐over studies (Capel 2003; Kang 2009; Lefaucheur 2007).
Sample size and participants
Overall 616 participants with SCI were enrolled in the included studies. Total sample size varied from 12 to 111 participants (Figure 2). The two tDCS studies included a total of 57 participants—17 persons in the first and 40 in the second study. The three rTMS trials included 44 participants; study sample size ranged from 12 to 19. The CES studies included 181 participants; study sample size ranged from 30 to 111. The exercise studies included 149 participants; study size ranged from 34 to 80 participants. The two acupuncture studies included 47 randomly assigned participants—23 persons in the first and 24 in the second study. The self‐hypnosis trial included 37, the TENS trial 40 and the trial using a behavioural program 61 participants.
In all but one trial, the participants were of both sexes. In the study by Tan et al, only male veterans were included (Tan 2006). Most studies enrolled more male than female participants; the distribution was 289 male (77.5%) to 84 female participants (22.5%) in the 13 studies that provided data on gender distribution. For three studies (Capel 2003; Curtis 1999; Tan 2011), gender distribution of study participants was not available. The mean age of participants ranged from 35 to 56 years.
Eleven studies included persons with paraplegia or tetraplegia (Figure 2). Two studies included participants with paraplegia only (Defrin 2007; Mulroy 2011). For three studies (Fregni 2006; Jensen 2009; Lefaucheur 2007), the SCI level of participants was not indicated in the publications. Three studies (Defrin 2007; Fregni 2006; Hicks 2003) included solely participants with traumatic SCI. All other studies did not restrict eligibility by the cause of SCI. In one trial, injuries of all participants were classified as American Spinal Injury Association (ASIA) group A or B, although this was not an inclusion criterion (Soler 2010). Two studies provided insufficient information about the type of SCI (Jensen 2009; Lefaucheur 2007). However, Jensen 2009 referred to another publication (Jensen 2005) in which injury levels of the same study population were C1 to S4.
Two trials consisted of mixed study populations that also included participants with conditions other than SCI (Curtis 1999; Lefaucheur 2007). For analysis, only data on the SCI subpopulation were used.
The included studies targeted a variety of chronic pain conditions: Seven studies included solely participants with neuropathic pain (Defrin 2007; Fregni 2006; Heutink 2012; Kang 2009; Lefaucheur 2007; Soler 2010; Tan 2011). Of those, Defrin 2007 defined the pain as central pain and Lefaucheur 2007 as neurogenic. Four studies included participants with neuropathic or other pain and especially mentioned visceral or musculoskeletal pain (Capel 2003; Doctor 1996; Jensen 2009; Tan 2006). Four studies focused on shoulder pain, of which two stated explicitly that the pain was of musculoskeletal origin (Dyson‐Hudson 2001; Dyson‐Hudson 2007), whereas the other two did not specify pain type (Curtis 1999; Mulroy 2011). No information about the type of pain was provided for one study (Hicks 2003). In six studies, the minimal pain duration was six months (Defrin 2007; Heutink 2012; Kang 2009; Lefaucheur 2007; Soler 2010; Tan 2011), and in four trials it was three months (Dyson‐Hudson 2001; Dyson‐Hudson 2007; Fregni 2006; Tan 2006). For six trials, no clear definition of chronicity was provided in the publications, or pain duration was not used as an inclusion criterion (Capel 2003; Curtis 1999; Doctor 1996; Hicks 2003; Jensen 2009; Mulroy 2011).
Duration of intervention and follow‐up
The duration of study interventions varied from one single point in time to a period of nine months with twice‐weekly interventions. All studies assessed the short‐term effects of the interventions (i.e. study outcomes were measured immediately after the last intervention or in the ensuing 24 hours). None of the studies collected data for the time period between 24 hours and the first week after the intervention. Eight studies (Defrin 2007; Dyson‐Hudson 2001; Dyson‐Hudson 2007; Fregni 2006; Heutink 2012; Kang 2009; Mulroy 2011; Soler 2010) investigated mid‐term effects (i.e. between one and six weeks after the last intervention). Only four studies assessed long‐term effects (i.e. longer than six weeks after the last intervention) (Heutink 2012; Jensen 2009; Kang 2009; Soler 2010).
Outcomes
Primary outcomes
Across trials, pain was assessed with the use of various self‐reported measurement scales and at various time points. Fourteen studies (Capel 2003; Curtis 1999; Defrin 2007; Doctor 1996; Dyson‐Hudson 2001; Dyson‐Hudson 2007; Fregni 2006; Heutink 2012; Jensen 2009; Kang 2009; Mulroy 2011; Soler 2010; Tan 2006; Tan 2011) defined pain as a primary outcome. Seven studies measured pain by NRS ranging from zero to ten (Dyson‐Hudson 2001; Dyson‐Hudson 2007; Heutink 2012; Jensen 2009; Kang 2009; Soler 2010; Tan 2006). In these studies, the definition of the maximum scale value was “most intense pain imaginable” (Kang 2009; Jensen 2009), “pain as bad as you can imagine” (Tan 2006; Heutink 2012), “worst pain ever experienced” (Dyson‐Hudson 2001; Dyson‐Hudson 2007) and “unbearable pain” (Soler 2010). Also, the questions on pain experience were operationalised in different ways. For instance, participants were asked for “average pain intensity during the preceding 24 hours” (Kang 2009; Soler 2010) or “current pain intensity” (Jensen 2009). Three trials used VAS ranging from zero to ten. Of those, two defined minimum and maximum anchor values as “no pain” and “worst pain possible” (Fregni 2006; Mulroy 2011); one trial (Lefaucheur 2007) failed to provide a scale description when measuring pain as one of several (secondary) outcomes. Four studies used the Brief Pain Inventory (BPI) (Kang 2009; Soler 2010; Tan 2006; Jensen 2009), and two studies (Hicks 2003; Mulroy 2011) used pain items of the Short Form Health Survey (SF‐36) as secondary outcome measures. Four studies used the Wheelchair User's Shoulder Pain Index (WUSPI) (Curtis 1999; Dyson‐Hudson 2001; Dyson‐Hudson 2007; Mulroy 2011). Four additional instruments were used by only one study each: the McGill Pain Questionnaire (SF‐MPQ) (Capel 2003), the Verbal Rating Scale (VRS) (Dyson‐Hudson 2001), the Descriptor Differential Scale (DDS) for pain intensity and pain unpleasantness (Doctor 1996) and the Chronic Pain Grade (CPG) questionnaire (Heutink 2012). In the statistical analyses of all included studies, pain outcome data derived from ordinal scales were treated as continuous outcomes and were expressed as mean values (with standard deviations) or relative change.
Secondary outcomes
For nine studies, information about occurrence of adverse effects was available (Capel 2003; Curtis 1999; Doctor 1996; Dyson‐Hudson 2001; Fregni 2006; Lefaucheur 2007, Mulroy 2011; Soler 2010; Tan 2011). Ten studies measured anxiety, depression or quality of life. However, large heterogeneity was noted in the instruments used. Six studies measured anxiety, with each using a different instrument: the Spielberger State and Trait Anxiety Inventory (STAI) (in three different versions), VASs or NRSs for anxiety and the Hospital Anxiety and Depression Scale (HADS) (Capel 2003; Doctor 1996; Fregni 2006; Heutink 2012; Soler 2010; Tan 2011). Seven studies measured depression using three different scales: the Beck Depression Index (BDI), the Centre for Epidemiologic Studies Depression Scale (CES‐D) and the HADS (Capel 2003; Defrin 2007; Fregni 2006; Heutink 2012; Hicks 2003; Jensen 2009; Tan 2011). Four studies measured quality of life, each using a different instrument: the Subjective Quality of Life Scale (SQOL) on a seven‐point Likert scale (Mulroy 2011), the Perceived Quality of Life Scale (PQOL) on a seven‐point scale (Hicks 2003), the Life Satisfaction Questionnaire (Lisat‐9) on a six‐point scale (Heutink 2012) and the physical and mental component summaries of the 12‐item Short Form Health Survey (PCS and MCS of the SF‐12) (Tan 2011). None of the included studies provided data on the cost of treatments under study.
Excluded studies
For detailed descriptions, see Characteristics of excluded studies.
We excluded 12 studies after reading the whole article. Of those, nine were not (properly) randomly assigned (Coşkun Çelik 2005; Ditor 2003; Dyson‐Hudson 2007b; Norrbrink 2006; Norrbrink 2009; Perry 2010; Saitoh 2007; Wardell 2006; Xing 2010). Two trials did not examine chronic pain (Crowe 2000; Lefaucheur 2010), and one study included only one participant with SCI in the control group (Hughes 2006). Four studies await classification because randomisation remained unclear (Hirayama 2006; Livshits 2002; Saitoh 2006; Saitoh 2007a) despite our attempts to contact the study authors.
Risk of bias in included studies
For a summary of the risk of bias assessment, see Figure 3 and Figure 4. Four studies were of low or unclear risk of bias in all domains (Fregni 2006; Kang 2009; Soler 2010; Tan 2006).

Risk of bias summary: review authors' judgements about each risk of bias item for each included study.

Risk of bias graph: review authors' judgements about each risk of bias item presented as percentages across all included studies.
Sequence generation (selection bias)
Nine studies were judged as having low risk of selection bias due to sequence generation (Capel 2003; Doctor 1996; Dyson‐Hudson 2001; Fregni 2006; Heutink 2012; Jensen 2009; Mulroy 2011; Soler 2010; Tan 2011). Seven studies with no information about the randomisation method used were rated as having unclear risk of bias (Curtis 1999; Defrin 2007; Dyson‐Hudson 2007; Hicks 2003; Kang 2009; Lefaucheur 2007; Tan 2006).
Allocation
Five studies were judged as having low risk of selection bias due to allocation to treatment groups (Capel 2003; Heutink 2012; Jensen 2009; Mulroy 2011; Tan 2011). For 10 studies, no information about concealment was provided; consequently they were rated as having unclear risk of bias (Curtis 1999; Defrin 2007; Doctor 1996; Dyson‐Hudson 2001; Dyson‐Hudson 2007; Fregni 2006; Kang 2009; Lefaucheur 2007; Soler 2010; Tan 2006). One study (Hicks 2003) was considered to have high risk of selection bias because allocation of treatment was not concealed.
Blinding
In eight trials, participants and study personnel were blinded; consequently, they were rated as having low risk of performance or detection bias (Capel 2003; Defrin 2007; Fregni 2006; Kang 2009, Lefaucheur 2007; Soler 2010; Tan 2006; Tan 2011). Eight studies that provided no information about blinding were rated as having high risk of bias. Six of these studies (Curtis 1999; Dyson‐Hudson 2001; Heutink 2012; Hicks 2003, Jensen 2009, Mulroy 2011) indicated that blinding was not possible because of the nature of the study intervention. This group included all three studies on exercise interventions. In the study of Dyson‐Hudson 2007, the acupuncturist was not blinded, and in the study of Doctor 1996, blinding of the therapist and of participants was reported to be only partially successful.
The publications of 12 studies stated that outcome assessors were blinded (Capel 2003; Defrin 2007; Doctor 1996; Dyson‐Hudson 2001; Dyson‐Hudson 2007; Fregni 2006; Jensen 2009, Kang 2009, Mulroy 2011; Soler 2010; Tan 2006; Tan 2011). Three study reports did not specify whether outcome assessors were blinded (Curtis 1999; Heutink 2012; Lefaucheur 2007). The authors of one study (Hicks 2003) declared that the outcome assessor was not blinded; consequently, it was rated as having high risk of bias for this domain.
Incomplete outcome data
Thirteen study reports included outcome data for all included participants. We considered these studies to have low risk of attrition bias (Capel 2003; Curtis 1999; Defrin 2007; Doctor 1996; Dyson‐Hudson 2001; Dyson‐Hudson 2007; Fregni 2006; Heutink 2012; Jensen 2009; Kang 2009; Lefaucheur 2007; Mulroy 2011; Soler 2010). We rated one study (Tan 2006), which provided only incomplete explanations about missing outcome data, as having unclear risk. Two studies that did not include all pre‐specified outcome data were rated as having high risk of bias (Hicks 2003; Tan 2011).
Selective reporting
Fourteen trials were judged as having low risk of reporting bias; information provided in the publications alone (Curtis 1999; Defrin 2007; Doctor 1996; Dyson‐Hudson 2001; Dyson‐Hudson 2007; Fregni 2006; Hicks 2003; Kang 2009; Soler 2010; Tan 2006; Tan 2011) or in both the study protocol and the publication (Jensen 2009; Heutink 2012; Mulroy 2011) did not suggest that relevant outcomes remained unpublished. For five studies (Fregni 2006; Jensen 2009; Heutink 2012; Mulroy 2011; Tan 2011), information on planned study outcomes was available in trial registries; comparison with the publications did not indicate that relevant outcomes were left out selectively. One study was rated as having unclear risk of bias (Lefaucheur 2007). The remaining study (Capel 2003) was considered to have high risk of selective reporting because it did not provide pain score values for all time points.
Other potential sources of bias
For nine studies we identified no other potential source of bias; their risk of other biases was considered low. Mulroy 2011 was rated as having unclear risk of bias because participants in the intervention group were free to continue exercise during the follow‐up period. Six studies were rated as having high risk of other biases: In the trial series of Lefaucheur 2007, outcome data on the same participants were likely used in multiple comparisons. In four studies (Curtis 1999; Defrin 2007; Jensen 2009; Tan 2011), baseline pain measures in the intervention and control groups were substantially imbalanced. In three of these studies, no other pain outcome measure was used. In Tan 2011, the BPI pain intensity subscale and the PQAS were used, in addition to three pain outcomes with imbalance at baseline, but the validity of these data remained unclear. Statistical methods used to adjust for baseline imbalance included analysis of variance (ANOVA) in three studies (Curtis 1999; Defrin 2007; Jensen 2009) and non‐parametric analysis of variance (Kruskal‐Wallis test) in the fourth (Tan 2011).
Effects of interventions
Transcranial direct current stimulation (tDCS) versus sham tDCS
Short‐term outcomes
Two trials (of low or unclear risk of bias) assessed the effects of tDCS versus sham tDCS on chronic pain in the short term using a VAS or NRS (Fregni 2006; Soler 2010). The pooled mean difference between tDCS and sham tDCS was ‐1.9 scale units (95% CI ‐3.48 to ‐0.33; P value 0.02) in favour of tDCS (Analysis 1.1). The study of Soler 2010 was a factorial trial combining two interventions (i.e. tDCS and visual illusion of walking). We combined the data from both groups with active tDCS, irrespective of the visual illusion intervention, because effect modification by the latter was not indicated.
Mid‐term and long‐term outcomes
In both trials, tDCS reduced pain also during the mid‐term follow‐up of 16 to 38 days post‐intervention (Fregni 2006; Soler 2010). The pooled mean difference was ‐1.87 scale units (95% CI ‐3.30 to ‐0.45; P value 0.01) in favour of tDCS (Analysis 1.3).
The study by Soler 2010 included long‐term follow‐up until 12 weeks. The mean difference between active tDCS and sham tDCS was ‐0.73 scale units (95% CI ‐1.82 to 0.35; P value 0.18) in favour of tDCS (Analysis 1.5).
Repetitive transcranial magnetic stimulation (rTMS) versus sham rTMS
Short‐term outcomes
Estimates from three studies on rTMS are displayed in Analysis 2.1 but were not combined, given the important differences in study design and the unavailability of detailed data needed for meta‐analysis. Point estimates for mean difference in NRS favoured rTMS in one study (Lefaucheur 2007) and favoured the sham intervention in the other two studies (Defrin 2007; Kang 2009). However, in two studies (Kang 2009; Lefaucheur 2007), the confidence intervals were large, including the null effect. In the sensitivity analysis excluding two studies with high overall risk of bias (Defrin 2007; Lefaucheur 2007), only the study of Kang 2009 remained. In this study, the estimated mean reduction in pain NRS was 0.73 (95% CI ‐0.68 to 2.14, P value 0.31).
Mid‐term and long‐term outcomes
One rTMS study included data from mid‐term and long‐term follow‐up (Kang 2009). In the mid term, the mean reduction in pain NRS with rTMS was ‐1.09 points (95% CI ‐2.77 to 0.59; P value 0.20), and in the long term it was ‐0.21 points (95% CI ‐1.95 to 1.53; P value 0.81).
Cranial electrotherapy stimulation (CES) versus sham CES
Short‐term outcomes
In three studies, the short‐term effect of CES on pain was investigated (Capel 2003; Tan 2006; Tan 2011). The study by Capel 2003 was planned as a cross‐over study. Because the SF‐MPQ pain scores of participants receiving CES treatment during the first study period improved as compared with the scores of those receiving sham treatment, the second study period was abandoned and active CES was used in both study groups thereafter. Consequently, only comparative data from the first period are available. They were reported only as percentage changes in pain score from baseline—not as absolute values.
Two studies provided absolute estimates for the short‐term effect of CES on pain reduction (Tan 2006; Tan 2011). As different measurement instruments were used, we combined estimates for daily pain using NRS and for pain intensity using the BPI subscale by calculating the standardised mean difference (SMD). The combined estimate suggested no short‐term effects of CES on pain (Analysis 3.1).
In the sensitivity analysis excluding studies with high overall risk of bias, only one study (Tan 2006) remained. It reported a mean pain reduction of 5.73 NRS points with CES and of 6.00 NRS points with sham CES. The mean difference was ‐0.27 NRS points (95% CI ‐1.86 to 1.32) or ‐0.11 SMD units (95% CI ‐0.74 to 0.53) (Analysis 3.1).
Exercise programme versus wait list control or no intervention
Short‐term outcomes
Three studies assessed exercise programmes for pain reduction: In the trial by Curtis et al, exercise and control groups differed in WUSPI pain scores at baseline (22.6 (standard deviation (SD) 21.8) units vs 11.05 (SD 11.9) units) (Curtis 1999). The mean change in WUSPI score between baseline and end of treatment after six months was ‐7.77 units (SD 19.01) in the exercise group and 2.8 (SD 12.74) in the control group, respectively. For the tetraplegic subgroup, corresponding mean difference values were 0.086 (SD 15.06) and 2.57 (SD 17.85), and for the paraplegic subgroup 14.64 (SD 20.32) and 3.0 (SD 7.69). Whether pain scores differed between experimental and control groups over time was not evaluated.
In another study (Hicks 2003), the mean difference in scores on the SF‐36 item for pain experience was ‐1.9 (95% CI ‐3.4 to ‐0.4; P value 0.01) in favour of the exercise group.
A third study (Mulroy 2011) tested exercise in combination with a standard movement optimisation intervention versus an 'attention only' control intervention (i.e. viewing of a one‐hour educational video). Exercise as compared with the control intervention led to a mean difference of ‐2.8 units on the pain VAS (95% CI ‐3.77 to ‐1.83; P value < 0.00001) and ‐30.70 units in the WUSPI score (95 % CI ‐43.31 to ‐18.09; P value 0.00001).
Estimates from the latter two trials were converted to standardised mean differences and are displayed in Analysis 4.10 and Analysis 4.11, but they were not combined, given the large differences between study and control interventions.
Mid‐term outcomes
One study (Mulroy 2011) measured pain reduction after a mid‐term follow‐up of four weeks. The mean difference in pain VAS was ‐2.50 (95% CI ‐3.48 to ‐1.52; P value < 0.00001) and in WUSPI score ‐26.40 (95% CI ‐37.62 to ‐15.18; P value < 0.00001) in favour of the exercise group.
All three studies were fraught with high overall risk of bias. In particular, the comparison with 'no treatment' or waiting lists as control interventions likely leads to an overestimation of the effectiveness of the exercise programmes provided in these studies. Consequently, no conclusion on their effectiveness can be drawn.
Self‐hypnosis versus electromyography (EMG) biofeedback
One study (Jensen 2009) compared self‐hypnosis with EMG biofeedback. Considerable imbalance in baseline measurements was noted among three pain outcomes: Average daily NRS values for pain were 5.99 (SD 1.83) in the self‐hypnosis group and 3.44 (SD 1.48) in the EMG biofeedback group. The NRS for pain unpleasantness was 6.83 (SD 1.69) and 3.91 (SD 2.07), respectively. The BPI score was 5.23 (SD 2.49) and 2.33 (SD 1.68), respectively.
Short‐term outcomes
After the treatment period, average NRS values for pain were 5.09 (SD 1.92) in the self‐hypnosis group and 3.36 (SD 1.28) in the biofeedback group. The NRS for pain unpleasantness was 5.1 (SD 12.12) and 2.88 (SD 1.02), respectively. The BPI score was 4.58 (SD 2.57) and 3.05 (SD 2.06), respectively.
Long‐term outcomes
Jensen et al also compared pain outcomes after three months. The mean NRS for daily pain was 4.90 (SD 2.13) in the self‐hypnosis group and 3.13 (SD 1.42) in the EMG biofeedback group. Mean NRS values for pain unpleasantness were 5.13 (SD 2.71) and 2.80 (SD 1.59), respectively, and mean BPI scores were 4.54 (SD 2.4) and 2.87 (SD 2.33), respectively.
This study was fraught with high overall risk of bias; consequently, no conclusion can be drawn regarding the effectiveness of self‐hypnosis as compared with EMG biofeedback.
Acupuncture versus sham acupuncture or Trager treatment
Short‐term and mid‐term outcomes
One study investigated the effects of acupuncture versus sham acupuncture on short‐term and mid‐term pain outcomes (Dyson‐Hudson 2007). The mean difference in NRS values was ‐1.10 (95% CI ‐3.42 to 1.22; P value 0.35) in the short term and ‐0.5 (95% CI ‐3.13 to 2.13; P value 0.71) in the mid term (i.e. after five weeks). The mean difference in WUSPI score was ‐3.30 (95% CI ‐18.77 to 12.17; P value 0.68) in the short term and ‐4.6 (95% CI ‐24.24 to 15.04; P value 0.65) in the mid term.
An earlier study by the same group compared the effects of acupuncture versus Trager treatment on short‐term and mid‐term outcomes (Dyson‐Hudson 2001). The mean difference in WUSPI scores was 1.70 (95% CI ‐21.91 to 25.31; P value 0.89) in the short term and 16.0 (95% CI ‐9.03 to 41.03; P value 0.21) in the mid term (i.e. after five weeks).
Estimates from both trials are displayed in Analysis 5.1 for the short‐term outcome and in Analysis 5.2 for the mid‐term outcome, but these values were not combined because of differences in study design. Both studies were fraught with high overall risk of bias; consequently, no conclusion can be drawn on the effectiveness of acupuncture as compared with sham acupuncture or Trager treatment.
Transcutaneous electrical nerve stimulation (TENS) versus sham TENS
Short‐term outcomes
In one study (Doctor 1996), a factorial design was used to study whether pain (measured by DDS) can be reduced in the short term by two interventions: TENS (vs sham TENS) and an experimental manipulation to create a positive (vs neutral) treatment expectation. Data were analysed and reported separately for participants with neuropathic and musculoskeletal pain. In both of these subgroups, a substantial difference in the effects of TENS was noted between those with positive and neutral expectations (Analysis 6.1; Analysis 6.2). In participants with neuropathic pain and neutral expectations, the mean difference in DDS was ‐0.30 units (95% CI ‐5.56 to 4.96; P value 0.91), and in those with positive expectations ‐5.10 units (95% CI ‐8.41 to ‐1.79; P value 0.003). In participants with musculoskeletal pain and neutral expectations, the mean difference in DDS was 1.30 units (95% CI ‐0.19 to 2.79; P value 0.09), and in those with positive expectations ‐3.00 units (95% CI ‐6.41 to 0.41; P value 0.09).
The study was fraught with high overall risk of bias; consequently, no conclusion can be drawn on the effectiveness of TENS as compared with a sham intervention.
Multi‐disciplinary cognitive behavioural programme versus wait list control
Short‐term and long‐term outcomes
One study investigated the effects of a multi‐disciplinary cognitive behavioural programme (Heutink 2012) on short‐term pain reduction. The mean difference in CPG pain intensity scores between experimental and waiting list control group was ‐2.0 (95% CI ‐9.26 to 5.26; P value 0.59). After three months (long‐term outcomes), the mean difference in CPG pain intensity scores was 0.40 (95% CI ‐7.3 to 8.1; P value 0.92).
The study was fraught with high overall risk of bias. In particular, the comparison with a waiting list as the control intervention likely leads to overestimation of the effectiveness of the experimental intervention. Consequently, no conclusion can be drawn on the effectiveness of this multi‐disciplinary cognitive behavioural programme.
Secondary outcome measures
The included studies provided insufficient data to permit reliable conclusions on the effects of the interventions on outcomes other than pain. Ten studies measured the effects of the interventions on anxiety, depression or quality of life (Figure 5). Six studies measured anxiety (Capel 2003; Doctor 1996; Fregni 2006; Heutink 2012; Soler 2010; Tan 2011), seven measured depression (Capel 2003; Defrin 2007; Fregni 2006; Heutink 2012; Hicks 2003; Jensen 2009; Tan 2011) and four studies measured quality of life (Heutink 2012; Hicks 2003; Mulroy 2011; Tan 2011). Of the ten studies, solely six provided outcome data (Defrin 2007; Heutink 2012; Hicks 2003; Jensen 2009; Mulroy 2011; Tan 2011). As with pain outcomes, imbalance at baseline between intervention and control groups was found for secondary outcomes in several studies (Defrin 2007; Heutink 2012; Jensen 2009; Tan 2011).

Secondary outcome measures.
Heutink 2012 measured the effects of a multi‐disciplinary cognitive behavioural programme on anxiety in short‐term and mid‐term outcomes. Mean differences in HADS anxiety scores were ‐0.10 (95% CI ‐1.86 to 1.66; P value 0.91) and 0.30 (95% CI ‐1.51 to 2.11; P value 0.74), respectively, for short‐term and long‐term outcomes. The study authors concluded: “The anxiety score of the intervention group showed a significant decrease between t1 and t2, and between t1 and t3, while the anxiety score of the control group showed no significant change.”
The study by Defrin 2007 measured the effects of rTMS on depression in the short term and the mid term. The mean difference in BDI depression scores was 7.0 (95 % CI ‐6.48 to 20.48; P value 0.31) and 4.0 (95 % CI ‐7.66 to 15.66; P value 0.50) for short‐term and mid‐term outcomes, respectively. The study authors concluded that "both real and sham groups exhibited a significant reduction in BDI values at the end of the treatment series compared with pre‐treatment levels.” Hicks 2003 measured the effects of an exercise programme on depression in the short term. The mean difference in CES‐D scores was ‐6.0 (95% CI ‐15.87 to 3.87; P value 0.23).
The studies of Hicks 2003 and Mulroy 2011 measured the effects of an exercise programme on quality of life. Hicks 2003 used the PQOL scale, and the mean difference was 10.8 (95% CI ‐4.2 to 25.8; P value 0. 16) for the short term. Mulroy 2011 used the SQOL scale for short‐term and mid‐term outcomes, and mean differences were 0.3 (95% CI ‐0.22 to 0.82; P value 0.25) and 0.5 (95% CI ‐0.03 to 1.03; P value 0.07), respectively.
Adverse effects
Four publications mentioned explicitly that no adverse effects occurred (Capel 2003; Doctor 1996; Dyson‐Hudson 2007; Lefaucheur 2004). Five publications described adverse effects (Curtis 1999; Fregni 2006; Mulroy 2011; Soler 2010; Tan 2011). In the tDCS trials (Fregni 2006; Soler 2010), seven participants had mild headache, and five mentioned itching under the electrodes. In the study by Soler 2010, three participants in the visual illusion group felt tired after the “walking.” In the CES trial by Tan 2011, adverse effects occurred in 41 participants in the active group and in 56 participants in the sham group. Most commonly mentioned were “ears pulse, tingle, sting, itch, small electric feeling or ear clips too tight,” “feeling drowsy, sleepy, fell asleep, relaxing” and “feeling dizzy, lightheaded or crooked.” In the exercise studies (Curtis 1999; Mulroy 2011), neck, shoulder and elbow injuries occurred in five participants from the intervention group. Overall, a paucity of evidence was available on serious or long‐lasting side effects of the interventions. Seven study reports did not mention whether or not adverse effects occurred (Defrin 2007; Dyson‐Hudson 2001; Heutink 2012; Hicks 2003; Jensen 2009; Kang 2009; Tan 2011).
Discussion
Summary of main results
We reviewed and critically appraised research evidence on the effectiveness and safety of non‐pharmacological interventions for the treatment of chronic pain in people living with SCI. We identified 16 randomised trials with a total of 616 participants with SCI and a variety of non‐pharmacological treatment approaches. Given the multiple methodological problems of these studies, an overall conclusion about their effectiveness and safety is not possible.
Transcranial direct current stimulation (tDCS) was superior to a sham intervention when the estimates of two studies were combined. However, overall evidence for the effectiveness of tDCS in reducing chronic pain in SCI was scarce and inconclusive. Data available from randomised studies on repetitive transcranial magnetic stimulation (rTMS) did not support its effectiveness in reducing chronic pain in persons living with SCI. One study including several related experiments suggested its effectiveness in a mixed study population but not in the SCI subgroup (Lefaucheur 2007). A second study (Defrin 2007) did not find a beneficial effect of active rTMS over a sham intervention, and a third study (Kang 2009) was inconclusive with regard to pain reduction.
Two studies on cranial electrotherapy stimulation (CES) had methodological weaknesses including high risk of selective reporting (Capel 2003) and baseline imbalance (Tan 2011), and a third study (Tan 2006) was inconclusive with regard to pain reduction.
Three trials reported a beneficial effect of an exercise programme on chronic pain (Mulroy 2011; Curtis 1999; Hicks 2003), but all had methodological shortcomings including lack of blinding and proper randomisation. In addition, the use of 'no treatment' or wait list control interventions in pain studies is problematic because it might yield different pain outcomes even when compared with placebo interventions (Hróbjartsson 2010).
In two trials acupuncture was not superior to sham acupuncture or Trager treatment in reducing pain (Dyson‐Hudson 2001; Dyson‐Hudson 2007).
Self‐hypnosis was compared with EMG biofeedback in one trial (Jensen 2009). Although the study authors concluded that both interventions decreased pain, the data are difficult to interpret as no sham control group was included and significant imbalance in baseline pain scores was evident between groups.
Only one trial focused on transcutaneous electrical nerve stimulation (TENS) (Doctor 1996). Results of this study suggest that treatment expectations and type of pain (neuropathic or musculoskeletal) are effect modifiers. However, available data do not allow firm conclusions.
A multi‐disciplinary cognitive behavioural programme was compared with no treatment (waiting list) in one trial (Heutink 2012). Although this type of control group likely favoured the experimental intervention, it revealed no short‐term or long‐term benefits of the programme.
Overall completeness and applicability of evidence
Completeness of the evidence
Overall, each type of intervention group included only a few studies; the maximum number of separate studies included in a meta‐analysis was two. In these meta‐analyses, statistical heterogeneity was low to moderate, with I2 values ranging from 0% to 55%. Both tDCS trials (Fregni 2006; Soler 2010) were included in a meta‐analysis, and upon request one study author provided additional data. Evidence on the effectiveness of rTMS, CES and exercise programmes was poor because two of three rTMS trials, two of three CES trials and all three exercise programme trials had high overall risk of bias. These studies were excluded from the sensitivity analysis. With only one trial for self‐hypnosis (Jensen 2009), one for TENS (Doctor 1996) and one for behavioural therapy (Heutink 2012), evidence for these three types of interventions was scarce and, again, was fraught with methodological problems. Two trials investigated the effects of acupuncture. However, one study compared acupuncture versus a sham intervention (Dyson‐Hudson 2007) and another versus Trager treatment (Dyson‐Hudson 2001); consequently, we refrained from pooling the data.
We initially planned to conduct subgroup analyses for trials in patients with different types of SCI or pain. However, the small number of included studies made this impossible. Further, we did not perform a planned sensitivity analysis for studies in which persons with SCI were only a subgroup because both trials with mixed populations had major methodological shortcomings related to baseline imbalance (Curtis 1999) and outcome reporting (Lefaucheur 2007). Nine of the 16 included trials provided information about the safety of the intervention or mentioned adverse effects. Thus, evidence on the safety of non‐pharmacological trials was incomplete.
Regarding representation of both sexes, the study populations of included trials reflect the adult SCI population, with about 70% of persons being male (van den Berg 2010). The mean age of the trial populations ranged from 35 to 56 years, and wide age ranges were noted in the individual studies. It is important to note that none of the trials included participants younger than 18 years of age, suggesting that non‐pharmacological treatments for chronic pain in children with SCI have not been studied in randomised trials.
Applicability
Among the range of non‐pharmacological pain treatments currently used in routine clinical practice, only some have been investigated in the included trials. TENS, physical training and acupuncture are commonly used for pain reduction (Cardenas 2006; Heutink 2011; Norrbrink 2004). When asked about pain treatments used, persons with SCI mentioned massage, heat therapy and other physiotherapy as the most commonly used treatments for chronic pain (Cardenas 2006; Norrbrink 2004; Widerstrom‐Noga 2003). Other frequently applied therapies include ice therapy, mental relaxation and range‐of‐motion training, psychological treatment and neurosurgery. We identified solely one randomised study on psychological treatment (Heutink 2012) but none on the other interventions. In particular, none of the neurosurgical interventions proposed for pain treatment have been evaluated in randomised controlled trials.
Most of the studied interventions are potentially applicable in any person with SCI pain. Nevertheless, some specific interventions have certain contraindications that limit their applicability. For instance, brain stimulation therapies are contraindicated in persons with a family or personal history of epilepsy, serious psychological or psychiatric disorders or metal implants. Acupuncture is not indicated in persons with bleeding disorders.
Quality of the evidence
For any of the eight intervention types, the maximum number of trials included in the meta‐analysis was two. All but two studies (Mulroy 2011; Tan 2011) had sample sizes of 40 or fewer participants. With more than 100 participants, the recent study by Tan 2011 illustrates that in this particular population, larger multi‐centre trials are feasible. Given that SCI is infrequent in many countries, the number of participants who are eligible for a clinical trial is low. To obtain study populations of adequate size, multi‐centre studies and larger research collaborations are crucially needed. In meta‐analyses of osteoarthritis trials with pain outcomes, it could be shown that studies with small sample size overestimated the benefit of therapeutic interventions as compared with larger studies (Nüesch 2010).
None of the included trials were considered to have low risk of bias. Twelve studies were judged as being at high risk of bias in at least one of the seven domains of the risk of bias tool of The Cochrane Collaboration and were excluded in the sensitivity analysis. The most predominant weaknesses were lack of blinding of participants and personnel and selection of potentially invalid control interventions, potentially invalidating any conclusions regarding the effectiveness of interventions. In eight trials, blinding was precluded by the nature of the study intervention or was not successful. Blinding of participants and personnel is a major challenge in RCTs. In particular with non‐pharmacological treatments, the development of adequate control interventions is challenging. One way to attempt to reduce bias involves using 'attention control groups' with similar frequency and duration of contact with health care professionals as those in the treatment group but with no active intervention. However, several included studies used only waiting list or 'no treatment' control groups. Despite randomisation, several trials were fraught with an imbalance between study groups in baseline pain scores. This was the second most common potential source of bias. In eight trials, participants had both neuropathic and non‐neuropathic pain conditions. Given that an intervention might work better or worse with one particular type of pain, the case mix may hamper correct interpretation of the outcome data. Published aggregated data did not allow stratified analyses by pain type.
We included only trials that addressed chronic pain. However, these trials included participants at different stages of chronic pain, and outcome measures were taken at different time points relative to SCI onset and time of intervention. This represents an important source of heterogeneity. The data do not allow conclusions on the optimal time point for starting chronic pain treatment after SCI.
The trials included in our review used a broad range of measures for pain, which reflects the absence of commonly accepted standards for this outcome. In the included publications, most instruments used were described as having good validity and reliability. However, the International Spinal Cord Pain Data Set (Widerstrom‐Noga 2008) and the Report of the National Institute on Disability and Rehabilitation Research Spinal Cord Injury (NIDRR SCI) Measures meeting (Bryce 2007) specifically recommended that a numerical rating scale should be used to measure pain intensity. The latter also recommended use of the SF‐36 pain item and MPI or BPI to measure pain interference (Bryce 2007). Further, the Initiative on Methods, Measurement and Pain Assessment in Clinical Trials (IMMPACT) recommended several outcome measures for different pain domains, although these recommendations were not SCI‐specific (Dworkin 2008; IMMPACT Recommendations 2005). To date, such collaborative efforts have not led to a unified framework for studies on chronic SCI pain.
Potential biases in the review process
Our search strategy comprised extensive literature searches of several major electronic databases, trial registers and conference proceedings as well as contact with experts in the field. Despite these searches, we may have missed eligible studies, in particular if they were not published in indexed peer‐reviewed journals. Our search update yielded several potentially eligible studies (listed under Characteristics of studies awaiting classification) that will be considered in an update of this review. Because of the small number of trials identified for each of the intervention types, we refrained from performing formal statistical tests to detect reporting bias.
To provide a critical discussion of the current state of interventional research on non‐pharmacological SCI pain treatments, we chose to include studies with methodological weaknesses such as unblinded participants, waiting list controls or obvious imbalances in pain measurements at baseline. We stress that these studies are potentially biased towards and may overestimate the effectiveness of experimental treatments. We further emphasise that inclusion of a trial in this review should not be interpreted as accepting it as internally valid and trust that our own conclusions are sufficiently cautious.
In the statistical analyses of all included studies, the data derived from ordinal scales were treated as continuous outcomes and expressed as mean, standard deviation or relative change. These choices made by the trialists also determined our approach and, consequently, represent one of the methodological limitations of our review. It has been argued that ordinal scales do not have the same mathematical properties as continuous variables (Merbitz 1989), and that this may lead to incorrect inference from the data (Stucki 1996). One solution is to convert outcome data to the cardinal metric through use of the Rasch model and to perform an individual patient data meta‐analysis (Newby 2009). However, limited available aggregated data did not allow this approach in this review.
Agreements and disagreements with other studies or reviews
In 2010, the Spinal Cord Injury Rehabilitation Evidence (SCIRE) project published a review on pain treatment following spinal cord injury (SCIRE 2010), which also covered non‐pharmacological approaches and surgical interventions. Although our current review was restricted deliberately to randomised controlled trials, the SCIRE review also included non‐randomised studies (e.g. those using before‐after comparisons). This explains why, for some types of interventions, the conclusions of the SCIRE review differ from ours. In the SCIRE review, tDCS and CES trials were found to be effective. Our findings are consistent with the findings of the SCIRE project for tDCS but do not confirm the effectiveness of CES. For rTMS, the SCIRE review identified solely the trial of Defrin 2007 and concluded that repetitive transcranial magnetic stimulation reduces post‐SCI pain, in contrast to the findings of our review. For exercise programmes, the SCIRE authors made a distinction between exercise for post‐SCI pain and for shoulder pain and identified additional studies comparing baseline and post‐treatment measures (pre‐post trial). They concluded that exercise reduces both post‐SCI pain and shoulder pain, which is in line with our findings. Also for acupuncture, their conclusions were consistent with ours: Acupuncture may reduce post‐SCI pain but is no more effective than Trager treatment or sham acupuncture. Further, the SCIRE review identified a pre‐post study on hypnotic suggestion that was not included in our review. It concluded that hypnosis may reduce pain intensity post‐SCI. Based on two controlled trials, the SCIRE review concluded that cognitive behavioural pain management alone does not alter post‐SCI pain. Furthermore, SCIRE identified two non‐randomised trials on cognitive behavioural therapy. These review authors concluded that cognitive behavioural therapy alone does not change post‐SCI pain intensity; however in combination with pharmacological treatment, it might be effective. We identified solely one randomised controlled trial with 61 participants. Results of this study are insufficient to permit firm conclusions about the effects of the behavioural program on pain.
A Cochrane review on non‐invasive brain stimulation for chronic pain covered several interventions (tDCS, rTMS and CES) that were within the scope of our review (O'Connell 2010). In addition to seven studies (Capel 2003; Defrin 2007; Kang 2009; Lefaucheur 2004; Lefaucheur 2006; Lefaucheur 2008; Tan 2006) with a focus on SCI, this review included pain trials conducted in patients with health conditions other than SCI. The review authors stated that low‐frequency rTMS was not effective in the treatment of chronic pain. For CES and tDCS, they found the evidence insufficient to allow conclusions on their effectiveness. Given that the scope of this review differed from the scope of ours, the findings are not fully comparable. Further, some of the included trials were evaluated differently: First, O'Connell 2010 included all three publications of Lefaucheur et al (Lefaucheur 2004; Lefaucheur 2006; Lefaucheur 2008) as separate trials, whereas we combined the data after clarification with the trialists. Second, the study of Defrin 2007 was included in their meta‐analysis, whereas we excluded it from our sensitivity analysis because of the substantial imbalance in pain scores seen at baseline and the resulting risk of bias.
We came across several studies on non‐pharmacological pain treatments that used study designs other than randomised trials (e.g. surveys). In a recent study, people with SCI were asked which non‐pharmacological pain treatments they perceived as most effective (Heutink 2011). Massage and relaxation therapy were mentioned most commonly. Acupuncture, physiotherapy and exercise, massage and relaxation and psychological treatments were found to be effective. In a survey in a Swedish SCI population, the participants rated TENS as minimally effective and physical training as more effective in reducing pain (Norrbrink 2004). Only half of the participants rated acupuncture as effective. In yet another survey of 120 people living with SCI pain, 47.5% of respondents reported a considerable pain reduction with physical therapy and 61.5% a slight reduction with psychological treatment (Widerstrom‐Noga 2003). Such cross‐sectional data might inform about the common use and perceived effects of non‐pharmacological pain treatments but cannot be compared directly with the results of trials designed to determine treatment effects.

Study flow diagram for search run in March 2011.

Main characteristics of included studies.

Risk of bias summary: review authors' judgements about each risk of bias item for each included study.
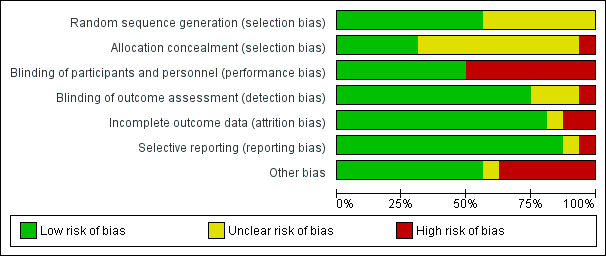
Risk of bias graph: review authors' judgements about each risk of bias item presented as percentages across all included studies.
Secondary outcome measures.
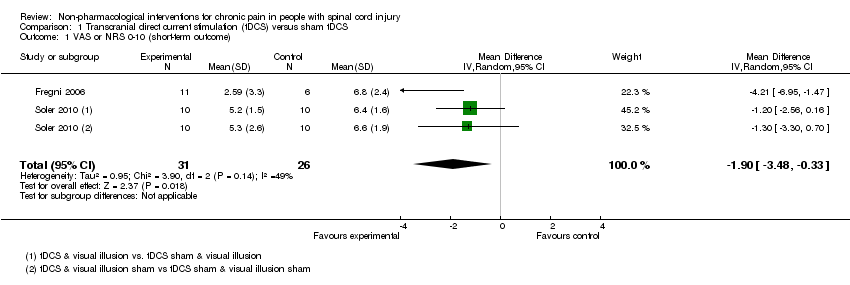
Comparison 1 Transcranial direct current stimulation (tDCS) versus sham tDCS, Outcome 1 VAS or NRS 0‐10 (short‐term outcome).

Comparison 1 Transcranial direct current stimulation (tDCS) versus sham tDCS, Outcome 2 VAS anxiety 0‐10 (short‐term outcome).
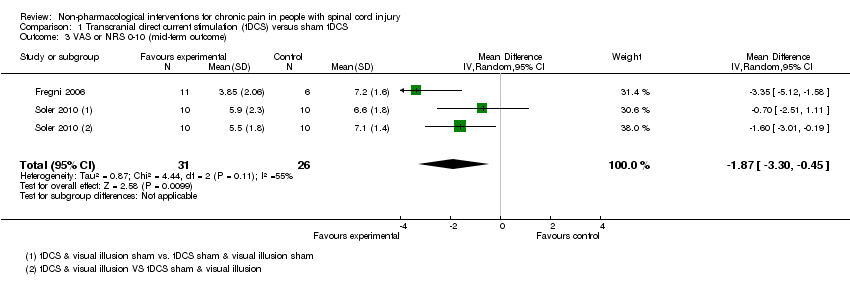
Comparison 1 Transcranial direct current stimulation (tDCS) versus sham tDCS, Outcome 3 VAS or NRS 0‐10 (mid‐term outcome).

Comparison 1 Transcranial direct current stimulation (tDCS) versus sham tDCS, Outcome 4 VAS anxiety 0‐10 (mid‐term outcome).

Comparison 1 Transcranial direct current stimulation (tDCS) versus sham tDCS, Outcome 5 NRS 0‐10 (long‐term outcome).

Comparison 2 Repetitive transcranial magnetic stimulation (rTMS) versus sham rTMS, Outcome 1 NRS 0‐10 (short‐term outcome).
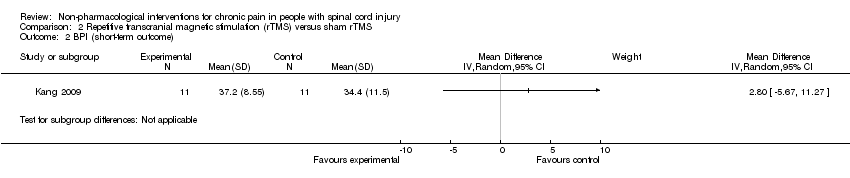
Comparison 2 Repetitive transcranial magnetic stimulation (rTMS) versus sham rTMS, Outcome 2 BPI (short‐term outcome).

Comparison 2 Repetitive transcranial magnetic stimulation (rTMS) versus sham rTMS, Outcome 3 BDI (short‐term outcome).

Comparison 2 Repetitive transcranial magnetic stimulation (rTMS) versus sham rTMS, Outcome 4 NRS 0‐10 (mid‐term outcome).

Comparison 2 Repetitive transcranial magnetic stimulation (rTMS) versus sham rTMS, Outcome 5 BPI (mid‐term outcome).

Comparison 2 Repetitive transcranial magnetic stimulation (rTMS) versus sham rTMS, Outcome 6 BDI (mid‐term outcome).

Comparison 2 Repetitive transcranial magnetic stimulation (rTMS) versus sham rTMS, Outcome 7 NRS 0‐10 (long‐term outcome).

Comparison 2 Repetitive transcranial magnetic stimulation (rTMS) versus sham rTMS, Outcome 8 BPI (long‐term outcome).
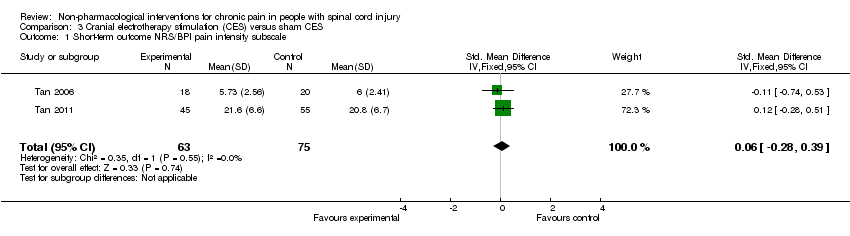
Comparison 3 Cranial electrotherapy stimulation (CES) versus sham CES, Outcome 1 Short‐term outcome NRS/BPI pain intensity subscale.

Comparison 3 Cranial electrotherapy stimulation (CES) versus sham CES, Outcome 2 Sensitivity analysis NRS 0‐10 (short‐term outcomes).
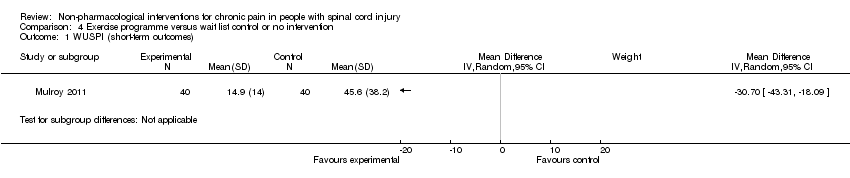
Comparison 4 Exercise programme versus wait list control or no intervention, Outcome 1 WUSPI (short‐term outcomes).

Comparison 4 Exercise programme versus wait list control or no intervention, Outcome 2 VAS 0‐10 (short‐term outcomes).

Comparison 4 Exercise programme versus wait list control or no intervention, Outcome 3 SF‐36 (short‐term outcomes).

Comparison 4 Exercise programme versus wait list control or no intervention, Outcome 4 CES‐D (short‐term outcomes).

Comparison 4 Exercise programme versus wait list control or no intervention, Outcome 5 SQOL (short‐term outcomes).
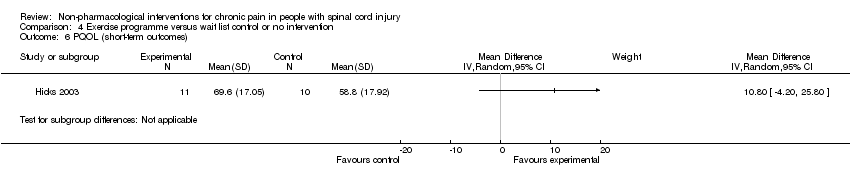
Comparison 4 Exercise programme versus wait list control or no intervention, Outcome 6 PQOL (short‐term outcomes).

Comparison 4 Exercise programme versus wait list control or no intervention, Outcome 7 WUSPI (mid‐term outcome).
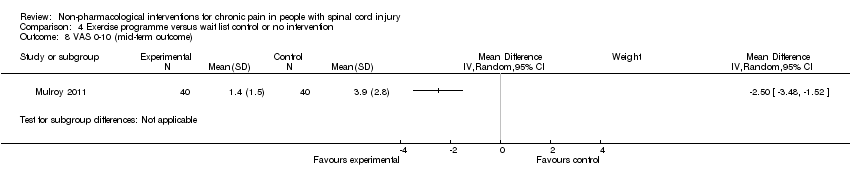
Comparison 4 Exercise programme versus wait list control or no intervention, Outcome 8 VAS 0‐10 (mid‐term outcome).

Comparison 4 Exercise programme versus wait list control or no intervention, Outcome 9 SQOL (mid‐term outcome).
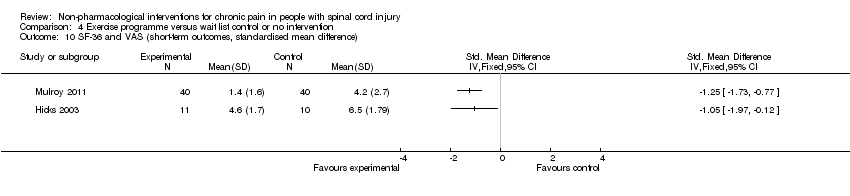
Comparison 4 Exercise programme versus wait list control or no intervention, Outcome 10 SF‐36 and VAS (short‐term outcomes, standardised mean difference).

Comparison 4 Exercise programme versus wait list control or no intervention, Outcome 11 WUSPI and VAS (short‐term outcomes, standardised mean difference).
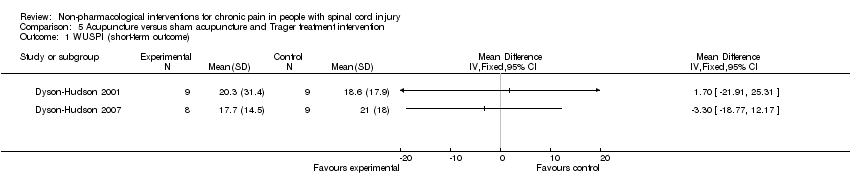
Comparison 5 Acupuncture versus sham acupuncture and Trager treatment intervention, Outcome 1 WUSPI (short‐term outcome).

Comparison 5 Acupuncture versus sham acupuncture and Trager treatment intervention, Outcome 2 WUSPI (mid‐term outcome).
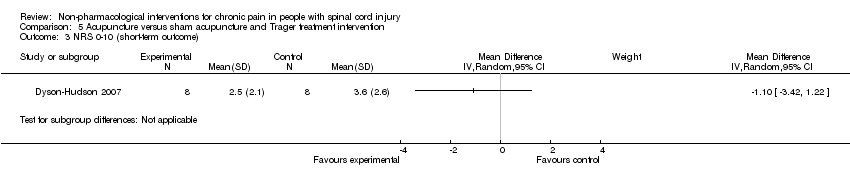
Comparison 5 Acupuncture versus sham acupuncture and Trager treatment intervention, Outcome 3 NRS 0‐10 (short‐term outcome).

Comparison 5 Acupuncture versus sham acupuncture and Trager treatment intervention, Outcome 4 NRS 0‐10 (mid‐term outcome).

Comparison 6 Transcutaneous electrical nerve stimulation (TENS) versus sham TENS, Outcome 1 DDS neurogenic pain intensity (short‐term outcomes).

Comparison 6 Transcutaneous electrical nerve stimulation (TENS) versus sham TENS, Outcome 2 DDS musculoskeletal pain intensity (short‐term outcomes).
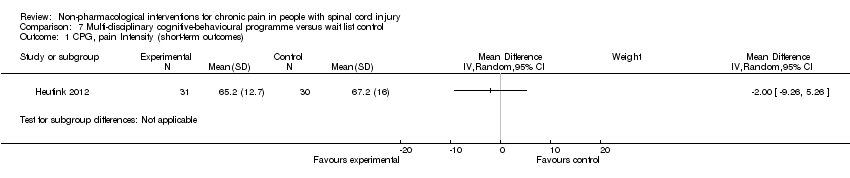
Comparison 7 Multi‐disciplinary cognitive‐behavioural programme versus wait list control, Outcome 1 CPG, pain Intensity (short‐term outcomes).

Comparison 7 Multi‐disciplinary cognitive‐behavioural programme versus wait list control, Outcome 2 CPG, pain‐related disability (short‐term outcomes).

Comparison 7 Multi‐disciplinary cognitive‐behavioural programme versus wait list control, Outcome 3 HADS, anxiety (short‐term outcomes).

Comparison 7 Multi‐disciplinary cognitive‐behavioural programme versus wait list control, Outcome 4 CPG, pain intensity (long‐term outcomes).

Comparison 7 Multi‐disciplinary cognitive‐behavioural programme versus wait list control, Outcome 5 CPG, pain‐related disability (long‐term outcomes).

Comparison 7 Multi‐disciplinary cognitive‐behavioural programme versus wait list control, Outcome 6 HADS, anxiety (long‐term outcomes).
| Outcome or subgroup title | No. of studies | No. of participants | Statistical method | Effect size |
| 1 VAS or NRS 0‐10 (short‐term outcome) Show forest plot | 2 | 57 | Mean Difference (IV, Random, 95% CI) | ‐1.90 [‐3.48, ‐0.33] |
| 2 VAS anxiety 0‐10 (short‐term outcome) Show forest plot | 1 | Mean Difference (IV, Random, 95% CI) | Subtotals only | |
| 3 VAS or NRS 0‐10 (mid‐term outcome) Show forest plot | 2 | 57 | Mean Difference (IV, Random, 95% CI) | ‐1.87 [‐3.30, ‐0.45] |
| 4 VAS anxiety 0‐10 (mid‐term outcome) Show forest plot | 1 | Mean Difference (IV, Random, 95% CI) | Subtotals only | |
| 5 NRS 0‐10 (long‐term outcome) Show forest plot | 1 | 39 | Mean Difference (IV, Fixed, 95% CI) | ‐0.73 [‐1.82, 0.35] |
| Outcome or subgroup title | No. of studies | No. of participants | Statistical method | Effect size |
| 1 NRS 0‐10 (short‐term outcome) Show forest plot | 3 | Mean Difference (IV, Random, 95% CI) | Totals not selected | |
| 2 BPI (short‐term outcome) Show forest plot | 1 | Mean Difference (IV, Random, 95% CI) | Subtotals only | |
| 3 BDI (short‐term outcome) Show forest plot | 1 | Mean Difference (IV, Random, 95% CI) | Subtotals only | |
| 4 NRS 0‐10 (mid‐term outcome) Show forest plot | 1 | Mean Difference (IV, Random, 95% CI) | Subtotals only | |
| 5 BPI (mid‐term outcome) Show forest plot | 1 | Mean Difference (IV, Random, 95% CI) | Subtotals only | |
| 6 BDI (mid‐term outcome) Show forest plot | 1 | Mean Difference (IV, Random, 95% CI) | Subtotals only | |
| 7 NRS 0‐10 (long‐term outcome) Show forest plot | 1 | Mean Difference (IV, Random, 95% CI) | Subtotals only | |
| 8 BPI (long‐term outcome) Show forest plot | 1 | Mean Difference (IV, Random, 95% CI) | Subtotals only | |
| Outcome or subgroup title | No. of studies | No. of participants | Statistical method | Effect size |
| 1 Short‐term outcome NRS/BPI pain intensity subscale Show forest plot | 2 | 138 | Std. Mean Difference (IV, Fixed, 95% CI) | 0.06 [‐0.28, 0.39] |
| 2 Sensitivity analysis NRS 0‐10 (short‐term outcomes) Show forest plot | 1 | Mean Difference (IV, Random, 95% CI) | Subtotals only | |
| Outcome or subgroup title | No. of studies | No. of participants | Statistical method | Effect size |
| 1 WUSPI (short‐term outcomes) Show forest plot | 1 | Mean Difference (IV, Random, 95% CI) | Subtotals only | |
| 2 VAS 0‐10 (short‐term outcomes) Show forest plot | 1 | Mean Difference (IV, Random, 95% CI) | Subtotals only | |
| 3 SF‐36 (short‐term outcomes) Show forest plot | 1 | Mean Difference (IV, Random, 95% CI) | Subtotals only | |
| 4 CES‐D (short‐term outcomes) Show forest plot | 1 | Mean Difference (IV, Random, 95% CI) | Subtotals only | |
| 5 SQOL (short‐term outcomes) Show forest plot | 1 | Mean Difference (IV, Random, 95% CI) | Subtotals only | |
| 6 PQOL (short‐term outcomes) Show forest plot | 1 | Mean Difference (IV, Random, 95% CI) | Subtotals only | |
| 7 WUSPI (mid‐term outcome) Show forest plot | 1 | Mean Difference (IV, Random, 95% CI) | Subtotals only | |
| 8 VAS 0‐10 (mid‐term outcome) Show forest plot | 1 | Mean Difference (IV, Random, 95% CI) | Subtotals only | |
| 9 SQOL (mid‐term outcome) Show forest plot | 1 | Mean Difference (IV, Random, 95% CI) | Subtotals only | |
| 10 SF‐36 and VAS (short‐term outcomes, standardised mean difference) Show forest plot | 2 | Std. Mean Difference (IV, Fixed, 95% CI) | Totals not selected | |
| 11 WUSPI and VAS (short‐term outcomes, standardised mean difference) Show forest plot | 2 | Std. Mean Difference (IV, Fixed, 95% CI) | Totals not selected | |
| Outcome or subgroup title | No. of studies | No. of participants | Statistical method | Effect size |
| 1 WUSPI (short‐term outcome) Show forest plot | 2 | Mean Difference (IV, Fixed, 95% CI) | Totals not selected | |
| 2 WUSPI (mid‐term outcome) Show forest plot | 2 | Mean Difference (IV, Fixed, 95% CI) | Totals not selected | |
| 3 NRS 0‐10 (short‐term outcome) Show forest plot | 1 | Mean Difference (IV, Random, 95% CI) | Subtotals only | |
| 4 NRS 0‐10 (mid‐term outcome) Show forest plot | 1 | Mean Difference (IV, Random, 95% CI) | Subtotals only | |
| Outcome or subgroup title | No. of studies | No. of participants | Statistical method | Effect size |
| 1 DDS neurogenic pain intensity (short‐term outcomes) Show forest plot | 1 | Mean Difference (IV, Fixed, 95% CI) | Totals not selected | |
| 1.1 Neutral expectation | 1 | Mean Difference (IV, Fixed, 95% CI) | 0.0 [0.0, 0.0] | |
| 1.2 Positive expectation | 1 | Mean Difference (IV, Fixed, 95% CI) | 0.0 [0.0, 0.0] | |
| 2 DDS musculoskeletal pain intensity (short‐term outcomes) Show forest plot | 1 | Mean Difference (IV, Fixed, 95% CI) | Totals not selected | |
| 2.1 Neutral expectation | 1 | Mean Difference (IV, Fixed, 95% CI) | 0.0 [0.0, 0.0] | |
| 2.2 Positive expectation | 1 | Mean Difference (IV, Fixed, 95% CI) | 0.0 [0.0, 0.0] | |
| Outcome or subgroup title | No. of studies | No. of participants | Statistical method | Effect size |
| 1 CPG, pain Intensity (short‐term outcomes) Show forest plot | 1 | Mean Difference (IV, Random, 95% CI) | Subtotals only | |
| 2 CPG, pain‐related disability (short‐term outcomes) Show forest plot | 1 | Mean Difference (IV, Random, 95% CI) | Subtotals only | |
| 3 HADS, anxiety (short‐term outcomes) Show forest plot | 1 | Mean Difference (IV, Random, 95% CI) | Subtotals only | |
| 4 CPG, pain intensity (long‐term outcomes) Show forest plot | 1 | Mean Difference (IV, Random, 95% CI) | Subtotals only | |
| 5 CPG, pain‐related disability (long‐term outcomes) Show forest plot | 1 | Mean Difference (IV, Random, 95% CI) | Subtotals only | |
| 6 HADS, anxiety (long‐term outcomes) Show forest plot | 1 | Mean Difference (IV, Random, 95% CI) | Subtotals only | |