Intervenciones no farmacológicas para el dolor crónico en pacientes con lesión de la médula espinal
Información
- DOI:
- https://doi.org/10.1002/14651858.CD009177.pub2Copiar DOI

- Base de datos:
-
- Cochrane Database of Systematic Reviews
- Versión publicada:
-
- 28 noviembre 2014see what's new
- Tipo:
-
- Intervention
- Etapa:
-
- Review
- Grupo Editorial Cochrane:
-
Grupo Cochrane de Lesiones
- Copyright:
-
- Copyright © 2014 The Cochrane Collaboration. Published by John Wiley & Sons, Ltd.
Cifras del artículo
Altmetric:
Citado por:
Autores
Contributions of authors
IB wrote the review protocol and drafted the final manuscript, searched electronic databases and conference proceedings, screened identified references, selected trials for inclusion, extracted trial data and liaised with trialists, assessed methodological quality, performed statistical analyses and interpreted results. IEH extracted trial data, assessed methodological quality and provided input on draft versions of the protocol and review. MWGB extracted trial data, assessed methodological quality, provided statistical advice and provided input on draft versions of the protocol and review. RdB and DJ provided input on draft versions of the protocol and review. EvE wrote the review protocol and drafted the final manuscript, selected trials for inclusion, extracted trial data, assessed methodological quality and guided statistical analyses and interpretation of results. All review authors approved the final version of this review.
Sources of support
Internal sources
-
Swiss Paraplegic Research, Nottwil, Switzerland.
External sources
-
No sources of support supplied
Declarations of interest
IB: None known.
IEH: None known.
MWGB: None known.
RdB: None known.
DJ: None known.
EvE: None known.
Acknowledgements
We thank the trial search co‐ordinators of the Cochrane Injuries Group, Ms Karen Blackwell and Ms Deirdre Beecher, for help provided in searching literature databases and the librarians of Swiss Paraplegic Research, Nottwil, Switzerland for support provided in retrieving literature.
Version history
| Published | Title | Stage | Authors | Version |
| 2014 Nov 28 | Non‐pharmacological interventions for chronic pain in people with spinal cord injury | Review | Inga Boldt, Inge Eriks‐Hoogland, Martin WG Brinkhof, Rob de Bie, Daniel Joggi, Erik von Elm | |
| 2011 Jul 06 | Non‐pharmacological interventions for chronic pain in people with spinal cord injury | Protocol | Inga Boldt, Inge Eriks‐Hoogland, Martin W.G. Brinkhof, Rob A Bie, Erik von Elm | |
Differences between protocol and review
We had planned to conduct subgroup analyses for trials in patients with different types of SCI or pain and with different types of control interventions. However, the small number of included studies precluded these analyses. For the same reason, we did not perform planned sensitivity analyses for studies with mixed populations including a subgroup with SCI and for trials of different methodological quality (e.g. allocation concealment, blinding, intention‐to‐treat analysis), and we did not perform imputation of missing values.
We had intended to analyse continuous outcomes as mean change from baseline; however, few studies reported mean change from baseline. Comparisons were consequently based on differences between mean values from last measurement.
In the section Unit of analysis issues, we now explain that none of the three included cross‐over trials was included in any meta‐analysis because of large differences in study methods.
In the section Data synthesis, we now explain that meta‐analysis was conducted using the random‐effects model and that the fixed‐effect model was used only to combine data from pairs of similar study groups from two factorial trials in two meta‐analyses. Further, we specify that, for the purpose of meta‐analysis, ordinal outcome data were treated as continuous variables.
Keywords
MeSH
Medical Subject Headings (MeSH) Keywords
- Acupuncture Therapy [methods];
- Anxiety [therapy];
- Chronic Pain [psychology, *therapy];
- Cognitive Behavioral Therapy [methods];
- Depression [therapy];
- Electric Stimulation Therapy [methods];
- Exercise Therapy [methods];
- Hypnosis [methods];
- Neuralgia [psychology, *therapy];
- Nociceptive Pain [psychology, *therapy];
- Pain Management [*methods];
- Pain Measurement [methods];
- Quality of Life;
- Randomized Controlled Trials as Topic;
- Reproducibility of Results;
- Shoulder Pain [therapy];
- Spinal Cord Injuries [*complications];
- Transcranial Magnetic Stimulation [methods];
- Transcutaneous Electric Nerve Stimulation [methods];
Medical Subject Headings Check Words
Humans;
PICO

Study flow diagram for search run in March 2011.

Main characteristics of included studies.

Risk of bias summary: review authors' judgements about each risk of bias item for each included study.
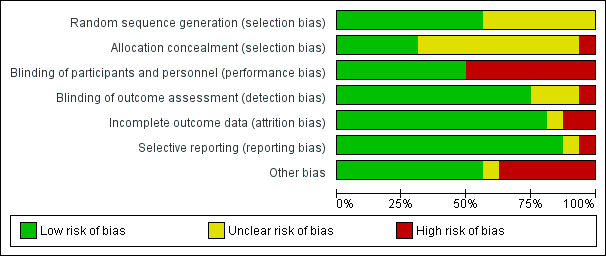
Risk of bias graph: review authors' judgements about each risk of bias item presented as percentages across all included studies.
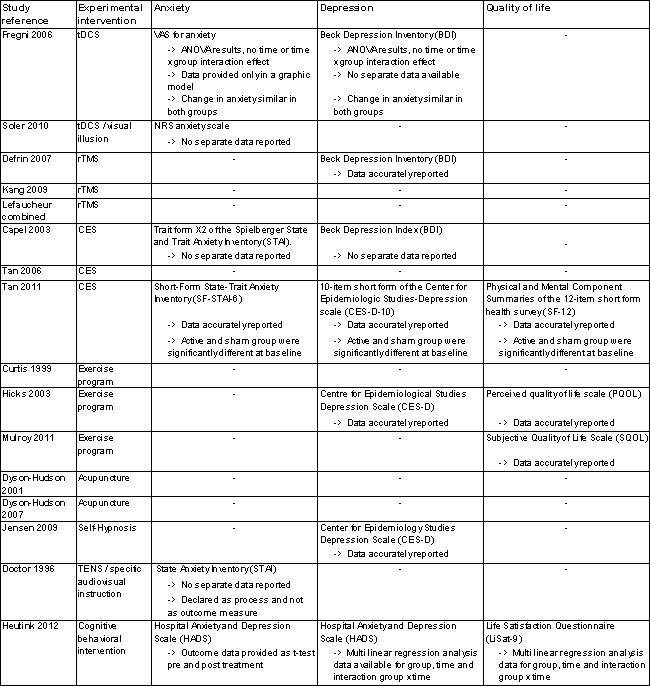
Secondary outcome measures.
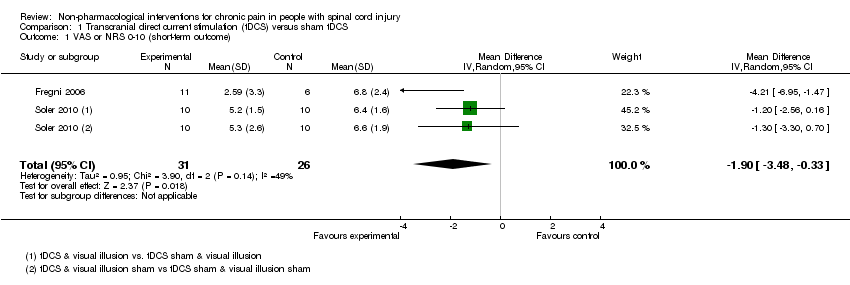
Comparison 1 Transcranial direct current stimulation (tDCS) versus sham tDCS, Outcome 1 VAS or NRS 0‐10 (short‐term outcome).

Comparison 1 Transcranial direct current stimulation (tDCS) versus sham tDCS, Outcome 2 VAS anxiety 0‐10 (short‐term outcome).
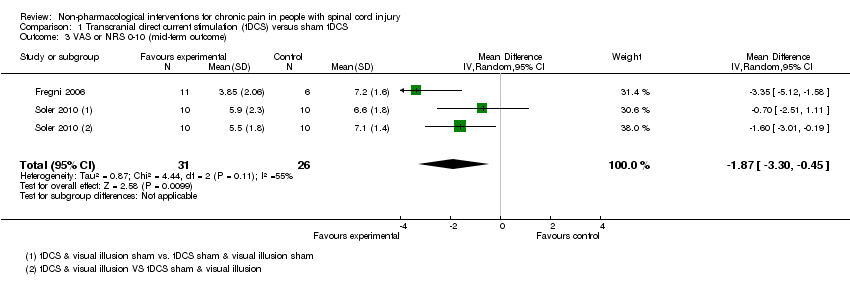
Comparison 1 Transcranial direct current stimulation (tDCS) versus sham tDCS, Outcome 3 VAS or NRS 0‐10 (mid‐term outcome).

Comparison 1 Transcranial direct current stimulation (tDCS) versus sham tDCS, Outcome 4 VAS anxiety 0‐10 (mid‐term outcome).

Comparison 1 Transcranial direct current stimulation (tDCS) versus sham tDCS, Outcome 5 NRS 0‐10 (long‐term outcome).

Comparison 2 Repetitive transcranial magnetic stimulation (rTMS) versus sham rTMS, Outcome 1 NRS 0‐10 (short‐term outcome).
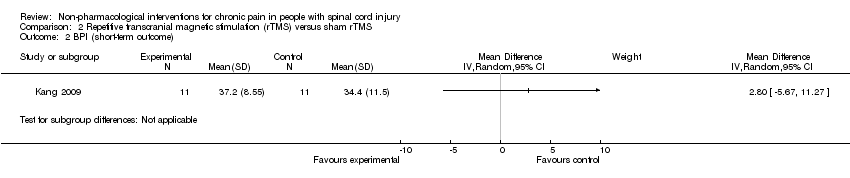
Comparison 2 Repetitive transcranial magnetic stimulation (rTMS) versus sham rTMS, Outcome 2 BPI (short‐term outcome).

Comparison 2 Repetitive transcranial magnetic stimulation (rTMS) versus sham rTMS, Outcome 3 BDI (short‐term outcome).

Comparison 2 Repetitive transcranial magnetic stimulation (rTMS) versus sham rTMS, Outcome 4 NRS 0‐10 (mid‐term outcome).

Comparison 2 Repetitive transcranial magnetic stimulation (rTMS) versus sham rTMS, Outcome 5 BPI (mid‐term outcome).

Comparison 2 Repetitive transcranial magnetic stimulation (rTMS) versus sham rTMS, Outcome 6 BDI (mid‐term outcome).

Comparison 2 Repetitive transcranial magnetic stimulation (rTMS) versus sham rTMS, Outcome 7 NRS 0‐10 (long‐term outcome).

Comparison 2 Repetitive transcranial magnetic stimulation (rTMS) versus sham rTMS, Outcome 8 BPI (long‐term outcome).
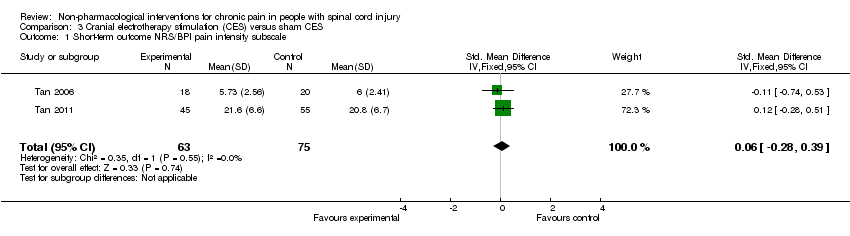
Comparison 3 Cranial electrotherapy stimulation (CES) versus sham CES, Outcome 1 Short‐term outcome NRS/BPI pain intensity subscale.

Comparison 3 Cranial electrotherapy stimulation (CES) versus sham CES, Outcome 2 Sensitivity analysis NRS 0‐10 (short‐term outcomes).
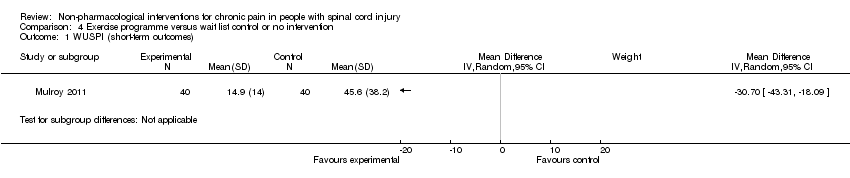
Comparison 4 Exercise programme versus wait list control or no intervention, Outcome 1 WUSPI (short‐term outcomes).

Comparison 4 Exercise programme versus wait list control or no intervention, Outcome 2 VAS 0‐10 (short‐term outcomes).

Comparison 4 Exercise programme versus wait list control or no intervention, Outcome 3 SF‐36 (short‐term outcomes).

Comparison 4 Exercise programme versus wait list control or no intervention, Outcome 4 CES‐D (short‐term outcomes).

Comparison 4 Exercise programme versus wait list control or no intervention, Outcome 5 SQOL (short‐term outcomes).
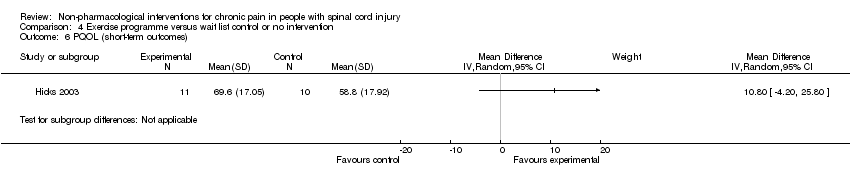
Comparison 4 Exercise programme versus wait list control or no intervention, Outcome 6 PQOL (short‐term outcomes).

Comparison 4 Exercise programme versus wait list control or no intervention, Outcome 7 WUSPI (mid‐term outcome).
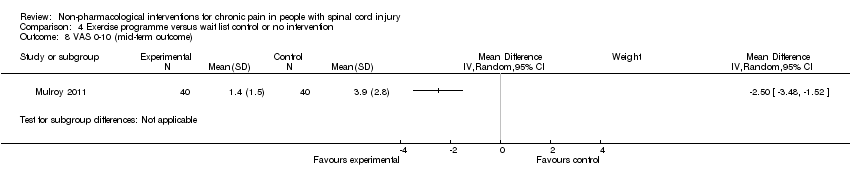
Comparison 4 Exercise programme versus wait list control or no intervention, Outcome 8 VAS 0‐10 (mid‐term outcome).

Comparison 4 Exercise programme versus wait list control or no intervention, Outcome 9 SQOL (mid‐term outcome).
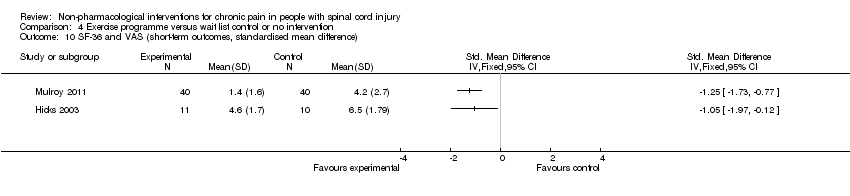
Comparison 4 Exercise programme versus wait list control or no intervention, Outcome 10 SF‐36 and VAS (short‐term outcomes, standardised mean difference).

Comparison 4 Exercise programme versus wait list control or no intervention, Outcome 11 WUSPI and VAS (short‐term outcomes, standardised mean difference).
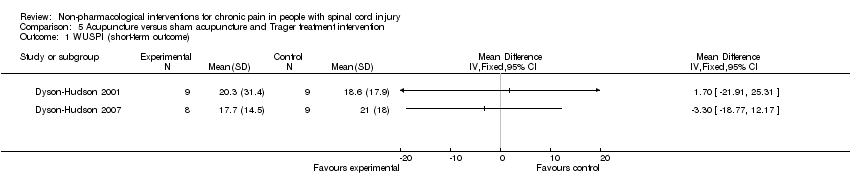
Comparison 5 Acupuncture versus sham acupuncture and Trager treatment intervention, Outcome 1 WUSPI (short‐term outcome).

Comparison 5 Acupuncture versus sham acupuncture and Trager treatment intervention, Outcome 2 WUSPI (mid‐term outcome).
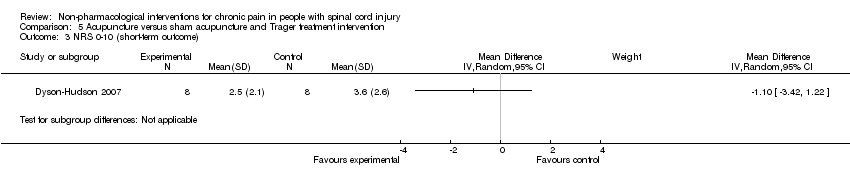
Comparison 5 Acupuncture versus sham acupuncture and Trager treatment intervention, Outcome 3 NRS 0‐10 (short‐term outcome).

Comparison 5 Acupuncture versus sham acupuncture and Trager treatment intervention, Outcome 4 NRS 0‐10 (mid‐term outcome).

Comparison 6 Transcutaneous electrical nerve stimulation (TENS) versus sham TENS, Outcome 1 DDS neurogenic pain intensity (short‐term outcomes).

Comparison 6 Transcutaneous electrical nerve stimulation (TENS) versus sham TENS, Outcome 2 DDS musculoskeletal pain intensity (short‐term outcomes).
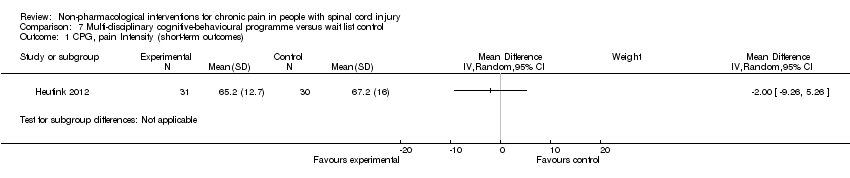
Comparison 7 Multi‐disciplinary cognitive‐behavioural programme versus wait list control, Outcome 1 CPG, pain Intensity (short‐term outcomes).

Comparison 7 Multi‐disciplinary cognitive‐behavioural programme versus wait list control, Outcome 2 CPG, pain‐related disability (short‐term outcomes).

Comparison 7 Multi‐disciplinary cognitive‐behavioural programme versus wait list control, Outcome 3 HADS, anxiety (short‐term outcomes).

Comparison 7 Multi‐disciplinary cognitive‐behavioural programme versus wait list control, Outcome 4 CPG, pain intensity (long‐term outcomes).

Comparison 7 Multi‐disciplinary cognitive‐behavioural programme versus wait list control, Outcome 5 CPG, pain‐related disability (long‐term outcomes).

Comparison 7 Multi‐disciplinary cognitive‐behavioural programme versus wait list control, Outcome 6 HADS, anxiety (long‐term outcomes).
| Outcome or subgroup title | No. of studies | No. of participants | Statistical method | Effect size |
| 1 VAS or NRS 0‐10 (short‐term outcome) Show forest plot | 2 | 57 | Mean Difference (IV, Random, 95% CI) | ‐1.90 [‐3.48, ‐0.33] |
| 2 VAS anxiety 0‐10 (short‐term outcome) Show forest plot | 1 | Mean Difference (IV, Random, 95% CI) | Subtotals only | |
| 3 VAS or NRS 0‐10 (mid‐term outcome) Show forest plot | 2 | 57 | Mean Difference (IV, Random, 95% CI) | ‐1.87 [‐3.30, ‐0.45] |
| 4 VAS anxiety 0‐10 (mid‐term outcome) Show forest plot | 1 | Mean Difference (IV, Random, 95% CI) | Subtotals only | |
| 5 NRS 0‐10 (long‐term outcome) Show forest plot | 1 | 39 | Mean Difference (IV, Fixed, 95% CI) | ‐0.73 [‐1.82, 0.35] |
| Outcome or subgroup title | No. of studies | No. of participants | Statistical method | Effect size |
| 1 NRS 0‐10 (short‐term outcome) Show forest plot | 3 | Mean Difference (IV, Random, 95% CI) | Totals not selected | |
| 2 BPI (short‐term outcome) Show forest plot | 1 | Mean Difference (IV, Random, 95% CI) | Subtotals only | |
| 3 BDI (short‐term outcome) Show forest plot | 1 | Mean Difference (IV, Random, 95% CI) | Subtotals only | |
| 4 NRS 0‐10 (mid‐term outcome) Show forest plot | 1 | Mean Difference (IV, Random, 95% CI) | Subtotals only | |
| 5 BPI (mid‐term outcome) Show forest plot | 1 | Mean Difference (IV, Random, 95% CI) | Subtotals only | |
| 6 BDI (mid‐term outcome) Show forest plot | 1 | Mean Difference (IV, Random, 95% CI) | Subtotals only | |
| 7 NRS 0‐10 (long‐term outcome) Show forest plot | 1 | Mean Difference (IV, Random, 95% CI) | Subtotals only | |
| 8 BPI (long‐term outcome) Show forest plot | 1 | Mean Difference (IV, Random, 95% CI) | Subtotals only | |
| Outcome or subgroup title | No. of studies | No. of participants | Statistical method | Effect size |
| 1 Short‐term outcome NRS/BPI pain intensity subscale Show forest plot | 2 | 138 | Std. Mean Difference (IV, Fixed, 95% CI) | 0.06 [‐0.28, 0.39] |
| 2 Sensitivity analysis NRS 0‐10 (short‐term outcomes) Show forest plot | 1 | Mean Difference (IV, Random, 95% CI) | Subtotals only | |
| Outcome or subgroup title | No. of studies | No. of participants | Statistical method | Effect size |
| 1 WUSPI (short‐term outcomes) Show forest plot | 1 | Mean Difference (IV, Random, 95% CI) | Subtotals only | |
| 2 VAS 0‐10 (short‐term outcomes) Show forest plot | 1 | Mean Difference (IV, Random, 95% CI) | Subtotals only | |
| 3 SF‐36 (short‐term outcomes) Show forest plot | 1 | Mean Difference (IV, Random, 95% CI) | Subtotals only | |
| 4 CES‐D (short‐term outcomes) Show forest plot | 1 | Mean Difference (IV, Random, 95% CI) | Subtotals only | |
| 5 SQOL (short‐term outcomes) Show forest plot | 1 | Mean Difference (IV, Random, 95% CI) | Subtotals only | |
| 6 PQOL (short‐term outcomes) Show forest plot | 1 | Mean Difference (IV, Random, 95% CI) | Subtotals only | |
| 7 WUSPI (mid‐term outcome) Show forest plot | 1 | Mean Difference (IV, Random, 95% CI) | Subtotals only | |
| 8 VAS 0‐10 (mid‐term outcome) Show forest plot | 1 | Mean Difference (IV, Random, 95% CI) | Subtotals only | |
| 9 SQOL (mid‐term outcome) Show forest plot | 1 | Mean Difference (IV, Random, 95% CI) | Subtotals only | |
| 10 SF‐36 and VAS (short‐term outcomes, standardised mean difference) Show forest plot | 2 | Std. Mean Difference (IV, Fixed, 95% CI) | Totals not selected | |
| 11 WUSPI and VAS (short‐term outcomes, standardised mean difference) Show forest plot | 2 | Std. Mean Difference (IV, Fixed, 95% CI) | Totals not selected | |
| Outcome or subgroup title | No. of studies | No. of participants | Statistical method | Effect size |
| 1 WUSPI (short‐term outcome) Show forest plot | 2 | Mean Difference (IV, Fixed, 95% CI) | Totals not selected | |
| 2 WUSPI (mid‐term outcome) Show forest plot | 2 | Mean Difference (IV, Fixed, 95% CI) | Totals not selected | |
| 3 NRS 0‐10 (short‐term outcome) Show forest plot | 1 | Mean Difference (IV, Random, 95% CI) | Subtotals only | |
| 4 NRS 0‐10 (mid‐term outcome) Show forest plot | 1 | Mean Difference (IV, Random, 95% CI) | Subtotals only | |
| Outcome or subgroup title | No. of studies | No. of participants | Statistical method | Effect size |
| 1 DDS neurogenic pain intensity (short‐term outcomes) Show forest plot | 1 | Mean Difference (IV, Fixed, 95% CI) | Totals not selected | |
| 1.1 Neutral expectation | 1 | Mean Difference (IV, Fixed, 95% CI) | 0.0 [0.0, 0.0] | |
| 1.2 Positive expectation | 1 | Mean Difference (IV, Fixed, 95% CI) | 0.0 [0.0, 0.0] | |
| 2 DDS musculoskeletal pain intensity (short‐term outcomes) Show forest plot | 1 | Mean Difference (IV, Fixed, 95% CI) | Totals not selected | |
| 2.1 Neutral expectation | 1 | Mean Difference (IV, Fixed, 95% CI) | 0.0 [0.0, 0.0] | |
| 2.2 Positive expectation | 1 | Mean Difference (IV, Fixed, 95% CI) | 0.0 [0.0, 0.0] | |
| Outcome or subgroup title | No. of studies | No. of participants | Statistical method | Effect size |
| 1 CPG, pain Intensity (short‐term outcomes) Show forest plot | 1 | Mean Difference (IV, Random, 95% CI) | Subtotals only | |
| 2 CPG, pain‐related disability (short‐term outcomes) Show forest plot | 1 | Mean Difference (IV, Random, 95% CI) | Subtotals only | |
| 3 HADS, anxiety (short‐term outcomes) Show forest plot | 1 | Mean Difference (IV, Random, 95% CI) | Subtotals only | |
| 4 CPG, pain intensity (long‐term outcomes) Show forest plot | 1 | Mean Difference (IV, Random, 95% CI) | Subtotals only | |
| 5 CPG, pain‐related disability (long‐term outcomes) Show forest plot | 1 | Mean Difference (IV, Random, 95% CI) | Subtotals only | |
| 6 HADS, anxiety (long‐term outcomes) Show forest plot | 1 | Mean Difference (IV, Random, 95% CI) | Subtotals only | |