Latihan fonik untuk penutur Bahasa Inggeris yang lemah membaca.
Abstract
Background
Around 5% of English speakers have a significant problem with learning to read words. Poor word readers are often trained to use letter‐sound rules to improve their reading skills. This training is commonly called phonics. Well over 100 studies have administered some form of phonics training to poor word readers. However, there are surprisingly few systematic reviews or meta‐analyses of these studies. The most well‐known review was done by the National Reading Panel (Ehri 2001) 12 years ago and needs updating. The most recent review (Suggate 2010) focused solely on children and did not include unpublished studies.
Objectives
The primary aim of this review was to measure the effect that phonics training has on the literacy skills of English‐speaking children, adolescents, and adults whose reading was at least one standard deviation (SD), one year, or one grade below the expected level, despite no reported problems that could explain their impaired ability to learn to read. A secondary objective was to explore the impact of various factors, such as length of training or training group size, that might moderate the effect of phonics training on poor word reading skills.
Search methods
We searched the following databases in July 2012: CENTRAL 2012 (Issue 6), MEDLINE 1948 to June week 3 2012, EMBASE 1980 to 2012 week 26, DARE 2013 (Issue 6), ERIC (1966 to current), PsycINFO (1806 to current), CINAHL (1938 to current), Science Citation Index (1970 to 29 June 2012), Social Science Citation Index (1970 to 29 June 2012), Conference Proceedings Citation Index ‐ Science (1990 to 29 June 2012), Conference Proceedings Citation Index ‐ Social Science & Humanities (1990 to 29 June 2012), ZETOC, Index to Theses‐UK and Ireland, ClinicalTrials.gov, ICTRP, the metaRegister of Controlled Trials, ProQuest Dissertations and Theses, DART Europe E‐theses Portal, Australasian Digital Theses Program, Education Research Theses, Electronic Theses Online System, Networked Digital Library of Theses and Dissertations. Theses Canada portal, www.dissertation.com, and www.thesisabstracts.com. We also contacted experts and examined the reference lists of published studies.
Selection criteria
We included studies that use randomisation, quasi‐randomisation, or minimisation to allocate participants to either a phonics intervention group (phonics alone, phonics and phoneme awareness training, or phonics and irregular word reading training) or a control group (no training or alternative training, such as maths). Participants were English‐speaking children, adolescents, or adults whose word reading was below the level expected for their age for no known reason (that is, they had adequate attention and no known physical, neurological, or psychological problems).
Data collection and analysis
Two review authors independently selected studies, assessed risk of bias, and extracted data.
Main results
We found 11 studies that met the criteria for this review. They involved 736 participants. We measured the effect of phonics training on eight outcomes. The amount of evidence for each outcome varied considerably, ranging from 10 studies for word reading accuracy to one study for nonword reading fluency. The effect sizes for the outcomes were: word reading accuracy standardised mean difference (SMD) 0.47 (95% confidence interval (CI) 0.06 to 0.88; 10 studies), nonword reading accuracy SMD 0.76 (95% CI 0.25 to 1.27; eight studies), word reading fluency SMD ‐0.51 (95% CI ‐1.14 to 0.13; two studies), reading comprehension SMD 0.14 (95% CI ‐0.46 to 0.74; three studies), spelling SMD 0.36 (95% CI ‐0.27 to 1.00; two studies), letter‐sound knowledge SMD 0.35 (95% CI 0.04 to 0.65; three studies), and phonological output SMD 0.38 (95% ‐0.04 to 0.80; four studies). There was one result in a negative direction for nonword reading fluency SMD 0.38 (95% CI ‐0.55 to 1.32; one study), though this was not statistically significant.
We did five subgroup analyses on two outcomes that had sufficient data (word reading accuracy and nonword reading accuracy). The efficacy of phonics training was not moderated significantly by training type (phonics alone versus phonics and phoneme awareness versus phonics and irregular word training), training intensity (less than two hours per week versus at least two hours per week), training duration (less than three months versus at least three months), training group size (one‐on‐one versus small group training), or training administrator (human administration versus computer administration).
Authors' conclusions
Phonics training appears to be effective for improving some reading skills. Specifically, statistically significant effects were found for nonword reading accuracy (large effect), word reading accuracy (moderate effect), and letter‐sound knowledge (small‐to‐moderate effect). For several other outcomes, there were small or moderate effect sizes that did not reach statistical significance but may be meaningful: word reading fluency, spelling, phonological output, and reading comprehension. The effect for nonword reading fluency, which was measured in only one study, was in a negative direction, but this was not statistically significant.
Future studies of phonics training need to improve the reporting of procedures used for random sequence generation, allocation concealment, and blinding of participants, personnel, and outcome assessment.
PICO
Ringkasan bahasa mudah
Latihan fonik untuk penutur Bahasa Inggeris yang lemah membaca.
Dianggarkan 5% daripada penutur Bahasa Inggeris ada masalah ketara belajar membaca perkataan. Pembaca yang lemah ini selalunya dilatih untuk menggunakan kaedah bunyi huruf bagi meningkatkan kemahiran membaca. Latihan ini biasanya digelar latihan fonik. Tujuan utama ulasan ini adalah untuk menentukan keberkesanan latihan fonik dalam meningkatkan lapan kemahiran literasi (celik huruf) untuk pembaca lemah yang berbahasa Inggeris. Objektif kedua adalah untuk meneliti kesan pelbagai faktor, seperti jangka masa latihan dan saiz kumpulan untuk latihan, yang mungkin menyederhanakan kesan latihan fonik ke atas kemahiran membaca perkataan yang lemah.
Kami menemui 11 kajian yang menepati kehendak ulasan ini. Kajian ini melibatkan 736 respoden. Jumlah bukti untuk setiap kemahiran literasi adalah pebagai, iaitu kira‐kira 10 kajian untuk ketepatan membaca perkataan dan hanya satu kajian untuk kefasihan membaca nonword atau ‘bukan kata benar’ ( huruf yang disusun untuk membentuk perkataan yang tidak wujud).
Hasil menunjukkan latihan fonik mungkin berkesan untuk meningkatkan beberapa kemahiran membaca. Secara khusus, ia mempunyai kesan besar terhadap ketepatan membaca nonword, kesan sederhana terhadap ketepatan membaca perkataan, dan kesan kecil hingga sederhana untuk pengetahuan bunyi huruf. Untuk beberapa hasil (kefasihan membaca perkataan, ejaan, output fonologi dan kefahaman membaca), latihan fonik mungkin ada kesan kecil atau sederhana, tetapi ia sukar untuk dipastikan kerana hasil itu mungkin disebabkan kebetulan. Keputusan untuk kefasihan membaca nonword, yang diukur dalam satu kajian sahaja, menunjukkan keputusan negatif yang mungkin juga satu kebetulan.
Kajian selanjutnya dalam latihan fonik perlu memperbaiki cara laporan prosedur pengagihan peserta kepada kumpulan dan bagaimana pengkaji memastikan peserta tidak tahu bahawa mereka dalam kumpulan ‘eksperimen’ atau kumpulan ‘kawalan.‘ Kajian juga perlu melaporkan dengan jelas tentang bagaimana pengkaji memastikan mereka yang mengukur kemajuan membaca kanak‐kanak tidak tahu samada mereka dalam kumpulan latihan fonik atau tidak.
Authors' conclusions
Summary of findings
| Phonics training compared with control (no training or alternative training) for English‐speaking poor readers | ||||||
| Patient or population: English‐speaking poor readers Setting: English‐speaking countries Intervention: phonics Comparison: no training or alternative training | ||||||
| Outcomes | Illustrative comparative risks* (95% CI) | Relative effect | No of participants | Quality of the evidence | Comments * | |
| Assumed risk | Corresponding risk | |||||
| No training or alternative training | English‐speaking poor readers | |||||
| Word reading accuracy Immediate follow‐up | The mean score in the intervention groups was on average 0.47 SD better1 (95% CI 0.06 to 0.88) | 683 (10 studies) | High | |||
| Nonword reading accuracy Immediate follow‐up | The mean score in the intervention groups was on average 0.76 SD better1 (95% CI 0.25 to 1.27) | 512 (8 studies) | High | |||
| Word reading fluency Immediate follow‐up | The mean score in the intervention groups was on average 0.51 SD better1 (95% CI ‐1.14 to 0.13) | 54 (2 studies) | Moderate | |||
| Nonword reading fluency Immediate follow‐up | The mean score in the intervention groups was on average 0.38 SD worse1 (95% CI ‐0.55 to 1.32 ) | 18 (1 study) | Moderate | |||
| Reading comprehension Immediate follow‐up | The mean score in the intervention groups was on average 0.14 SD better1 (95% CI ‐0.46 to 0.74) | 173 (3 studies) | Moderate | |||
| Spelling Immediate follow‐up | The mean score in the intervention groups was on average 0.36 SD better1 (95% CI ‐0.27 to 1.00) | 140 (2 studies) | Moderate | |||
| CI: confidence interval | ||||||
| **GRADE Working Group grades of evidence | ||||||
| 1. Different studies used different continuous measures. Thus, comparative risk is reflected by size of the phonics training effect which was indexed with standardised mean differences (SMDs). The results are expressed as SD (standard deviation) units. As a rule of thumb, 0.2 SD represents a small difference, 0.5 a moderate difference, and 0.8 a large difference 2. Downgraded for imprecision. The confidence intervals are compatible with no effect at all as well as important improvement or deterioration | ||||||
Background
Description of the condition
Around 5% of English speakers have a significant problem with learning to read words. According to the 'self teaching hypothesis' (Share 1995) and models of word reading (Coltheart 2001; Harm 1999), reading a word depends on the ability to (1) identify each letter in the word (for example, S H I P), (2) translate each letter (I and P) or letter cluster (SH) into its correct phoneme ('sh' 'i' 'P'), and (3) blend these phonemes into a phonological output ('ship'). Reading words using these processes is sometimes called 'letter‐sound reading'.
Once a word has been read via letter‐sound reading, a memory of that whole written word ‐ that is, the combination and order of the letters in the word ‐ begins to form (for example, SHIP). This memory activates the meaning of that word (a boat), plus the memory of the phonological version of that word ('ship'), and the phonological output of that word ('ship'). Reading words using these processes is sometimes called 'sight word reading'.
Sight word reading is particularly important for reading English for two reasons. First, it is quicker than letter‐sound reading. Second, one‐third of written words in English contain letters that do not follow the letter‐sound rules (that is, they are 'irregular'). For example, ACH in YACHT sounds like 'o' and not 'a' 'ch'. Most irregular words can be partially read with letter‐sound reading since some of the letters are regular (for example, Y and T in YACHT follow the letter‐sound rules 'y' and 't'). However, to be read fully, irregular words must be recognised as a whole via sight word reading.
If a person has a problem with any of the processes involved in letter‐sound reading or sight word reading, then this will impair their ability to read words. For example, if a person has poor letter‐sound knowledge, then they should have difficulty reading new regular words (EXPELLIARMUS) or regular names (HEDWIG) or nonwords (that is, nonsense words that follow the letter‐sound rules, such as GREMP). Alternatively, if a reader has a poor store of memories for whole written words, then they should find it difficult with regular words (such as SHIP) and irregular words (such as YACHT). If a person has poor letter identification or phonological output then they should find it difficult to read regular words, irregular words, and nonwords because these processes are involved in both letter‐sound reading and sight word reading.
Description of the intervention
This review focuses on the most popular reading intervention for poor word readers: phonics. Phonics teaches people to learn to read via letter‐sound rules. However, not all programmes that claim to be phonics programmes focus on training letter‐sound rules alone. Most programmes train numerous skills in addition to phonics, such as letter identification, sight word reading, phonological output, and reading comprehension. The results of these 'complex' phonics programmes are difficult to interpret because reading gains could stem from phonics training, non‐phonics training, or an interaction between the two. Thus, the best way to test the efficacy of phonics training is to use 'pure' phonics programmes that focus training on learning to read via the letter‐sound rules alone.
How the intervention might work
Since phonics programmes train letter‐sound reading, then phonics training should improve performance on tests of the individual processes that are involved in letter‐sound reading (such as letter identification, letter‐sound knowledge, and phonological output) and tests that tax these processes simultaneously (such as nonword reading and regular word reading). Further, since improvements in letter‐sound reading should increase memories of whole written words, then phonics should also improve performance on tests of the individual processes involved in sight word reading (memories of written words, the meaning of words, and phonological memories of words) as well tests that tax all these processes simultaneously (regular and irregular word reading). These gains in word reading should in turn have knock‐on effects on more complex literacy skills that depend on word reading, such as reading comprehension and spelling.
The effect of phonics training on these reading skills may be influenced (or moderated) by a number of factors. One factor is the type of training. For reasons outlined above, this review considered the effects of pure phonics programmes. The most extreme version of a pure phonics programme focuses training exclusively on the letter‐sound rules. Such programmes are rare, and so this review also considered phonics programmes that trained letter‐sound rules plus one other ability. The most common abilities trained alongside phonics are phoneme awareness (that is, the ability to perceive, identify, discriminate, and manipulate speech sounds; see Hatcher 1994 for example) and the ability to read irregular words. Therefore, this review used subgroup analyses to compare the effects of phonics training only, phonics training plus phoneme awareness training, and phonics training plus irregular word reading training on literacy outcomes.
A second factor that may moderate the effect of phonics training is training intensity. Previous research with average readers has shown that phonics programmes that include a greater number of training sessions per week are more likely to have a greater effect than programmes with fewer sessions (Bus 1999). Although logic would dictate the same would be true for poor word readers, this has yet to be established. We tested this possibility with subgroup analyses that compared the effect on literacy outcomes of phonics programmes done up to two hours per week versus those done for two hours or more per week.
A third moderating factor on phonics training may be duration. We would predict that longer periods of phonics training would lead to greater reading gains than shorter programmes. We used subgroup analyses to compare the effects of phonics programmes shorter than three months to those that were least three months long on literacy outcomes.
A fourth factor that may moderate the effect of phonics is training group size. Previous research has shown that one‐on‐one phonics training is more effective than phonics training in a group for average readers (Ehri 2001). We would expect the same to be true for poor word readers. We tested this possibility using subgroup analyses that compared the effects of phonics in studies that did one‐on‐one training and studies that trained small groups of poor word readers on literacy outcomes.
A fifth moderating factor of phonics training may be the training administrator. One study has reported that a reading training programme administered by a teacher is more effective than a programme administered by a computer (Dawson 2000). However, another study has found that delivering a reading programme via a computer alone is just as effective as delivering the same programme via a teacher and a computer (Torgesen 2010). In this review, we used subgroup analyses to compare the effects of phonics training administered by a human versus a computer on literacy outcomes.
Why it is important to do this review
Well over 100 studies have tested the effect of phonics training in poor readers. Yet, there are surprisingly few systematic reviews or meta‐analyses on the effect of phonics training in people with poor reading. A very early review by Chall 1967 supported the use of phonics training for reading instruction, particularly for children from low socioeconomic backgrounds. However, this review did not assess the effect of specific effect of phonics in poor readers per se. The same is true for later meta‐analyses by Elbaum 2000, Therrien 2004, and Swanson 1999. In contrast, the National Reading Panel (Ehri 2001) and Suggate 2010 have used meta‐analyses to measure the effect of phonics programmes specifically in poor readers. The National Reading Panel's review was conducted 12 years ago and needs updating; and Suggate's review excluded unpublished studies and focused solely on children.
We are not aware of any study that has looked at the effect of phonics training on each of the processes involved in letter‐sound reading and sight word reading. It would be clinically and theoretically useful to look at the effects of phonics training on letter identification, letter‐sound rules, phonological output, written‐word memories, semantics, and phonological memories. It would also be informative to look at the efficacy of phonics training on reading skills that depend on these processes, such as word and nonword reading accuracy and fluency, reading comprehension, and spelling.
Finally, we currently have little knowledge about the impact of moderating factors on phonics training in poor word readers. For example, we do not know how intense or long training has to be; if it should be administered individually or in a small group; or if it is best conducted by a human or a computer. Again, this information will help teachers and therapists maximise the efficacy of their phonics training programmes.
Objectives
The primary aim of this review is to determine the effectiveness of phonics training for improving reading skills in English‐speaking poor word readers.
A secondary objective is to explore the impact of five potential moderating factors on phonics interventions in poor word readers: training type, training intensity, training duration, training group size, and training administrator.
Methods
Criteria for considering studies for this review
Types of studies
This review included studies that allocated participants using random allocation (that is, uses a random component in sequence generation), minimisation (that is, minimises differences between groups for one or more factors), or quasi‐randomisation (that is, uses systematic component for sequence generation, such as alternation, date of birth, case number). In terms of control data, this review included studies that had a control group that was either untrained or did alternative training (for example, maths training). It is noteworthy that an untrained control group in a reading training study is the same as a treatment‐as‐usual control group since most untrained participants continue to practice reading on a daily basis either at school (children) or work (adults).
Types of participants
In this review, we included studies that tested children, adolescents, and adults whose reading was at least one standard deviation (SD), one year, or one grade below the expected level, despite no reported problems that could explain their impaired ability to learn to read. Thus, children with attention deficit hyperactivity disorder (ADHD) or medical problems relating to cognition were not included in the review. This review did not exclude samples of poor word readers with a low intelligence quotient (IQ) since a discrepancy between IQ and reading is not predictive of prognosis or response to intervention (Fletcher 2005). Nor did we exclude participants based on age, gender, or socioeconomic status (SES), since poor reading is not associated with a particular age, gender, or SES. The review was restricted to English‐speaking poor word readers (as first or second language) because most other languages do not comprise the same large proportion of irregular words that cannot be read with the letter‐sound rules. This results in a different ratio of words that can and cannot be read using the letter‐sound rules (that is, regular versus irregular words) compared to other languages.
Types of interventions
We included studies that used a phonics programme that trained reading via the letter‐sound rules alone (phonics only) or with one other type of training (that is, a programme that combined phonics with phoneme awareness or irregular word reading). In addition, we included studies that tested a control group that was either (1) untrained, (2) did alternative training (for example, maths training), (3) or did the same training as the intervention group minus the phonics component (that is, phoneme awareness training or irregular word reading training). See Table 1 for additional phonics programmes that will be included in future updates if data are available.
| Issue | Method |
| Primary outcome measures | In the current review, we have combined measures for regular and irregular word reading (that is, word reading) to improve the power of the meta‐analyses of the reading measures. However, from a theoretical point of view, it would be preferable to have separate estimates for these 2 types of reading. If relevant data are available, future updates will index the effect of phonics on (1) irregular and regular word reading separately, and (2) irregular and regular spelling separately. |
| Secondary outcome measures | If relevant data are available, future updates will include letter identification, parsing, and blending as outcomes in this review. |
| Training type | In future updates, we will include additional phonics training if the data are available (for example, phonics and letter identification training, phonics, and spoken vocabulary training). |
| Subgroups | If relevant data are available, future updates will include 4 additional subgroups to the analyses that were not possible in the current review owing to lack of data: (1) Age (children (below 12 years); adolescents (13 to 17 years); adults (18 years and above); (2) poor reading type (poor letter‐sound reading; poor sight word reading; a combination of both); (3) spoken language ability (impaired unimpaired); and (4) timing of outcome assessment (immediately after training, 1 to 6 months after training, 7 to 18 months after training, more than 18 months). In addition, data allowing, we will reinstated a third categeory in the training type subgroup: phonics and sight words. |
| Timing of outcome assessment | If relevant data are available, future updates will index 4 periods of assessment: (1) immediately after training, (2) 1 to 6 months after training, (3) 7 to 18 months after training, and (4) more than 18 months after training. |
| Multiple measures | If a study includes multiple measures of a single outcome (for example, word reading accuracy), and those measures are directly comparable in type and scale, an average of the 2 scores will be taken. If a study includes multiple measures of a single outcome that are not directly comparable, both measures will be used in the analysis |
| Multiple arms | If a study includes 2 or more comparable invention groups (for example, both 'phonics only' or both 'phonics and phoneme awareness'), the data of the 2 groups will be combined. If a study includes a 'phonics only' and 'phonics plus phoneme awareness' group (for example), the phonics only group will be used since this is a purer measure of phonics training. If a study includes more than 1 control group, the control group that does the least training of any type will be included in the review. For example, a control group that does 'school as usual' will be used over a control groups who does 'maths training'. |
| Cross‐over and cluster trials | If a cluster‐randomised trial analyses the data as if individuals were randomised, we will adjust the calculations using 1 + (M‐1) ICC, where M is the average cluster size, and ICC is an estimate of the relative variability between and within clusters (Higgins 2008b). If a cross‐over trial does not appear to suffer carry‐over or period effects, then a paired t‐test will be used to measure the effect, or we will approximate a paired analysis by imputing standard deviations. If carry‐over effects are a problem, we will use data from the first period (Higgins 2008b). |
Types of outcome measures
We measured the effect of phonics training on six primary outcomes and two secondary outcomes (see Table 1 for outcome measures that will be included in future updates if data are available).
Primary outcomes
1. Word reading accuracy.
2. Nonword reading accuracy.
3. Word reading fluency.
4. Nonword reading fluency.
5. Reading comprehension.
6. Spelling.
Secondary outcomes
7. Letter‐sound knowledge.
8. Phonological output (as measured by phoneme awareness tasks such as nonword blending).
Timing of outcome assessment
In this review's protocol, we planned four points in time for outcome assessment:
-
immediately after training;
-
one to six months after training;
-
seven to 18 months after training;
-
more than 18 months after training.
All of the studies in this review reported data for outcomes immediately after training, and so all effects are based on immediate assessment. In future updates, we will index four periods of assessment if the data allows (see Table 1). We included the six primary outcomes in the summary of findings Table for the main comparison.
Search methods for identification of studies
We ran the initial searches for this review in May 2011. We used the Cochrane highly sensitive search strategy for identifying randomised trials in Ovid MEDLINE (Lefebvre 2008) and adapted this for other databases where appropriate. No date or language limits were applied. When the searches were re‐run in July 2012, they were restricted to the period following the first searches either by publication year or by the date on which they were added to the database. We also adapted the original search strategies for ERIC and PsycINFO because these had previously been searched on different platforms. Search strategies for each database are reported in Appendix 1.
Electronic searches
We searched the following databases and websites.
-
The Cochrane Central Register of Controlled Trials (CENTRAL), 2012 (Issue 6), part of The Cochrane Library, last searched 3 July 2012
-
Ovid MEDLINE (R), 1948 to June week 3 2012, last searched 3 July 2012
-
EMBASE (Ovid), 1980 to 2012 week 26, last searched 3 July 2012
-
Database of Reviews of Abstracts of Effects (DARE) part of The Cochrane Library, 2012 (Issue 2), last searched 3 July 2012
-
ERIC (Proquest), 1966 to current, last searched 4 July 2012
-
ERIC (Dialog Datastar), 1966 to current, searched 31 May 2011
-
PsycINFO (Ovid), 1806 to current, last searched 4 July 2012
-
PsycINFO (EBSCOhost)), 1887 to current, last searched 31 May 2011
-
CINAHL (EBSCOhost), 1938 to current, last searched 4 July 2012
-
Science Citation Index (Web of Science), 1970 to 29 June 2012, last searched 4 July 2012
-
Social Science Citation Index (Web of Science), 1970 to 29 June 2012, last searched 4 July 2012
-
Conference Proceedings Citation Index ‐ Science (CPCI‐S),1990 to 29 June 2012, last searched 4 July 2012
-
Conference Proceedings Citation Index ‐ Social Sciences & Humanities (CPCI‐SSH), 1990 to 29 June 2012, last searched 4 July 2012
-
Zetoc, last searched 4 July 2012
-
ClinicalTrials.gov, last searched 4 July 2012
-
International Clinical Trials Registry Platform (ICTRP), last searched 4 July 2012
-
metaRegister of Clinical Trials, last searched 4 July 2012
-
Index to Theses in the UK and Ireland (ProQuest), last searched 4 July 2012
-
ProQuest Dissertations and Theses, last searched July 2012
-
DART Europe E‐theses Portal, last searched July 2012
-
Australasian Digital Theses Program, last searched July 2012
-
Education Research Theses, last searched July 2012
-
Electronic Theses Online System, last searched July 2012
-
Networked Digital Library of Theses and Dissertations, last searched July 2012
-
Theses Canada portal, last searched July 2012
-
www.dissertation.com, last searched July 2012
-
www.thesisabstracts.com, last searched July 2012
Searching other resources
We examined the reference lists of published studies to identify further relevant studies. We contacted experts in the field and asked them to forward any published or unpublished studies that we may have missed.
Data collection and analysis
Selection of studies
Two review authors independently assessed each potentially relevant paper against the inclusion criteria. Any disagreement was discussed between the two review authors to determine if there was an oversight by one review author. If this did not resolve the issue, a third review author from the team (typically the first author) made the decision.
Data extraction and management
Two review authors extracted the data from each included study using a data extraction form. Data were collected on sample characteristics (including sample size); intervention characteristics (training type, training intensity, training duration, training group size, training administrator); and primary and secondary outcome measures (means, SDs, N values, and statistics). We settled disagreements between review authors via reference to the study papers and study authors. We dealt with any data missing from a study using the procedures outlined in the Dealing with missing data section. Once all data had been extracted into the forms, we entered it into the Data and analyses section. An independent author double checked the accuracy of the data entered.
Assessment of risk of bias in included studies
A 'Risk of bias' table for each study was constructed as outlined in the Cochrane Handbook for Systematic Reviews of Interventions (Higgins 2008; see Characteristics of included studies). This table was used by two review authors to describe and judge the risk of bias in each study independently. This was done by describing the method and then answering six questions (see below) to judge whether there was a low risk of bias, a high risk of bias, or an unclear risk of bias. If the two review authors provided different judgements for a domain, then they discussed their judgements. There was no unresolved disagreement between authors.
-
Random sequence generation. Description: the method used to generate the allocation sequence is described in enough detail to determine if it should produce comparable groups. Question: was the allocation sequence adequately generated?
-
Allocation sequence concealment. Description: the method used to conceal the allocation sequence is described in sufficient detail to determine if intervention allocations could have been foreseen before or during enrolment. Question: was allocation adequately concealed?
-
Blinding of participants and personnel. Description: the method used to blind participants and personnel from knowledge about which intervention a participant received, and any information relating to its effectiveness. Question: was knowledge of the allocated intervention adequately prevented?
-
Incomplete outcome data. Description: state the completeness of outcome data for each of the main outcomes, including attrition and exclusions from the analysis; state if attrition and exclusions were reported, the number in each group, reported reasons for attrition or exclusions, and re‐inclusions done by the review authors. Question: was incomplete outcome data adequately assessed?
-
Selective outcome reporting. Description: state how the study was examined for potential selective outcome reporting, and state what was found. Question: were reports of the study free of suggested selective outcome reporting?
-
Other sources of bias. Description: state any concerns about bias not previously addressed. Question: was the study free of other problems that could make it at high risk of bias?
Measures of treatment effect
Continuous data
The studies reported continuous data for behavioural and drop‐out measures. We calculated effect sizes using the mean difference (MD) (with 95% confidence intervals (CIs)) between the post‐training means and SDs of intervention and control groups. Each outcome was measured with different tests (see Table 2 for measures used in each study) and so we calculated standardised mean differences (SMDs). We considered SMDs of around 0.2, 0.5, and 0.8 to represent small, moderate, and large effects, respectively (Cohen 1988). We considered effects with P ≤ 0.05 to be statistically significant.
| Outcomes | Tests | References | Studies |
| Word reading accuracy | 1 experimental test |
| Barker 1995 |
| Woodcock Johnson Reading Mastery Test Third Edition: Word Identification | Woodcock 1987 | Barker 1995 | |
| Wechsler Individual Achievement Test 2nd Edition | Wechsler 2002 | Blythe 2006 | |
| Woodcock Johnson Reading Mastery Test Third Edition: Word Identification | Woodcock 2001 | Ford 2009 | |
| Woodcock Johnson Reading Mastery Test Revised: Word Identification | Woodcock 1987 | Hurford 1994 | |
| British Ability Scale: Word Reading | Elliot, Murray & Pearson, 1984 | Hurry 2007 | |
| 1 experimental test |
| Levy 1997 | |
| 1 experimental test |
| Levy 1999 | |
| 2 experimental tests |
| Lovett 2000 | |
| 2 experimental tests |
| Lovett 1990 | |
| 1 experimental test |
| Savage 2003 | |
| Nonword reading accuracy | Woodcock Johnson Reading Mastery Test: Word Analysis | Woodcock 1987 | Barker 1995 |
| Wechsler Individual Achievement Test 2nd Edition | Wechsler 2002 | Blythe 2006 | |
| Woodcock‐Johnson Tests of Achievement Third Edition: Word Attack | Woodcock 2001 | Ford 2009 | |
| Woodcock Johnson Reading Mastery Test Revised: Word Attack | Woodcock 1987 | Hurford 1994 | |
| 1 experimental test |
| Levy 1997 | |
| 1 experimental test |
| Levy 1999 | |
| Woodcock Johnson Reading Mastery Test Revised: Word Attack | Woodcock 1987 | Lovett 2000 | |
| 1 experimental test |
| Savage 2003 | |
| Word reading fluency | Test of Word Reading Efficiency: Phonemic Decoding Efficiency | Torgesen 1999 | Ford 2009 |
| 2 experimental tests |
| Lovett 1990 | |
| Nonword reading fluency | Test of Word Reading Efficiency: Sight Word Efficiency | Torgesen 1999 | Ford 2009 |
| Reading comprehension | Wechsler Individual Achievement Test 2nd Edition | Wechsler 2002 | Blythe 2006 |
| Gates‐MacGinitie Reading Test: Comprehension | MacGinitie 2002 | Ford 2009 | |
| Neale Analysis of Reading Ability | Neale 1988 | Hurry 2007 | |
| Spelling | 2 experimental tests |
| Lovett 1990 |
| 1 experimental test |
| Savage 2003 | |
| Letter‐sound knowledge | 1 experimental test |
| Lovett 1990 |
| 1 experimental test |
| Savage 2003 | |
| 1 experimental test |
| Savage 2005 | |
| Phonological output (measured with phoneme awareness tasks) | 1 experimental test |
| Barker 1995 |
| Goldman Fristoe Woodcock Test of Auditory Discrimination: Sound analysis | Goldman 1974 | Lovett 2000 | |
| 1 experimental test |
| Savage 2003 | |
| 1 experimental test |
| Savage 2005 |
Unit of analysis issues
As no cross‐over trials or cluster‐randomised designs were used by studies in this review, we were able to make direct calculations of effect size for all outcomes without imputation or adjustment (see Table 1 for how future updates will address cross‐over trials or cluster‐randomised studies).
For the four studies that included more than one intervention group that received phonics training, we combined the post‐training means, SDs, and N values of the groups (Hurford 1994; Levy 1997; Levy 1999; Savage 2003). See Characteristics of included studies for more details of these studies. See Table 1 for how future updates will combine group data if required.
Three studies (Barker 1995; Lovett 1990; Lovett 2000) tested word reading accuracy with two tests (regular word reading and irregular word reading). One study (Lovett 1990) tested word reading fluency with two tests (a regular word test and an an irregular word test) and tested spelling with two tests (regular word spelling and irregular word spelling). For each study that used two tests to measure a single outcome, we (1) used RevMan meta‐anlaysis to calculate the SMDs for each test separately, (2) calculated the mean SMDs for the two tests, (3) removed the data entries for the two tests, and (4) inserted a new entry that used the mean SMD for the experimental group, 0 for the control mean, 1 for the SDs of both groups, and the N of the study. In future updates of this review, we will estimate effect sizes for regular and irregular words separately, if we have enough data to allow us to do so (see Table 1).
Dealing with missing data
If a study had missing data (for example, means, SDs, amount of training, drop‐out rates), we requested that data from the corresponding author (see Characteristics of included studies for details of communications). If this request failed, we contacted the co‐authors for the missing data. If a study excluded data for participants who (1) failed to complete the training, or (2) failed to adhere to the treatment programme, we asked the study authors for information about these cases. If an appeal for missing data did not leave us with a full data set, we only included data for participants whose results were known. We addressed the potential impact of any missing data in each study's 'Risk of bias' table and the Risk of bias in included studies section.
Assessment of heterogeneity
A Chi2 test with a P value of 0.10 was used to examine the degree of consistency in the effect sizes found by the included studies (that is, heterogeneity). Further, the I2 statistic (with a cut‐off value of 70%) was used to estimate the percentage of variance in the effects owing to heterogeneity rather than chance. The I2 value was greater than 70% for two outcomes: word reading accuracy and nonword reading accuracy (see Table 3 for a summary of the heterogeneity statistics for each outcome). For word reading accuracy, we wondered if the atypical negative effect found by Barker 1995 (SMD ‐0.35) and an unusually large effect found by Levy 1999 (SMD 1.80) might be the cause. For nonword reading accuracy, we wondered if it was due to an atypical negative effect found by Barker 1995 (SMD ‐0.50. To determine if the outlying effects should be removed from each analysis we: (1) double‐checked the data, (2) reconsidered the validity and reliability of the measures, and (3) examined outlier studies to see if there was an obvious reason for the outlying result. These steps revealed no explanation for the outlying outcomes, and so we could not justify excluding these studies.
|
|
|
| Random‐effects model | Heterogeneity | Fixed‐effect model | ||||||
| Outcome measure | N studies | N Participants | SMD [95% CI] | Z | P | Chi2 | P | I2% | SMD [95% CI] | Z | P |
| Word reading accuracy | 10 | 683 | 0.47 [0.06, 0.88] | 2.22 | 0.03 | 52.26 | < 0.01 | 83 | 0.46 [0.29, 0.62] | 5.44 | < 0.01 |
| Nonword reading accuracy | 8 | 512 | 0.76 [0.25, 1.27] | 2.91 | < 0.01 | 44.04 | < 0.01 | 84 | 0.82 [0.62, 1.01] | 8.14 | < 0.01 |
| Word reading fluency | 2 | 54 | ‐0.51 [‐1.14, 0.13] | 1.56 | 0.12 | 1.30 | 0.25 | 23 | ‐0.53 [‐1.08, 0.02] | 1.89 | 0.06 |
| Nonword reading fluency | 1 | 18 | 0.38 [‐0.55, 1.32] | 0.81 | 0.42 | NA | NA | NA | 0.38 [‐0.55, 1.32] | 0.81 | 0.42 |
| Reading comprehension | 3 | 173 | 0.14 [‐0.46, 0.74] | 0.45 | 0.65 | 4.27 | 0.12 | 53 | 0.01 [‐0.31, 0.32] | 0.04 | 097 |
| Spelling | 2 | 140 | 0.36 [‐0.27, 1.00] | 1.12 | 0.26 | 2.53 | 0.11 | 60 | 0.28 [‐0.09, 0.65] | 1.49 | 0.14 |
| Letter‐sound knowledge | 3 | 192 | 0.35 [0.04, 0.65] | 2.22 | 0.03 | 0.11 | 0.95 | 0 | 0.35 [0.04, 0.65] | 2.22 | 0.03 |
| Phonological output | 4 | 280 | 0.38 [‐0.04, 0.80] | 1.77 | 0.08 | 7.97 | 0.05 | 62 | 0.44 [0.19, 0.70] | 3.45 | < 0.01 |
CI: confidence interval; SMD: standardised mean difference
Assessment of reporting biases
Due to the small number of studies in this review, we were only able to use a funnel plot to explore reporting bias for one outcome (word reading accuracy), which had data from 10 studies (see Figure 1). The shape of the funnel plot did not suggest a bias (1) against publishing small studies with non‐significant effects (in which case there would be a clear gap in the bottom left of the graph), or (2) towards publishing studies based on P values alone (in which case, the plot would have more studies at the left and right sides of the graph than in the middle; Sterne 2008). Thus, although this can be a difficult judgement with relatively few studies, publication bias did not appear to account for the heterogeneity for the word reading accuracy outcome at least.

Funnel plot of comparison: 1 Treatment versus control random‐effects model, outcome: 1.1 Word reading accuracy
Data synthesis
The primary aim of this review was to determine the effectiveness of phonics training for improving reading skills of English‐speaking poor word readers. To this end, we merged together studies that reported outcomes for each primary outcome and secondary outcome:
-
word reading accuracy;
-
nonword reading accuracy;
-
word reading fluency;
-
nonword reading fluency;
-
reading comprehension;
-
spelling;
-
letter‐sound knowledge;
-
phonological output.
As discussed above, we found heterogeneous effect sizes between studies for word reading accuracy and nonword reading acuracy. To test the impact of this heterogeneity, we calculated and compared (inverse variance) effect sizes using fixed‐effect meta‐analyses (which assumes the treatment effect is the same in each study) and random‐effects meta‐analyses (which assumes the treatment effect follows a distribution across studies; see Table 3). The results for all outcomes were similar, which suggested a degree of statistical reliability. In this review, we reported the effects from the random‐effects analysis because studies did not use the same phonics training programme (and so it is likely that the treatment effect differed between studies) and because random‐effects analyses adjusts estimates to incorporate heterogeneity (Deeks 2008). See Table 3 for a summary of the effect sizes for each outcome. See Table 1 for additional outcomes that we will use in future updates if data are available.
Subgroup analysis and investigation of heterogeneity
The secondary aim of this review was to explore potential moderators on the efficacy of phonics interventions. In the protocol for this review, we planned seven subgroup analyses:
-
training type (phonics alone, phonics and phoneme awareness, phonics and sight words);
-
training intensity (less than two hours per week, at least two hours per week);
-
training duration (less than three months, at least three months);
-
training group size (one‐on‐one, small group);
-
training administrator (human, computer);
-
poor‐reading profile (phonological, surface, mixed, unknown);
-
spoken language (impaired; unimpaired; unknown).
The studies included in this review did not provide data for two planned subgroups ('poor reading profile' and 'spoken language'). These subgroups will be reinstated in future updates (see Table 1).
Further, we were only able to conduct subgroup analyses in relation to two of the eight outcomes included in this review, namely word reading accuracy and nonword reading accuracy. For these outcomes we had data from 10 and eight studies, respectively. Unfortunately, lack of data meant that some analyses were not possible. First, for neither outcome were we able to perform the analysis "phonics and sight words subgroup” (subgroup 1: training type). Secondly, for nonword reading accuracy we were unable to perform the analysis "at least two hours per week" (subgroup 2: training intensity) or the analysis "at least three months" (subgroup 3: training duration).
We were unable to perform subgroup analyses for the remaining six outcomes, as data were available from fewer than five studies: word reading fluency, nonword reading fluency, reading comprehension, spelling, letter‐sound knowledge, and phonological output.
Sensitivity analysis
To determine if the meta‐analyses for each outcome were affected by risk of bias of included studies, we re‐did the meta‐analyses excluding the one study that had unclear random sequence generation (Hurford 1994). Hurford 1994 contributed data to just two outcomes: word reading accuracy and nonword reading accuracy. The SMDs for word reading accuracy with and without Hurford 1994 were 0.47 (95% CI 0.06 to 0.88; Z = 2.22; P = 0.03) and 0.47 (95% CI 0.01 to 0.93 Z = 2.00; P = 0.05), respectively. The SMDs for nonword reading accuracy with and without Hurford 1994 were 0.76 (95% CI 0.25 to 1.27 Z = 2.91; P < 0.01) and 0.38 (95% CI ‐0.55 to 1.32 Z = 2.71; P < 0.01), respectively. These similar outcomes suggest that the unclear random allocation for Hurford 1994 did not have undue influence on the overall outcomes.
Results
Description of studies
Results of the search
The first search was conducted on 31 May 2011. This search was updated in July 2012 (for references published from May 2011 to July 2012). The search identified 6632 records. Examination of the titles and abstracts by two review authors independently identified 142 potential studies. One was our own ongoing study (ACTRN12608000454370) and one was an unpublished PhD thesis we were unable to obtain (see Studies awaiting classification). Examination of the full‐text articles of the other articles by two review authors independently led to the rejection of 126 records. The remaining 14 records represented 11 studies. We therefore included 11 studies in the review. See Figure 2.
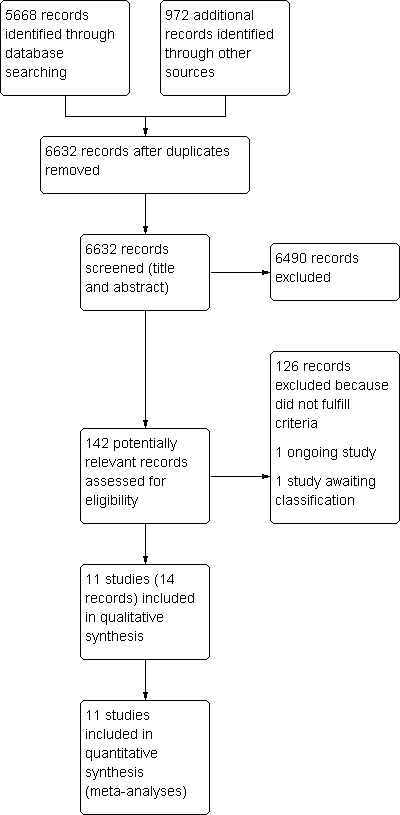
Study flow diagram
Included studies
Eleven studies, including 736 participants, met the criteria of this review (Lovett 1990; Hurford 1994; Barker 1995; Levy 1997; Levy 1999; Lovett 2000; Savage 2003; Savage 2005; Blythe 2006; Hurry 2007; Ford 2009). Subsamples from Lovett 2000 were also described in three other papers.
In terms of study design, all studies compared phonics training to a control group. In publications, all studies reported that they allocated participants using some form of randomisation, quasi‐randomisation, or minimisation. However, only one study explicitly described their random sequence procedure (Ford 2009); and all studies were missing information about allocation concealment and blinding. Thus, we contacted all study authors for further information regarding risk of bias factors (see 'Risk of bias' tables for each study for more information, and 'Risk of bias in included studies below'). Combined, the information from publications and personal communication indicated that the 11 studies were controlled trials that used randomisation or minimisation. We were slightly unsure about Hurford 1994 due to the discrepancy between the published report and personal contact with the author, so we included the study but undertook sensitivity analyses to see the impact of removing it.
In terms of intervention, four of the 11 studies included more than one 'phonics only' or 'phonics and phoneme awareness' groups, in which case we merged the data of the two groups (Hurford 1994; Levy 1997; Levy 1999; Savage 2003). Six of the 11 studies included additional non‐phonics training groups that were not included in the review (Lovett 1990; Barker 1995; Levy 1997; Levy 1999; Lovett 2000; Hurry 2007). See 'Characteristics of included studies' for more details.
In terms of comparison groups, all studies compared a phonics intervention group to a control group that either did no training (that is, treatment as usual; Hurford 1994; Levy 1997; Savage 2003; Savage 2005; Blythe 2006; Hurry 2007; Ford 2009) or did alternative training (Lovett 1990; Barker 1995; Levy 1999; Lovett 2000)
Location of studies
The studies were carried out in Canada (four studies), the UK (three studies), the US (three studies), and Australia (one study).
Participants
See Table 4 for details about the participants in the individual studies.
| Study | Location | Age | Gender | IQ | Ethnicity | SES | Inclusion criteria | Exclusion Criteria | Population |
| Barker 1995 | USA | Range 6.2 to 7.8 years | Not reported | Verbal Mean = 16.5 SD = 2.36 | Not reported | Not reported | Students nominated by teachers from 2 elementary schools who were given a short series of pre‐tests assessing phonological awareness skills and basic word recognition skills. These children were then given further 2 tests and those scoring below the 40th percentile and the 50th percentile on the subsequent test were selected | None stated | First‐grade students |
| Blythe 2006 | Australia | Mean 101.5 months | Male 75% Female 25% | FSIQ‐2 Mean 100.15 SD 9.38 | Not reported | Not reported | Children who received group‐based remedial reading instruction at school and were referred by a support teacher | After referral children completed the WISC‐III FSIQ. Those who scored below the 20th percentile were excluded | Dyslexic primary school students |
| Ford 2009 | USA | Mean 16.18 years | Male 55% Female 45% | Not reported | African‐American 22%, Hispanic 67%, white 11% | Lower | Students who were enrolled in the remedial reading programme were invited to participate. Below average reading skills were based on the ISAT | None stated | Teenagers enrolled at an alternative high school, that is, a high school for non‐special education students or students at risk of dropping out |
| Hurford 1994 | USA | Mean 80.35 months | Male 48% Female 52% | Mean 90.37 | White 92.8, African‐American 6%, Hispanic 5%, Asian‐American 0.7% | Middle | Classification data from Hurford, Darrow, Edwards, Howerton, Mote, Schauf and Coffey (1993) was used with more relaxed criteria for eligibility, that is standard scores in reading of less than 91 were included rather than less than 86 | None stated | Children at risk of reading disability |
| Hurry 2007 | UK | Range 6 to 6.6 years | Male 61% Female 39% | Range 92 to 96 | 16% spoke English as a second language | 42% of the sample were eligible for free school meals | In 63 schools the 6 poorest Year 2 readers were selected on the basis of their Diagnostic Survey (Clay, 1985) performance. Of the 22 schools using Reading Recovery, the poorest scorers were offered intervention | The remaining children, that is, those less poor at reading then those that were selected for the experimental condition, were assigned to a within school condition | Children with reading difficulties |
| Levy 1997 | Canada | Range 5.9 to 7.2 years | Male 48% Female 52% | Not reported | Not reported | Not reported | Children were given word reading tests, children that read fewer than 7 words on any of the screening tests were selected | None stated | All children from Grade 1 and senior kindergarten from 2 schools, whose parents consented to their participation |
| Levy 1999 | Canada | Mean age 7.7 years | Male 56% Female 44% | Non‐verbal (picture assembly) Experimental group mean 10.88 Control group mean 10.65 | Mixed racial distribution | Covers all SES | Children were given a word identification test (WRAT‐3), if they scored below 90 they were given another word identification test (WRMT) and if they read below half a grade below their grade level and read no more than 15 of the training words then they were included in the sample | None stated | 17 schools participated in the screening process with permission for participation obtained from the board, schools and a parent or guardian |
| Lovett 1990 | Canada | Mean age 8.4 years SD 1.6 Range 7 to 13 years | Male 70.4% Female 29.6% | Verbal Mean 98.4 SD 10.6 Performance Mean 106.2 SD 12.6 | Not reported | Middle | Children had to score below the 25th percentile on at least 4 of 5 reading measures used in the screening test and have at least low average intelligence | Children with English as a second language, history of extreme hyperactivity, hearing impairment, brain damage, a chronic medical condition, serious emotional disturbance, or attention deficits | Children referred to the Learning Disabilities Reading Program |
| Lovett 2000 | Canada | Mean age 9.9 years SD 1.6 Range 7 to 13 years | Male 68.1% Female 31.9% | Verbal Mean 92 SD 13.7 Range 58 to 133 Performance Mean 98.7 SD 14.3 Range = 63 ‐ 136 | Not reported | Not reported | Children needed to demonstrate a 'substantial underachievement' on 4 of the 5 reading based screening assessments | None stated | Children with severe reading disabilities that were referred to the Clinical Research Unit for remediation |
| Savage 2003 | UK | Mean age 5.9 years Range 5 to 6.3 years | Male 60% Female 40% | Not reported | Not reported | Not reported | Over 2 sessions a series of reading‐ and spelling‐based assessments were used to find the poorest readers in Year 1 of the school. The lowest performers were recruited | A teacher identifying a child as being too immature to deal with working in small groups | Children with the lowest reading performance for their age within a Local Education Authority or School District |
| Savage 2005 | UK | Not reported
| Male 50% Female 50% | Not reported | Not reported | Lower | Over 2 sessions a series of reading‐ and spelling‐based assessments were used to find the poorest readers in Year 1 of the school. The lowest performers were recruited | None stated | Children with the lowest reading performance for their age within a Local Education Authority or School District |
FSIQ: Full Scale intelligence quotient; IQ: intelligence quotient; ISAT: Illinois State Achievement Test; SD: standard deviation; SES: socioeconomic status; WISC: Wechsler Intelligence Scale for Children; WRAT: Wide Range Achievement Test; WRMT: Woodcock Reading Mastery Test
All studies reported participant details for participants who started the study rather than completed the study. However, it is noteworthy that all studies had very low or zero drop‐out rates.
Reading ability
The criteria used to identify poor readers differed between studies. Most used some kind of 'cut‐off' point on a reading measure (or measures), such as below the 40th, 20th, or 25th percentile (Barker 1995; Lovett 1990; Lovett 2000); a standard score less than 91 (Hurford 1994) or less than 90 (Levy 1999); or less than seven words read correctly in an experimental measure (Levy 1997). Some studies recruited the poorest readers from a large sample of screened children (Savage 2003; Savage 2005; Hurry 2007), while others recruited children if they were participating in remedial reading at school (Blythe 2006; Ford 2009; Note: data presented by these studies showed that the reading scores of these samples fell more than one SD below the level expected for their age and so the samples were known to meet the criteria for this review). Some studies also required participants to perform poorly on non‐reading tests such as phoneme awareness tasks (Barker 1995; Savage 2003; Savage 2005). The large differences in inclusion criteria mean that there was a great deal of heterogeneity in the characteristics of poor readers both within and between studies.
Common exclusion criteria
Three of the 11 studies reported criteria for exclusion from the study. The most common exclusion criteria were low IQ scores (Lovett 1990; Blythe 2006); English as a second language (Lovett 1990; Lovett 2000); and history of perceptual, psychological, or neurological problems (Lovett 1990). The remaining studies did not state exclusion criteria. Thus, differences between studies in exclusionary criteria added to the heterogeneity of samples both within and between studies.
IQ
Two of the 11 studies excluded low IQ scorers from their samples (Lovett 1990; Blythe 2006). Eight studies reported the verbal, non‐verbal IQ, or full IQ scores of their participants. The data suggest that most poor readers in these studies had IQ scores within or above the average range.
English speakers (first or second language)
Four of the 11 studies reported the ethnicity of their samples, which were either mixed (Levy 1999; Hurry 2007; Ford 2009), or predominantly white (Hurford 1994).
Age
Eight of the 11 studies tested children aged from five to eight years (Hurford 1994; Barker 1995; Levy 1997; Levy 1999; Savage 2003; Savage 2005; Blythe 2006; Hurry 2007). Two studies tested a slightly older and wider age group: seven to 13 years (Lovett 1990; Lovett 2000). One study tested adolescents (Ford 2009).
Gender
Seven of the 11 studies tested roughly equal numbers of girls and boys (Hurford 1994; Levy 1997; Levy 1999; Savage 2003; Savage 2005; Hurry 2007; Ford 2009). Three studies tested a larger proportion of males (around 70% to 75%) than females (around 25% to 30%; Lovett 1990; Lovett 2000; Blythe 2006). One study did not report the numbers of girls and boys in the study (Barker 1995).
Socioeconomic status (SES)
Three of the 11 studies reported the SES of their sample, which was lower SES (Savage 2005; Ford 2009) or middle SES (Lovett 1990).
Interventions
Studies in this review used training programmes that differed in training type (phonics only, phonics and phoneme awareness, phonics and irregular word training); in training intensity (less than two hours per week, at least two hours per week), in training duration (less than three months, at least three months), in training group size (one‐on‐one or small group), and in training administrator (human, computer). These five categories correspond to the five subgroup analyses we were able to carry out. The studies that fall into each of the subgroups are summarised in Table 5 and are discussed in turn below.
| Subgroups |
| Barker 1995 | Blythe 2006 | Ford 2009 | Hurford 1994 | Hurry 2007 | Levy 1997 | Levy 1999 | Lovett 1990 | Lovett 2000 | Savage 2003 | Savage 2005 |
| Training type | Phonics only | X | ‐ | ‐ | ‐ | ‐ | X | X | ‐ | ‐ | ‐ | ‐ |
|
| Phonics + phoneme awareness | ‐ | X | X | X | X | ‐ | ‐ | ‐ | X | X | X |
|
| Phonics + irregular words | ‐ | ‐ | ‐ | ‐ | ‐ | ‐ | ‐ | X | ‐ | ‐ | ‐ |
| Training intensity | < 2 hours/week | X | X | X | X | X | X | X | ‐ | ‐ | X | X |
|
| ≥ 2 hours/week | ‐ | ‐ | ‐ | ‐ | ‐ | ‐ | ‐ | X | X | ‐ | ‐ |
| Training duration | < 3 months | X | X | X | ‐ | ‐ | X | X | X | X | X | X |
|
| ≥ 3 months | ‐ | ‐ | ‐ | X | X | ‐ | ‐ | ‐ | ‐ | ‐ | ‐ |
| Training group size | 1 | ‐ | X | X | X | X | X | X | ‐ | ‐ | ‐ | ‐ |
|
| ≤ 5 | X | ‐ | ‐ | ‐ | ‐ | ‐ | ‐ | X | X | X | X |
| Training administrator | Human | ‐ | ‐ | ‐ | ‐ | X | X | X | X | X | X | X |
|
| Computer | X | X | X | X | ‐ | ‐ | ‐ | ‐ | ‐ | ‐ | ‐ |
Training type
Phonics only
Three of the 11 studies trained poor readers with a programme that focused on training children to read using letter‐sound rules (Barker 1995; Levy 1997; Levy 1999). Barker 1995 used the Hint and Hunt programme that taught children to read with the letter‐sound rules for short vowel sounds. Levy 1997 and Levy 1999 taught children to read using the letter‐sound rules for rime segments in words (that is, the vowel and consonant that fall after the initial onset a word, such as r (onset) ime (rime)).
Phonics and phoneme awareness
Seven of the 11 studies trained poor readers with a programme that focused training on phoneme awareness as well as training reading with letter‐sound rules (Hurford 1994; Lovett 2000; Savage 2003; Savage 2005; Blythe 2006; Hurry 2007; Ford 2009). Blythe 2006 trained phoneme awareness, letter‐sound rules, speech blending, and letter blending. Ford 2009 trained phonemic awareness and decoding multi‐syllabic words using letter‐sound rules. Hurford 1994 trained various phoneme awareness skills (discrimination, segmentation, blending) with letters. Hurry 2007 trained various phoneme awareness skills (alliteration, rhyme, boundary sounds, vowels, digraphs (that is, two or more letters that make a single sound, such as TH), as well as using plastic letters to build words using letter‐sound rules. Lovett 2000 trained various phoneme awareness skills (segmentation, blending, rhyming) and used a special orthography (highlighting salient features of some letters) to teach letter‐sound rules. Savage 2003 and Savage 2005 trained children to read using the letter‐sound rules for phonemes (for example, C S M) and rhymes (for example, AT (as in CAT SAT MAT), and trained phoneme awareness for phonemes and rhymes.
Training intensity
Less than two hours per week
Nine of the 11 studies trained poor readers for less than two hours per week. Most of these studies trained children between 60 and 90 minutes per week (Barker 1995; Levy 1997; Levy 1999; Savage 2003; Savage 2005; Blythe 2006). The remaining studies trained children for 15 to 45 minutes per week on average (Hurford 1994; Hurry 2007; Ford 2009).
At least two hours per week
Two of the 11 studies trained poor readers for four hours per week (Lovett 1990; Lovett 2000).
Training duration
Less than three months
Nine of the 11 studies conducted their training for less than three months (Lovett 1990; Barker 1995; Levy 1997; Levy 1999; Lovett 2000; Savage 2003; Savage 2005; Blythe 2006; Ford 2009).
At least three months
Only Hurford 1994 (five months) and Hurry 2007 (seven months) carried out training for over three months.
Training group size
One‐on‐one
Six of the 11 studies provided poor readers with one‐on‐one training by a reading professional (teachers, clinician, researcher) or computer (Hurford 1994; Levy 1997; Levy 1999; Blythe 2006; Hurry 2007; Ford 2009).
Small group
Five of the 11 studies trained poor readers in small groups comprising fewer than five trainees (Lovett 1990; Barker 1995; Lovett 2000; Savage 2003; Savage 2005).
Training administrator
Human
Seven of the 11 studies administered training primary via a human, that is, researcher, teacher, reading specialist (Lovett 1990; Levy 1997; Levy 1999; Lovett 2000; Savage 2003; Savage 2005; Hurry 2007).
Computer
Four of the 11 studies used computers as the primary training method (Hurford 1994; Barker 1995; Blythe 2006; Ford 2009).
Outcome measures
The tests used by each study to measure primary and secondary outcomes are outlined in Characteristics of included studies, summarised in Table 2, and discussed below.
Primary outcomes
Word reading accuracy
Ten of the 11 studies measured word reading accuracy. Six tests were experimental tasks designed specifically for the study that presented readers with regular or irregular words (Lovett 1990; Barker 1995; Levy 1997; Levy 1999; Lovett 2000; Savage 2003). Three tests were a version of the Word Identification from the Woodcock‐Johnson Reading Mastery Test (Barker 1995; Ford 2009; Hurford 1994). One test was the Wechsler Individual Achievement Test (Blythe 2006). One test was the Word Reading test from the British Ability Scale (Hurry 2007).
Nonword reading accuracy
Eight of the 11 studies tested nonword reading accuracy. Four studies used a nonword reading test from a version of the Woodcock‐Johnson Reading Mastery Test (Hurford 1994; Barker 1995; Lovett 2000; Ford 2009), three studies used experimental nonword reading tests that were developed for the study (Levy 1997; Levy 1999; Savage 2003), and one study used a nonword reading test from the Wechsler Individual Achievement Test 2nd Edition (Blythe 2006).
Word reading fluency
Two of the 11 studies measured word reading fluency. One study used the Sight Word test from the Test of Word Reading Efficiency (Ford 2009). A second study used two experimental tests of regular and irregular words that were designed specifically for the study (Lovett 1990). For the meta‐anlaysis in this review, we averaged the effect sizes of these two outcomes for the same reasons, and using the same procedures, as outlined above under Word reading accuracy above.
Nonword reading fluency
One study tested nonword reading fluency used the Phonemic Decoding test from the Test of Word Reading Efficiency (Ford 2009).
Reading comprehension
Three of the 11 studies tested reading comprehension. One study used the Neale Analysis of Reading Ability (Hurry 2007), one used the Wechsler Individual Achievement Test 2nd Edition (Blythe 2006), and one used the Gates‐MacGinitie Reading Test (Ford 2009).
Spelling
Two of the 11 studies tested regular or irregular word spelling (Lovett 1990; Savage 2003). Lovett 1990 tested spelling with separate regular and irregular spelling tests. For the meta‐anlaysis in this review, we averaged the effect sizes of these two outcomes for the same reasons, and using the same procedures, as outlined above under Word reading accuracy above.
Secondary outcomes
Letter‐sound knowledge
It is noteworthy that only three of the 11 studies tested letter‐sound knowledge. This was unexpected since letter‐sound knowledge is the focus of phonics training. The three studies tested letter‐sound knowledge using experimental tasks designed specifically for the study (Lovett 1990; Savage 2003; Savage 2005).
Phonological output
Four of the 11 studies tested phonological output. Three tests were experimental tasks designed specifically for the study (Barker 1995; Savage 2003; Savage 2005). And one test was the Goldman Fristoe Woodcock Sound Analysis test (Lovett 2000).
Excluded studies
See Characteristics of excluded studies table. We listed studies that reading researchers might expect to be included in this review but were excluded because they failed to meet our review criteria. These were studies that trained the ability to read via the letter‐sound rules (that is, phonics training) alongside two or more other skills such as text reading, phoneme awareness, and reading comprehension (for example, Lovett 2011; Vellutino 1986; Vellutino 1987; Lovett 1988; Lovett 1989; Lovett 1990; Hatcher 1994; Wise 1995; Vellutino 1996; Foorman 1997; Gillon 1997; Foorman Francis 1998; Wise 1997; Olson 1997; Wise 1999; Torgesen 1999; Wise 2000; Rashotte 2001; Torgesen 2001; Torgesen 2006; Hatcher 2006); studies that did not include a control group that was untrained or did non‐phonics alternative training (Alexander 1991; Wise 1995; Wise 2000; Torgesen 2001; Hatcher 2006); studies that did not use randomisation, quasi‐randomisation, or minimisation (Gillon 2000; Gillon 2002).
Risk of bias in included studies
Details about risk of bias for each study are shown in 'Risk of bias' tables for each study (see 'Characteristics of included studies') and are summarised in Figure 3. Information in publications initially indicated that risk of bias was unclear for almost all studies for random sequence generation, allocation concealment, and blinding of participants, personnel, and outcome assessment. Thus, we requested information from all study authors. This information suggested low risk of bias for random sequence allocation for all studies except for Hurford 1994. There was unclear risk of bias for most studies for allocation concealment and blinding of outcome assessment. There was unclear or high risk of bias for most studies for blinding of personnel and participants. However, there was low risk of bias for almost all studies for incompleted outcomes data and selective reporting.
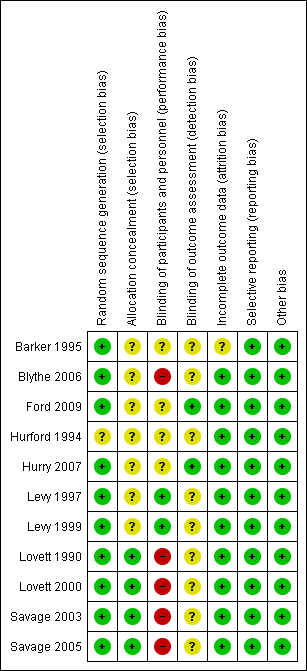
Risk of bias summary: review authors' judgements about each risk of bias item for each included study
Allocation
Random sequence generation
Regarding sequence generation, information provided in publications and from personal communication clearly indicated that all bar one study allocated participants to groups using randomisation. The exception was Hurford 1994 for which there was inconsistent information between the publication and personal communication. We therefore rated the risk of bias of this study as high.
Allocation concealment
Regarding allocation concealment, four studies used a procedure that clearly minimised minimised this risk of bias (Lovett 1990; Lovett 2000; Savage 2003; Savage 2005). It could not be ascertained from information provided by the remaining studies if allocation concealment was adequate or not (Barker 1995; Blythe 2006; Ford 2009; Hurford 1994; Hurry 2007; Levy 1997; Levy 1999).
Blinding
Participants and personnel
In terms of performance bias, it is difficult to ensure blinding of personel in cognitive treatment trials where a human administers the training because it is practically impossible to blind personnel to the treatment that they are administering. However, blinding of partipants is easier since participants in reading treatment studies (typically children) seldom have the expertise to discern which treatment or control group they have been allocated to. Thus, degree of performance bias in the current review was primarily driven by how a study tackled the blinding of personel. Four studies provided no information on this issue, and so were deemed unclear (Barker 1995; Ford 2009; Hurford 1994; Hurry 2007). Five studies stated that they did not blind personnel to the experimental and treatment groups, and so were deemed high risk (Blythe 2006; Lovett 1990; Lovett 2000; Savage 2003; Savage 2005). Two studies stated that they blinded personnel to expectations about the efficacy of the training that they were administering to minimise bias (Levy 1997; Levy 1999). These were deemed a low risk of bias.
Outcome assessment
In terms of blinding outcome assessment, two studies employed blind assessment of treatment outcomes (Hurry 2007; Ford 2009); seven studies used methods that made it unclear if outcome assessment was blind or not (Lovett 1990; Levy 1997; Levy 1999; Lovett 2000; Savage 2003; Savage 2005; Blythe 2006), and two studies did not report information about blinding of assessment bias, which again made the risk of this bias unclear (Barker 1995; Hurford 1994).
Incomplete outcome data
Four of the 11 studies indicated that there was no attrition across the study (Levy 1997; Levy 1999; Lovett 2000; Blythe 2006). Four other studies reported a minor attrition across the study (one to four data points; Lovett 1990; Savage 2003; Savage 2005; Ford 2009). Two studies reported moderate losses that appeared to be random in nature (Hurford 1994 ‐ 13.3%; Hurry 2007 ‐ N = 23). And one study did not provide any information about incomplete outcome data (Barker 1995). Thus, all bar one study had a low risk of bias for incomplete outcome data.
Selective reporting
There were no missing literacy tests in any studies, and so there was no evidence for selective reporting in any study.
Other potential sources of bias
None known.
Effects of interventions
The primary aim of this review was to determine the effectiveness of phonics training for improving reading skills of English‐speaking poor word readers. To this end, we calculated the effects of phonics training on six primary and two secondary outcomes. A summary of the statistics can be found in Data and analyses, Table 3, and summary of findings Table for the main comparison.
A secondary objective was to explore the impact of various moderating factors on the efficacy of phonics interventions in poor word readers. Thus, for outcomes that had data from more than five studies (word reading accuracy and nonword reading accuracy) we carried out five subgroup analyses for training type (phonics alone, phonics versus phonics plus phoneme awareness versus phonics plus irregular word training), training intensity (less than two hours per week versus at least two hours per week), training duration (less than three months versus at least three months), training group size (one‐on‐one versus small groups), and training administrator (human versus computer). See Table 6 and Data and analyses for a summary of the results for these subgroup analyses.
|
| Subgroups |
|
| Mean effect size | Heterogeneity | Subgroup analyses | ||||||||
| N studies/ measures | N participants | SMD [95% CI] | Z | P | Chi2 | P | I2 % | Chi2 | DF | P | I2 % | |||
| Word reading accuracy | Training type | Phonics only | 3 | 232 | 0.91 [‐0.17, 1.98] | 1.63 | 0.10 | 23.93 | < 0.10 | 92 |
|
|
|
|
|
| Phonics + phoneme awareness | 6 | 415 | 0.28 [0.00, 0.56] | 1.96 | 0.05 | 8.12 | 0.15 | 38 | 1.23 | 1 | 0.27 | 18.8 | |
| Training intensity | < 2 hours/week | 8 | 559 | 0.48 [‐0.04, 1.00] | 1.80 | 0.07 | 50.65 | < 0.10 | 86 |
|
|
|
| |
|
| ≥ 2 hours/week | 2 | 124 | 0.34 [‐0.03, 0.72] | 1.79 | 0.07 | 1.06 | 0.30 | 6 | 0.17 | 1 | 0.68 | 0 | |
| Training duration | < 3 months | 8 | 498 | 0.56 [0.07, 1.04] | 2.25 | 0.02 | 39.20 | < 0.10 | 82 |
|
|
|
| |
|
| ≥ 3 months | 2 | 185 | 0.12 [‐0.43, 0.67] | 0.42 | 0.67 | 2.8 | 0.09 | 64 | 1.36 | 1 | 0.24 | 26.3 | |
| Training group size | 1 | 6 | 419 | 0.62 [‐0.06, 1.29] | 1.78 | 0.07 | 44.35 | < 0.10 | 89 |
|
|
|
| |
|
| ≤ 5 | 4 | 264 | 0.25 [‐0.04, 0.54] | 1.67 | 0.10 | 8.78 | 0.29 | 12 | 0.94 | 1 | 0.33 | 0 | |
| Training administrator | Human | 6 | 559 | 0.66 [0.08, 1.23] | 2.24 | 0.03 | 46.02 | < 0.10 | 89 |
|
|
|
| |
|
| Computer | 4 | 124 | 0.15 [‐0.20, 0.51] | 0.85 | 0.40 | 2.63 | 0.45 | 0 | 2.13 | 1 | 0.14 | 53 | |
| Nonword reading accuracy | Training type | Phonics only | 3 | 232 | 0.91 [‐0.45, 2.28] | 1.32 | 0.19 | 36.92 | < 0.10 | 95 |
|
|
|
|
|
| Phonics + phoneme awareness | 5 | 280 | 0.63 [0.38, 0.88] | 4.86 | < 0.10 | 1.84 | 0.88 | 0 | 0.16 | 1 | 0.69 | 0 | |
| Training group size | 1 | 5 | 284 | 1.06 [0.39, 1.73] | 3.09 | < 0.10 | 21.92 | < 0.10 | 82 |
|
|
|
| |
|
| ≤ 5 | 3 | 228 | 0.32 [‐0.32, 0.96] | 0.97 | 0.33 | 9.64 | < 0.10 | 79 | 2.43 | 1 | 0.12 | 58.8 | |
| Training administrator | Human | 4 | 388 | 1.12 [0.48, 1.76] | 3.42 | < 0.10 | 22.23 | < 0.10 | 87 |
|
|
|
| |
|
| Computer | 4 | 124 | 0.31 [‐0.33, 0.96] | 0.96 | 0.34 | 8.65 | 0.03 | 65 | 3.02 | 1 | 0.08 | 66.8 | |
The heterogeneity for two of the outcomes exceeded 70% which we addressed using the approach outlined in the Assessment of heterogeneity section above (word reading accuracy: Chi2 = 52.26; DF = 9; P < 0.01; I2 = 79%; nonword reading accuracy: Chi2 = 44.04; DF = 7; P < 0.01; I2 = 84%). This approach did not alter the effect calculations for the eight outcomes, which are outlined in turn below.
Primary outcomes
Word reading accuracy
Ten of the 11 studies tested the effect of phonics on word reading accuracy (see Figure 4) (Barker 1995; Blythe 2006; Ford 2009; Hurford 1994; Hurry 2007; Levy 1997; Levy 1999; Lovett 1990; Lovett 2000; Savage 2003; ). Three studies (Barker 1995; Lovett 1990; Lovett 2000) used two separate regular and irregular word reading tests. We dealt with repeated measures of the same outcome using the procedure outlined above under Unit of analysis issues.
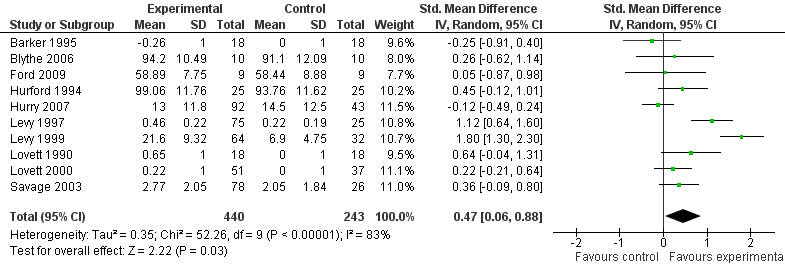
Forest plot of comparison: 1 Treatment versus control random‐effects model, outcome: 1.1 Word reading accuracy
The SMD was 0.47, which was statistically significant (95% CI 0.06 to 0.88; Z = 2.22; P =0.03) (Analysis 1.1). This suggests a moderate effect of phonics training on word reading accuracy in poor word readers.
The subgroup analysis (Analysis 2.1 and Table 6) revealed no statistically significant difference between training type (Chi2 = 1.23; DF = 1; P = 0.27; I2 = 18.8%), training intensity (Chi2= 0.17; DF = 1; P = 0.67; I2 = 0%), training duration (Chi2 = 1.36; DF = 1; P = 0.24; I2 = 26.3%), training group size (Chi2 = 0.94; DF = 1; P = 0.33; I2 = 0%), or training administrator (Chi2 = 2.13; DF = 1; P = 0.14; I2 = 53%).
Nonword reading accuracy
Eight of the 11 studies used eight measures to test the effect of phonics on nonword reading accuracy (see Figure 5) (Hurford 1994; Barker 1995; Levy 1997; Levy 1999; Lovett 2000; Savage 2003; Blythe 2006; Ford 2009). The SMD was 0.76, which was statistically significant (95% CI 0.25 to 1.27; Z = 2.91; P < 0.01) (Analysis 1.2). This suggests a large effect of phonics training on nonword reading accuracy in poor readers.

Forest plot of comparison: 1 Treatment versus control random‐effects model, outcome: 1.2 Nonword reading accuracy
The subgroup analysis (Analysis 2.2 and Table 6) revealed no statistically significant difference between training type (Chi2 = 0.16; DF = 1; P = 0.69; I2 = 0%), training group size (Chi2 = 2.43; DF = 1; P = 0.12; I2 = 58.8%), or training administrator (Chi2 = 3.02; DF = 1; P = 0.08; I2 = 66.8%).
Word reading fluency
Two of the 11 studies tested the effect of phonics on word reading fluency (see Figure 6) (Lovett 1990; Ford 2009). We dealt with repeated measures of the same outcome in Lovett 1990 using the procedure outlined above under Unit of analysis issues. Since improvements in fluency are reflected by a reduction in scores (that is, less time taken to read a set number of words or text) then improvement is reflected by negative SMDs rather than positive SMDs. The SMD was ‐0.51, which was not statistically significant, probably due to lack of data (95% CI ‐1.14 to ‐0.13; Z = 1.26; P < 0.01) (Analysis 1.3). This suggests a moderate effect of phonics on word reading fluency in poor readers.

Forest plot of comparison: 1 Treatment versus control random‐effects model, outcome: 1.3 Word reading fluency
Nonword reading fluency
One of the 11 studies tested the effect of phonics on nonword reading fluency (see Figure 7) (Ford 2009). The SMD was 0.38 (a negative effect since an increase in score represents an increase in reading time), which was not statistically significant (95% CI ‐0.55 to 1.32; Z = 0.81; P = 0.42) (Analysis 1.4). This suggests a small‐to‐moderate negative effect of phonics on nonword reading fluency in poor readers.

Forest plot of comparison: 1 Treatment versus control random‐effects model, outcome: 1.4 Nonword reading fluency
Reading comprehension
Three of the 11 studies tested the effect of phonics on reading comprehension (see Figure 8) (Blythe 2006; Hurry 2007; Ford 2009). The SMD was 0.14, which was not statistically significant (95% CI ‐0.46 to 0.74; Z = 0.45; P = 0.65) (Analysis 1.5). This suggests a small effect of phonics on reading comprehension in poor readers.
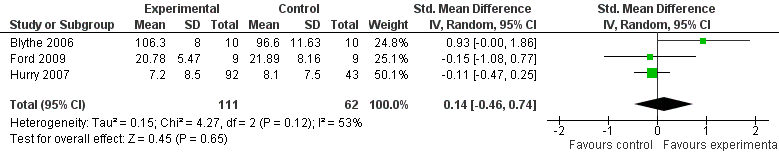
Forest plot of comparison: 1 Treatment versus control random‐effects model, outcome: 1.5 Reading comprehension
Spelling
Two of the 11 studies tested the effect of phonics on spelling words (see Figure 9) (Lovett 1990; Savage 2005). We dealt with repeated measures of the same outcome in Lovett 1990 using the procedure outlined above under Unit of analysis issues. The SMD was 0.36, which was not statistically significant (95% CI ‐0.27 to 1.00; Z = 1.12; P = 0.26) (Analysis 1.6). This suggests a small‐to‐moderate effect of phonics on spelling words in poor readers.
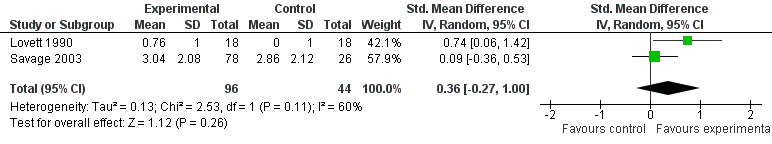
Forest plot of comparison: 1 Treatment versus control random‐effects model, outcome: 1.6 Spelling
Secondary outcomes
Letter‐sound knowledge
Three of the 11 studies tested the effect of phonics on letter‐sound knowledge (see Figure 10) (Lovett 1990; Savage 2003; Savage 2005). The SMD was 0.35, which was statistically significant (95% CI 0.04 to 0.65; Z = 2.22; P = 0.03) (Analysis 1.7). This suggests a small‐to‐moderate effect of phonics on letter‐sound knowledge in poor readers.

Forest plot of comparison: 1 Treatment versus control random‐effects model, outcome: 1.7 Letter‐sound knowledge
Phonological output
Four of the 11 studies tested the effect of phonics on phonological output (see Figure 11) (Barker 1995; Lovett 2000; Savage 2003; Savage 2005). The SMD was 0.38, which was not statistically significant (95% CI ‐0.04 to 0.80; Z = 1.77; P = 0.08) (Analysis 1.8). This suggests a small‐to‐moderate effect of phonics training on phonological output in poor readers.

Forest plot of comparison: 1 Treatment versus control random‐effects model, outcome: 1.8 Phonological output
Discussion
Summary of main results
Out of 6632 records, we found 11 studies that met the criteria for this review. A meta‐analysis of the data revealed that the effect of phonics training was large for nonword reading accuracy (SMD 0.76), moderate for word reading fluency (SMD ‐0.51) and word reading accuracy (SMD 0.47), small‐to‐moderate for spelling (SMD 0.36), letter‐sound knowledge (SMD 0.35) and phonological output (SMD 0.38), small for reading comprehension (SMD 0.14), and slightly negative for nonword reading fluency (SMD 0.38). The effect sizes were only statistically significant for nonword reading accuracy, word reading accuracy, and letter‐sound knowledge. A subgroup analysis revealed that the efficacy of phonics training was not significantly affected by training type, training intesnity, training duration, training group size, or training administrator.
Overall completeness and applicability of evidence
The outcomes of the 11 studies in this review appear applicable to English‐speaking poor word readers in the general population for at least seven reasons. First, the 11 studies were published in 1990 to 2009, and so are applicable to poor word readers in modern times. Second, the proportion of studies done in each location was representative of the proportion of populations of English‐speaking countries. Specifically, most studies were done in Canada (four studies), the US (three studies), and the UK (three studies), with fewer done in Australia (one study). Third, one of the debates in reading research is how poor reading (that is, 'dyslexia') should be defined. The studies in this review used a variety of inclusion and exclusion criteria to recruit poor readers, which resulted in heterogeneous samples both within and between studies. This is representative of samples in reading and dyslexia research studies. Fourth, research has established that poor reading is not restricted to a particular culture or SES. The studies in this review recruited samples with a variety of ethnicity and SES, which is representative of English‐speaking poor word readers in the general population.
A fifth reason why the current studies appear applicable is because they included similar numbers of males and females. There is a popular perception that more males than females are poor readers. This view has arisen from recruitment bias: people are more likely to notice poor reading in boys than girls, possibly because boys are more likely to misbehave when they are frustrated or bored. Studies minimising recruitment bias have found roughly equal proportions of male and female poor readers (Shaywitz 2001). Thus, by recruiting similar numbers of males and females, the studies included in this review represent the proportion of males and females with poor reading in the general population.
A sixth reason why the current studies are applicable to poor word readers in the general population is because of their IQ. Most poor readers in the studies in this review had IQ scores within or above the average range. This reflects the type of poor reader who gains the most attention in society (that is, those with poor reading despite average intelligence). As mentioned in the Background section, there is growing evidence that IQ is not predictive of poor reading or response to intervention. Thus, the outcomes of this review are application to poor word readers with low IQ.
And seventh, it is noteworthy that all bar one study tested children, and so the results of this review are more directly applicable to children than adults. While it is unlikely that adults with poor reading will respond differently to phonics training than children with poor reading, this issue requires much more investigation. It is also noteworthy that only three studies measured letter‐sound knowledge. This is somewhat surprising given that phonics training focuses on letter‐sound knowledge. Future studies should include letter‐sound knowledge measures to ensure a more complete understanding of the effects of phonics on poor word readers.
Quality of the evidence
There are at least four factors that have the potential to affect the quality of evidence in this review. First, there is risk of bias. As illustrated by the 'Risk of bias' tables, nine of the 11 studies had a "low‐risk" judgement for most of the seven biases assessed in this review (see Figure 2). The two remaining studies had an "unclear" judgement for most of the seven areas of potential bias considered in this review. According to GRADE criteria, quality of evidence should be judged as 'high' if "most information is from studies at low risk of bias". Quality of evidence should be downgraded to 'moderate' if "most information is from studies at low/unclear risk of bias" and if "potential limitations are likely to lower confidence in the estimate of effect" (Schunemann 2008; page 364). According to these criteria, the quality of evidence for all the outcomes measured in this review was moderate or high.
Second, there is the amount of data used to calculate effects for each outcome. While the effects for word reading accuracy and nonword reading accuracy were calculated from eight to 10 studies, the effect for phonological output was based on four studies, and the effects for word reading fluency, nonword reading fluency, reading comprehension, spelling, and letter‐sound knowledge were based on data from only one to three studies.
Third, there is a possible violation of statistical independence at the student level in some studies. Specifically, five of the 11 studies in this review (Barker 1995; Lovett 1990; Lovett 2000; Savage 2003; Savage 2005) carried out treatment in small groups, rather than on an individual basis. Poor readers receiving treatment in the same group (for example, with the same instructor) may respond more similarly to each other than to poor readers in other groups. This will produce standard errors that are spuriously small and hence increase the likelihood of a Type 1 error. It is possible to adjust for this problem using intraclass correlations, if it is possible to make a reasonable estimate of the extent to which statistical independence has been violated (Hedges 2007). In future updates, when more studies are available, we will attempt to make such an estimate, and hence adjust for any potential violations of statistical independence.
Fourth, there is the chance that some training studies expose participants in a treatment group ‐ but not a control group ‐ to content that is included in the outcomes. While it is possible that some phonics training programmes may expose children to words, or parts of words, that may be included in the post‐tests, phonics training programmes typically use a wide range of constantly changing stimuli to teach children the letter‐sound "rules", rather than repeatedly using the same content (that is, specific words or nonwords). Since phonics training typically focuses on repeatedly training rules, rather than specific content, the effect of content exposure during training should be minimal in typical phonics training studies.
In sum, risk of bias, amount of data, statistical independence, and content exposure have a minimal impact on the quality of evidence in this review ‐ particularly for outcomes based on data from a larger number of studies, that is, word reading accuracy, nonword reading accuracy, and perhaps phonological output. Future studies may result in changes to the strength of evidence in relation to these outcomes for which there are currently limited data, such as word and nonword reading fluency, reading comprehension, spelling, and letter‐sound knowledge.
Potential biases in the review process
The various anayses conducted in this review suggest that potential biases in this review are minimal for six reasons. First, almost all studies had low risk of bias for random sequence generation, incomplete outcome data, and selective reporting. The majority also had low or unclear risk of bias for allocation concealment, blinding of outcome assessment, and blinding of personnel and participants. Second, excessive heterogeneity only applied to two outcomes, and an analysis of this heterogeneity reveal no systematic explanation for the variance. Third, a funnel plot of one outcome suggested no evidence of publication bias, bias introduced by using P values, or bias owing to outliers. Fourth, a comparison of effects using fixed‐ and random‐effects analyses revealed very similar outcomes, suggesting a degree of statistical reliability. Fifth, a sensitivity analysis that only included studies with low risk of bias produced very similar results to the primary analysis. And sixth, the quality of evidence was moderate or high for all outcomes.
Agreements and disagreements with other studies or reviews
There are two previous meta‐analyses that are highly relevant to this review. The National Reading Panel (Ehri 2001) found small‐to‐moderate effects of phonics on the reading skills of poor readers. In line with this, the current review found small‐to‐moderate effects on spelling, letter‐sound knowledge, and phonological output. However, in addition, the current review found moderate effects of phonics training on word reading accuracy and word reading fluency, and a large effect on nonword reading accuracy.
A likely explanation for the slightly discordant results between the two studies is the different criteria used for study inclusion. In the current study, we were interested in the specific effect of phonics training. Ideally, we would have only included studies that used 'pure' phonics training programmes (that is, programmes that only taught reading via the letter‐sound rules). However, prior to doing this review, we suspected pure phonics training studies might be rare. Thus, our criteria for phonics training included programmes that trained phonics alone, or trained phonics plus one other reading‐related skill (irregular word, phonological output). The National Reading Panel (Ehri 2001) did not use such strict criteria, and so included many more studies that used programmes that trained at least two other reading skills in addition to phonics. As discussed above, the outcomes of such complex phonics programmes are difficult to interpret because reading gains could stem from phonics training, non‐phonics training, or an interaction between the two. The fact that the current review found moderate and larger effect on for some outcomes suggests that the inclusion of non‐phonics training in complex phonics programmes may weaken training effects on some reading‐related outcomes ‐ perhaps because less time is dedicated to phonics training per se.
The second previous meta‐analysis was conducted by Suggate 2010, who found a moderate effect size of phonics training on reading skills, pre‐reading skills, and comprehension skills in children who were struggling readers. Fortunately, Suggate's criteria for phonics training were quite similar to the current study, and Suggate's criteria for struggling readers were similar to our criteria for poor word readers. This may explain why our moderate effects reflect those of Suggate, and why Suggate identified a similar number of relevant phonics training studies (13) in struggling readers in Grade 1 to 7. However, unlike the current review, Suggate 2010 focused on children and did not include unpublished studies. Thus, the slightly different outcomes of the two studies could be explained by different study sets.
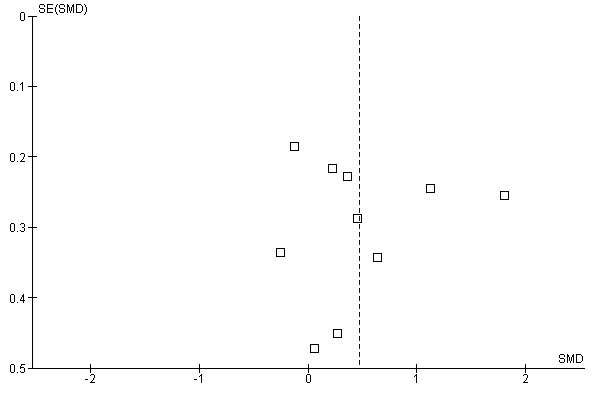
Funnel plot of comparison: 1 Treatment versus control random‐effects model, outcome: 1.1 Word reading accuracy

Study flow diagram

Risk of bias summary: review authors' judgements about each risk of bias item for each included study

Forest plot of comparison: 1 Treatment versus control random‐effects model, outcome: 1.1 Word reading accuracy
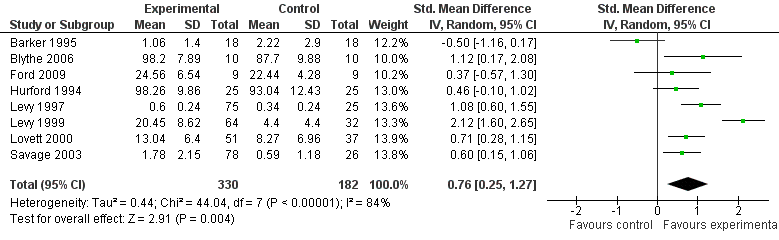
Forest plot of comparison: 1 Treatment versus control random‐effects model, outcome: 1.2 Nonword reading accuracy
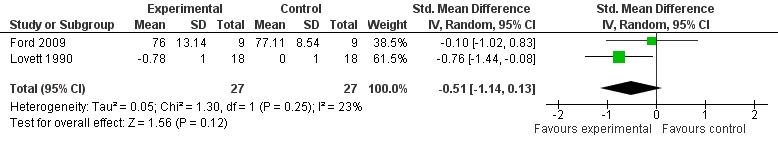
Forest plot of comparison: 1 Treatment versus control random‐effects model, outcome: 1.3 Word reading fluency

Forest plot of comparison: 1 Treatment versus control random‐effects model, outcome: 1.4 Nonword reading fluency

Forest plot of comparison: 1 Treatment versus control random‐effects model, outcome: 1.5 Reading comprehension

Forest plot of comparison: 1 Treatment versus control random‐effects model, outcome: 1.6 Spelling

Forest plot of comparison: 1 Treatment versus control random‐effects model, outcome: 1.7 Letter‐sound knowledge
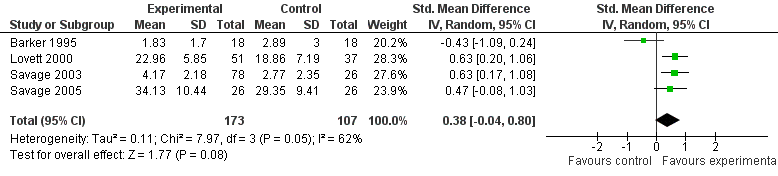
Forest plot of comparison: 1 Treatment versus control random‐effects model, outcome: 1.8 Phonological output

Comparison 1 Phonics training versus control (random‐effects), Outcome 1 Word reading accuracy.
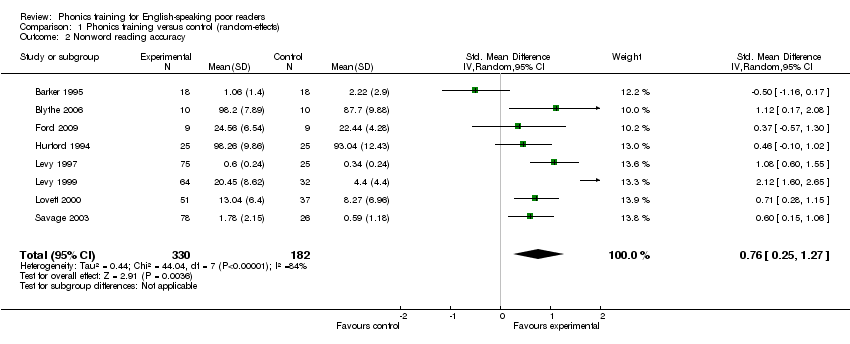
Comparison 1 Phonics training versus control (random‐effects), Outcome 2 Nonword reading accuracy.
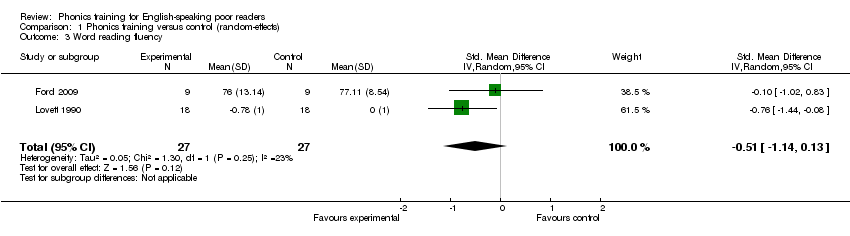
Comparison 1 Phonics training versus control (random‐effects), Outcome 3 Word reading fluency.
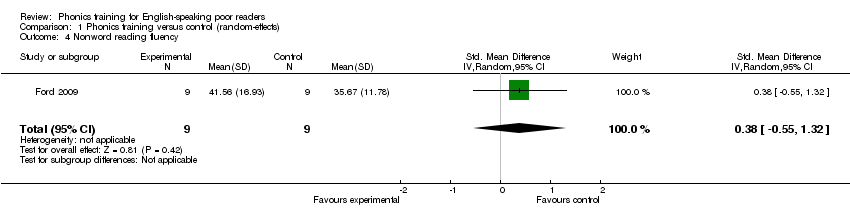
Comparison 1 Phonics training versus control (random‐effects), Outcome 4 Nonword reading fluency.
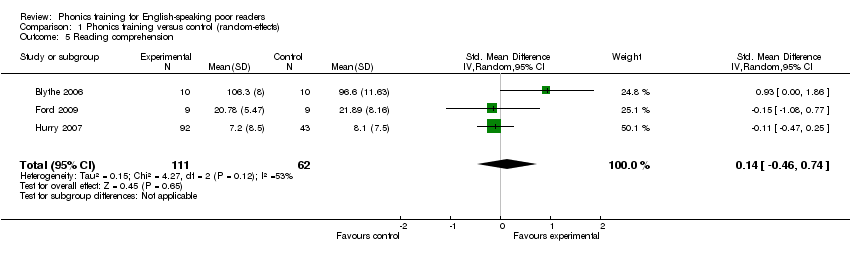
Comparison 1 Phonics training versus control (random‐effects), Outcome 5 Reading comprehension.
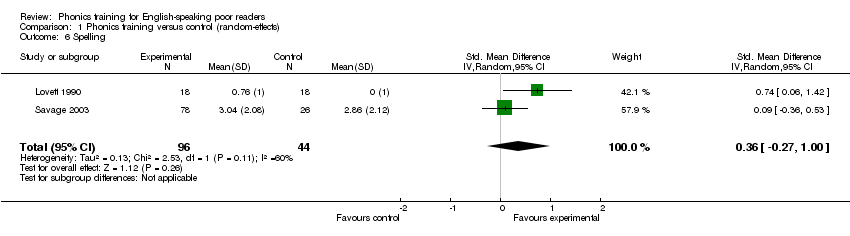
Comparison 1 Phonics training versus control (random‐effects), Outcome 6 Spelling.

Comparison 1 Phonics training versus control (random‐effects), Outcome 7 Letter‐sound knowledge.
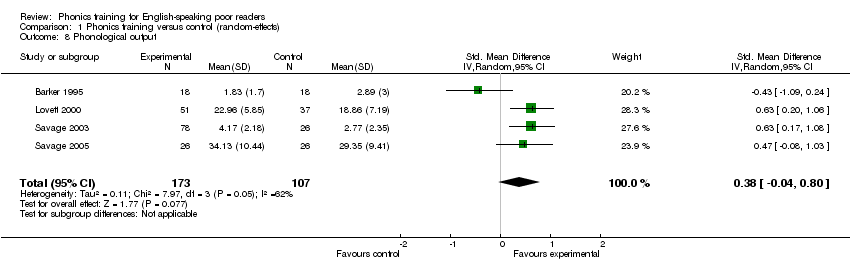
Comparison 1 Phonics training versus control (random‐effects), Outcome 8 Phonological output.

Comparison 2 Phonics training versus control ‐ subgroups (random‐effects), Outcome 1 Word reading accuracy.

Comparison 2 Phonics training versus control ‐ subgroups (random‐effects), Outcome 2 Nonword reading accuracy.

Comparison 3 Phonics training versus control (fixed‐effect), Outcome 1 Word reading accuracy.
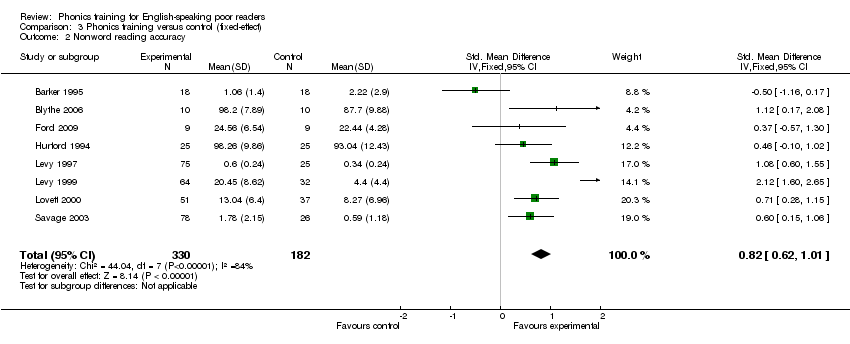
Comparison 3 Phonics training versus control (fixed‐effect), Outcome 2 Nonword reading accuracy.

Comparison 3 Phonics training versus control (fixed‐effect), Outcome 3 Word reading fluency.

Comparison 3 Phonics training versus control (fixed‐effect), Outcome 4 Nonword reading fluency.

Comparison 3 Phonics training versus control (fixed‐effect), Outcome 5 Reading comprehension.
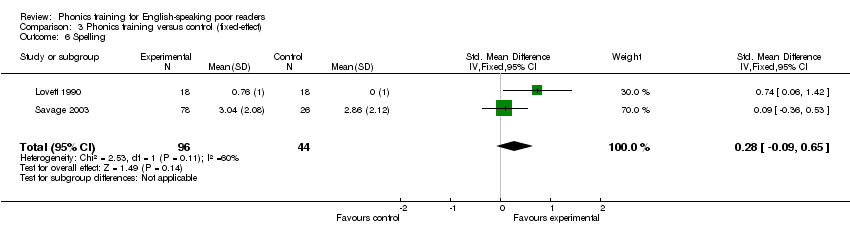
Comparison 3 Phonics training versus control (fixed‐effect), Outcome 6 Spelling.

Comparison 3 Phonics training versus control (fixed‐effect), Outcome 7 Letter‐sound knowledge.

Comparison 3 Phonics training versus control (fixed‐effect), Outcome 8 Phonological output.
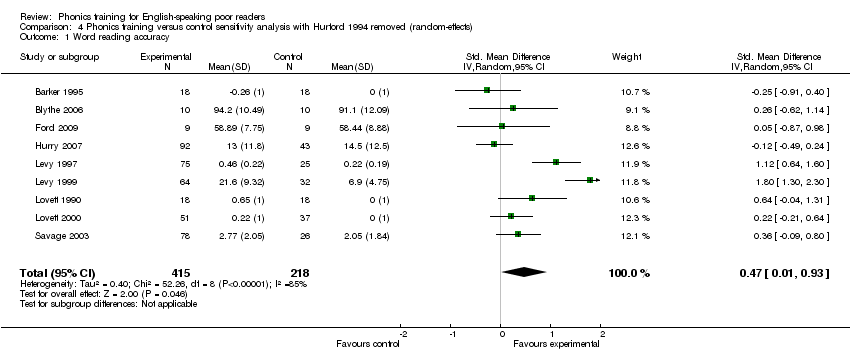
Comparison 4 Phonics training versus control sensitivity analysis with Hurford 1994 removed (random‐effects), Outcome 1 Word reading accuracy.

Comparison 4 Phonics training versus control sensitivity analysis with Hurford 1994 removed (random‐effects), Outcome 2 Nonword reading accuracy.
| Phonics training compared with control (no training or alternative training) for English‐speaking poor readers | ||||||
| Patient or population: English‐speaking poor readers Setting: English‐speaking countries Intervention: phonics Comparison: no training or alternative training | ||||||
| Outcomes | Illustrative comparative risks* (95% CI) | Relative effect | No of participants | Quality of the evidence | Comments * | |
| Assumed risk | Corresponding risk | |||||
| No training or alternative training | English‐speaking poor readers | |||||
| Word reading accuracy Immediate follow‐up | The mean score in the intervention groups was on average 0.47 SD better1 (95% CI 0.06 to 0.88) | 683 (10 studies) | High | |||
| Nonword reading accuracy Immediate follow‐up | The mean score in the intervention groups was on average 0.76 SD better1 (95% CI 0.25 to 1.27) | 512 (8 studies) | High | |||
| Word reading fluency Immediate follow‐up | The mean score in the intervention groups was on average 0.51 SD better1 (95% CI ‐1.14 to 0.13) | 54 (2 studies) | Moderate | |||
| Nonword reading fluency Immediate follow‐up | The mean score in the intervention groups was on average 0.38 SD worse1 (95% CI ‐0.55 to 1.32 ) | 18 (1 study) | Moderate | |||
| Reading comprehension Immediate follow‐up | The mean score in the intervention groups was on average 0.14 SD better1 (95% CI ‐0.46 to 0.74) | 173 (3 studies) | Moderate | |||
| Spelling Immediate follow‐up | The mean score in the intervention groups was on average 0.36 SD better1 (95% CI ‐0.27 to 1.00) | 140 (2 studies) | Moderate | |||
| CI: confidence interval | ||||||
| **GRADE Working Group grades of evidence | ||||||
| 1. Different studies used different continuous measures. Thus, comparative risk is reflected by size of the phonics training effect which was indexed with standardised mean differences (SMDs). The results are expressed as SD (standard deviation) units. As a rule of thumb, 0.2 SD represents a small difference, 0.5 a moderate difference, and 0.8 a large difference 2. Downgraded for imprecision. The confidence intervals are compatible with no effect at all as well as important improvement or deterioration | ||||||
| Issue | Method |
| Primary outcome measures | In the current review, we have combined measures for regular and irregular word reading (that is, word reading) to improve the power of the meta‐analyses of the reading measures. However, from a theoretical point of view, it would be preferable to have separate estimates for these 2 types of reading. If relevant data are available, future updates will index the effect of phonics on (1) irregular and regular word reading separately, and (2) irregular and regular spelling separately. |
| Secondary outcome measures | If relevant data are available, future updates will include letter identification, parsing, and blending as outcomes in this review. |
| Training type | In future updates, we will include additional phonics training if the data are available (for example, phonics and letter identification training, phonics, and spoken vocabulary training). |
| Subgroups | If relevant data are available, future updates will include 4 additional subgroups to the analyses that were not possible in the current review owing to lack of data: (1) Age (children (below 12 years); adolescents (13 to 17 years); adults (18 years and above); (2) poor reading type (poor letter‐sound reading; poor sight word reading; a combination of both); (3) spoken language ability (impaired unimpaired); and (4) timing of outcome assessment (immediately after training, 1 to 6 months after training, 7 to 18 months after training, more than 18 months). In addition, data allowing, we will reinstated a third categeory in the training type subgroup: phonics and sight words. |
| Timing of outcome assessment | If relevant data are available, future updates will index 4 periods of assessment: (1) immediately after training, (2) 1 to 6 months after training, (3) 7 to 18 months after training, and (4) more than 18 months after training. |
| Multiple measures | If a study includes multiple measures of a single outcome (for example, word reading accuracy), and those measures are directly comparable in type and scale, an average of the 2 scores will be taken. If a study includes multiple measures of a single outcome that are not directly comparable, both measures will be used in the analysis |
| Multiple arms | If a study includes 2 or more comparable invention groups (for example, both 'phonics only' or both 'phonics and phoneme awareness'), the data of the 2 groups will be combined. If a study includes a 'phonics only' and 'phonics plus phoneme awareness' group (for example), the phonics only group will be used since this is a purer measure of phonics training. If a study includes more than 1 control group, the control group that does the least training of any type will be included in the review. For example, a control group that does 'school as usual' will be used over a control groups who does 'maths training'. |
| Cross‐over and cluster trials | If a cluster‐randomised trial analyses the data as if individuals were randomised, we will adjust the calculations using 1 + (M‐1) ICC, where M is the average cluster size, and ICC is an estimate of the relative variability between and within clusters (Higgins 2008b). If a cross‐over trial does not appear to suffer carry‐over or period effects, then a paired t‐test will be used to measure the effect, or we will approximate a paired analysis by imputing standard deviations. If carry‐over effects are a problem, we will use data from the first period (Higgins 2008b). |
| Outcomes | Tests | References | Studies |
| Word reading accuracy | 1 experimental test |
| Barker 1995 |
| Woodcock Johnson Reading Mastery Test Third Edition: Word Identification | Woodcock 1987 | Barker 1995 | |
| Wechsler Individual Achievement Test 2nd Edition | Wechsler 2002 | Blythe 2006 | |
| Woodcock Johnson Reading Mastery Test Third Edition: Word Identification | Woodcock 2001 | Ford 2009 | |
| Woodcock Johnson Reading Mastery Test Revised: Word Identification | Woodcock 1987 | Hurford 1994 | |
| British Ability Scale: Word Reading | Elliot, Murray & Pearson, 1984 | Hurry 2007 | |
| 1 experimental test |
| Levy 1997 | |
| 1 experimental test |
| Levy 1999 | |
| 2 experimental tests |
| Lovett 2000 | |
| 2 experimental tests |
| Lovett 1990 | |
| 1 experimental test |
| Savage 2003 | |
| Nonword reading accuracy | Woodcock Johnson Reading Mastery Test: Word Analysis | Woodcock 1987 | Barker 1995 |
| Wechsler Individual Achievement Test 2nd Edition | Wechsler 2002 | Blythe 2006 | |
| Woodcock‐Johnson Tests of Achievement Third Edition: Word Attack | Woodcock 2001 | Ford 2009 | |
| Woodcock Johnson Reading Mastery Test Revised: Word Attack | Woodcock 1987 | Hurford 1994 | |
| 1 experimental test |
| Levy 1997 | |
| 1 experimental test |
| Levy 1999 | |
| Woodcock Johnson Reading Mastery Test Revised: Word Attack | Woodcock 1987 | Lovett 2000 | |
| 1 experimental test |
| Savage 2003 | |
| Word reading fluency | Test of Word Reading Efficiency: Phonemic Decoding Efficiency | Torgesen 1999 | Ford 2009 |
| 2 experimental tests |
| Lovett 1990 | |
| Nonword reading fluency | Test of Word Reading Efficiency: Sight Word Efficiency | Torgesen 1999 | Ford 2009 |
| Reading comprehension | Wechsler Individual Achievement Test 2nd Edition | Wechsler 2002 | Blythe 2006 |
| Gates‐MacGinitie Reading Test: Comprehension | MacGinitie 2002 | Ford 2009 | |
| Neale Analysis of Reading Ability | Neale 1988 | Hurry 2007 | |
| Spelling | 2 experimental tests |
| Lovett 1990 |
| 1 experimental test |
| Savage 2003 | |
| Letter‐sound knowledge | 1 experimental test |
| Lovett 1990 |
| 1 experimental test |
| Savage 2003 | |
| 1 experimental test |
| Savage 2005 | |
| Phonological output (measured with phoneme awareness tasks) | 1 experimental test |
| Barker 1995 |
| Goldman Fristoe Woodcock Test of Auditory Discrimination: Sound analysis | Goldman 1974 | Lovett 2000 | |
| 1 experimental test |
| Savage 2003 | |
| 1 experimental test |
| Savage 2005 |
|
|
|
| Random‐effects model | Heterogeneity | Fixed‐effect model | ||||||
| Outcome measure | N studies | N Participants | SMD [95% CI] | Z | P | Chi2 | P | I2% | SMD [95% CI] | Z | P |
| Word reading accuracy | 10 | 683 | 0.47 [0.06, 0.88] | 2.22 | 0.03 | 52.26 | < 0.01 | 83 | 0.46 [0.29, 0.62] | 5.44 | < 0.01 |
| Nonword reading accuracy | 8 | 512 | 0.76 [0.25, 1.27] | 2.91 | < 0.01 | 44.04 | < 0.01 | 84 | 0.82 [0.62, 1.01] | 8.14 | < 0.01 |
| Word reading fluency | 2 | 54 | ‐0.51 [‐1.14, 0.13] | 1.56 | 0.12 | 1.30 | 0.25 | 23 | ‐0.53 [‐1.08, 0.02] | 1.89 | 0.06 |
| Nonword reading fluency | 1 | 18 | 0.38 [‐0.55, 1.32] | 0.81 | 0.42 | NA | NA | NA | 0.38 [‐0.55, 1.32] | 0.81 | 0.42 |
| Reading comprehension | 3 | 173 | 0.14 [‐0.46, 0.74] | 0.45 | 0.65 | 4.27 | 0.12 | 53 | 0.01 [‐0.31, 0.32] | 0.04 | 097 |
| Spelling | 2 | 140 | 0.36 [‐0.27, 1.00] | 1.12 | 0.26 | 2.53 | 0.11 | 60 | 0.28 [‐0.09, 0.65] | 1.49 | 0.14 |
| Letter‐sound knowledge | 3 | 192 | 0.35 [0.04, 0.65] | 2.22 | 0.03 | 0.11 | 0.95 | 0 | 0.35 [0.04, 0.65] | 2.22 | 0.03 |
| Phonological output | 4 | 280 | 0.38 [‐0.04, 0.80] | 1.77 | 0.08 | 7.97 | 0.05 | 62 | 0.44 [0.19, 0.70] | 3.45 | < 0.01 |
| CI: confidence interval; SMD: standardised mean difference | |||||||||||
| Study | Location | Age | Gender | IQ | Ethnicity | SES | Inclusion criteria | Exclusion Criteria | Population |
| Barker 1995 | USA | Range 6.2 to 7.8 years | Not reported | Verbal Mean = 16.5 SD = 2.36 | Not reported | Not reported | Students nominated by teachers from 2 elementary schools who were given a short series of pre‐tests assessing phonological awareness skills and basic word recognition skills. These children were then given further 2 tests and those scoring below the 40th percentile and the 50th percentile on the subsequent test were selected | None stated | First‐grade students |
| Blythe 2006 | Australia | Mean 101.5 months | Male 75% Female 25% | FSIQ‐2 Mean 100.15 SD 9.38 | Not reported | Not reported | Children who received group‐based remedial reading instruction at school and were referred by a support teacher | After referral children completed the WISC‐III FSIQ. Those who scored below the 20th percentile were excluded | Dyslexic primary school students |
| Ford 2009 | USA | Mean 16.18 years | Male 55% Female 45% | Not reported | African‐American 22%, Hispanic 67%, white 11% | Lower | Students who were enrolled in the remedial reading programme were invited to participate. Below average reading skills were based on the ISAT | None stated | Teenagers enrolled at an alternative high school, that is, a high school for non‐special education students or students at risk of dropping out |
| Hurford 1994 | USA | Mean 80.35 months | Male 48% Female 52% | Mean 90.37 | White 92.8, African‐American 6%, Hispanic 5%, Asian‐American 0.7% | Middle | Classification data from Hurford, Darrow, Edwards, Howerton, Mote, Schauf and Coffey (1993) was used with more relaxed criteria for eligibility, that is standard scores in reading of less than 91 were included rather than less than 86 | None stated | Children at risk of reading disability |
| Hurry 2007 | UK | Range 6 to 6.6 years | Male 61% Female 39% | Range 92 to 96 | 16% spoke English as a second language | 42% of the sample were eligible for free school meals | In 63 schools the 6 poorest Year 2 readers were selected on the basis of their Diagnostic Survey (Clay, 1985) performance. Of the 22 schools using Reading Recovery, the poorest scorers were offered intervention | The remaining children, that is, those less poor at reading then those that were selected for the experimental condition, were assigned to a within school condition | Children with reading difficulties |
| Levy 1997 | Canada | Range 5.9 to 7.2 years | Male 48% Female 52% | Not reported | Not reported | Not reported | Children were given word reading tests, children that read fewer than 7 words on any of the screening tests were selected | None stated | All children from Grade 1 and senior kindergarten from 2 schools, whose parents consented to their participation |
| Levy 1999 | Canada | Mean age 7.7 years | Male 56% Female 44% | Non‐verbal (picture assembly) Experimental group mean 10.88 Control group mean 10.65 | Mixed racial distribution | Covers all SES | Children were given a word identification test (WRAT‐3), if they scored below 90 they were given another word identification test (WRMT) and if they read below half a grade below their grade level and read no more than 15 of the training words then they were included in the sample | None stated | 17 schools participated in the screening process with permission for participation obtained from the board, schools and a parent or guardian |
| Lovett 1990 | Canada | Mean age 8.4 years SD 1.6 Range 7 to 13 years | Male 70.4% Female 29.6% | Verbal Mean 98.4 SD 10.6 Performance Mean 106.2 SD 12.6 | Not reported | Middle | Children had to score below the 25th percentile on at least 4 of 5 reading measures used in the screening test and have at least low average intelligence | Children with English as a second language, history of extreme hyperactivity, hearing impairment, brain damage, a chronic medical condition, serious emotional disturbance, or attention deficits | Children referred to the Learning Disabilities Reading Program |
| Lovett 2000 | Canada | Mean age 9.9 years SD 1.6 Range 7 to 13 years | Male 68.1% Female 31.9% | Verbal Mean 92 SD 13.7 Range 58 to 133 Performance Mean 98.7 SD 14.3 Range = 63 ‐ 136 | Not reported | Not reported | Children needed to demonstrate a 'substantial underachievement' on 4 of the 5 reading based screening assessments | None stated | Children with severe reading disabilities that were referred to the Clinical Research Unit for remediation |
| Savage 2003 | UK | Mean age 5.9 years Range 5 to 6.3 years | Male 60% Female 40% | Not reported | Not reported | Not reported | Over 2 sessions a series of reading‐ and spelling‐based assessments were used to find the poorest readers in Year 1 of the school. The lowest performers were recruited | A teacher identifying a child as being too immature to deal with working in small groups | Children with the lowest reading performance for their age within a Local Education Authority or School District |
| Savage 2005 | UK | Not reported
| Male 50% Female 50% | Not reported | Not reported | Lower | Over 2 sessions a series of reading‐ and spelling‐based assessments were used to find the poorest readers in Year 1 of the school. The lowest performers were recruited | None stated | Children with the lowest reading performance for their age within a Local Education Authority or School District |
| FSIQ: Full Scale intelligence quotient; IQ: intelligence quotient; ISAT: Illinois State Achievement Test; SD: standard deviation; SES: socioeconomic status; WISC: Wechsler Intelligence Scale for Children; WRAT: Wide Range Achievement Test; WRMT: Woodcock Reading Mastery Test | |||||||||
| Subgroups |
| Barker 1995 | Blythe 2006 | Ford 2009 | Hurford 1994 | Hurry 2007 | Levy 1997 | Levy 1999 | Lovett 1990 | Lovett 2000 | Savage 2003 | Savage 2005 |
| Training type | Phonics only | X | ‐ | ‐ | ‐ | ‐ | X | X | ‐ | ‐ | ‐ | ‐ |
|
| Phonics + phoneme awareness | ‐ | X | X | X | X | ‐ | ‐ | ‐ | X | X | X |
|
| Phonics + irregular words | ‐ | ‐ | ‐ | ‐ | ‐ | ‐ | ‐ | X | ‐ | ‐ | ‐ |
| Training intensity | < 2 hours/week | X | X | X | X | X | X | X | ‐ | ‐ | X | X |
|
| ≥ 2 hours/week | ‐ | ‐ | ‐ | ‐ | ‐ | ‐ | ‐ | X | X | ‐ | ‐ |
| Training duration | < 3 months | X | X | X | ‐ | ‐ | X | X | X | X | X | X |
|
| ≥ 3 months | ‐ | ‐ | ‐ | X | X | ‐ | ‐ | ‐ | ‐ | ‐ | ‐ |
| Training group size | 1 | ‐ | X | X | X | X | X | X | ‐ | ‐ | ‐ | ‐ |
|
| ≤ 5 | X | ‐ | ‐ | ‐ | ‐ | ‐ | ‐ | X | X | X | X |
| Training administrator | Human | ‐ | ‐ | ‐ | ‐ | X | X | X | X | X | X | X |
|
| Computer | X | X | X | X | ‐ | ‐ | ‐ | ‐ | ‐ | ‐ | ‐ |
|
| Subgroups |
|
| Mean effect size | Heterogeneity | Subgroup analyses | ||||||||
| N studies/ measures | N participants | SMD [95% CI] | Z | P | Chi2 | P | I2 % | Chi2 | DF | P | I2 % | |||
| Word reading accuracy | Training type | Phonics only | 3 | 232 | 0.91 [‐0.17, 1.98] | 1.63 | 0.10 | 23.93 | < 0.10 | 92 |
|
|
|
|
|
| Phonics + phoneme awareness | 6 | 415 | 0.28 [0.00, 0.56] | 1.96 | 0.05 | 8.12 | 0.15 | 38 | 1.23 | 1 | 0.27 | 18.8 | |
| Training intensity | < 2 hours/week | 8 | 559 | 0.48 [‐0.04, 1.00] | 1.80 | 0.07 | 50.65 | < 0.10 | 86 |
|
|
|
| |
|
| ≥ 2 hours/week | 2 | 124 | 0.34 [‐0.03, 0.72] | 1.79 | 0.07 | 1.06 | 0.30 | 6 | 0.17 | 1 | 0.68 | 0 | |
| Training duration | < 3 months | 8 | 498 | 0.56 [0.07, 1.04] | 2.25 | 0.02 | 39.20 | < 0.10 | 82 |
|
|
|
| |
|
| ≥ 3 months | 2 | 185 | 0.12 [‐0.43, 0.67] | 0.42 | 0.67 | 2.8 | 0.09 | 64 | 1.36 | 1 | 0.24 | 26.3 | |
| Training group size | 1 | 6 | 419 | 0.62 [‐0.06, 1.29] | 1.78 | 0.07 | 44.35 | < 0.10 | 89 |
|
|
|
| |
|
| ≤ 5 | 4 | 264 | 0.25 [‐0.04, 0.54] | 1.67 | 0.10 | 8.78 | 0.29 | 12 | 0.94 | 1 | 0.33 | 0 | |
| Training administrator | Human | 6 | 559 | 0.66 [0.08, 1.23] | 2.24 | 0.03 | 46.02 | < 0.10 | 89 |
|
|
|
| |
|
| Computer | 4 | 124 | 0.15 [‐0.20, 0.51] | 0.85 | 0.40 | 2.63 | 0.45 | 0 | 2.13 | 1 | 0.14 | 53 | |
| Nonword reading accuracy | Training type | Phonics only | 3 | 232 | 0.91 [‐0.45, 2.28] | 1.32 | 0.19 | 36.92 | < 0.10 | 95 |
|
|
|
|
|
| Phonics + phoneme awareness | 5 | 280 | 0.63 [0.38, 0.88] | 4.86 | < 0.10 | 1.84 | 0.88 | 0 | 0.16 | 1 | 0.69 | 0 | |
| Training group size | 1 | 5 | 284 | 1.06 [0.39, 1.73] | 3.09 | < 0.10 | 21.92 | < 0.10 | 82 |
|
|
|
| |
|
| ≤ 5 | 3 | 228 | 0.32 [‐0.32, 0.96] | 0.97 | 0.33 | 9.64 | < 0.10 | 79 | 2.43 | 1 | 0.12 | 58.8 | |
| Training administrator | Human | 4 | 388 | 1.12 [0.48, 1.76] | 3.42 | < 0.10 | 22.23 | < 0.10 | 87 |
|
|
|
| |
|
| Computer | 4 | 124 | 0.31 [‐0.33, 0.96] | 0.96 | 0.34 | 8.65 | 0.03 | 65 | 3.02 | 1 | 0.08 | 66.8 | |
| Outcome or subgroup title | No. of studies | No. of participants | Statistical method | Effect size |
| 1 Word reading accuracy Show forest plot | 10 | 683 | Std. Mean Difference (IV, Random, 95% CI) | 0.47 [0.06, 0.88] |
| 2 Nonword reading accuracy Show forest plot | 8 | 512 | Std. Mean Difference (IV, Random, 95% CI) | 0.76 [0.25, 1.27] |
| 3 Word reading fluency Show forest plot | 2 | 54 | Std. Mean Difference (IV, Random, 95% CI) | ‐0.51 [‐1.14, 0.13] |
| 4 Nonword reading fluency Show forest plot | 1 | 18 | Std. Mean Difference (IV, Random, 95% CI) | 0.38 [‐0.55, 1.32] |
| 5 Reading comprehension Show forest plot | 3 | 173 | Std. Mean Difference (IV, Random, 95% CI) | 0.14 [‐0.46, 0.74] |
| 6 Spelling Show forest plot | 2 | 140 | Std. Mean Difference (IV, Random, 95% CI) | 0.36 [‐0.27, 1.00] |
| 7 Letter‐sound knowledge Show forest plot | 3 | 192 | Std. Mean Difference (IV, Random, 95% CI) | 0.35 [0.04, 0.65] |
| 8 Phonological output Show forest plot | 4 | 280 | Std. Mean Difference (IV, Random, 95% CI) | 0.38 [‐0.04, 0.80] |
| Outcome or subgroup title | No. of studies | No. of participants | Statistical method | Effect size |
| 1 Word reading accuracy Show forest plot | 10 | Std. Mean Difference (IV, Random, 95% CI) | Subtotals only | |
| 1.1 Training type: phonics only | 3 | 232 | Std. Mean Difference (IV, Random, 95% CI) | 0.91 [‐0.17, 1.98] |
| 1.2 Training type: phonics + phoneme awareness | 6 | 415 | Std. Mean Difference (IV, Random, 95% CI) | 0.28 [0.00, 0.56] |
| 1.3 Training intensity: < 2 hours/week | 8 | 559 | Std. Mean Difference (IV, Random, 95% CI) | 0.48 [‐0.04, 1.00] |
| 1.4 Training intensity: ≥ 2 hours/week | 2 | 124 | Std. Mean Difference (IV, Random, 95% CI) | 0.34 [‐0.03, 0.72] |
| 1.5 Training duration: < 3 months | 8 | 498 | Std. Mean Difference (IV, Random, 95% CI) | 0.56 [0.07, 1.04] |
| 1.6 Training duration: ≥ 3 months | 2 | 185 | Std. Mean Difference (IV, Random, 95% CI) | 0.12 [‐0.43, 0.67] |
| 1.7 Training group size: 1 | 6 | 419 | Std. Mean Difference (IV, Random, 95% CI) | 0.62 [‐0.06, 1.29] |
| 1.8 Training group size: ≤ 5 | 4 | 264 | Std. Mean Difference (IV, Random, 95% CI) | 0.25 [‐0.04, 0.54] |
| 1.9 Training administrator: human | 6 | 559 | Std. Mean Difference (IV, Random, 95% CI) | 0.66 [0.08, 1.23] |
| 1.10 Training administrator: computer | 4 | 124 | Std. Mean Difference (IV, Random, 95% CI) | 0.15 [‐0.20, 0.51] |
| 2 Nonword reading accuracy Show forest plot | 8 | 1536 | Std. Mean Difference (IV, Random, 95% CI) | 0.76 [0.48, 1.04] |
| 2.1 Training type: phonics only | 3 | 232 | Std. Mean Difference (IV, Random, 95% CI) | 0.91 [‐0.45, 2.28] |
| 2.2 Training type: phonics + phoneme awareness | 5 | 280 | Std. Mean Difference (IV, Random, 95% CI) | 0.63 [0.38, 0.88] |
| 2.3 Training group size: 1 | 5 | 284 | Std. Mean Difference (IV, Random, 95% CI) | 1.06 [0.39, 1.73] |
| 2.4 Training group size: ≤ 5 | 3 | 228 | Std. Mean Difference (IV, Random, 95% CI) | 0.32 [‐0.32, 0.96] |
| 2.5 Training administrator: human | 4 | 388 | Std. Mean Difference (IV, Random, 95% CI) | 1.12 [0.48, 1.76] |
| 2.6 Training administrator: computer | 4 | 124 | Std. Mean Difference (IV, Random, 95% CI) | 0.31 [‐0.33, 0.96] |
| Outcome or subgroup title | No. of studies | No. of participants | Statistical method | Effect size |
| 1 Word reading accuracy Show forest plot | 10 | 683 | Std. Mean Difference (IV, Fixed, 95% CI) | 0.46 [0.29, 0.62] |
| 2 Nonword reading accuracy Show forest plot | 8 | 512 | Std. Mean Difference (IV, Fixed, 95% CI) | 0.82 [0.62, 1.01] |
| 3 Word reading fluency Show forest plot | 2 | 54 | Std. Mean Difference (IV, Fixed, 95% CI) | ‐0.53 [‐1.08, 0.02] |
| 4 Nonword reading fluency Show forest plot | 1 | 18 | Std. Mean Difference (IV, Fixed, 95% CI) | 0.38 [‐0.55, 1.32] |
| 5 Reading comprehension Show forest plot | 3 | 173 | Std. Mean Difference (IV, Fixed, 95% CI) | 0.01 [‐0.31, 0.32] |
| 6 Spelling Show forest plot | 2 | 140 | Std. Mean Difference (IV, Fixed, 95% CI) | 0.28 [‐0.09, 0.65] |
| 7 Letter‐sound knowledge Show forest plot | 3 | 192 | Std. Mean Difference (IV, Fixed, 95% CI) | 0.35 [0.04, 0.65] |
| 8 Phonological output Show forest plot | 4 | 280 | Std. Mean Difference (IV, Fixed, 95% CI) | 0.44 [0.19, 0.70] |
| Outcome or subgroup title | No. of studies | No. of participants | Statistical method | Effect size |
| 1 Word reading accuracy Show forest plot | 9 | 633 | Std. Mean Difference (IV, Random, 95% CI) | 0.47 [0.01, 0.93] |
| 2 Nonword reading accuracy Show forest plot | 7 | 462 | Std. Mean Difference (IV, Random, 95% CI) | 0.80 [0.22, 1.38] |