Latihan fonik untuk penutur Bahasa Inggeris yang lemah membaca.
Referencias
References to studies included in this review
References to studies excluded from this review
References to studies awaiting assessment
References to ongoing studies
Additional references
Characteristics of studies
Characteristics of included studies [ordered by study ID]
| Methods | Randomised controlled trial Two intervention groups (1 relevant: phonics training) and 1 control group (alterative training) | |
| Participants | Criteria: a score at or below the 40th percentile on the WJRMT Word Identification test; a score below the 50th percentile on the Sound Categorization subtest Recruits: 54 English‐speaking children (ranging from 6 years, 2 months to 7 years, 8 months) from 2 elementary schools. Scored slightly below average range on Vocabulary subtest form Stanford Binet IV‐Revised (mean 16.5, SD = 2.36; range = 11 to 22) Allocation: "Children were randomly assigned to one of three conditions" (p. 95). This review used the phonological decoding training group as the intervention group and the maths training group as the control group. There was also a phonological awareness control group (see notes), which was not used by this review Intervention group: N = 18 Control group: N = 18 | |
| Interventions | Intervention: phonological decoding training: Hint and Hunt I programme: "Designed to acquaint children with the basic short vowel sounds and provide practice in identifying words containing those sounds" (p. 94; phonics). Control: attentional control group: maths‐oriented software programmes (Alien Addition, Math Rabbit, Math Blaster) Procedure: training took place in school psychologist's office. Groups of 3 and 4 throughout the school day. 25‐minute sessions, 4 times a week (Monday to Thursday) for 8 weeks. Friday used as make‐up sessions. One experimenter at each site who set up each station with appropriate programme for each student. Training done via computer. Experimenter helped with technical issues but no conceptual issues. Students rewarded with 1 sticker at end of session | |
| Outcomes | Time of post‐test: immediately after training completed Relevant measures: nonword reading accuracy (Word Analysis subtest from WJRMT), regular word reading accuracy (experimental: analogue reading: matching a spoken word to 1 of 2 printed words), regular and irregular word reading accuracy (Word Identification subtest from WJRMT) and phonological awareness (experimental: phoneme elision) | |
| Notes | 1. The phonological awareness training group used Daisy Quest and Daisy's Castle. Daisy Quest trains recognising words that rhyme; recognising words that have the same beginning, middle, and ending sounds. Daisy's Castle teaches these additional skills: recognising words formed from a series of phonemes presented as onset and rhyme; recognising words that can be formed from a series of separately presented phonemes; counting the number of sounds in words. These programmes do not include phonics and so were not included as an intervention in this review 2. Two measures were used to test Reading Accuracy: nonwords. We only included the Word Analysis subtest from the WJRMT as it is a published test with known reliability | |
| Risk of bias | ||
| Bias | Authors' judgement | Support for judgement |
| Random sequence generation (selection bias) | Low risk | Quote from publication: "children were randomly assigned to one of three conditions" Comment: No other information provided |
| Allocation concealment (selection bias) | Unclear risk | No information provided |
| Blinding of participants and personnel (performance bias) | Unclear risk | No information provided participants or personel, however, participants unlikely to know allocation |
| Blinding of outcome assessment (detection bias) | Unclear risk | No information provided |
| Incomplete outcome data (attrition bias) | Unclear risk | No information provided; allocated group sizes not reported in publication, and no response to request for information |
| Selective reporting (reporting bias) | Low risk | Data reported for all phonological and reading tests listed in methods; adequate detail for data to be included in analysis |
| Other bias | Low risk | None apparent |
| Methods | Randomised controlled trial One intervention group (phonics + phonological awareness) and 1 control group (untrained) | |
| Participants | Criteria: received weekly group‐based remedial reading instruction at the school and referred to the study by a support teacher Recruits: 20 English‐speaking dyslexic primary students (15 male, 5 female; mean age 101.35 months, SD 17.58 months; mean FSIQ‐2 100.15, SD 9.38) from a medium‐sized private primary school in Western Sydney (Australia). The participants had no other co‐morbid specific learning disorders. They had an average delay of 13 months on a word reading task (subtest on WIAT‐II); 11 months on a reading comprehension task (subtest on WIAT‐II), and 25 months on a pseudoword decoding task (subtest on WIAT‐II) Allocation: random allocation Intervention group: N = 10 (mean age: 99.8 months; SD 18.94) Control group: N = 10 (mean age: 102.9 months; SD 16.98) | |
| Interventions | Intervention: Phonics Alive! 2: The Sound Blender (version 1.2): 10‐week training programme. "Program consists of 12 modules which systematically build skills in phoneme awareness, phoneme‐grapheme correspondences, sound and letter blending and speed of processing" (P. 41). Control: students continued to receive their school‐based reading instruction (both in‐class and at a weekly remedial group with the support teacher) Procedure: children in the intervention group continued their school‐based instruction while they did their training at home and at school on a computer. At home, each training module took approximately 15 minutes to complete. Students were instructed to repeat each module until they reached a mastery level of 90% correct. Upon mastery of a module, students had to complete review worksheets. According to parents, an average of 3.6 computer modules were attempted per child per week. "Thus, over the 10‐week training period, students completed an average of 46 module attempts which represented approximately 11.5 hours of on‐computer time" (in addition to 30 minutes per week with researcher: 5 hours). At school, children did "a weekly, 30 minute, one‐on‐one session with the researcher where the student's progress was assessed by reviewing their progress chart and completed worksheets (5 minutes) and completing the current module on a computer (to verify mastery)." Any remaining time was spent playing a "nonsense word game" | |
| Outcomes | Time of post‐test: immediately after training completed Relevant measures: nonword reading accuracy (WIAT‐II: Pseudoword Decoding subtest), regular and irregular word reading accuracy (WIAT‐II: Word Reading subtest) and reading comprehension (WIAT‐II subtest) | |
| Notes | Contacted author for post‐test standard deviations 14/09/2011 (supplied) | |
| Risk of bias | ||
| Bias | Authors' judgement | Support for judgement |
| Random sequence generation (selection bias) | Low risk | Quote from publication: "participants were randomly assigned to either a control or treatment condition" Quote from personal communication: "participants who met selection criteria were randomly assigned to either the Tx or Ct condition by drawing eligible names from a hat and placing sequentially into Tx/Ct until all were assigned" |
| Allocation concealment (selection bias) | Unclear risk | No information provided |
| Blinding of participants and personnel (performance bias) | High risk | Quote from personal communication: "given this was a simple Tx/Ct design there was no way to blind study participants or personnel from knowledge of who was in the treatment group. However, the trainer had no previous knowledge of or awareness of the participants and was not involved in the referral process (they were referred by the school counsellor)" Comment: it is difficult to ensure double blinding in cognitive treatment trials where a human administers the training. It is practically impossible to blind expert personnel to the treatment that they are administering. However, it is unlikely that the participants have the expertise to discern which treatment of control group they have been allocated to |
| Blinding of outcome assessment (detection bias) | Unclear risk | Quote from personal communication: "Initial assessment of IQ and Reading was conducted by the investigator on all participants PRIOR to their random assignment to Tx or Ct conditions, and thus the assessor was unaware of their future status in the study. Given this was a pilot study, post‐treatment assessment was conducted by the same assessor on all students and this precluded the assessor conducting blind post‐treatment assessments". |
| Incomplete outcome data (attrition bias) | Low risk | Comment: degrees‐of‐freedom values indicate that data for all randomised participants were included in the analyses. Author sent post‐test SDs |
| Selective reporting (reporting bias) | Low risk | Data reported for all reading tests listed in methods; adequate detail for data to be included in analysis |
| Other bias | Low risk | None apparent |
| Methods | Randomised controlled trial One intervention group (phonics + phoneme awareness) and 1 control group (untrained) | |
| Participants | Criteria: enrolled in a remedial reading programme Recruits: 20 English‐speaking participants from American alternative high school in Illinois. Most participants were bilingual. Mostly Title 1 (lower SES) Allocation: "students were randomly assigned to an experimental or control group by drawing names" (p. 49) Intervention group: N = 9 (5 females, 4 males); mean age 16 years, 2 months; 3 African‐American, 5 Hispanic, 1 white); average standard score on TOWRE sight‐words: 85 (within average) and TOWRE phonemic decoding: 83 (below average) Control group: N = 9 (5 females, 4 males); mean age 16 years, 1.5 months; 1 African‐American, 7 Hispanic, 1 white; average standard score on TOWRE sight‐words: 85 (within average) and TOWRE phonemic decoding: 81 (below average) | |
| Interventions | Intervention: practice in phonemic awareness and decoding multi‐syllable words using backwards chaining, followed by practice on Word Workout computer program (practice skills learned in teacher‐instructed sessions; phonics + phonological awareness) Control: not explicitly stated; however, probably treatment and schooling as usual throughout the training period (since all participants came from a remedial reading programme and participants were divided into experimental and control groups via random drawing (p. 48)) Procedure: training was conducted by the researcher with small groups or one‐on‐one. For 7 weeks, children did three 15‐minute sessions per week | |
| Outcomes | Time of post‐test: immediately after training completed Relevant measures: nonword reading accuracy (WJTA‐III: Word Attack subtest; forms A and B), regular and irregular word reading accuracy (WJTA‐III: Letter Word Identification subtest; forms A and B), nonword reading fluency (TOWRE: Phonemic Decoding Efficiency subtest (forms A and B)), regular and irregular word reading fluency (TOWRE: Sight Word Efficiency subtest (forms A and B)) and reading comprehension (Gates‐MacGinitie Reading Comprehension Subtest) | |
| Notes | 1. TOWRE sight‐words and TOWRE phonemic decoding standard scores calculated using raw scores given (see pp. 771‐772) 2. Two participants dropped out (1 from each group) and thus their pre‐test scores were removed. The thesis only provides information on the 18 participants who completed the training 3. Qualitative data (survey and focus groups) also collected | |
| Risk of bias | ||
| Bias | Authors' judgement | Support for judgement |
| Random sequence generation (selection bias) | Low risk | Quote from publication: "students were randomly assigned to an experimental or control group by drawing names" |
| Allocation concealment (selection bias) | Unclear risk | No information provided |
| Blinding of participants and personnel (performance bias) | Unclear risk | No information provided for participants or personel, however, it is unlikely participants were aware of allocation |
| Blinding of outcome assessment (detection bias) | Low risk | Quote from publication: "Tests were administered by an experienced teacher who was not otherwise involved with the study ... to reduce tester bias". |
| Incomplete outcome data (attrition bias) | Low risk | Quote from publication: "One student from each group dropped out before the conflusion". Comment: Both groups experienced the same (low) drop‐out rate. |
| Selective reporting (reporting bias) | Low risk | Data reported for all reading tests listed in methods; adequate detail for data to be included in analysis. |
| Other bias | Low risk | No other apparent bias. |
| Methods | Randomised controlled trial (most likely) Two intervention groups (2 trained groups; phonics + phoneme awareness) and 2 control groups (untrained) | |
| Participants | Criteria: a standard score less than 91 on the Word Attack test of the WRMT‐R; a standard score less than 91 on the Word Identification subtests of the WRMT‐R Recruits: 99 children identified as at risk for reading difficulties with normal IQ (RD) or at risk for becoming poor readers with low IQ ('garden variety' (GV) poor readers). Children came from US schools, mostly middle‐class elementary schools. 92.8% were white, 6% African‐American, 5% Hispanic, and 7% Asian‐American. 45.9% females, 54.1% males Allocation: 'Half of the RDs and half of the GVs were included in the training group and the other half comprised the control groups. So, there were four groups (RD Trained, GV Trained, RD Control and GV Control). Group membership was determined by matching the students at risk for RD on the variables outlined in the method section and then RANDOMLY assigning them to either the T or C group. Statistical analysis was performed to determine that the T and C groups were equivalent' (personal communication in email). Since this review did not use IQ as an exclusionary criteria, we merged the 2 trained groups (RD and GC) to form the Intervention group, and merged the two untrained groups (RD and GV) to form the Control group. Intervention group: N = 49; 25 females and 24 males; mean age 79.8 months Control group: N = 50; 26 females and 24 males; mean age 80.9 months | |
| Interventions | Intervention: intrasyllable discrimination training, phonemic blending and phonemic segmentation with letters (phonics + phonological awareness). The training sequence was the same for each participant Control: no training Procedure: intervention was one‐on‐one, 15 to 20 minutes/session. Approximately 40 sessions ‐ twice a week for approximately 20 weeks by computer and trainer | |
| Outcomes | Time of post‐test: less than 1 month after training completed Relevant measures: nonword reading accuracy (WJRMT‐R: Word Attack subtest) and regular and irregular word reading accuracy (WJRMT‐R: Word Identification subtest) | |
| Notes | 1. The study also included 332 non‐disabled children; however, we have excluded them from our review 2. Drop‐outs for 486 participants initially screened: 55 (13.3%), "this loss in the participant pool due to attrition (13.3%) is similar to the attrition rate these school systems typically experience" (p. 649) 3. We used the word attack and word identification measures. Since we are including all poor readers regardless of IQ, we took the mean of the 2 untrained groups (RD and GV) for control data and the 2 trained groups (RD and GV) for experimental data 4. Contacted Hurford (20/09/2011) for means and SDs for primary outcomes (discrimination, segmentation, word identification and word attack measures) at pre and post test (supplied) | |
| Risk of bias | ||
| Bias | Authors' judgement | Support for judgement |
| Random sequence generation (selection bias) | Unclear risk | Quote from publication: 'at‐risk training and control groups were then matched as closely as possible on age, gender, race, reading ability, phonological processing ability, and intelligence'. Quote from personal communication: 'Half of the RDs and half of the GVs were included in the training group and the other half comprised the control groups. So, there were four groups (RD Trained, GV Trained, RD Control and GV Control). Group membership was determined by matching the students at risk for RD on the variables outlined in the method section and then randomly assigning them to either the T or C group. Statistical analysis was performed to determine that the T and C groups were equivalent'. Comment: Given the different information in the publication (groups were matched) and personal communication (groups were randomised to ensure matching), random sequence generation was deemed unclear. |
| Allocation concealment (selection bias) | Unclear risk | No information provided |
| Blinding of participants and personnel (performance bias) | Unclear risk | No information provided |
| Blinding of outcome assessment (detection bias) | Unclear risk | Personal communication: Testing was done by someone who did not know the students |
| Incomplete outcome data (attrition bias) | Low risk | Quote from publication: "three groups lost approximately same percentage [13.3%] of participants". Comment: All groups experienced the same (relatively low) drop‐out rate. |
| Selective reporting (reporting bias) | Low risk | Comment: Data reported for all reading tests listed in methods; adequate detail for data to be included in analysis. |
| Other bias | Low risk | Comment: None apparent. |
| Methods | Randomised controlled trial Two intervention groups (1 relevant: phonics + phoneme awareness) and 2 control groups (1 relevant; untrained) | |
| Participants | Criteria: 1 of 7 poorest Year 2 scorers in 18 schools on the Diagnostic Survey (Clay, 1985) Recruits: 142 children in schools where 61% were boys, 42% received free school meals, and 16% spoke English as a second language. One child was excluded from the study because of missing baseline data. All children had IQ in the average range (92 to 96) Allocation: random allocation (within schools) of poor readers to intervention and control groups Intervention group: N = 96 Control group: N = 46 | |
| Interventions | Intervention: Phonological Training: "Following Bradley and Bryant (1985), this involved sound awareness training plus word building with plastic letters. The training initially focused on alliteration and rhyme but also included work on boundary sounds and vowels and digraphs in response to the child's progress. Children also matched sounds with plastic letters and constructed words" (p. 234; phonics + phonological awareness) Control: children in within‐school control groups received standard provision available in school. Since these children were poor readers, they received around 21 minutes extra help per week with reading Procedure: intervention was 40 sessions (10 minutes each, one‐on‐one with tutor, spread over 7 months). Five tutors who delivered phonological training. Did not share details of intervention with classroom teachers | |
| Outcomes | Time of post‐test: immediately after training completed Relevant measures: regular and irregular word reading accuracy (BAS word reading) and reading comprehension (Neale Prose Reading) | |
| Notes | 1. For the phonological training group, the article reported that the 6 poorest readers from 23 schools were allocated to either the phonological training (N = 4) or the within‐school control (N = 2). This would equate to 92 participants in the phonological training group. However Table 1 (p. 232) reports that there were 96 participants in the phonological training group. We contacted Jane Hurry to explain this. We received a reply on the 16/01/2012: "I have now looked at the file and find that of the 23 Phon schools we actually selected the bottom 7 children from 5 of the schools. Of those 5 extra children, there was missing baseline data for 1, so that child never made it into the study. The other extra 4 were assigned to the intervention, hence the 96" 2. We have excluded the 22 Reading Recovery schools (and controls) from our analysis since it involved text reading (an exclusion criterion of our review) 3. We have excluded the 18 untrained control schools since the within‐school controls are superior controls for the trained children because they were better matched for SES and learning environment 4. Contacted Hurry on which subtests were used from the Neale Prose Reading. Replied that they used the accuracy and comprehension subtests to make up their Neale Prose Reading measure (see Table 2). We have used this as a measure of reading comprehension 5. There were 3 post‐tests: post‐test 1 (after completion), post‐test 2 (1 year later), post‐test 3 (3.5 years later). We included the first post‐test results in this review since all other studies in this review reported immediate post‐test data 6. Contacted Hurry for clarification on: (1) participant numbers (Hurry, 16/01/2012; see above); (2) attrition (Hurry, 17/01/2012; see response in 'Risk of bias' table below), (3) which subtest of the Neale (Prose) Reading was used: Neale accuracy and comprehension scores (Hurry, 03/02/2012), (4) approximately how many minutes/hours the participants spent on phonological training per week (Hurry's response 16/02/2012: "I confirm that each child was given 40 x 10 min individual sessions = 400 minutes") | |
| Risk of bias | ||
| Bias | Authors' judgement | Support for judgement |
| Random sequence generation (selection bias) | Low risk | Quote from publication for the relevant groups (phonological training and within‐school controls): the "six poorest readers randomly assigned to Phonological Training (N=4) or to within‐school control condition (N=2)" |
| Allocation concealment (selection bias) | Unclear risk | No information provided |
| Blinding of participants and personnel (performance bias) | Unclear risk | No information provided for participants or personel, however, it is unlikely participants were aware of allocation |
| Blinding of outcome assessment (detection bias) | Low risk | Quote from publication: "At each of the three post‐tests, members of the research team tested the children 'blind', that is without knowing to which group children belonged" |
| Incomplete outcome data (attrition bias) | Low risk | For the relevant groups (phonological training and within‐school controls), 4 and 3 (respectively) children dropped out between pre‐ and post‐test 1. We requested more information from J. Hurry. Response (received 17/01/2012) that some of children "had failed to receive a sufficient amount of the intervention, usually as a result of moving school" while others "could not be tested because they had moved too far or were not traced". Thus both groups experienced the same (relatively low) drop‐out rate for reasons extraneous to the study |
| Selective reporting (reporting bias) | Low risk | Data reported for all reading tests listed in methods; adequate detail for data to be included in analysis |
| Other bias | Low risk | None apparent |
| Methods | Randomised controlled trial Four intervention groups (3 relevant: phonics) and one1 control group (untrained). | |
| Participants | Criteria: less than 7 words read correctly on the WRMT Word Identification test; or less than 7 words read correctly on the WRAT‐R Word Identification test; or less than 7 training words reading correctly Recruits: 125 English‐speaking Grade 2 children from 16 schools in Canada. Mean performance on WRMT at Grade 1.2 level and word identification subtest of WRAT‐R scores in pre‐school range. On average only read 3 or 4 words from the set of 32 words to be trained Allocation: children were randomly allocated to 5 groups: 4 intervention groups and 1 control group. Three intervention groups did phonics training and so all these children were grouped together for the Intervention group. The fourth group did whole word training (not relevant). The fifth (untrained) group was used as the control group Intervention group: N = 75 Control group: N = 25 | |
| Interventions | "The four training groups all learned to read the same set of 32 words, as well as participating in the classroom program... On each day of training, children in all groups read once only the entire set of 32 words printed on individual index cards. The groups differed in how the words were grouped during learning, and in the method of instruction" (p. 366) Intervention 1 (rime training): "32 words arranged so that the 4 written words of a rime family were shown together. First 15 days or until all 32 words pronounced correctly on 2 successive days: 'common rime segment for each family block was written in red to highlight the shared orthographic segment" (p. 366). Following 15 days or when criterion was met: "10 black and white trials where the child pronounced the 32 words printed in black ink once a day" (p. 368) Intervention 2 (onset training): "four written words per family block shared the initial consonant(s)‐vowel segment". 15 colour trial days (or 2 successive correct readings): initial consonant(s)‐vowel segment written in red. Following 15 days or when criterion met: maximum of 10 black and white trials Intervention 3 (phoneme training): "four written words for each block were randomly selected from the 32 words, with the restriction that no two onset or rime family members could be in the same block. The same eight random blocks were used on each day of training. There was no consistent relation among phonemic units in the four words, but for each word the letters of each phoneme were printed in a different colour.. maximum of 15 colour trials and 10 black and white trials" (p. 368) Control: received regular classroom regimen during the training phase Procedure: pre‐test phase, training phase, post‐training phase. One‐on‐one training | |
| Outcomes | Time of post‐test: immediately after training completed Relevant measures: nonword reading accuracy (experimental: 48 new nonwords) and regular word reading accuracy (experimental: 48 new regular words) | |
| Notes | 1. Paper presents 2 experiments. Experiment 1 focused on non‐readers while experiment 2 focused on poor readers. Therefore we only included Experiment 2 in our review Intervention 4 (of experiment 2) trained irregular words and therefore we did not include this in our review/analysis 2. Contacted author (B. Levy) 26/09/2011 for: (1) mean age (and SDs) of participants: did not know; (2) number of males/females: did not know; (2) inclusion criteria: did not know; (4) details on the control group: same as the control group in experiment; (5) length of training: depended on child's progress and speed of responding; (6) training group size: one‐on‐one 3. Since the rime, onset and phoneme training groups all trained phonics, we merged their results for the experimental data 4. There were 2 measures that tested Reading Accuracy: nonwords (onset nonwords and rime nonwords). We merged these 2 tests for a measure of Reading Accuracy: nonwords. Similarly, there were 2 measures testing Reading Accuracy: regular words (onset words and rime words). We merged these 2 tests for 1 measure of Reading Accuracy: regular Words 5. There were 2 immediate post‐tests: 1 the day after completion, and 1 a week after completion. We used the first post‐test in this review | |
| Risk of bias | ||
| Bias | Authors' judgement | Support for judgement |
| Random sequence generation (selection bias) | Low risk | Quote from publication: "twenty‐five children were randomly assigned to each of the five training conditions". Quote from personal communication: "children were randomly assigned to conditions as they arrived for the study, with the intention to keep numbers per condition as equal as possible in each school at all times. The idea was to balance for time of year effects and conditions in schools. Otherwise assignment per condition was random and controlled by the tester". |
| Allocation concealment (selection bias) | Unclear risk | Quote from personal communication: "the testers knew what condition the child was in, since that defined the experimental procedures" |
| Blinding of participants and personnel (performance bias) | Low risk | Quote from publication: "all phases of the experiment were conducted in a small room in the school where the experimenter worked with each child individually" Quote from personal communication: "the teachers and parents knew the general purpose of the study but no details of manipulations or child assignments or individual child outcomes" Comment: unlikely participants were aware of allocation |
| Blinding of outcome assessment (detection bias) | Unclear risk | Quote from personal communication: "the same testers scored all tests for both pre and post tests. No blinding of testers was attempted since the experimenters were largely the testers" |
| Incomplete outcome data (attrition bias) | Low risk | No explicit information about attrition, but degrees‐of‐freedom suggest all randomised participants were included in the analysis |
| Selective reporting (reporting bias) | Low risk | Data reported for all outcome measures outlined in methods; adequate detail for data to be included in analysis |
| Other bias | Low risk | None apparent |
| Methods | Randomised controlled trial (stratified randomisation) 6 intervention groups (4 relevant: phonics training) and 2 control groups (alternative training) | |
| Participants | Criteria: in Grade 2; English speaker; a score below 90 on the WRAT‐3 Word Identification test; a score more than half a grade below appropriate grade on the WRMT Word Identification test; less than 15 training words read correctly Recruits: 128 children (56 female, 72 male; mean age 7 years, 7 months) Allocation: poor readers were allocated to 4 fast RAN groups (rime training, phoneme training, whole word training, untrained controls) and 4 slow RAN groups (rime training, phoneme training, whole word training, untrained controls). Since (1) the rime and phoneme training trained phonics, and (2) this study did not discriminate poor readers based on their RAN, we grouped the 4 fast and slow RAN groups who did rime or phoneme trainees into the intervention group, and grouped the fast and slow RAN untrained controls into the control group Intervention group: N = 64 Control group: N = 32 | |
| Interventions | "On each day of training, children in all groups read through the set of 48 words once only. Each word was printed on a separate index card. On the 1st day only, the experimenter first read through the set only once, in a manner appropriate to modelling that training condition, and then the child read through the set in the same manner. On all subsequent days, the child read the words and the experimenter provided only corrective feedback. The critical differences among the three training conditions for the fast and the slow RAN groups were how the 48 words were grouped together during the presentation and how the words were segmented" (pp. 123‐124) Intervention 1 (rime training): "48 words were presented 4 at a time, where the word on each of the four cards presented together was from the same rime family and each was segmented by colouring the rime unit in red and the onset unit in black" (p. 124). Colour trials: 15 days or until criterion of entire 48 words read correctly on 2 successive days was met. Following the colour trials the words were printed in black ink only Intervention 2 (phoneme training): "Each phonemic unit was printed in a different colour for the 1st 15 days of training or until the criterion of two successive perfect readings was met." Following the colour trials the words were printed in black and white Control (arithmetic training): "Help with addition and subtraction in one‐on‐one sessions" (p. 125) Procedure: all one‐on‐one training, outside of the classroom, for 15 minutes per day for 4 weeks | |
| Outcomes | Time of test: day after completion of training Relevant measures: nonword reading accuracy (experimental: 48 new nonwords) and regular word reading accuracy (experimental: 48 new regular words) | |
| Notes | 1. While there were 6 intervention groups (fast and slow RAN rime, phoneme and whole word) our review focuses on the rime and phoneme conditions since they were phonics training 2. Since both the rime and phoneme intervention groups trained phonics, the experimental data used in this review is an average of the fast and slow RAN rime and phoneme training groups (that is, 4 groups). The control data is an average of the fast and slow RAN control groups 3. There were 2 immediate post‐tests: 1 the day after completion, and 1 a week after completion. We only used the first post‐test in this review | |
| Risk of bias | ||
| Bias | Authors' judgement | Support for judgement |
| Random sequence generation (selection bias) | Low risk | Quote: "the fastest RAN children were assigned to the four fast RAN training groups and the slowest RAN children were assigned to the four slow RAN training groups". And then 1 fast RAN group and 1 slow RAN group were allocated to each type of training and a control group Quote from personal communication: "Children were randomly assigned to conditions as they arrived for the study, with the intention to keep numbers per condition as equal as possible in each school at all times. The idea was to balance for time of year effects and conditions in schools. Otherwise assignment per condition was random and controlled by the tester" |
| Allocation concealment (selection bias) | Unclear risk | Quote from personal communication: "the testers knew what condition the child was in, since that defined the experimental procedures" |
| Blinding of participants and personnel (performance bias) | Low risk | Quote from personal communication: "the teachers and parents knew the general purpose of the study but no details of manipulations or child assignments or individual child outcomes" Comment: unlikely participants were aware of allocation |
| Blinding of outcome assessment (detection bias) | Unclear risk | Quote from personal communication: "the same testers scored all tests for both pre and post tests. No blinding of testers was attempted since the experimenters were largely the testers" |
| Incomplete outcome data (attrition bias) | Low risk | Comment: no explicit information about attrition, but analysis of number of children who met criterion after training suggests that all randomised participants were included in the analysis (that is, 16 in each group) |
| Selective reporting (reporting bias) | Low risk | Data reported for all outcome measures outlined in methods; adequate detail for data to be included in analysis |
| Other bias | Low risk | None apparent |
| Methods | Randomised controlled trial Two intervention groups (1 relevant: phonics + sight words) and 1 control group (alternative training) | |
| Participants | Criteria: a score below the 25th percentile on 4 out of 5 reading tests (WRAT‐3: Reading; WRMT‐R: Word Identification; WRMT‐R: Word Attack; Peabody Individual Achievement Test ‐ Revised: Reading Recognition; GFW Sound‐symbol Tests: Reading of Symbols); WISC‐R Verbal and Performance IQ of at least 85; no English as second language, extreme hyperactivity, hearing impairment, brain damage, a chronic medical condition or serious emotional disturbance, attention deficits; age between 7 and 13 years Recruits: 54 disabled readers (38 boys, 16 girls), aged 7 to 13 years (mean age 8.4 years, SD 1.6). WISC‐R Mean Verbal IQ = 98.4, SD 10.6; Mean Performance IQ = 106.2, SD 12.6. Majority of participants were from families in the middle socioeconomic ranges according to the Blishen scales (Index M = 43.6 m, SD = 11.5, range 28.9 to 71.7) Allocation: randomly assigned to 3 groups: REG≠EXC, REG=EXC, and control (CSS). This review used the REG≠EXC group as the intervention group and the control group was the control group (see notes for remaining group) Intervention group: N = 18 (Jan Frijters contacted for this) Control group: N = 18 (Jan Frijters contacted for this) | |
| Interventions | Intervention: REG≠EXC: "Regular words were taught by training the constituent letter‐sound mappings. Exception words were introduced and rehearsed by whole‐word methods alone... spelling training for regular words emphasized segmentation of the word into its individual sounds, with attention paid to the sequence of sounds, the sequence of individual letters, and any letter‐sound patterns illustrated by the word" (pp. 770‐771) Control: CSS programme: problem solving and study skills training Procedure: 35 one‐hour sessions for each programme (4 per week). Children instructed in pairs in special laboratory classrooms at a paediatric teaching hospital by special education teachers. "There was no attempt to explicitly control for other educational experiences of the children enrolled in these programs. Some were in special education placements in their community schools; some were not and had never been. For those subjects receiving any other individualized remedial instruction, their teacher was asked to refrain from training, rehearsing, or elaborating in any way the instructional content the child was receiving as part of his or her experimental treatment program" (p. 771) | |
| Outcomes | Time of post‐test: not stated explicitly but appears to be immediate Relevant measures: regular word reading accuracy (experimental: trained and untrained words), irregular word reading accuracy (experimental: trained and untrained words), regular word reading fluency (experimental: trained and untrained words), irregular word reading fluency (experimental: trained and untrained words), regular word spelling (experimental: trained and untrained words), irregular word spelling (experimental: trained and untrained words) and letter‐sound knowledge (experimental: trained and untrained letter‐sound rules) | |
| Notes | 1. Contacted Frijters (4/10/2011) about number of people per training condition (replied N = 18) 2. A second intervention group: REG=EXC was excluded from the review since it trained orthographically regular words by whole word method alone 3. Pre‐ and post‐test means and SDs were provided along with post‐test means adjusted for pre‐test performance differences. We have not included the post‐test means adjusted for pre‐test performance difference because there was very little difference between these adjusted post‐test means and the unadjusted post‐test means, and because the adjusted post‐test means provided standard errors rather than SDs 4. For each of the outcomes there were both trained and untrained measures. We averaged the trained and untrained data for each outcome | |
| Risk of bias | ||
| Bias | Authors' judgement | Support for judgement |
| Random sequence generation (selection bias) | Low risk | Quote from publication: "children were randomly assigned to a treatment condition and to a particular teacher" Quote from personal communication: "children were matched on decoding ability and then random number tables were used to random assign treatment to pair and to assign teacher to pair" Communication: Best described as matching with randomisation |
| Allocation concealment (selection bias) | Low risk | Quote from personal communication: "the PI assigned treatments and teachers to child pair based on participant identity alone. Neither children nor teachers would have had contact with the person doing the assignment, as all contact prior to this point was with study psychometrists" |
| Blinding of participants and personnel (performance bias) | High risk | Quote from personal communication: "since this is a verbally‐administered intervention with quite explicit and structured content, and teachers were trained on the materials used, teachers could not be blind to the particular treatment they were teaching. Participants were not told what their assignments were, but on consent forms were told that they would participate in one of three conditions, with all conditions described. Teachers did not reveal condition to participants" |
| Blinding of outcome assessment (detection bias) | Unclear risk | Quote from personal communication: "All standardized/norm referenced assessments were administered by trained psychometrists who were blind to assignment; however, some content‐related and experimental measures (e.g., the four word lists) were administered by teachers themselves at the pre‐specified testing intervals. In the former case, psychometrists would have had the participants name and testing folder alone, not the master subject‐list". Comment: We used data from the experimental measures that were administered by teachers, and so risk is unclear. |
| Incomplete outcome data (attrition bias) | Low risk | Comment: in the publication, there was no explicit information about attrition; the fact that degrees‐of‐freedom varied between tests suggests missing data for some children for some tests Quote from personal communication: "this one has puzzled us. We would typically report dropouts and/or discontinuations. Given the design, we would have expected a df of 50, which is what is reported for most measures. The lower df would likely indicate not dropped‐out participants, but equipment errors, basal/ceiling problems, etc. that may have invalidated particular tests, or in the case of speed specifically (reported as 41 df) a failure of the voice onset recording device" Comment: given that equipment errors etc occur on a random basis, the lower dfs were unlikely to relate to bias |
| Selective reporting (reporting bias) | Low risk | Data reported for all outcome measures outlined in methods; adequate detail for data to be included in analysis |
| Other bias | Low risk | None apparent |
| Methods | Randomised controlled trial Two intervention programmes (1 relevant: phonics + phoneme awareness) and a control (alternative training) | |
| Participants | Criteria: a score below the 25th percentile on 4 out of 5 reading tests (WRAT‐3: Reading; WRMT‐R: Word Identification; WRMT‐R: Word Attack; Peabody Individual Achievement Test ‐ Revised: Reading Recognition; GFW Sound‐symbol Tests: Reading of Symbols); WISC‐R Verbal and Performance IQ of at least 85; no English as second language, extreme hyperactivity, hearing impairment, brain damage, a chronic medical condition or serious emotional disturbance, attention deficits; age between 7 and 13 years Recruits: 166 reading disabled children (113 boys, 53 girls). Mean IQ on WISC‐3 or WISC‐R: Verbal IQ M = 92, SD = 13.7, Performance IQ M = 98.7, SD = 14.3. Mean age 9.9 (SD 1.6 years). On average, sample was more than 2 SD below age‐norm expectations at referral, with half of the children consistently below the first percentile for age on standardised achievement measures. Of these 166, 84.3% of the sample (140 participants) could be classified into 1 of 3 subgroups: 54.3% double deficit, 22.1% phonological deficit, 23.6% visual naming‐speed deficit Allocation: the 140 children randomly assigned to 1 of 3 treatments: PhAB training; WIST Program (not relevant to this review); and CSS (controls). In this review, the PhAB trainees are the intervention group and the controls are the control group Intervention group: N = 51 Control group: N = 37 | |
| Interventions | Intervention: PhAB skills were trained with oral and written presentations of letter‐sound and letter‐cluster‐sound correspondences. Word segmenting and blending, sound segmentation and blending, rhyming. Special orthography used (based on Engelmann and colleagues) to teach letter sounds: "the special orthography is a temporary convention used to highlight salient features of some letters; it provides visual cues to the child with RD such as symbols over long vowels (macrons), letter size variation, and connected letters to facilitate initial learning" (p. 337) Control: the CSS Program taught organisational strategies, academic problem solving, study and self‐help techniques. Children in the CSS programme received the same amount of individualised teacher attention as did children in the remedial reading programmes Procedure: children received 35 hours of instruction (1‐hour sessions, 4 times per week) on a two‐to‐one or three‐to‐one ratio in special laboratory classrooms at a paediatric teaching hospital or in affiliated schools in the Toronto metropolitan area | |
| Outcomes | Time of post‐test: immediately after training completed Relevant measures: nonword reading accuracy (WJRMT: Word Attack subtest), regular word reading accuracy (experimental: 149 untrained regular words), irregular word reading accuracy (experimental: 149 untrained exception words), and phoneme awareness (GFW Sound Symbol Tests: Sound Analysis subtest) | |
| Notes | 1. Contacted Frijters (4/10/2011) about means and SDs for reading measures from each of the 3 training conditions. We received an Excel file with means and SDs. 2. Asked whether there was an overlap in participants across 1994, 1997, and 2000 papers published by their laboratory (N = 62 in 1994 paper, N = 122 in 1997 paper, and N = 166 in 2000 paper). It was confirmed that there was an overlap in participants between the papers. We therefore decided to only include the 2000 paper for this Cochrane review to limit any over representation of the data in the final meta‐analysis 3. The second intervention group did the WIST Program. The WIST contained more than 2 training components (word identification by analogy, seeking the part of the word that you know, attempting variable vowel pronunciations, 'peeling off' prefixes and suffixes in an multi‐syllabic word) and so was not included in the review 4. Two measures tested Reading Accuracy: nonwords (GFW: Reading of Symbols and WJRMT‐R: Word Attack). We included the WJRMT‐R as it is a very widely used test with known reliability 5. There were multiple measures of phoneme awareness. We selected GFW sound analysis because it was well matched between groups before training | |
| Risk of bias | ||
| Bias | Authors' judgement | Support for judgement |
| Random sequence generation (selection bias) | Low risk | Quote from publication: "the experimental design in which the original 166 children participated involved random assignment to one of three active treatment programs" Quote from personal communication: "children were matched on decoding ability and then random number tables were used to random assign treatment to pair and to assign teacher to pair" Communication: Best described as matching with randomisation. |
| Allocation concealment (selection bias) | Low risk | Quote from personal communication: "the PI assigned treatments and teachers to child pair based on participant identity alone. Neither children nor teachers would have had contact with the person doing the assignment, as all contact prior to this point was with study psychometrists". |
| Blinding of participants and personnel (performance bias) | High risk | Quote from publication: "sessions were taught by trained special education teachers who taught in all programs to minimize the potential for teacher by program delivery bias" Quote from personal communication: "since this is a verbally‐administered intervention with quite explicit and structured content, and teachers were trained on the materials used, teachers could not be blind to the particular treatment they were teaching. Participants were not told what their assignments were, but on consent forms were told that they would participate in one of three conditions, with all conditions described. Teachers did not reveal condition to participants" |
| Blinding of outcome assessment (detection bias) | Unclear risk | Quote from personal communication: "all standardized/norm referenced assessments were administered by trained psychometrists who were blind to assignment; however, some content‐related and experimental measures (e.g., the four word lists) were administered by teachers themselves at the pre‐specified testing intervals. In the former case, psychometrists would have had the participants name and testing folder alone, not the master subject‐list" Comment: We used data from both experimental and normed tests and so risk is unclear |
| Incomplete outcome data (attrition bias) | Low risk | Extra data provided by author revealed that the data of all randomised participants was included in the analyses |
| Selective reporting (reporting bias) | Low risk | Data reported for all outcome measures outlined in methods; adequate detail for data to be included in analysis |
| Other bias | Low risk | None apparent |
| Methods | Randomised controlled trial Three intervention groups (all phonics + phonological awareness) and 1 control group (untrained) | |
| Participants | Criteria: the 108 Year 1 children across 9 schools with the lowest scores on screening tests for phonological awareness (nursery rhymes, rhyme matching, rhyme generation, blending, segmentation) and reading (nonsense word reading, word reading and spelling, letter‐sound knowledge); English speaking Recruits: 108 English‐speaking readers in Year 1 were selected (64 boys and 44 girls) Allocation: "within each school, children were allocated to an intervention condition (usually nine children) or to a control condition (usually three children)" (p. 219) Personal communication: ''this was done using an (online) random number generator set with parameters 1‐4, for each school allowing placing into each of the interventions...Child‐level allocation to intervention versus control within each school was again undertaken using random number generator" Intervention group: N = 81 Control group: N = 27 | |
| Interventions | Intervention: "in each session, all children started with letter‐sound learning activities using a range of multi‐sensory approaches (for example, saying, looking, tracing) to learn letter sounds supported by the Jolly Phonics stories and actions." (p. 53); and "principles of segmenting and blending with a limited number of sounds." (p. 53). This was followed by 10‐minutes of training on phonemes (for the phoneme training group), for rhymes (for the rhyme training group) or for both (for the mixed training group). This in turn was followed by 5 minutes of phonological awareness training: "games tailored to phonemes or rhymes respectively" (p. 53). From this point in each session, the training varied between intervention groups. The phoneme training group trained with SoundWorks: (1) an 'a‐board', (2) writing on lines (with 'slips' and 'foldovers': cards with vowel markers or spaces to write vowels), (3) 'spelling from your head', (4) 'read the word', and (5) 'sound it out' with an adult. The rhyme training group practiced rhymes with plastic letters along with writing words, simple word searches, using onset rhyme 'word fans', sorting words into '‐an' and '‐at' groups and using onset sound frames (depicted as elements in a picture of a caterpillar's body). The mixed training group did a mixture of the two interventions above along with analysing words using their phonemic elements (for example, 'at' made up of 'a' and 't') and using phonemes and rhymes in word building Control: "children remained in class and undertook the word‐level work appropriate to the second term of Year 1 of the National Literacy Strategy in their normal fashion" (p. 55) Procedure: learning support assistants conducted training in small groups (typically 4 children per group‐as per email from Savage). 20‐minute sessions, 4 times a week, for a period of 9 weeks at school | |
| Outcomes | Time of post‐test: not stated explicitly but appears to be immediate Relevant measures: nonword reading accuracy (experimental: high rhyme nonwords and low rhyme nonwords), regular word reading accuracy (experimental: 6 regular words), regular word spelling (experimental: 6 regular words), letter‐sound knowledge (experimental: "two sets of cards each containing 13 of the 26 letters of the alphabet presented one letter per card" (p. 218) and phoneme awareness (experimental: onset‐rhyme segmentation) | |
| Notes | 1. Similar design to Savage, Carless and Stuart (2003) but done on a new sample of the same size (personal communication from Robert Savage 30/11/2011) 2. Contacted Savage about 1. drop‐outs (24/01/2012): 4 drop‐outs, 1 from each group; 2. training group size (11/02/2012): typically 4 in each training group 3. Since the 3 intervention groups all consisted of phonics and phonological awareness training, we have used the combined mean scores (and SDs) at pre‐ and post‐tests (see Table 3, p. 222) 4. There were 2 tests used to measure Reading Accuracy: nonwords (high rime nonwords and low rime nonwords). These 2 tests were averaged 5. Three tests were used to measure phoneme awareness (1. rime matching, 2. onset‐rime segmentation, 3. phoneme segmentation). We included the onset‐rime segmentation as its intervention and control pre‐test scores had the best match | |
| Risk of bias | ||
| Bias | Authors' judgement | Support for judgement |
| Random sequence generation (selection bias) | Low risk | Quote from publications: "within each school, children were allocated to an intervention condition (usually nine children) or to a control condition (usually three children). Schools themselves decided on the precise composition of each of the subgroups of three to four children who went together with an LSA for each intervention session based upon their knowledge of the children's social networks, so intervention groups varied slightly in size across schools" Quote from personal communication: "this was done using an (online) random number generator set with parameters 1‐4, for each school allowing placing into each of the interventions. Schools decided on suitability of children for intervention (as we note on page 219), though only 1 child was removed on teacher request. Child‐level allocation to intervention versus control within each school was again undertaken using random number generator. However schools decided the precise composition of (the already selected) intervention child groups to create groups of children who got on well" Quote from further personal communication: "the allocation was random at school and student‐level. The composition of small groups of children WITHIN the allocated random conditions was (and I recall, was very occasionally) adjusted only on the suggestion of classroom teachers to make the groups more functional at the social level (an e.g. I recall is a particular group of 4 randomly‐allocated kids which included 3 'noisy' boys and a very shy girl), thus we might move the groups a bit for the delivery of the intervention. The initial randomisation was always respected. It was to avoid major problems that we would do this rather than to find groups who particularly got on, hence it was rare this happened. The key point is that the initial randomizations of condition was always intact, the grouping for the purpose of intervention delivery was occasionally adjusted" |
| Allocation concealment (selection bias) | Low risk | Quote from personal communication: "I did this allocation independent of those running the study and of co‐author(s) Carless and Stuart. Carless led the Teacher Assistant (TA) training, so I judge allocation to be concealed, and not possible to predict" |
| Blinding of participants and personnel (performance bias) | High risk | Quote from publication: ''teachers were told who the control children and intervention children were, and were also reinforced at training and during the intervention to treat the control children in the same way as they would if no intervention was taking place for other children" Quote from personal communication: "the TAs delivered [the training] based on sub‐lexical phonological unit taught (rimes or phonemes) and this content is quite visible in the ‘treatment’ (no equivalent to a pill or placebo an option here). The one aspect that was blind was that we emphasized to TAs and all other school staff that each of the interventions (rime phoneme or mixed) was a proven evidence–based intervention, so we cast it as 3‐horse race between them (with no favoured intervention) at all times, and emphasized the need for a ‘fair‐test’ of each. TAs understood this. At the participant end, these are 6 years olds in both studies. They simply knew they were in an intervention (intervention condition children only of course) or receiving regular classroom teaching (control group children)" |
| Blinding of outcome assessment (detection bias) | Unclear risk | Quote from personal communication: 'Pre‐testing was undertaken as a screen of all children in schools before we identified and allocated the ‘at‐risk readers’, (se Consort flow diagrams in both papers) so in this sense it is entirely blind'. 'There was no blinding of post‐testing in relation to the intervention condition as TAs did both (though see comments above on the 3 horse race). However classroom assistants also did not know of the theoretical contrasts (and they were definitely blind to the status of the high‐rime and low‐rime nonwords in the 2003 study as these were randomised as a set of 12 items for pre‐testing and post‐testing). TAs were not told at any point of any research predictions regarding the relationship between intervention and outcome (e.g. hypothesis of possible link between phoneme‐based intervention and raise phoneme awareness at post‐test, and similar for rimes etc)'. Comment: Although testers were blind to intervention that was supposed to have superior effect, and were educated about the importance of bias, they were not blind to whether the child had done training or not at post‐test. Thus, it is not clear how much bias was related to the outcomes assessment. |
| Incomplete outcome data (attrition bias) | Low risk | Comment: Across all intervention groups, only four participants dropped out. We confirmed with the author that there were equal dropouts in each group (N=1). Thus both groups experienced the same (relatively low) drop‐out rate. |
| Selective reporting (reporting bias) | Low risk | Comment: Data reported for all outcome measures outlined in methods; adequate detail for data to be included in analysis. |
| Other bias | Low risk | Comment: None apparent. |
| Methods | Randomised controlled trial Three intervention groups (all phonics + phonological awareness) and 1 control group (untrained) | |
| Participants | Criteria: the 108 Year 1 children across 9 schools with the lowest scores on screening tests for phonological awareness (nursery rhymes, rhyme matching, rhyme generation, blending, segmentation) and reading (nonsense word reading, word reading and spelling, letter‐sound knowledge); English speaking Recruits: 108 English‐speaking readers in Year 1 were selected (54 boys and 54 girls) Allocation: the same as Savage 2003. That is random allocation of schools to 1 of 4 groups: 3 intervention groups (1 doing phoneme training, 1 doing rhyme training, and 1 doing a mix of both) and 1 control group (untrained). And then random allocation of children to treatment and control groups within schools. Since the 3 interventions trained phonics and phonological awareness, their data were merged for the Intervention group Intervention group: N = 81 Control group: N = 27 | |
| Interventions | Intervention: "In each session, all children started with letter‐sound learning activities using a range of multi‐sensory approaches (for example, saying, looking, tracing) to learn letter sounds supported by the Jolly Phonics stories and actions." (p. 53); and "principles of segmenting and blending with a limited number of sounds" (p. 53). This was followed by 10‐minutes of training on phonemes (for the phoneme training group), for rhymes (for the rhyme training group) or for both (for the mixed training group). This in turn was followed by 5 minutes of phonological awareness training: "games tailored to phonemes or rhymes respectively" (p. 53). From this point in each session, the training varied between intervention groups. The phoneme training group trained with SoundWorks: (1) an 'a‐board', (2) writing on lines (with 'slips' and 'foldovers': cards with vowel markers or spaces to write vowels), (3) 'spelling from your head', (4) 'read the word', and (5) 'sound it out' with an adult. The rhyme training group practiced rhymes with plastic letters along with writing words, simple word searches, using onset rhyme 'word fans', sorting words into '‐an' and '‐at' groups and using onset sound frames (depicted as elements in a picture of a caterpillar's body). The mixed training group did a mixture of the 2 interventions above along with analysing words using their phonemic elements (for example, 'at' made up of 'a' and 't') and using phonemes and rhymes in word building. Control: "children remained in class and undertook the word‐level work appropriate to the second term of Year 1 of the National Literacy Strategy in their normal fashion" (p. 55) Procedure: learning support assistants conducted training in small groups (typically 4 children per group ‐ as per email from Savage). 20‐minute sessions, 4 times a week, for a period of 9 weeks at school | |
| Outcomes | Time of post‐test: the week after training was completed. Relevant measures: letter‐sound knowledge (experimental: "cards with 26 individual letters on them" (p. 51) and phoneme awareness (experimental: nursery rhymes, rhyme matching, rhyme generation, blending and segmentation; see note 2 below) | |
| Notes | 1. Contacted Savage (24/01/2012) about what measured 1) phonological awareness, 2) letter sounds, 3) decoding and training group sizes (11/02/2012). Replied that phonological awareness was measured by nursery rhymes, rhyme matching, rhyme generation, blending and segmentation; letter sounds was measured by 1 experimental test; and decoding skills was measured by nonsense word reading, word reading and spelling, and letter‐sound knowledge. We asked for the individual scores for each of these tests however he only had combined scores. Finally, training groups typically had 4 children each 2. The combined score for phonological awareness was used in our analysis 3. We did not use the decoding skills measure | |
| Risk of bias | ||
| Bias | Authors' judgement | Support for judgement |
| Random sequence generation (selection bias) | Low risk | Quote from publication: "a quasi‐random allocation of schools to programs was undertaken: four schools whose catchment areas were known to draw primarily from lower SES backgrounds were each allocated to separate intervention groups. After that, for the other schools the allocation was entirely arbitrary". "Children were, however, entirely arbitrarily allocated to an intervention condition (nine children) or to a control condition (three children)". "As the allocation of children to intervention condition was not entirely arbitrary, but contained a systematic element..." Quote from personal communication: "The same [as the 2003 study] except that 4 schools of known low socio‐economic status were each first randomly allocated to one of the 4 groups first, using a random number generator. Then the process was repeated as above for all remaining schools. Child‐level allocation was again undertaken using random number generator" |
| Allocation concealment (selection bias) | Low risk | Quote from personal communication: "I did this allocation independent of those running the study and of co‐author(s) Carless and Stuart. Carless led the Teacher Assistant (TA) training, so I judge allocation to be concealed, and not possible to predict" |
| Blinding of participants and personnel (performance bias) | High risk | Quote from publication: ''teachers were told who the control children and intervention children were, and were also reinforced at training and during the intervention to treat the control children in the same way as they would if no intervention was taking place for other children" Quote from personal communication: "The TAs delivered [the training] based on sub‐lexical phonological unit taught (rimes or phonemes) and this content is quite visible in the ‘treatment’ (no equivalent to a pill or placebo an option here). The one aspect that was blind was that we emphasized to TAs and all other school staff that each of the interventions (rime phoneme or mixed) was a proven evidence–based intervention, so we cast it as 3‐horse race between them (with no favoured intervention) at all times, and emphasized the need for a 'fair‐test' of each. TAs understood this. At the participant end, these are 6 years olds in both studies. They simply knew they were in an intervention (intervention condition children only of course) or receiving regular classroom teaching (control group children)" |
| Blinding of outcome assessment (detection bias) | Unclear risk | Quote from personal communication: 'Pre‐testing was undertaken as a screen of all children in schools before we identified and allocated the ‘at‐risk readers’, (se Consort flow diagrams in both papers) so in this sense it is entirely blind'. 'There was no blinding of post‐testing in relation to the intervention condition as TAs did both (though see comments above on the 3 horse race). However classroom assistants also did not know of the theoretical contrasts .... TAs were not told at any point of any research predictions regarding the relationship between intervention and outcome (e.g. hypothesis of possible link between phoneme‐based intervention and raise phoneme awareness at post‐test, and similar for rimes etc)'. Comment: Although testers were blind to intervention that was supposed to have superior effect, and were educated about the importance of bias, they were not blind to whether the child had done training or not. Thus, it is not clear how much bias was related to the outcomes assessment, which was not blind. |
| Incomplete outcome data (attrition bias) | Low risk | Quote: "One child per intervention group was unavailable, having moved away from the LEA in the interim between pre‐ and post‐test". Comment: Both groups experienced the same (relatively low) drop‐out rate. |
| Selective reporting (reporting bias) | Low risk | Comment: Data reported for all outcome measures outlined in methods; adequate detail for data to be included in analysis. |
| Other bias | Low risk | Comment: None apparent. |
BAS: British Ability Scales; CSS: Classroom Survival Skills; FSIQ: Full Scale IQ; GFW: Goldman‐Fristoe‐Woodcock; IQ: intelligence quotient; PhAB: phonological analysis and blending; PI: principal investigator; RAN: rapid automatised naming; SD; standard deviation; SES: socioeconomic status; TOWRE: Test of Word Reading Efficiency; WIAT‐II: Wechsler Individual Achievement Test Second Edition; WIST: Word Identification Strategy Training; WJRMT: Woodcock‐Johnson Reading Mastery Test; WJTA‐III: Woodcock‐Johnson Test of Achievement III; WRAT‐R: Wide Range Achievement Test; WRMT‐R: Woodcock Reading Mastery Test‐Revised.
Characteristics of excluded studies [ordered by study ID]
| Study | Reason for exclusion |
| Did not include control group | |
| Training did not match this review's criteria for phonics training | |
| Training did not match this review's criteria for phonics training | |
| Training did not match this review's criteria for phonics training | |
| Group allocation did not use randomisation, quasi‐randomisation, or minimisation | |
| A follow‐up study of children in Gillon 2000, which did not use randomisation, quasi‐randomisation, or minimisation for group allocation. | |
| Training did not match this review's criteria for phonics training | |
| Training and control group did not match this review's criteria for phonics training | |
| Training did not match this review's criteria for phonics training | |
| Training did not match this review's criteria for phonics training | |
| Participants with dyslexia had neurological impairments (that is, did not meet this review's criteria for participants) | |
| Training did not match this review's criteria for phonics training | |
| A review paper | |
| Training did not match this review's criteria for phonics training | |
| Training did not match this review's criteria for phonics training | |
| Missing pre‐test data for reading outcomes (pre‐tests in Table 1 are non‐reading measures). We requested data from first author twice, but did not receive a reply. The second author said only the first author had the data | |
| Training did not match this review's criteria for phonics training | |
| No control group and training did not match this review's criteria for phonics training | |
| Training did not match this review's criteria for phonics training | |
| Training did not match this review's criteria for phonics training. | |
| Training did not match this review's criteria for phonics training | |
| Training did not match this review's criteria for phonics training | |
| No control group and training did not match this review's criteria for phonics training | |
| Training did not match this review's criteria for phonics training | |
| Training did not match this review's criteria for phonics training | |
| No control group and training did not match this review's criteria for phonics training |
Characteristics of studies awaiting assessment [ordered by study ID]
| Methods | |
| Participants | |
| Interventions | |
| Outcomes | |
| Notes | Contacted for unpublished thesis, but received an automated reply that author was on maternity leave for 6 months. We will consider for update of review. |
SLI: spoken language impairment
Characteristics of ongoing studies [ordered by study ID]
| Trial name or title | Phonics and sight word training in children with dyslexia |
| Methods | Quasi‐randomised trial There are 3 treatment groups. The first group is given 8 weeks of phonics training and then 8 weeks of sight‐word training (phonics + sight‐word group). The second group is given the same training but in reverse order (sight‐word + phonics group). The third group is given phonics and sight‐word training on alternate days (mixed group). Outcomes are tested after (1) a test‐re‐test period, (2) after the first 8 weeks of training, and (3) after 16 weeks of training |
| Participants | Children with dyslexia, aged 7 to 12 years |
| Interventions | Computerised phonics training (phonics) and computerised and human irregular word training (sight word training) |
| Outcomes | Tests of (1) trained and untrained irregular word reading accuracy and spelling; (2) nonword reading accuracy, fluency, and spelling; and (3) reading fluency and reading comprehension |
| Starting date | 2008 |
| Contact information | Professor Genevieve McArthur Department of Cognitive Science ARC Centre of Cognition and its Disorders Macquarie University NSW 2109 Australia |
| Notes | Outcomes should be peer reviewed and published in mid‐ to late 2012 |
Data and analyses
| Outcome or subgroup title | No. of studies | No. of participants | Statistical method | Effect size |
| 1 Word reading accuracy Show forest plot | 10 | 683 | Std. Mean Difference (IV, Random, 95% CI) | 0.47 [0.06, 0.88] |
| Analysis 1.1  Comparison 1 Phonics training versus control (random‐effects), Outcome 1 Word reading accuracy. | ||||
| 2 Nonword reading accuracy Show forest plot | 8 | 512 | Std. Mean Difference (IV, Random, 95% CI) | 0.76 [0.25, 1.27] |
| Analysis 1.2  Comparison 1 Phonics training versus control (random‐effects), Outcome 2 Nonword reading accuracy. | ||||
| 3 Word reading fluency Show forest plot | 2 | 54 | Std. Mean Difference (IV, Random, 95% CI) | ‐0.51 [‐1.14, 0.13] |
| Analysis 1.3  Comparison 1 Phonics training versus control (random‐effects), Outcome 3 Word reading fluency. | ||||
| 4 Nonword reading fluency Show forest plot | 1 | 18 | Std. Mean Difference (IV, Random, 95% CI) | 0.38 [‐0.55, 1.32] |
| Analysis 1.4  Comparison 1 Phonics training versus control (random‐effects), Outcome 4 Nonword reading fluency. | ||||
| 5 Reading comprehension Show forest plot | 3 | 173 | Std. Mean Difference (IV, Random, 95% CI) | 0.14 [‐0.46, 0.74] |
| Analysis 1.5  Comparison 1 Phonics training versus control (random‐effects), Outcome 5 Reading comprehension. | ||||
| 6 Spelling Show forest plot | 2 | 140 | Std. Mean Difference (IV, Random, 95% CI) | 0.36 [‐0.27, 1.00] |
| Analysis 1.6  Comparison 1 Phonics training versus control (random‐effects), Outcome 6 Spelling. | ||||
| 7 Letter‐sound knowledge Show forest plot | 3 | 192 | Std. Mean Difference (IV, Random, 95% CI) | 0.35 [0.04, 0.65] |
| Analysis 1.7  Comparison 1 Phonics training versus control (random‐effects), Outcome 7 Letter‐sound knowledge. | ||||
| 8 Phonological output Show forest plot | 4 | 280 | Std. Mean Difference (IV, Random, 95% CI) | 0.38 [‐0.04, 0.80] |
| Analysis 1.8  Comparison 1 Phonics training versus control (random‐effects), Outcome 8 Phonological output. | ||||
| Outcome or subgroup title | No. of studies | No. of participants | Statistical method | Effect size |
| 1 Word reading accuracy Show forest plot | 10 | Std. Mean Difference (IV, Random, 95% CI) | Subtotals only | |
| Analysis 2.1  Comparison 2 Phonics training versus control ‐ subgroups (random‐effects), Outcome 1 Word reading accuracy. | ||||
| 1.1 Training type: phonics only | 3 | 232 | Std. Mean Difference (IV, Random, 95% CI) | 0.91 [‐0.17, 1.98] |
| 1.2 Training type: phonics + phoneme awareness | 6 | 415 | Std. Mean Difference (IV, Random, 95% CI) | 0.28 [0.00, 0.56] |
| 1.3 Training intensity: < 2 hours/week | 8 | 559 | Std. Mean Difference (IV, Random, 95% CI) | 0.48 [‐0.04, 1.00] |
| 1.4 Training intensity: ≥ 2 hours/week | 2 | 124 | Std. Mean Difference (IV, Random, 95% CI) | 0.34 [‐0.03, 0.72] |
| 1.5 Training duration: < 3 months | 8 | 498 | Std. Mean Difference (IV, Random, 95% CI) | 0.56 [0.07, 1.04] |
| 1.6 Training duration: ≥ 3 months | 2 | 185 | Std. Mean Difference (IV, Random, 95% CI) | 0.12 [‐0.43, 0.67] |
| 1.7 Training group size: 1 | 6 | 419 | Std. Mean Difference (IV, Random, 95% CI) | 0.62 [‐0.06, 1.29] |
| 1.8 Training group size: ≤ 5 | 4 | 264 | Std. Mean Difference (IV, Random, 95% CI) | 0.25 [‐0.04, 0.54] |
| 1.9 Training administrator: human | 6 | 559 | Std. Mean Difference (IV, Random, 95% CI) | 0.66 [0.08, 1.23] |
| 1.10 Training administrator: computer | 4 | 124 | Std. Mean Difference (IV, Random, 95% CI) | 0.15 [‐0.20, 0.51] |
| 2 Nonword reading accuracy Show forest plot | 8 | 1536 | Std. Mean Difference (IV, Random, 95% CI) | 0.76 [0.48, 1.04] |
| Analysis 2.2  Comparison 2 Phonics training versus control ‐ subgroups (random‐effects), Outcome 2 Nonword reading accuracy. | ||||
| 2.1 Training type: phonics only | 3 | 232 | Std. Mean Difference (IV, Random, 95% CI) | 0.91 [‐0.45, 2.28] |
| 2.2 Training type: phonics + phoneme awareness | 5 | 280 | Std. Mean Difference (IV, Random, 95% CI) | 0.63 [0.38, 0.88] |
| 2.3 Training group size: 1 | 5 | 284 | Std. Mean Difference (IV, Random, 95% CI) | 1.06 [0.39, 1.73] |
| 2.4 Training group size: ≤ 5 | 3 | 228 | Std. Mean Difference (IV, Random, 95% CI) | 0.32 [‐0.32, 0.96] |
| 2.5 Training administrator: human | 4 | 388 | Std. Mean Difference (IV, Random, 95% CI) | 1.12 [0.48, 1.76] |
| 2.6 Training administrator: computer | 4 | 124 | Std. Mean Difference (IV, Random, 95% CI) | 0.31 [‐0.33, 0.96] |
| Outcome or subgroup title | No. of studies | No. of participants | Statistical method | Effect size |
| 1 Word reading accuracy Show forest plot | 10 | 683 | Std. Mean Difference (IV, Fixed, 95% CI) | 0.46 [0.29, 0.62] |
| Analysis 3.1  Comparison 3 Phonics training versus control (fixed‐effect), Outcome 1 Word reading accuracy. | ||||
| 2 Nonword reading accuracy Show forest plot | 8 | 512 | Std. Mean Difference (IV, Fixed, 95% CI) | 0.82 [0.62, 1.01] |
| Analysis 3.2  Comparison 3 Phonics training versus control (fixed‐effect), Outcome 2 Nonword reading accuracy. | ||||
| 3 Word reading fluency Show forest plot | 2 | 54 | Std. Mean Difference (IV, Fixed, 95% CI) | ‐0.53 [‐1.08, 0.02] |
| Analysis 3.3  Comparison 3 Phonics training versus control (fixed‐effect), Outcome 3 Word reading fluency. | ||||
| 4 Nonword reading fluency Show forest plot | 1 | 18 | Std. Mean Difference (IV, Fixed, 95% CI) | 0.38 [‐0.55, 1.32] |
| Analysis 3.4  Comparison 3 Phonics training versus control (fixed‐effect), Outcome 4 Nonword reading fluency. | ||||
| 5 Reading comprehension Show forest plot | 3 | 173 | Std. Mean Difference (IV, Fixed, 95% CI) | 0.01 [‐0.31, 0.32] |
| Analysis 3.5  Comparison 3 Phonics training versus control (fixed‐effect), Outcome 5 Reading comprehension. | ||||
| 6 Spelling Show forest plot | 2 | 140 | Std. Mean Difference (IV, Fixed, 95% CI) | 0.28 [‐0.09, 0.65] |
| Analysis 3.6  Comparison 3 Phonics training versus control (fixed‐effect), Outcome 6 Spelling. | ||||
| 7 Letter‐sound knowledge Show forest plot | 3 | 192 | Std. Mean Difference (IV, Fixed, 95% CI) | 0.35 [0.04, 0.65] |
| Analysis 3.7  Comparison 3 Phonics training versus control (fixed‐effect), Outcome 7 Letter‐sound knowledge. | ||||
| 8 Phonological output Show forest plot | 4 | 280 | Std. Mean Difference (IV, Fixed, 95% CI) | 0.44 [0.19, 0.70] |
| Analysis 3.8  Comparison 3 Phonics training versus control (fixed‐effect), Outcome 8 Phonological output. | ||||
| Outcome or subgroup title | No. of studies | No. of participants | Statistical method | Effect size |
| 1 Word reading accuracy Show forest plot | 9 | 633 | Std. Mean Difference (IV, Random, 95% CI) | 0.47 [0.01, 0.93] |
| Analysis 4.1  Comparison 4 Phonics training versus control sensitivity analysis with Hurford 1994 removed (random‐effects), Outcome 1 Word reading accuracy. | ||||
| 2 Nonword reading accuracy Show forest plot | 7 | 462 | Std. Mean Difference (IV, Random, 95% CI) | 0.80 [0.22, 1.38] |
| Analysis 4.2  Comparison 4 Phonics training versus control sensitivity analysis with Hurford 1994 removed (random‐effects), Outcome 2 Nonword reading accuracy. | ||||
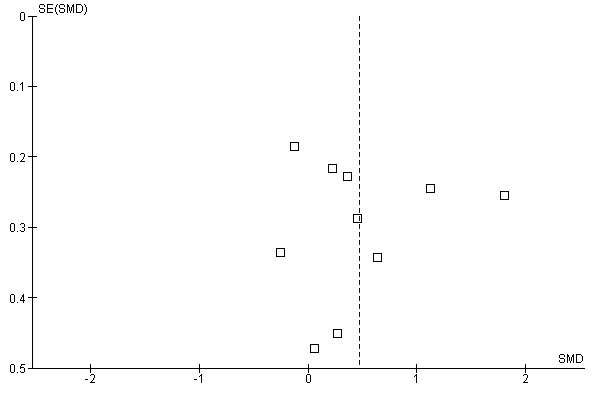
Funnel plot of comparison: 1 Treatment versus control random‐effects model, outcome: 1.1 Word reading accuracy

Study flow diagram

Risk of bias summary: review authors' judgements about each risk of bias item for each included study
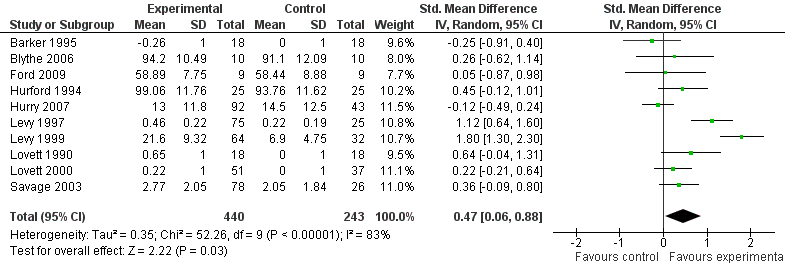
Forest plot of comparison: 1 Treatment versus control random‐effects model, outcome: 1.1 Word reading accuracy
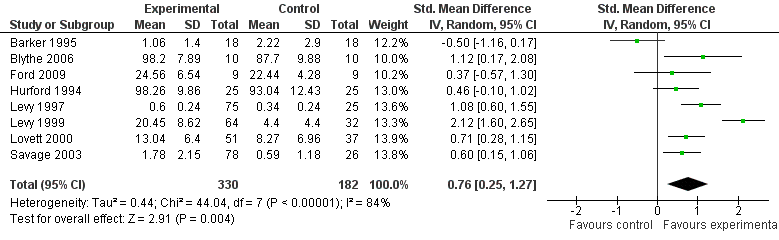
Forest plot of comparison: 1 Treatment versus control random‐effects model, outcome: 1.2 Nonword reading accuracy
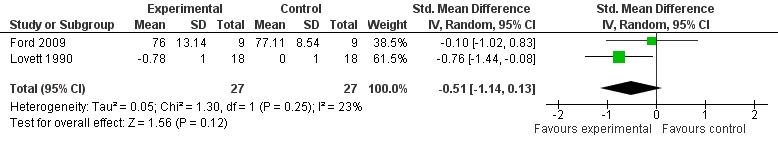
Forest plot of comparison: 1 Treatment versus control random‐effects model, outcome: 1.3 Word reading fluency

Forest plot of comparison: 1 Treatment versus control random‐effects model, outcome: 1.4 Nonword reading fluency

Forest plot of comparison: 1 Treatment versus control random‐effects model, outcome: 1.5 Reading comprehension
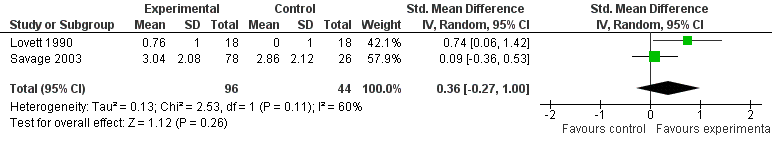
Forest plot of comparison: 1 Treatment versus control random‐effects model, outcome: 1.6 Spelling

Forest plot of comparison: 1 Treatment versus control random‐effects model, outcome: 1.7 Letter‐sound knowledge
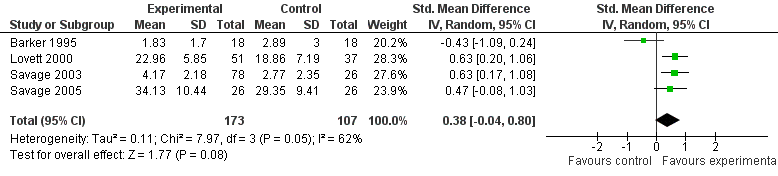
Forest plot of comparison: 1 Treatment versus control random‐effects model, outcome: 1.8 Phonological output

Comparison 1 Phonics training versus control (random‐effects), Outcome 1 Word reading accuracy.
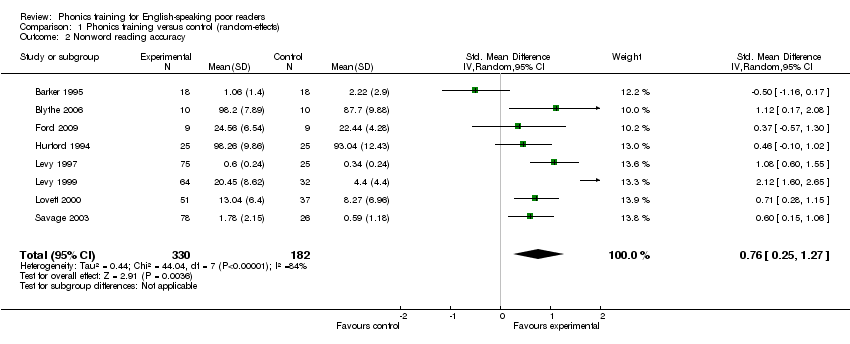
Comparison 1 Phonics training versus control (random‐effects), Outcome 2 Nonword reading accuracy.
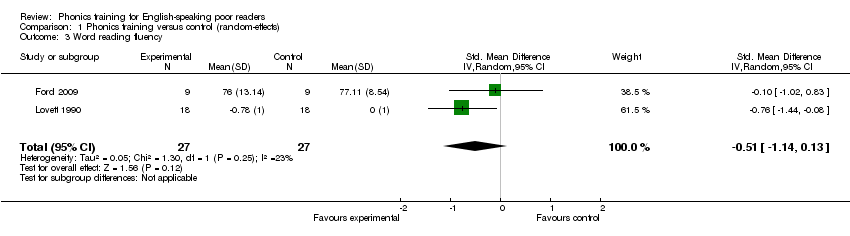
Comparison 1 Phonics training versus control (random‐effects), Outcome 3 Word reading fluency.
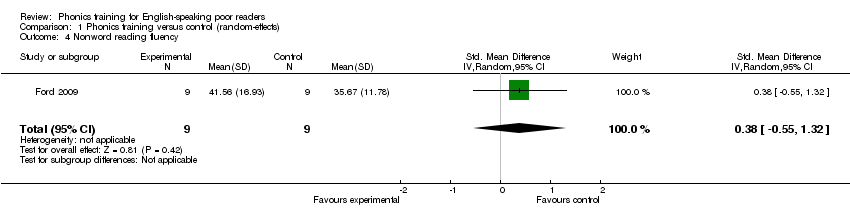
Comparison 1 Phonics training versus control (random‐effects), Outcome 4 Nonword reading fluency.
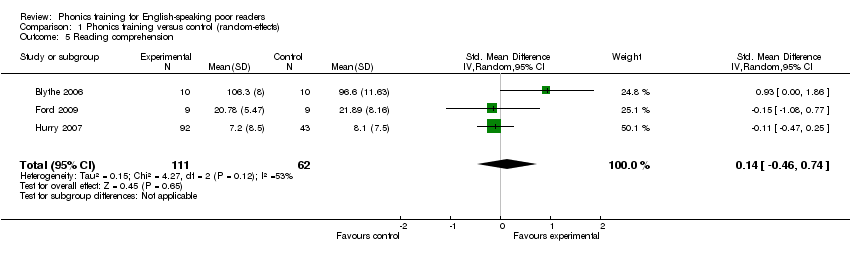
Comparison 1 Phonics training versus control (random‐effects), Outcome 5 Reading comprehension.
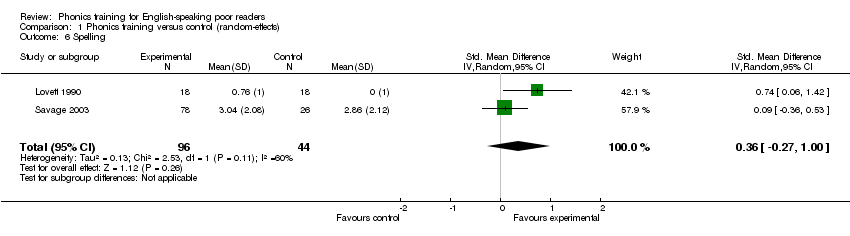
Comparison 1 Phonics training versus control (random‐effects), Outcome 6 Spelling.

Comparison 1 Phonics training versus control (random‐effects), Outcome 7 Letter‐sound knowledge.
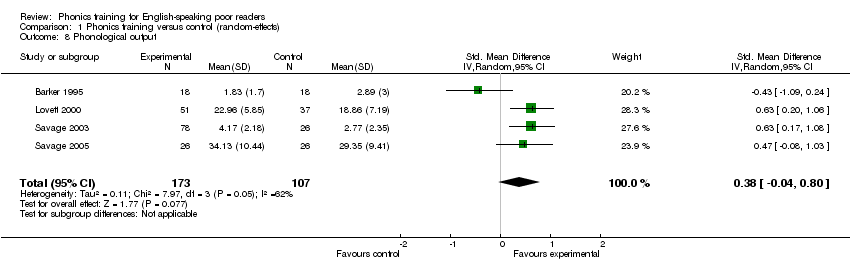
Comparison 1 Phonics training versus control (random‐effects), Outcome 8 Phonological output.

Comparison 2 Phonics training versus control ‐ subgroups (random‐effects), Outcome 1 Word reading accuracy.

Comparison 2 Phonics training versus control ‐ subgroups (random‐effects), Outcome 2 Nonword reading accuracy.

Comparison 3 Phonics training versus control (fixed‐effect), Outcome 1 Word reading accuracy.
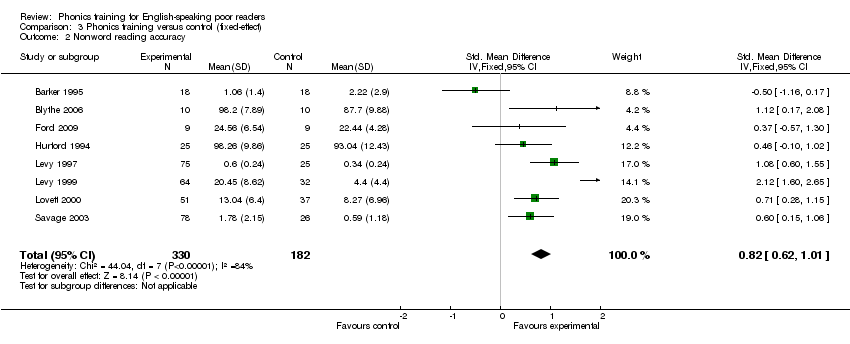
Comparison 3 Phonics training versus control (fixed‐effect), Outcome 2 Nonword reading accuracy.

Comparison 3 Phonics training versus control (fixed‐effect), Outcome 3 Word reading fluency.

Comparison 3 Phonics training versus control (fixed‐effect), Outcome 4 Nonword reading fluency.

Comparison 3 Phonics training versus control (fixed‐effect), Outcome 5 Reading comprehension.
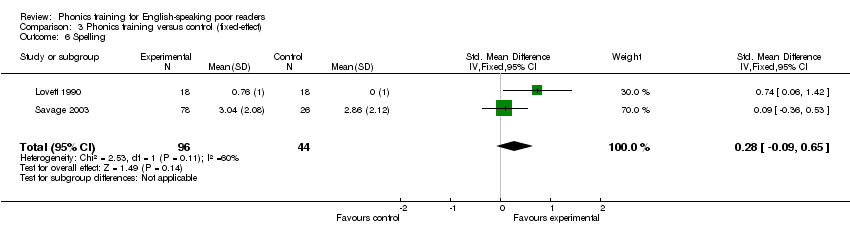
Comparison 3 Phonics training versus control (fixed‐effect), Outcome 6 Spelling.

Comparison 3 Phonics training versus control (fixed‐effect), Outcome 7 Letter‐sound knowledge.

Comparison 3 Phonics training versus control (fixed‐effect), Outcome 8 Phonological output.
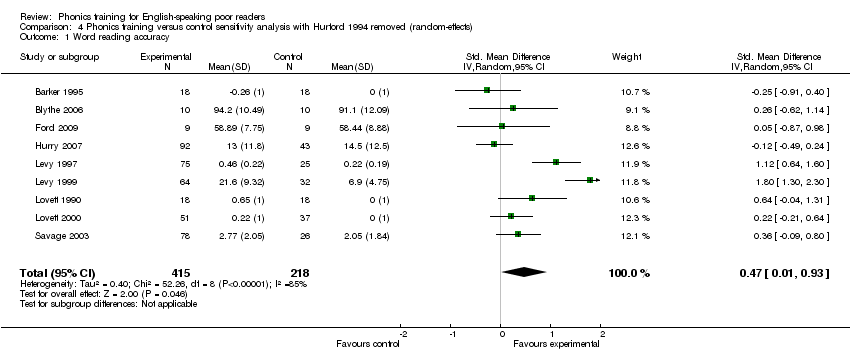
Comparison 4 Phonics training versus control sensitivity analysis with Hurford 1994 removed (random‐effects), Outcome 1 Word reading accuracy.

Comparison 4 Phonics training versus control sensitivity analysis with Hurford 1994 removed (random‐effects), Outcome 2 Nonword reading accuracy.
| Phonics training compared with control (no training or alternative training) for English‐speaking poor readers | ||||||
| Patient or population: English‐speaking poor readers Setting: English‐speaking countries Intervention: phonics Comparison: no training or alternative training | ||||||
| Outcomes | Illustrative comparative risks* (95% CI) | Relative effect | No of participants | Quality of the evidence | Comments * | |
| Assumed risk | Corresponding risk | |||||
| No training or alternative training | English‐speaking poor readers | |||||
| Word reading accuracy Immediate follow‐up | The mean score in the intervention groups was on average 0.47 SD better1 (95% CI 0.06 to 0.88) | 683 (10 studies) | High | |||
| Nonword reading accuracy Immediate follow‐up | The mean score in the intervention groups was on average 0.76 SD better1 (95% CI 0.25 to 1.27) | 512 (8 studies) | High | |||
| Word reading fluency Immediate follow‐up | The mean score in the intervention groups was on average 0.51 SD better1 (95% CI ‐1.14 to 0.13) | 54 (2 studies) | Moderate | |||
| Nonword reading fluency Immediate follow‐up | The mean score in the intervention groups was on average 0.38 SD worse1 (95% CI ‐0.55 to 1.32 ) | 18 (1 study) | Moderate | |||
| Reading comprehension Immediate follow‐up | The mean score in the intervention groups was on average 0.14 SD better1 (95% CI ‐0.46 to 0.74) | 173 (3 studies) | Moderate | |||
| Spelling Immediate follow‐up | The mean score in the intervention groups was on average 0.36 SD better1 (95% CI ‐0.27 to 1.00) | 140 (2 studies) | Moderate | |||
| CI: confidence interval | ||||||
| **GRADE Working Group grades of evidence | ||||||
| 1. Different studies used different continuous measures. Thus, comparative risk is reflected by size of the phonics training effect which was indexed with standardised mean differences (SMDs). The results are expressed as SD (standard deviation) units. As a rule of thumb, 0.2 SD represents a small difference, 0.5 a moderate difference, and 0.8 a large difference 2. Downgraded for imprecision. The confidence intervals are compatible with no effect at all as well as important improvement or deterioration | ||||||
| Issue | Method |
| Primary outcome measures | In the current review, we have combined measures for regular and irregular word reading (that is, word reading) to improve the power of the meta‐analyses of the reading measures. However, from a theoretical point of view, it would be preferable to have separate estimates for these 2 types of reading. If relevant data are available, future updates will index the effect of phonics on (1) irregular and regular word reading separately, and (2) irregular and regular spelling separately. |
| Secondary outcome measures | If relevant data are available, future updates will include letter identification, parsing, and blending as outcomes in this review. |
| Training type | In future updates, we will include additional phonics training if the data are available (for example, phonics and letter identification training, phonics, and spoken vocabulary training). |
| Subgroups | If relevant data are available, future updates will include 4 additional subgroups to the analyses that were not possible in the current review owing to lack of data: (1) Age (children (below 12 years); adolescents (13 to 17 years); adults (18 years and above); (2) poor reading type (poor letter‐sound reading; poor sight word reading; a combination of both); (3) spoken language ability (impaired unimpaired); and (4) timing of outcome assessment (immediately after training, 1 to 6 months after training, 7 to 18 months after training, more than 18 months). In addition, data allowing, we will reinstated a third categeory in the training type subgroup: phonics and sight words. |
| Timing of outcome assessment | If relevant data are available, future updates will index 4 periods of assessment: (1) immediately after training, (2) 1 to 6 months after training, (3) 7 to 18 months after training, and (4) more than 18 months after training. |
| Multiple measures | If a study includes multiple measures of a single outcome (for example, word reading accuracy), and those measures are directly comparable in type and scale, an average of the 2 scores will be taken. If a study includes multiple measures of a single outcome that are not directly comparable, both measures will be used in the analysis |
| Multiple arms | If a study includes 2 or more comparable invention groups (for example, both 'phonics only' or both 'phonics and phoneme awareness'), the data of the 2 groups will be combined. If a study includes a 'phonics only' and 'phonics plus phoneme awareness' group (for example), the phonics only group will be used since this is a purer measure of phonics training. If a study includes more than 1 control group, the control group that does the least training of any type will be included in the review. For example, a control group that does 'school as usual' will be used over a control groups who does 'maths training'. |
| Cross‐over and cluster trials | If a cluster‐randomised trial analyses the data as if individuals were randomised, we will adjust the calculations using 1 + (M‐1) ICC, where M is the average cluster size, and ICC is an estimate of the relative variability between and within clusters (Higgins 2008b). If a cross‐over trial does not appear to suffer carry‐over or period effects, then a paired t‐test will be used to measure the effect, or we will approximate a paired analysis by imputing standard deviations. If carry‐over effects are a problem, we will use data from the first period (Higgins 2008b). |
| Outcomes | Tests | References | Studies |
| Word reading accuracy | 1 experimental test |
| Barker 1995 |
| Woodcock Johnson Reading Mastery Test Third Edition: Word Identification | Woodcock 1987 | Barker 1995 | |
| Wechsler Individual Achievement Test 2nd Edition | Wechsler 2002 | Blythe 2006 | |
| Woodcock Johnson Reading Mastery Test Third Edition: Word Identification | Woodcock 2001 | Ford 2009 | |
| Woodcock Johnson Reading Mastery Test Revised: Word Identification | Woodcock 1987 | Hurford 1994 | |
| British Ability Scale: Word Reading | Elliot, Murray & Pearson, 1984 | Hurry 2007 | |
| 1 experimental test |
| Levy 1997 | |
| 1 experimental test |
| Levy 1999 | |
| 2 experimental tests |
| Lovett 2000 | |
| 2 experimental tests |
| Lovett 1990 | |
| 1 experimental test |
| Savage 2003 | |
| Nonword reading accuracy | Woodcock Johnson Reading Mastery Test: Word Analysis | Woodcock 1987 | Barker 1995 |
| Wechsler Individual Achievement Test 2nd Edition | Wechsler 2002 | Blythe 2006 | |
| Woodcock‐Johnson Tests of Achievement Third Edition: Word Attack | Woodcock 2001 | Ford 2009 | |
| Woodcock Johnson Reading Mastery Test Revised: Word Attack | Woodcock 1987 | Hurford 1994 | |
| 1 experimental test |
| Levy 1997 | |
| 1 experimental test |
| Levy 1999 | |
| Woodcock Johnson Reading Mastery Test Revised: Word Attack | Woodcock 1987 | Lovett 2000 | |
| 1 experimental test |
| Savage 2003 | |
| Word reading fluency | Test of Word Reading Efficiency: Phonemic Decoding Efficiency | Torgesen 1999 | Ford 2009 |
| 2 experimental tests |
| Lovett 1990 | |
| Nonword reading fluency | Test of Word Reading Efficiency: Sight Word Efficiency | Torgesen 1999 | Ford 2009 |
| Reading comprehension | Wechsler Individual Achievement Test 2nd Edition | Wechsler 2002 | Blythe 2006 |
| Gates‐MacGinitie Reading Test: Comprehension | MacGinitie 2002 | Ford 2009 | |
| Neale Analysis of Reading Ability | Neale 1988 | Hurry 2007 | |
| Spelling | 2 experimental tests |
| Lovett 1990 |
| 1 experimental test |
| Savage 2003 | |
| Letter‐sound knowledge | 1 experimental test |
| Lovett 1990 |
| 1 experimental test |
| Savage 2003 | |
| 1 experimental test |
| Savage 2005 | |
| Phonological output (measured with phoneme awareness tasks) | 1 experimental test |
| Barker 1995 |
| Goldman Fristoe Woodcock Test of Auditory Discrimination: Sound analysis | Goldman 1974 | Lovett 2000 | |
| 1 experimental test |
| Savage 2003 | |
| 1 experimental test |
| Savage 2005 |
|
|
|
| Random‐effects model | Heterogeneity | Fixed‐effect model | ||||||
| Outcome measure | N studies | N Participants | SMD [95% CI] | Z | P | Chi2 | P | I2% | SMD [95% CI] | Z | P |
| Word reading accuracy | 10 | 683 | 0.47 [0.06, 0.88] | 2.22 | 0.03 | 52.26 | < 0.01 | 83 | 0.46 [0.29, 0.62] | 5.44 | < 0.01 |
| Nonword reading accuracy | 8 | 512 | 0.76 [0.25, 1.27] | 2.91 | < 0.01 | 44.04 | < 0.01 | 84 | 0.82 [0.62, 1.01] | 8.14 | < 0.01 |
| Word reading fluency | 2 | 54 | ‐0.51 [‐1.14, 0.13] | 1.56 | 0.12 | 1.30 | 0.25 | 23 | ‐0.53 [‐1.08, 0.02] | 1.89 | 0.06 |
| Nonword reading fluency | 1 | 18 | 0.38 [‐0.55, 1.32] | 0.81 | 0.42 | NA | NA | NA | 0.38 [‐0.55, 1.32] | 0.81 | 0.42 |
| Reading comprehension | 3 | 173 | 0.14 [‐0.46, 0.74] | 0.45 | 0.65 | 4.27 | 0.12 | 53 | 0.01 [‐0.31, 0.32] | 0.04 | 097 |
| Spelling | 2 | 140 | 0.36 [‐0.27, 1.00] | 1.12 | 0.26 | 2.53 | 0.11 | 60 | 0.28 [‐0.09, 0.65] | 1.49 | 0.14 |
| Letter‐sound knowledge | 3 | 192 | 0.35 [0.04, 0.65] | 2.22 | 0.03 | 0.11 | 0.95 | 0 | 0.35 [0.04, 0.65] | 2.22 | 0.03 |
| Phonological output | 4 | 280 | 0.38 [‐0.04, 0.80] | 1.77 | 0.08 | 7.97 | 0.05 | 62 | 0.44 [0.19, 0.70] | 3.45 | < 0.01 |
| CI: confidence interval; SMD: standardised mean difference | |||||||||||
| Study | Location | Age | Gender | IQ | Ethnicity | SES | Inclusion criteria | Exclusion Criteria | Population |
| Barker 1995 | USA | Range 6.2 to 7.8 years | Not reported | Verbal Mean = 16.5 SD = 2.36 | Not reported | Not reported | Students nominated by teachers from 2 elementary schools who were given a short series of pre‐tests assessing phonological awareness skills and basic word recognition skills. These children were then given further 2 tests and those scoring below the 40th percentile and the 50th percentile on the subsequent test were selected | None stated | First‐grade students |
| Blythe 2006 | Australia | Mean 101.5 months | Male 75% Female 25% | FSIQ‐2 Mean 100.15 SD 9.38 | Not reported | Not reported | Children who received group‐based remedial reading instruction at school and were referred by a support teacher | After referral children completed the WISC‐III FSIQ. Those who scored below the 20th percentile were excluded | Dyslexic primary school students |
| Ford 2009 | USA | Mean 16.18 years | Male 55% Female 45% | Not reported | African‐American 22%, Hispanic 67%, white 11% | Lower | Students who were enrolled in the remedial reading programme were invited to participate. Below average reading skills were based on the ISAT | None stated | Teenagers enrolled at an alternative high school, that is, a high school for non‐special education students or students at risk of dropping out |
| Hurford 1994 | USA | Mean 80.35 months | Male 48% Female 52% | Mean 90.37 | White 92.8, African‐American 6%, Hispanic 5%, Asian‐American 0.7% | Middle | Classification data from Hurford, Darrow, Edwards, Howerton, Mote, Schauf and Coffey (1993) was used with more relaxed criteria for eligibility, that is standard scores in reading of less than 91 were included rather than less than 86 | None stated | Children at risk of reading disability |
| Hurry 2007 | UK | Range 6 to 6.6 years | Male 61% Female 39% | Range 92 to 96 | 16% spoke English as a second language | 42% of the sample were eligible for free school meals | In 63 schools the 6 poorest Year 2 readers were selected on the basis of their Diagnostic Survey (Clay, 1985) performance. Of the 22 schools using Reading Recovery, the poorest scorers were offered intervention | The remaining children, that is, those less poor at reading then those that were selected for the experimental condition, were assigned to a within school condition | Children with reading difficulties |
| Levy 1997 | Canada | Range 5.9 to 7.2 years | Male 48% Female 52% | Not reported | Not reported | Not reported | Children were given word reading tests, children that read fewer than 7 words on any of the screening tests were selected | None stated | All children from Grade 1 and senior kindergarten from 2 schools, whose parents consented to their participation |
| Levy 1999 | Canada | Mean age 7.7 years | Male 56% Female 44% | Non‐verbal (picture assembly) Experimental group mean 10.88 Control group mean 10.65 | Mixed racial distribution | Covers all SES | Children were given a word identification test (WRAT‐3), if they scored below 90 they were given another word identification test (WRMT) and if they read below half a grade below their grade level and read no more than 15 of the training words then they were included in the sample | None stated | 17 schools participated in the screening process with permission for participation obtained from the board, schools and a parent or guardian |
| Lovett 1990 | Canada | Mean age 8.4 years SD 1.6 Range 7 to 13 years | Male 70.4% Female 29.6% | Verbal Mean 98.4 SD 10.6 Performance Mean 106.2 SD 12.6 | Not reported | Middle | Children had to score below the 25th percentile on at least 4 of 5 reading measures used in the screening test and have at least low average intelligence | Children with English as a second language, history of extreme hyperactivity, hearing impairment, brain damage, a chronic medical condition, serious emotional disturbance, or attention deficits | Children referred to the Learning Disabilities Reading Program |
| Lovett 2000 | Canada | Mean age 9.9 years SD 1.6 Range 7 to 13 years | Male 68.1% Female 31.9% | Verbal Mean 92 SD 13.7 Range 58 to 133 Performance Mean 98.7 SD 14.3 Range = 63 ‐ 136 | Not reported | Not reported | Children needed to demonstrate a 'substantial underachievement' on 4 of the 5 reading based screening assessments | None stated | Children with severe reading disabilities that were referred to the Clinical Research Unit for remediation |
| Savage 2003 | UK | Mean age 5.9 years Range 5 to 6.3 years | Male 60% Female 40% | Not reported | Not reported | Not reported | Over 2 sessions a series of reading‐ and spelling‐based assessments were used to find the poorest readers in Year 1 of the school. The lowest performers were recruited | A teacher identifying a child as being too immature to deal with working in small groups | Children with the lowest reading performance for their age within a Local Education Authority or School District |
| Savage 2005 | UK | Not reported
| Male 50% Female 50% | Not reported | Not reported | Lower | Over 2 sessions a series of reading‐ and spelling‐based assessments were used to find the poorest readers in Year 1 of the school. The lowest performers were recruited | None stated | Children with the lowest reading performance for their age within a Local Education Authority or School District |
| FSIQ: Full Scale intelligence quotient; IQ: intelligence quotient; ISAT: Illinois State Achievement Test; SD: standard deviation; SES: socioeconomic status; WISC: Wechsler Intelligence Scale for Children; WRAT: Wide Range Achievement Test; WRMT: Woodcock Reading Mastery Test | |||||||||
| Subgroups |
| Barker 1995 | Blythe 2006 | Ford 2009 | Hurford 1994 | Hurry 2007 | Levy 1997 | Levy 1999 | Lovett 1990 | Lovett 2000 | Savage 2003 | Savage 2005 |
| Training type | Phonics only | X | ‐ | ‐ | ‐ | ‐ | X | X | ‐ | ‐ | ‐ | ‐ |
|
| Phonics + phoneme awareness | ‐ | X | X | X | X | ‐ | ‐ | ‐ | X | X | X |
|
| Phonics + irregular words | ‐ | ‐ | ‐ | ‐ | ‐ | ‐ | ‐ | X | ‐ | ‐ | ‐ |
| Training intensity | < 2 hours/week | X | X | X | X | X | X | X | ‐ | ‐ | X | X |
|
| ≥ 2 hours/week | ‐ | ‐ | ‐ | ‐ | ‐ | ‐ | ‐ | X | X | ‐ | ‐ |
| Training duration | < 3 months | X | X | X | ‐ | ‐ | X | X | X | X | X | X |
|
| ≥ 3 months | ‐ | ‐ | ‐ | X | X | ‐ | ‐ | ‐ | ‐ | ‐ | ‐ |
| Training group size | 1 | ‐ | X | X | X | X | X | X | ‐ | ‐ | ‐ | ‐ |
|
| ≤ 5 | X | ‐ | ‐ | ‐ | ‐ | ‐ | ‐ | X | X | X | X |
| Training administrator | Human | ‐ | ‐ | ‐ | ‐ | X | X | X | X | X | X | X |
|
| Computer | X | X | X | X | ‐ | ‐ | ‐ | ‐ | ‐ | ‐ | ‐ |
|
| Subgroups |
|
| Mean effect size | Heterogeneity | Subgroup analyses | ||||||||
| N studies/ measures | N participants | SMD [95% CI] | Z | P | Chi2 | P | I2 % | Chi2 | DF | P | I2 % | |||
| Word reading accuracy | Training type | Phonics only | 3 | 232 | 0.91 [‐0.17, 1.98] | 1.63 | 0.10 | 23.93 | < 0.10 | 92 |
|
|
|
|
|
| Phonics + phoneme awareness | 6 | 415 | 0.28 [0.00, 0.56] | 1.96 | 0.05 | 8.12 | 0.15 | 38 | 1.23 | 1 | 0.27 | 18.8 | |
| Training intensity | < 2 hours/week | 8 | 559 | 0.48 [‐0.04, 1.00] | 1.80 | 0.07 | 50.65 | < 0.10 | 86 |
|
|
|
| |
|
| ≥ 2 hours/week | 2 | 124 | 0.34 [‐0.03, 0.72] | 1.79 | 0.07 | 1.06 | 0.30 | 6 | 0.17 | 1 | 0.68 | 0 | |
| Training duration | < 3 months | 8 | 498 | 0.56 [0.07, 1.04] | 2.25 | 0.02 | 39.20 | < 0.10 | 82 |
|
|
|
| |
|
| ≥ 3 months | 2 | 185 | 0.12 [‐0.43, 0.67] | 0.42 | 0.67 | 2.8 | 0.09 | 64 | 1.36 | 1 | 0.24 | 26.3 | |
| Training group size | 1 | 6 | 419 | 0.62 [‐0.06, 1.29] | 1.78 | 0.07 | 44.35 | < 0.10 | 89 |
|
|
|
| |
|
| ≤ 5 | 4 | 264 | 0.25 [‐0.04, 0.54] | 1.67 | 0.10 | 8.78 | 0.29 | 12 | 0.94 | 1 | 0.33 | 0 | |
| Training administrator | Human | 6 | 559 | 0.66 [0.08, 1.23] | 2.24 | 0.03 | 46.02 | < 0.10 | 89 |
|
|
|
| |
|
| Computer | 4 | 124 | 0.15 [‐0.20, 0.51] | 0.85 | 0.40 | 2.63 | 0.45 | 0 | 2.13 | 1 | 0.14 | 53 | |
| Nonword reading accuracy | Training type | Phonics only | 3 | 232 | 0.91 [‐0.45, 2.28] | 1.32 | 0.19 | 36.92 | < 0.10 | 95 |
|
|
|
|
|
| Phonics + phoneme awareness | 5 | 280 | 0.63 [0.38, 0.88] | 4.86 | < 0.10 | 1.84 | 0.88 | 0 | 0.16 | 1 | 0.69 | 0 | |
| Training group size | 1 | 5 | 284 | 1.06 [0.39, 1.73] | 3.09 | < 0.10 | 21.92 | < 0.10 | 82 |
|
|
|
| |
|
| ≤ 5 | 3 | 228 | 0.32 [‐0.32, 0.96] | 0.97 | 0.33 | 9.64 | < 0.10 | 79 | 2.43 | 1 | 0.12 | 58.8 | |
| Training administrator | Human | 4 | 388 | 1.12 [0.48, 1.76] | 3.42 | < 0.10 | 22.23 | < 0.10 | 87 |
|
|
|
| |
|
| Computer | 4 | 124 | 0.31 [‐0.33, 0.96] | 0.96 | 0.34 | 8.65 | 0.03 | 65 | 3.02 | 1 | 0.08 | 66.8 | |
| Outcome or subgroup title | No. of studies | No. of participants | Statistical method | Effect size |
| 1 Word reading accuracy Show forest plot | 10 | 683 | Std. Mean Difference (IV, Random, 95% CI) | 0.47 [0.06, 0.88] |
| 2 Nonword reading accuracy Show forest plot | 8 | 512 | Std. Mean Difference (IV, Random, 95% CI) | 0.76 [0.25, 1.27] |
| 3 Word reading fluency Show forest plot | 2 | 54 | Std. Mean Difference (IV, Random, 95% CI) | ‐0.51 [‐1.14, 0.13] |
| 4 Nonword reading fluency Show forest plot | 1 | 18 | Std. Mean Difference (IV, Random, 95% CI) | 0.38 [‐0.55, 1.32] |
| 5 Reading comprehension Show forest plot | 3 | 173 | Std. Mean Difference (IV, Random, 95% CI) | 0.14 [‐0.46, 0.74] |
| 6 Spelling Show forest plot | 2 | 140 | Std. Mean Difference (IV, Random, 95% CI) | 0.36 [‐0.27, 1.00] |
| 7 Letter‐sound knowledge Show forest plot | 3 | 192 | Std. Mean Difference (IV, Random, 95% CI) | 0.35 [0.04, 0.65] |
| 8 Phonological output Show forest plot | 4 | 280 | Std. Mean Difference (IV, Random, 95% CI) | 0.38 [‐0.04, 0.80] |
| Outcome or subgroup title | No. of studies | No. of participants | Statistical method | Effect size |
| 1 Word reading accuracy Show forest plot | 10 | Std. Mean Difference (IV, Random, 95% CI) | Subtotals only | |
| 1.1 Training type: phonics only | 3 | 232 | Std. Mean Difference (IV, Random, 95% CI) | 0.91 [‐0.17, 1.98] |
| 1.2 Training type: phonics + phoneme awareness | 6 | 415 | Std. Mean Difference (IV, Random, 95% CI) | 0.28 [0.00, 0.56] |
| 1.3 Training intensity: < 2 hours/week | 8 | 559 | Std. Mean Difference (IV, Random, 95% CI) | 0.48 [‐0.04, 1.00] |
| 1.4 Training intensity: ≥ 2 hours/week | 2 | 124 | Std. Mean Difference (IV, Random, 95% CI) | 0.34 [‐0.03, 0.72] |
| 1.5 Training duration: < 3 months | 8 | 498 | Std. Mean Difference (IV, Random, 95% CI) | 0.56 [0.07, 1.04] |
| 1.6 Training duration: ≥ 3 months | 2 | 185 | Std. Mean Difference (IV, Random, 95% CI) | 0.12 [‐0.43, 0.67] |
| 1.7 Training group size: 1 | 6 | 419 | Std. Mean Difference (IV, Random, 95% CI) | 0.62 [‐0.06, 1.29] |
| 1.8 Training group size: ≤ 5 | 4 | 264 | Std. Mean Difference (IV, Random, 95% CI) | 0.25 [‐0.04, 0.54] |
| 1.9 Training administrator: human | 6 | 559 | Std. Mean Difference (IV, Random, 95% CI) | 0.66 [0.08, 1.23] |
| 1.10 Training administrator: computer | 4 | 124 | Std. Mean Difference (IV, Random, 95% CI) | 0.15 [‐0.20, 0.51] |
| 2 Nonword reading accuracy Show forest plot | 8 | 1536 | Std. Mean Difference (IV, Random, 95% CI) | 0.76 [0.48, 1.04] |
| 2.1 Training type: phonics only | 3 | 232 | Std. Mean Difference (IV, Random, 95% CI) | 0.91 [‐0.45, 2.28] |
| 2.2 Training type: phonics + phoneme awareness | 5 | 280 | Std. Mean Difference (IV, Random, 95% CI) | 0.63 [0.38, 0.88] |
| 2.3 Training group size: 1 | 5 | 284 | Std. Mean Difference (IV, Random, 95% CI) | 1.06 [0.39, 1.73] |
| 2.4 Training group size: ≤ 5 | 3 | 228 | Std. Mean Difference (IV, Random, 95% CI) | 0.32 [‐0.32, 0.96] |
| 2.5 Training administrator: human | 4 | 388 | Std. Mean Difference (IV, Random, 95% CI) | 1.12 [0.48, 1.76] |
| 2.6 Training administrator: computer | 4 | 124 | Std. Mean Difference (IV, Random, 95% CI) | 0.31 [‐0.33, 0.96] |
| Outcome or subgroup title | No. of studies | No. of participants | Statistical method | Effect size |
| 1 Word reading accuracy Show forest plot | 10 | 683 | Std. Mean Difference (IV, Fixed, 95% CI) | 0.46 [0.29, 0.62] |
| 2 Nonword reading accuracy Show forest plot | 8 | 512 | Std. Mean Difference (IV, Fixed, 95% CI) | 0.82 [0.62, 1.01] |
| 3 Word reading fluency Show forest plot | 2 | 54 | Std. Mean Difference (IV, Fixed, 95% CI) | ‐0.53 [‐1.08, 0.02] |
| 4 Nonword reading fluency Show forest plot | 1 | 18 | Std. Mean Difference (IV, Fixed, 95% CI) | 0.38 [‐0.55, 1.32] |
| 5 Reading comprehension Show forest plot | 3 | 173 | Std. Mean Difference (IV, Fixed, 95% CI) | 0.01 [‐0.31, 0.32] |
| 6 Spelling Show forest plot | 2 | 140 | Std. Mean Difference (IV, Fixed, 95% CI) | 0.28 [‐0.09, 0.65] |
| 7 Letter‐sound knowledge Show forest plot | 3 | 192 | Std. Mean Difference (IV, Fixed, 95% CI) | 0.35 [0.04, 0.65] |
| 8 Phonological output Show forest plot | 4 | 280 | Std. Mean Difference (IV, Fixed, 95% CI) | 0.44 [0.19, 0.70] |
| Outcome or subgroup title | No. of studies | No. of participants | Statistical method | Effect size |
| 1 Word reading accuracy Show forest plot | 9 | 633 | Std. Mean Difference (IV, Random, 95% CI) | 0.47 [0.01, 0.93] |
| 2 Nonword reading accuracy Show forest plot | 7 | 462 | Std. Mean Difference (IV, Random, 95% CI) | 0.80 [0.22, 1.38] |