| 1 60‐day mortality Show forest plot | 14 | | Risk Ratio (M‐H, Fixed, 95% CI) | Subtotals only |
|
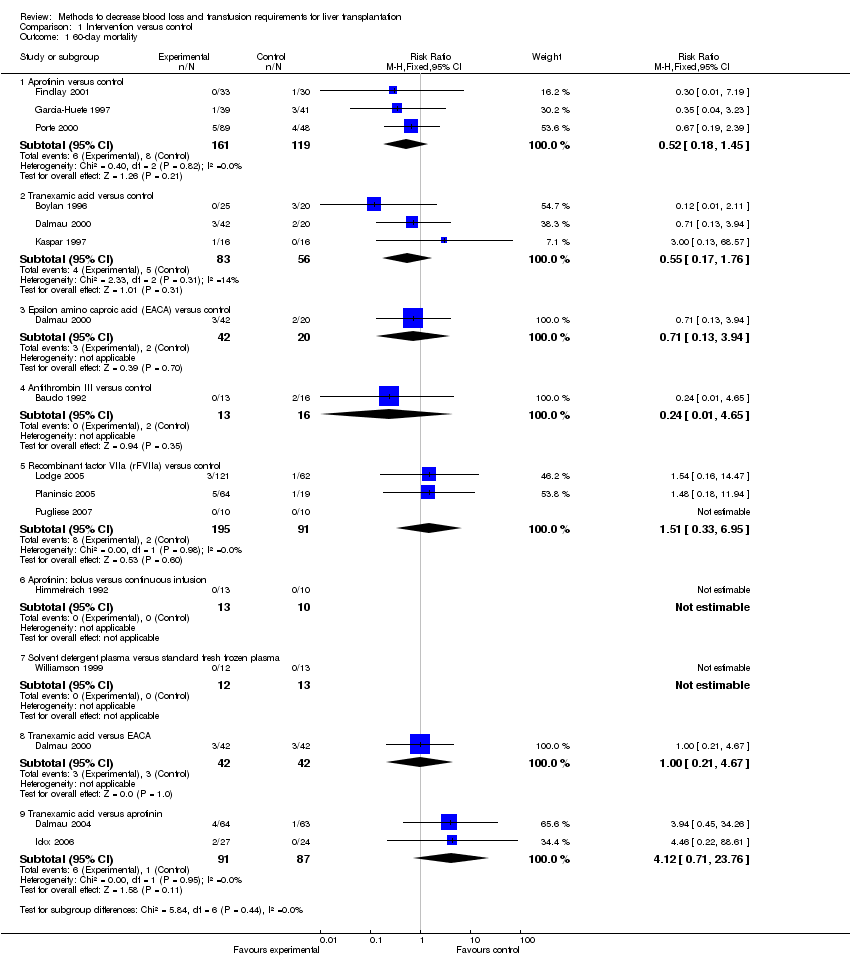
| 1.1 Aprotinin versus control | 3 | 280 | Risk Ratio (M‐H, Fixed, 95% CI) | 0.52 [0.18, 1.45] |
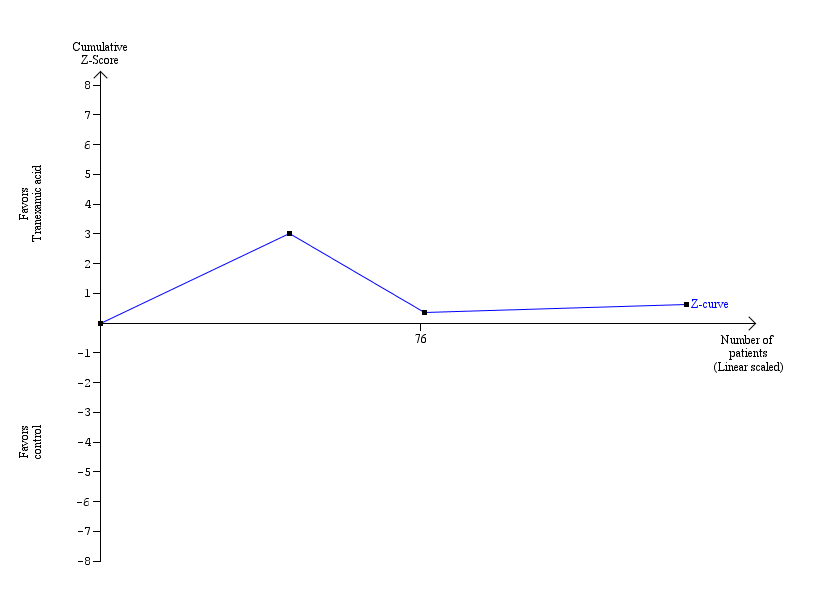
| 1.2 Tranexamic acid versus control | 3 | 139 | Risk Ratio (M‐H, Fixed, 95% CI) | 0.55 [0.17, 1.76] |
| 1.3 Epsilon amino caproic acid (EACA) versus control | 1 | 62 | Risk Ratio (M‐H, Fixed, 95% CI) | 0.71 [0.13, 3.94] |
| 1.4 Antithrombin III versus control | 1 | 29 | Risk Ratio (M‐H, Fixed, 95% CI) | 0.24 [0.01, 4.65] |
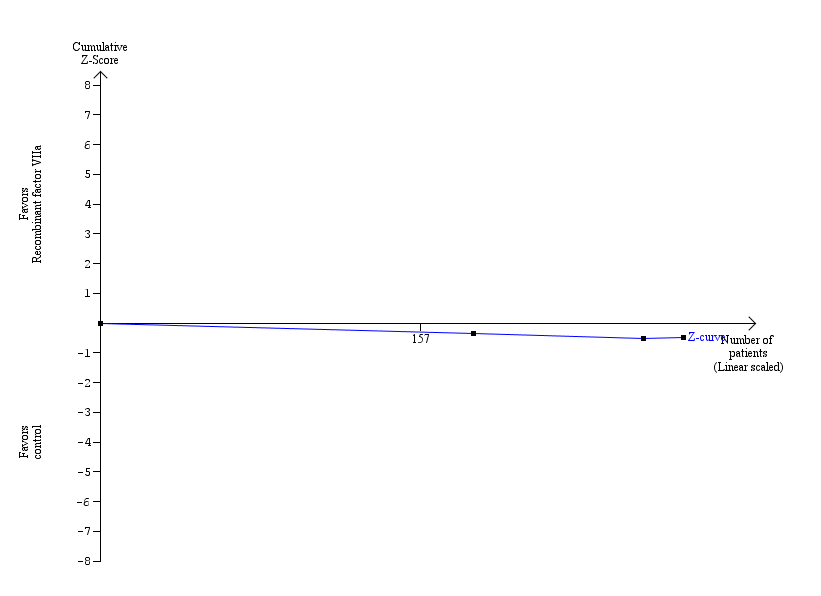
| 1.5 Recombinant factor VIIa (rFVIIa) versus control | 3 | 286 | Risk Ratio (M‐H, Fixed, 95% CI) | 1.51 [0.33, 6.95] |
| 1.6 Aprotinin: bolus versus continuous infusion | 1 | 23 | Risk Ratio (M‐H, Fixed, 95% CI) | 0.0 [0.0, 0.0] |
| 1.7 Solvent detergent plasma versus standard fresh frozen plasma | 1 | 25 | Risk Ratio (M‐H, Fixed, 95% CI) | 0.0 [0.0, 0.0] |
| 1.8 Tranexamic acid versus EACA | 1 | 84 | Risk Ratio (M‐H, Fixed, 95% CI) | 1.0 [0.21, 4.67] |
| 1.9 Tranexamic acid versus aprotinin | 2 | 178 | Risk Ratio (M‐H, Fixed, 95% CI) | 4.12 [0.71, 23.76] |
| 2 Mortality at maximal follow‐up Show forest plot | 2 | | Risk Ratio (M‐H, Fixed, 95% CI) | Subtotals only |
|
| 2.1 Antithrombin III versus control | 1 | 29 | Risk Ratio (M‐H, Fixed, 95% CI) | 0.25 [0.03, 1.85] |
| 2.2 Thromboelastography versus control | 1 | 28 | Risk Ratio (M‐H, Fixed, 95% CI) | 0.67 [0.13, 3.40] |
| 3 Primary graft non‐function Show forest plot | 4 | | Risk Ratio (M‐H, Fixed, 95% CI) | Subtotals only |
|
| 3.1 Aprotinin versus control | 2 | 217 | Risk Ratio (M‐H, Fixed, 95% CI) | 0.15 [0.02, 1.25] |
| 3.2 Tranexamic acid versus control | 1 | 32 | Risk Ratio (M‐H, Fixed, 95% CI) | 3.0 [0.13, 68.57] |
| 3.3 Recombinant factor VIIa (rFVIIa) versus control | 1 | 20 | Risk Ratio (M‐H, Fixed, 95% CI) | 0.0 [0.0, 0.0] |
| 4 Retransplantation Show forest plot | 7 | | Risk Ratio (M‐H, Random, 95% CI) | Subtotals only |
|
| 4.1 Aprotinin versus control | 2 | 217 | Risk Ratio (M‐H, Random, 95% CI) | 0.21 [0.02, 1.79] |
| 4.2 Tranexamic acid versus control | 2 | 77 | Risk Ratio (M‐H, Random, 95% CI) | 0.79 [0.18, 3.48] |
| 4.3 Prostaglandin versus control | 1 | 20 | Risk Ratio (M‐H, Random, 95% CI) | 0.0 [0.0, 0.0] |
| 4.4 Aprotinin: bolus versus continuous infusion | 1 | 23 | Risk Ratio (M‐H, Random, 95% CI) | 0.77 [0.05, 10.85] |
| 4.5 Tranexamic acid versus aprotinin | 1 | 127 | Risk Ratio (M‐H, Random, 95% CI) | 2.95 [0.12, 71.17] |
| 5 Thromboembolic episodes Show forest plot | 12 | | Risk Ratio (M‐H, Fixed, 95% CI) | Subtotals only |
|
| 5.1 Aprotinin versus control | 3 | 280 | Risk Ratio (M‐H, Fixed, 95% CI) | 0.60 [0.18, 1.96] |
| 5.2 Tranexamic acid versus control | 5 | 179 | Risk Ratio (M‐H, Fixed, 95% CI) | 2.20 [0.38, 12.64] |
| 5.3 Epsilon amino caproic acid (EACA) versus control | 1 | 62 | Risk Ratio (M‐H, Fixed, 95% CI) | 0.95 [0.09, 9.89] |
| 5.4 Recombinant factor VIIa (rFVIIa) versus control | 2 | 266 | Risk Ratio (M‐H, Fixed, 95% CI) | 1.38 [0.65, 2.91] |
| 5.5 Tranexamic acid versus EACA | 1 | 84 | Risk Ratio (M‐H, Fixed, 95% CI) | 2.0 [0.39, 10.34] |
| 5.6 Tranexamic acid versus aprotinin | 2 | 178 | Risk Ratio (M‐H, Fixed, 95% CI) | 1.97 [0.37, 10.37] |
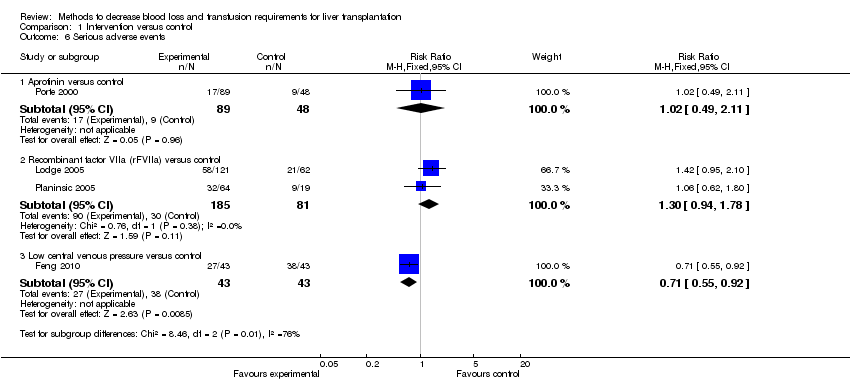
| 6 Serious adverse events Show forest plot | 4 | | Risk Ratio (M‐H, Fixed, 95% CI) | Subtotals only |
|
| 6.1 Aprotinin versus control | 1 | 137 | Risk Ratio (M‐H, Fixed, 95% CI) | 1.02 [0.49, 2.11] |
| 6.2 Recombinant factor VIIa (rFVIIa) versus control | 2 | 266 | Risk Ratio (M‐H, Fixed, 95% CI) | 1.30 [0.94, 1.78] |
| 6.3 Low central venous pressure versus control | 1 | 86 | Risk Ratio (M‐H, Fixed, 95% CI) | 0.71 [0.55, 0.92] |
| 7 Blood loss Show forest plot | 11 | | Mean Difference (IV, Random, 95% CI) | Subtotals only |
|
| 7.1 Aprotinin versus control | 3 | 195 | Mean Difference (IV, Random, 95% CI) | ‐1.36 [‐3.39, 0.66] |
| 7.2 Tranexamic acid versus control | 2 | 65 | Mean Difference (IV, Random, 95% CI) | ‐4.98 [‐10.18, 0.23] |
| 7.3 Antithrombin III versus control | 1 | 29 | Mean Difference (IV, Random, 95% CI) | 1.9 [‐4.86, 8.66] |
| 7.4 Thromboelastography versus control | 2 | 62 | Mean Difference (IV, Random, 95% CI) | ‐1.13 [‐1.85, ‐0.41] |
| 7.5 Low central venous pressure versus control | 1 | 86 | Mean Difference (IV, Random, 95% CI) | ‐1.19 [‐1.88, ‐0.50] |
| 7.6 Tranexamic acid versus aprotinin | 2 | 71 | Mean Difference (IV, Random, 95% CI) | ‐1.01 [‐2.31, 0.29] |
| 8 Red‐cell or whole blood transfusion Show forest plot | 4 | | Risk Ratio (M‐H, Fixed, 95% CI) | Subtotals only |
|
| 8.1 Aprotinin versus control | 1 | 80 | Risk Ratio (M‐H, Fixed, 95% CI) | 0.68 [0.40, 1.18] |
| 8.2 Tranexamic acid versus control | 1 | 62 | Risk Ratio (M‐H, Fixed, 95% CI) | 0.77 [0.60, 0.98] |
| 8.3 Epsilon amino caproic acid (EACA) versus control | 1 | 62 | Risk Ratio (M‐H, Fixed, 95% CI) | 0.90 [0.77, 1.06] |
| 8.4 Recombinant factor VIIa (rFVIIa) versus control | 1 | 182 | Risk Ratio (M‐H, Fixed, 95% CI) | 0.91 [0.86, 0.97] |
| 8.5 Tranexamic acid versus EACA | 1 | 84 | Risk Ratio (M‐H, Fixed, 95% CI) | 0.81 [0.64, 1.02] |
| 8.6 Tranexamic acid versus aprotinin | 1 | 127 | Risk Ratio (M‐H, Fixed, 95% CI) | 0.94 [0.71, 1.23] |
| 9 Red cell or whole blood transfusion Show forest plot | 29 | | Std. Mean Difference (IV, Fixed, 95% CI) | Subtotals only |
|
| 9.1 Aprotinin versus control | 8 | 375 | Std. Mean Difference (IV, Fixed, 95% CI) | ‐0.61 [‐0.82, ‐0.40] |
| 9.2 Tranexamic acid versus control | 4 | 159 | Std. Mean Difference (IV, Fixed, 95% CI) | ‐0.27 [‐0.59, 0.06] |
| 9.3 Epsilon amino caproic acid (EACA) versus control | 1 | 62 | Std. Mean Difference (IV, Fixed, 95% CI) | ‐0.17 [‐0.71, 0.36] |
| 9.4 Antithrombin III versus control | 1 | 29 | Std. Mean Difference (IV, Fixed, 95% CI) | ‐0.04 [‐0.77, 0.69] |
| 9.5 Recombinant factor VIIa (rFVIIa) versus control | 2 | 221 | Std. Mean Difference (IV, Fixed, 95% CI) | ‐0.05 [‐0.32, 0.23] |
| 9.6 Oestrogen versus control | 1 | 30 | Std. Mean Difference (IV, Fixed, 95% CI) | ‐0.58 [‐1.32, 0.15] |
| 9.7 Prostaglandin versus control | 1 | 20 | Std. Mean Difference (IV, Fixed, 95% CI) | ‐0.04 [‐0.92, 0.83] |
| 9.8 Norepinephrine versus control | 1 | 65 | Std. Mean Difference (IV, Fixed, 95% CI) | ‐0.04 [‐0.53, 0.44] |
| 9.9 Thromboelastography versus control | 2 | 62 | Std. Mean Difference (IV, Fixed, 95% CI) | ‐0.73 [‐1.25, ‐0.20] |
| 9.10 Low central venous pressure versus control | 1 | 86 | Std. Mean Difference (IV, Fixed, 95% CI) | ‐1.17 [‐1.62, ‐0.71] |
| 9.11 Aprotinin: bolus versus continuous infusion | 1 | 23 | Std. Mean Difference (IV, Fixed, 95% CI) | 0.86 [‐0.00, 1.73] |
| 9.12 Aprotinin: high dose versus medium dose | 1 | 189 | Std. Mean Difference (IV, Fixed, 95% CI) | 0.16 [‐0.12, 0.45] |
| 9.13 Aprotinin: high dose versus low dose | 1 | 20 | Std. Mean Difference (IV, Fixed, 95% CI) | ‐1.46 [‐2.47, ‐0.45] |
| 9.14 Whole blood versus blood components | 1 | 33 | Std. Mean Difference (IV, Fixed, 95% CI) | ‐0.04 [‐0.72, 0.65] |
| 9.15 Solvent detergent plasma versus standard fresh frozen plasma | 1 | 25 | Std. Mean Difference (IV, Fixed, 95% CI) | 0.19 [‐0.60, 0.98] |
| 9.16 Tranexamic acid versus EACA | 1 | 84 | Std. Mean Difference (IV, Fixed, 95% CI) | ‐0.23 [‐0.66, 0.20] |
| 9.17 Tranexamic acid versus aprotinin | 3 | 198 | Std. Mean Difference (IV, Fixed, 95% CI) | ‐0.09 [‐0.36, 0.19] |
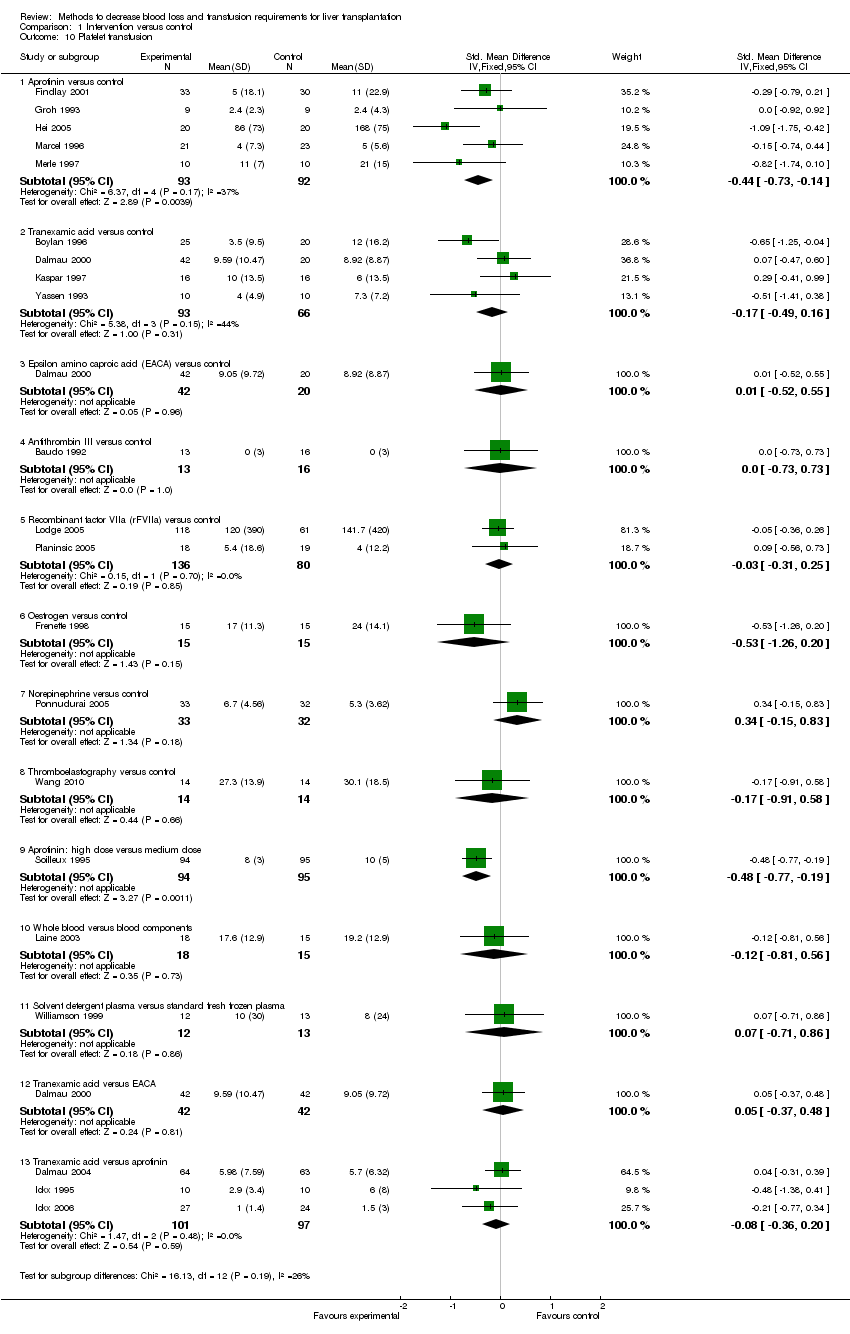
| 10 Platelet transfusion Show forest plot | 21 | | Std. Mean Difference (IV, Fixed, 95% CI) | Subtotals only |
|
| 10.1 Aprotinin versus control | 5 | 185 | Std. Mean Difference (IV, Fixed, 95% CI) | ‐0.44 [‐0.73, ‐0.14] |
| 10.2 Tranexamic acid versus control | 4 | 159 | Std. Mean Difference (IV, Fixed, 95% CI) | ‐0.17 [‐0.49, 0.16] |
| 10.3 Epsilon amino caproic acid (EACA) versus control | 1 | 62 | Std. Mean Difference (IV, Fixed, 95% CI) | 0.01 [‐0.52, 0.55] |
| 10.4 Antithrombin III versus control | 1 | 29 | Std. Mean Difference (IV, Fixed, 95% CI) | 0.0 [‐0.73, 0.73] |
| 10.5 Recombinant factor VIIa (rFVIIa) versus control | 2 | 216 | Std. Mean Difference (IV, Fixed, 95% CI) | ‐0.03 [‐0.31, 0.25] |
| 10.6 Oestrogen versus control | 1 | 30 | Std. Mean Difference (IV, Fixed, 95% CI) | ‐0.53 [‐1.26, 0.20] |
| 10.7 Norepinephrine versus control | 1 | 65 | Std. Mean Difference (IV, Fixed, 95% CI) | 0.34 [‐0.15, 0.83] |
| 10.8 Thromboelastography versus control | 1 | 28 | Std. Mean Difference (IV, Fixed, 95% CI) | ‐0.17 [‐0.91, 0.58] |
| 10.9 Aprotinin: high dose versus medium dose | 1 | 189 | Std. Mean Difference (IV, Fixed, 95% CI) | ‐0.48 [‐0.77, ‐0.19] |
| 10.10 Whole blood versus blood components | 1 | 33 | Std. Mean Difference (IV, Fixed, 95% CI) | ‐0.12 [‐0.81, 0.56] |
| 10.11 Solvent detergent plasma versus standard fresh frozen plasma | 1 | 25 | Std. Mean Difference (IV, Fixed, 95% CI) | 0.07 [‐0.71, 0.86] |
| 10.12 Tranexamic acid versus EACA | 1 | 84 | Std. Mean Difference (IV, Fixed, 95% CI) | 0.05 [‐0.37, 0.48] |
| 10.13 Tranexamic acid versus aprotinin | 3 | 198 | Std. Mean Difference (IV, Fixed, 95% CI) | ‐0.08 [‐0.36, 0.20] |
| 11 Plasma transfusion Show forest plot | 25 | | Std. Mean Difference (IV, Fixed, 95% CI) | Subtotals only |
|
| 11.1 Aprotinin versus control | 8 | 420 | Std. Mean Difference (IV, Fixed, 95% CI) | ‐0.33 [‐0.53, ‐0.13] |
| 11.2 Tranexamic acid versus control | 4 | 159 | Std. Mean Difference (IV, Fixed, 95% CI) | ‐0.21 [‐0.53, 0.11] |
| 11.3 Epsilon amino caproic acid (EACA) versus control | 1 | 62 | Std. Mean Difference (IV, Fixed, 95% CI) | ‐0.12 [‐0.66, 0.41] |
| 11.4 Antithrombin III versus control | 1 | 29 | Std. Mean Difference (IV, Fixed, 95% CI) | 0.04 [‐0.69, 0.77] |
| 11.5 Recombinant factor VIIa (rFVIIa) versus control | 2 | 262 | Std. Mean Difference (IV, Fixed, 95% CI) | ‐0.01 [‐0.28, 0.25] |
| 11.6 Oestrogen versus control | 1 | 30 | Std. Mean Difference (IV, Fixed, 95% CI) | ‐0.67 [‐1.41, 0.07] |
| 11.7 Prostaglandin versus control | 1 | 20 | Std. Mean Difference (IV, Fixed, 95% CI) | 0.0 [‐0.88, 0.88] |
| 11.8 Norepinephrine versus control | 1 | 65 | Std. Mean Difference (IV, Fixed, 95% CI) | 0.11 [‐0.38, 0.60] |
| 11.9 Thromboelastography versus control | 1 | 28 | Std. Mean Difference (IV, Fixed, 95% CI) | ‐0.82 [‐1.60, ‐0.05] |
| 11.10 Aprotinin: bolus versus continuous infusion | 1 | 23 | Std. Mean Difference (IV, Fixed, 95% CI) | 0.05 [‐0.78, 0.87] |
| 11.11 Aprotinin: high dose versus medium dose | 1 | 189 | Std. Mean Difference (IV, Fixed, 95% CI) | 0.06 [‐0.22, 0.35] |
| 11.12 Aprotinin: high dose versus low dose | 1 | 20 | Std. Mean Difference (IV, Fixed, 95% CI) | ‐1.31 [‐2.29, ‐0.32] |
| 11.13 Whole blood versus blood components | 1 | 33 | Std. Mean Difference (IV, Fixed, 95% CI) | ‐1.53 [‐2.32, ‐0.74] |
| 11.14 Tranexamic acid versus EACA | 1 | 84 | Std. Mean Difference (IV, Fixed, 95% CI) | ‐0.22 [‐0.65, 0.21] |
| 11.15 Tranexamic acid versus aprotinin | 2 | 71 | Std. Mean Difference (IV, Fixed, 95% CI) | 0.02 [‐0.45, 0.48] |
| 12 Cryoprecipitate Show forest plot | 12 | | Std. Mean Difference (IV, Fixed, 95% CI) | Subtotals only |
|
| 12.1 Aprotinin versus control | 3 | 147 | Std. Mean Difference (IV, Fixed, 95% CI) | ‐0.49 [‐0.82, ‐0.16] |
| 12.2 Tranexamic acid versus control | 4 | 181 | Std. Mean Difference (IV, Fixed, 95% CI) | ‐0.27 [‐0.57, 0.02] |
| 12.3 Epsilon amino caproic acid (EACA) versus control | 1 | 62 | Std. Mean Difference (IV, Fixed, 95% CI) | 0.00 [‐0.53, 0.54] |
| 12.4 Antithrombin III versus control | 1 | 29 | Std. Mean Difference (IV, Fixed, 95% CI) | 0.0 [‐0.73, 0.73] |
| 12.5 Oestrogen versus control | 1 | 30 | Std. Mean Difference (IV, Fixed, 95% CI) | 0.0 [‐0.72, 0.72] |
| 12.6 Thromboelastography versus control | 1 | 28 | Std. Mean Difference (IV, Fixed, 95% CI) | ‐0.25 [1.00, 0.49] |
| 12.7 Whole blood versus blood components | 1 | 33 | Std. Mean Difference (IV, Fixed, 95% CI) | ‐0.28 [‐0.97, 0.41] |
| 12.8 Solvent detergent plasma versus standard fresh frozen plasma | 1 | 25 | Std. Mean Difference (IV, Fixed, 95% CI) | 0.10 [‐0.68, 0.89] |
| 12.9 Tranexamic acid versus EACA | 1 | 62 | Std. Mean Difference (IV, Fixed, 95% CI) | ‐0.15 [‐0.69, 0.38] |
| 13 Hospital stay Show forest plot | 6 | | Mean Difference (IV, Fixed, 95% CI) | Subtotals only |
|
| 13.1 Aprotinin versus control | 1 | 63 | Mean Difference (IV, Fixed, 95% CI) | 0.0 [‐4.94, 4.94] |
| 13.2 Tranexamic acid versus control | 1 | 45 | Mean Difference (IV, Fixed, 95% CI) | 4.0 [‐16.18, 24.18] |
| 13.3 Recombinant factor VIIa (rFVIIa) versus control | 1 | 180 | Mean Difference (IV, Fixed, 95% CI) | 3.40 [‐7.51, 14.31] |
| 13.4 Norepinephrine versus control | 1 | 65 | Mean Difference (IV, Fixed, 95% CI) | ‐1.00 [‐3.18, 1.18] |
| 13.5 Low central venous pressure versus control | 1 | 86 | Mean Difference (IV, Fixed, 95% CI) | 0.0 [‐19.43, 19.43] |
| 13.6 Tranexamic acid versus aprotinin | 1 | 51 | Mean Difference (IV, Fixed, 95% CI) | 5.0 [‐2.69, 12.69] |
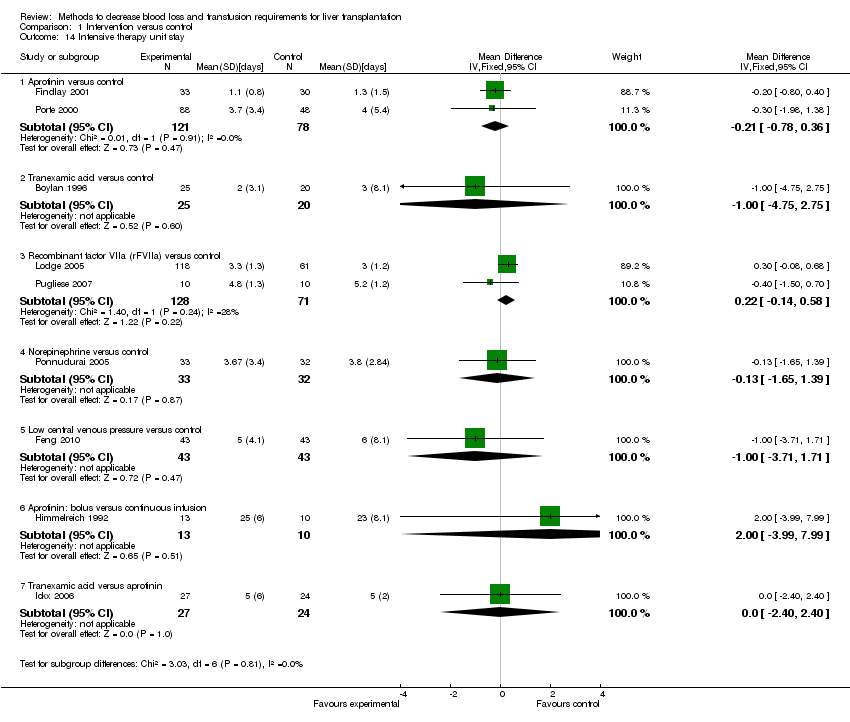
| 14 Intensive therapy unit stay Show forest plot | 9 | | Mean Difference (IV, Fixed, 95% CI) | Subtotals only |
|
| 14.1 Aprotinin versus control | 2 | 199 | Mean Difference (IV, Fixed, 95% CI) | ‐0.21 [‐0.78, 0.36] |
| 14.2 Tranexamic acid versus control | 1 | 45 | Mean Difference (IV, Fixed, 95% CI) | ‐1.0 [‐4.75, 2.75] |
| 14.3 Recombinant factor VIIa (rFVIIa) versus control | 2 | 199 | Mean Difference (IV, Fixed, 95% CI) | 0.22 [‐0.14, 0.58] |
| 14.4 Norepinephrine versus control | 1 | 65 | Mean Difference (IV, Fixed, 95% CI) | ‐0.13 [‐1.65, 1.39] |
| 14.5 Low central venous pressure versus control | 1 | 86 | Mean Difference (IV, Fixed, 95% CI) | ‐1.0 [‐3.71, 1.71] |
| 14.6 Aprotinin: bolus versus continuous infusion | 1 | 23 | Mean Difference (IV, Fixed, 95% CI) | 2.0 [‐3.99, 7.99] |
| 14.7 Tranexamic acid versus aprotinin | 1 | 51 | Mean Difference (IV, Fixed, 95% CI) | 0.0 [‐2.40, 2.40] |