Métodos para reducir la pérdida de sangre y la necesidad de transfusión en el trasplante hepático
Referencias
Referencias de los estudios incluidos en esta revisión
Referencias de los estudios excluidos de esta revisión
Referencias adicionales
Characteristics of studies
Characteristics of included studies [ordered by study ID]
Ir a:
| Methods | Randomised clinical trial. | |
| Participants | Country: Korea. | |
| Interventions | The patients were randomised to the following groups. | |
| Outcomes | The outcomes reported were thromboelastography parameters. None of the outcomes included in this review were reported. | |
| Notes | Attempts were made to contact the author in September 2011. | |
| Risk of bias | ||
| Bias | Authors' judgement | Support for judgement |
| Random sequence generation (selection bias) | Unclear risk | Comment: This information was not available. |
| Allocation concealment (selection bias) | Unclear risk | Comment: This information was not available. |
| Blinding of participants and personnel (performance bias) | Unclear risk | Comment: This information was not available. |
| Blinding of outcome assessment (detection bias) | Unclear risk | Comment: This information was not available. |
| Incomplete outcome data (attrition bias) | High risk | Comment: There were post‐randomisation drop‐outs. |
| Selective reporting (reporting bias) | High risk | Comment: Important outcomes were not reported. |
| Vested interest bias | Unclear risk | Comment: This information was not available. |
| Methods | Randomised clinical trial. | |
| Participants | Country: Italy. | |
| Interventions | The patients were randomised to the following groups. | |
| Outcomes | The outcomes reported were mortality, blood loss, and blood transfusion requirements. | |
| Notes | Attempts were made to contact the author in September 2011. | |
| Risk of bias | ||
| Bias | Authors' judgement | Support for judgement |
| Random sequence generation (selection bias) | Unclear risk | Comment: This information was not available. |
| Allocation concealment (selection bias) | Unclear risk | Comment: This information was not available. |
| Blinding of participants and personnel (performance bias) | Unclear risk | Comment: This information was not available. |
| Blinding of outcome assessment (detection bias) | Unclear risk | Comment: This information was not available. |
| Incomplete outcome data (attrition bias) | Unclear risk | Comment: This information was not available. |
| Selective reporting (reporting bias) | High risk | Comment: Important outcomes were not reported. |
| Vested interest bias | Unclear risk | Comment: This information was not available. |
| Methods | Randomised clinical trial. | |
| Participants | Country: Canada. | |
| Interventions | The patients were randomised to the following groups. | |
| Outcomes | The outcomes reported were mortality, retransplantation, hospital stay, and transfusion requirements. | |
| Notes | Attempts were made to contact the author in September 2011. | |
| Risk of bias | ||
| Bias | Authors' judgement | Support for judgement |
| Random sequence generation (selection bias) | Low risk | Quote: "Study agents were prepared by the hospital pharmacy using a randomisation schedule provided in sealed envelopes". |
| Allocation concealment (selection bias) | Low risk | Quote: "Study agents were prepared by the hospital pharmacy using a randomisation schedule provided in sealed envelopes; all other personnel were blinded to randomisation status". |
| Blinding of participants and personnel (performance bias) | Low risk | Quote: "Study agents were prepared by the hospital pharmacy using a randomisation schedule provided in sealed envelopes; all other personnel were blinded to randomisation status". |
| Blinding of outcome assessment (detection bias) | Low risk | Quote: "Study agents were prepared by the hospital pharmacy using a randomisation schedule provided in sealed envelopes; all other personnel were blinded to randomisation status". |
| Incomplete outcome data (attrition bias) | High risk | Comment: In a preliminary report, the authors had excluded two patients out of 30 patients. |
| Selective reporting (reporting bias) | High risk | Comment: Important outcomes were not reported. |
| Vested interest bias | Unclear risk | Comment: This information was not available. |
| Methods | Randomised clinical trial. | |
| Participants | Country: UK. | |
| Interventions | The patients were randomised to the following groups. | |
| Outcomes | The outcomes reported were fibrinolysis parameters. None of the outcomes of interest for this review were included in the report. | |
| Notes | Attempts were made to contact the author in September 2011. | |
| Risk of bias | ||
| Bias | Authors' judgement | Support for judgement |
| Random sequence generation (selection bias) | Unclear risk | Comment: This information was not available. |
| Allocation concealment (selection bias) | Unclear risk | Comment: This information was not available. |
| Blinding of participants and personnel (performance bias) | Unclear risk | Comment: This information was not available. |
| Blinding of outcome assessment (detection bias) | Unclear risk | Comment: This information was not available. |
| Incomplete outcome data (attrition bias) | Unclear risk | Comment: This information was not available. |
| Selective reporting (reporting bias) | High risk | Comment: Important outcomes were not reported. |
| Vested interest bias | Unclear risk | Comment: This information was not available. |
| Methods | Randomised clinical trial. | |
| Participants | Country: Spain. | |
| Interventions | The patients were randomised to the following groups. | |
| Outcomes | The outcomes reported were mortality, thrombotic events, and transfusion requirements. | |
| Notes | Attempts were made to contact the author in September 2011. | |
| Risk of bias | ||
| Bias | Authors' judgement | Support for judgement |
| Random sequence generation (selection bias) | Unclear risk | Comment: This information was not available. |
| Allocation concealment (selection bias) | Unclear risk | Comment: This information was not available. |
| Blinding of participants and personnel (performance bias) | Unclear risk | Comment: Although a placebo was used, the nature of the placebo was not stated. |
| Blinding of outcome assessment (detection bias) | Unclear risk | Comment: Although a placebo was used, the nature of the placebo was not stated. |
| Incomplete outcome data (attrition bias) | High risk | Comment: There were post‐randomisation drop‐outs. |
| Selective reporting (reporting bias) | High risk | Comment: Important outcomes were not reported. |
| Vested interest bias | Unclear risk | Comment: This information was not available. |
| Methods | Randomised clinical trial. | |
| Participants | Country: Spain. | |
| Interventions | The patients were randomised to the following groups. | |
| Outcomes | The outcomes reported were mortality, retransplantation, reoperation, complications, and blood transfusion requirements. | |
| Notes | Attempts were made to contact the author in September 2011. | |
| Risk of bias | ||
| Bias | Authors' judgement | Support for judgement |
| Random sequence generation (selection bias) | Low risk | Quote: "Drugs were prepared using a randomisation schedule provided in sealed envelopes". |
| Allocation concealment (selection bias) | Low risk | Quote: "Drugs were prepared using a randomisation schedule provided in sealed envelopes. The anesthesiologist, nurse, and surgeons were unaware of the details of the randomisation". |
| Blinding of participants and personnel (performance bias) | Low risk | Quote: "Both drugs were diluted in normal saline in order to administer them at a rate of 100 ml/h after the bolus dose... The anesthesiologist, nurse, and surgeons were unaware of the details of the randomisation". |
| Blinding of outcome assessment (detection bias) | Low risk | Quote: "Both drugs were diluted in normal saline in order to administer them at a rate of 100 ml/h after the bolus dose".. The anesthesiologist, nurse, and surgeons were unaware of the details of the randomisation". |
| Incomplete outcome data (attrition bias) | Low risk | Comment: There were no post‐randomisation drop‐outs. |
| Selective reporting (reporting bias) | High risk | Comment: Important outcomes were not reported. |
| Vested interest bias | Low risk | Quote: "This study has not been the recipient of any grant or other financial support". |
| Methods | Randomised clinical trial. | |
| Participants | Country: China. | |
| Interventions | The patients were randomised to the following groups. | |
| Outcomes | The outcomes reported were complications, hospital stay, blood loss, and blood transfusion requirements. | |
| Notes | Author replied to questions related to bias in October 2011. | |
| Risk of bias | ||
| Bias | Authors' judgement | Support for judgement |
| Random sequence generation (selection bias) | Low risk | Quote: 86 opaque sealed envelopes including 43 envelopes with the number ¡°1¡± and another 43 envelopes with the number ¡°2¡± were put into one locked box. Once the patient was chosen for protocol and informed consent was obtained, a staff took out one envelope from the locked box randomly. After opening the envelope, the number ¡°1¡± meant the patient was divided into ¡° the LCVP group¡±, while the number ¡°2¡± meant the patient was divided into ¡°the control group¡±. Comment: This method is similar to shuffling. This information was provided by author's replies to questions. |
| Allocation concealment (selection bias) | Low risk | Quote: 86 opaque sealed envelopes including 43 envelopes with the number ¡°1¡± and another 43 envelopes with the number ¡°2¡± were put into one locked box. Once the patient was chosen for protocol and informed consent was obtained, a staff took out one envelope from the locked box randomly. After opening the envelope, the number ¡°1¡± meant the patient was divided into ¡° the LCVP group¡±, while the number ¡°2¡± meant the patient was divided into ¡°the control group¡±. Comment: This method is similar to shuffling. This information was provided by author's replies to questions. |
| Blinding of participants and personnel (performance bias) | Unclear risk | Comment: This information was not available. |
| Blinding of outcome assessment (detection bias) | Unclear risk | Comment: This information was not available. |
| Incomplete outcome data (attrition bias) | Low risk | Quote: "There were no post‐randomisation drop‐outs". Comment: This information was provided by author's replies to questions. |
| Selective reporting (reporting bias) | High risk | Comment: Important outcomes were not reported. |
| Vested interest bias | Low risk | Quote: "This study was supported by grants from the National Science and Technology (S & T) major project, China (2008ZX10002‐026), and the Science and Technology Bureau of Zhejiang Province, China (2009C33091)." Comment: This information was provided by author's replies to questions. |
| Methods | Randomised clinical trial. | |
| Participants | Country: USA. | |
| Interventions | The patients were randomised to the following groups. | |
| Outcomes | The outcomes reported were mortality, serious adverse events, hospital stay, transfusion requirements. | |
| Notes | Author replied to questions related to risk of bias in October 2011. | |
| Risk of bias | ||
| Bias | Authors' judgement | Support for judgement |
| Random sequence generation (selection bias) | Low risk | Quote: "Randomization was by a stratified randomization scheme with 2 factors ‐ surgeon (one for each of 3 surgeons) and diagnosis (hepatitis or non‐hepatitis) for a total of 6 strata (3 surgeons x 2 diagnostic groups). For each stratum a blocked randomization list was produced by the Biostatistics group and maintained by the pharmacy. When a subject came to transplant pharmacy determined the stratum, selected the next envelope for that stratum and then issued the indicated trial medication (aprotinin or placebo) to the operating room". Comment: This information was provided by author's replies to questions. |
| Allocation concealment (selection bias) | Low risk | Quote: "Randomization was by a stratified randomization scheme with 2 factors ‐ surgeon (one for each of 3 surgeons) and diagnosis (hepatitis or non‐hepatitis) for a total of 6 strata (3 surgeons x 2 diagnostic groups). For each stratum a blocked randomization list was produced by the Biostatistics group and maintained by the pharmacy. When a subject came to transplant pharmacy determined the stratum, selected the next envelope for that stratum and then issued the indicated trial medication (aprotinin or placebo) to the operating room". Comment: This information was provided by author's replies to questions. |
| Blinding of participants and personnel (performance bias) | Low risk | Quote: "Subjects were randomised to the administration of either aprotinin or placebo (an equivalent infusion of normal saline)". |
| Blinding of outcome assessment (detection bias) | Low risk | Quote: "Subjects were randomised to the administration of either aprotinin or placebo (an equivalent infusion of normal saline)". |
| Incomplete outcome data (attrition bias) | Low risk | Quote: There were no post‐randomisation drop‐outs. Comment: This information was provided by author's replies to questions.. |
| Selective reporting (reporting bias) | High risk | Comment: Important outcomes were not reported. |
| Vested interest bias | High risk | Quote: Funding was partially by a grant from Bayer Pharmaceuticals (as noted in the original publication), partially from internal Mayo departmental funding. Comment: This information was provided by author's replies to questions.. |
| Methods | Randomised clinical trial. | |
| Participants | Country: USA. | |
| Interventions | The patients were randomised to the following groups. | |
| Outcomes | The outcomes reported were blood transfusion requirements. | |
| Notes | Attempts were made to contact the author in September 2011. | |
| Risk of bias | ||
| Bias | Authors' judgement | Support for judgement |
| Random sequence generation (selection bias) | Low risk | Quote: "Study drugs were prepared by the hospital pharmacy using a randomisation schedule; all other personnel were blinded to the randomisation. The researchers were informed about the contents of the blinded syringes after the study". |
| Allocation concealment (selection bias) | Low risk | Quote: "Study drugs were prepared by the hospital pharmacy using a randomisation schedule; all other personnel were blinded to the randomisation. The researchers were informed about the contents of the blinded syringes after the study". |
| Blinding of participants and personnel (performance bias) | Low risk | Quote: "Study drugs were prepared by the hospital pharmacy using a randomisation schedule; all other personnel were blinded to the randomisation. The researchers were informed about the contents of the blinded syringes after the study". |
| Blinding of outcome assessment (detection bias) | Low risk | Quote: "Study drugs were prepared by the hospital pharmacy using a randomisation schedule; all other personnel were blinded to the randomisation. The researchers were informed about the contents of the blinded syringes after the study". |
| Incomplete outcome data (attrition bias) | Unclear risk | Comment: This information was not available. |
| Selective reporting (reporting bias) | High risk | Comment: Important outcomes were not reported. |
| Vested interest bias | Unclear risk | Comment: This information was not available. |
| Methods | Randomised clinical trial. | |
| Participants | Country: Spain. | |
| Interventions | The patients were randomised to the following groups. | |
| Outcomes | The outcomes reported were mortality, retransplantation, reoperation due to bleeding, and transfusion requirements. | |
| Notes | Attempts were made to contact the author in September 2011. | |
| Risk of bias | ||
| Bias | Authors' judgement | Support for judgement |
| Random sequence generation (selection bias) | Unclear risk | Comment: This information was not available. |
| Allocation concealment (selection bias) | Unclear risk | Comment: This information was not available. |
| Blinding of participants and personnel (performance bias) | Low risk | Quote: "prospective, randomised, double‐blind, and placebo‐controlled trial". |
| Blinding of outcome assessment (detection bias) | Low risk | Quote: "prospective, randomised, double‐blind, and placebo‐controlled trial". |
| Incomplete outcome data (attrition bias) | Unclear risk | Comment: This information was not available. |
| Selective reporting (reporting bias) | High risk | Comment: Important outcomes were not reported. |
| Vested interest bias | Unclear risk | Comment: This information was not available. |
| Methods | Randomised clinical trial. | |
| Participants | Country: Germany. | |
| Interventions | The patients were randomised to the following groups. | |
| Outcomes | The outcomes reported were blood transfusion requirements. | |
| Notes | Attempts were made to contact the authors in September 2011. | |
| Risk of bias | ||
| Bias | Authors' judgement | Support for judgement |
| Random sequence generation (selection bias) | Unclear risk | Comment: This information was not available. |
| Allocation concealment (selection bias) | Unclear risk | Comment: This information was not available. |
| Blinding of participants and personnel (performance bias) | Unclear risk | Comment: Although a placebo was used, the nature of the placebo was not stated. |
| Blinding of outcome assessment (detection bias) | Unclear risk | Comment: Although a placebo was used, the nature of the placebo was not stated. |
| Incomplete outcome data (attrition bias) | High risk | Quote: "Two patients had to be excluded from statistical evaluation because of massive surgical haemorrhage and death during the study period". |
| Selective reporting (reporting bias) | High risk | Comment: Important outcomes were not reported. |
| Vested interest bias | Unclear risk | Comment: This information was not available. |
| Methods | Randomised clinical trial. | |
| Participants | Country: China. | |
| Interventions | The patients were randomised to the following groups. | |
| Outcomes | The outcomes reported were blood loss and blood transfusion requirements. | |
| Notes | Attempts were made to contact the author in September 2011. | |
| Risk of bias | ||
| Bias | Authors' judgement | Support for judgement |
| Random sequence generation (selection bias) | Unclear risk | Comment: This information was not available. |
| Allocation concealment (selection bias) | Unclear risk | Comment: This information was not available. |
| Blinding of participants and personnel (performance bias) | Unclear risk | Comment: This information was not available. |
| Blinding of outcome assessment (detection bias) | Unclear risk | Comment: This information was not available. |
| Incomplete outcome data (attrition bias) | Unclear risk | Comment: This information was not available. |
| Selective reporting (reporting bias) | High risk | Comment: Important outcomes were not reported. |
| Vested interest bias | Unclear risk | Comment: This information was not available. |
| Methods | Randomised clinical trial. | |
| Participants | Country: Germany. | |
| Interventions | The patients were randomised to the following groups. | |
| Outcomes | The outcomes reported were mortality, retransplantation, and transfusion requirements. | |
| Notes | Attempts were made to contact the author in September 2011. | |
| Risk of bias | ||
| Bias | Authors' judgement | Support for judgement |
| Random sequence generation (selection bias) | Unclear risk | Comment: This information was not available. |
| Allocation concealment (selection bias) | Unclear risk | Quote: "The patients were randomised by sealed envelopes with serial numbers containing the way of aprotinin administration". |
| Blinding of participants and personnel (performance bias) | Unclear risk | Comment: This information was not available. |
| Blinding of outcome assessment (detection bias) | Unclear risk | Comment: This information was not available. |
| Incomplete outcome data (attrition bias) | Unclear risk | Comment: This information was not available. |
| Selective reporting (reporting bias) | High risk | Comment: Important outcomes were not reported. |
| Vested interest bias | Unclear risk | Comment: This information was not available. |
| Methods | Randomised clinical trial. | |
| Participants | Country: Germany. | |
| Interventions | The patients were randomised to the following groups. | |
| Outcomes | The outcomes reported were retransplantation and blood transfusion requirements. | |
| Notes | Attempts were made to contact the author in September 2011. | |
| Risk of bias | ||
| Bias | Authors' judgement | Support for judgement |
| Random sequence generation (selection bias) | Unclear risk | Comment: This information was not available. |
| Allocation concealment (selection bias) | Unclear risk | Comment: This information was not available. |
| Blinding of participants and personnel (performance bias) | Unclear risk | Comment: This information was not available. |
| Blinding of outcome assessment (detection bias) | Unclear risk | Comment: This information was not available. |
| Incomplete outcome data (attrition bias) | Low risk | Quote: "In a consecutive series, twenty patients with final liver disease underwent their first OLT at the University Hospital Rudolf Virchow, Berlin, between August and November 1990". |
| Selective reporting (reporting bias) | High risk | Comment: Important outcomes were not reported. |
| Vested interest bias | Unclear risk | Comment: This information was not available. |
| Methods | Randomised clinical trial. | |
| Participants | Country: Belgium. | |
| Interventions | The patients were randomised to the following groups. | |
| Outcomes | The outcomes reported were blood loss and blood transfusion requirements. | |
| Notes | Attempts were made to contact the author in September 2011. | |
| Risk of bias | ||
| Bias | Authors' judgement | Support for judgement |
| Random sequence generation (selection bias) | Unclear risk | Comment: This information was not available. |
| Allocation concealment (selection bias) | Unclear risk | Comment: This information was not available. |
| Blinding of participants and personnel (performance bias) | Unclear risk | Comment: A placebo was used. It was not clear what was used for placebo. |
| Blinding of outcome assessment (detection bias) | Unclear risk | Comment: A placebo was used. It was not clear what was used for placebo. |
| Incomplete outcome data (attrition bias) | Unclear risk | Comment: This information was not available. |
| Selective reporting (reporting bias) | High risk | Comment: Important outcomes were not reported. |
| Vested interest bias | Unclear risk | Comment: This information was not available. |
| Methods | Randomised clinical trial. | |
| Participants | Country: Belgium. | |
| Interventions | The patients were randomised to the following groups. | |
| Outcomes | The outcomes reported were blood loss and blood transfusion requirements. | |
| Notes | Attempts were made to contact the author in September 2011. | |
| Risk of bias | ||
| Bias | Authors' judgement | Support for judgement |
| Random sequence generation (selection bias) | Unclear risk | Comment: This information was not available. |
| Allocation concealment (selection bias) | Unclear risk | Comment: This information was not available. |
| Blinding of participants and personnel (performance bias) | Unclear risk | Comment: This information was not available. |
| Blinding of outcome assessment (detection bias) | Unclear risk | Comment: This information was not available. |
| Incomplete outcome data (attrition bias) | Unclear risk | Comment: This information was not available. |
| Selective reporting (reporting bias) | High risk | Comment: Important outcomes were not reported. |
| Vested interest bias | Unclear risk | Comment: This information was not available. |
| Methods | Randomised clinical trial. | |
| Participants | Country: Belgium. | |
| Interventions | The patients were randomised to the following groups. Group 2: control (n = 24). | |
| Outcomes | The outcomes reported were mortality, hospital stay, blood loss, and blood transfusion requirements. | |
| Notes | Attempts were made to contact the author in September 2011. | |
| Risk of bias | ||
| Bias | Authors' judgement | Support for judgement |
| Random sequence generation (selection bias) | Unclear risk | Comment: This information was not available. |
| Allocation concealment (selection bias) | Unclear risk | Comment: This information was not available. |
| Blinding of participants and personnel (performance bias) | Unclear risk | Comment: This information was not available. |
| Blinding of outcome assessment (detection bias) | Unclear risk | Comment: This information was not available. |
| Incomplete outcome data (attrition bias) | Unclear risk | Comment: This information was not available. |
| Selective reporting (reporting bias) | High risk | Comment: Important outcomes were not reported. |
| Vested interest bias | High risk | Quote: "Drugs were provided by Choay, Bournonville, France". |
| Methods | Randomised clinical trial. | |
| Participants | Country: USA. | |
| Interventions | The patients were randomised to the following groups. | |
| Outcomes | The outcomes reported were mortality, primary non‐function, retransplantation, and blood transfusion requirements. | |
| Notes | Attempts were made to contact the author in September 2011. | |
| Risk of bias | ||
| Bias | Authors' judgement | Support for judgement |
| Random sequence generation (selection bias) | Low risk | Quote: "The infusions were prepared by the hospital pharmacy using a computer generated randomisation schedule. All investigators were blinded to the composition of the solutions". |
| Allocation concealment (selection bias) | Low risk | Quote: "The infusions were prepared by the hospital pharmacy using a computer generated randomisation schedule. All investigators were blinded to the composition of the solutions". |
| Blinding of participants and personnel (performance bias) | Low risk | Quote: "The infusions were prepared by the hospital pharmacy using a computer generated randomisation schedule. All investigators were blinded to the composition of the solutions". |
| Blinding of outcome assessment (detection bias) | Low risk | Quote: "The infusions were prepared by the hospital pharmacy using a computer generated randomisation schedule. All investigators were blinded to the composition of the solutions". |
| Incomplete outcome data (attrition bias) | Low risk | Quote: "After institutional review board approval and informed consent, a prospective, placebo‐controlled, double‐blind study was performed on 32 consecutive patients undergoing OLT". |
| Selective reporting (reporting bias) | High risk | Comment: Important outcomes were not reported. |
| Vested interest bias | Unclear risk | Comment: This information was not available. |
| Methods | Randomised clinical trial. | |
| Participants | Country: USA. | |
| Interventions | The patients were randomised to the following groups. | |
| Outcomes | The outcomes reported were volume of fluid transfused. None of the outcomes included in this review were reported in this trial. | |
| Notes | Attempts were made to contact the authors in September 2011. | |
| Risk of bias | ||
| Bias | Authors' judgement | Support for judgement |
| Random sequence generation (selection bias) | Unclear risk | Comment: This information was not available. |
| Allocation concealment (selection bias) | Unclear risk | Comment: This information was not available. |
| Blinding of participants and personnel (performance bias) | Unclear risk | Comment: This information was not available. |
| Blinding of outcome assessment (detection bias) | Unclear risk | Comment: This information was not available. |
| Incomplete outcome data (attrition bias) | Unclear risk | Comment: This information was not available. |
| Selective reporting (reporting bias) | High risk | Comment: Important outcomes were not reported. |
| Vested interest bias | Unclear risk | Comment: This information was not available. |
| Methods | Randomised clinical trial. | |
| Participants | Country: France. | |
| Interventions | The patients were randomised to the following groups. | |
| Outcomes | The outcomes reported were blood transfusion requirements. | |
| Notes | Attempts were made to contact the author in September 2011. | |
| Risk of bias | ||
| Bias | Authors' judgement | Support for judgement |
| Random sequence generation (selection bias) | Low risk | Quote: "Le protocole d’administration a été attribué au hasard par une table de randomisation". |
| Allocation concealment (selection bias) | Unclear risk | Comment: This information was not available. |
| Blinding of participants and personnel (performance bias) | Unclear risk | Comment: This information was not available. |
| Blinding of outcome assessment (detection bias) | Unclear risk | Comment: This information was not available. |
| Incomplete outcome data (attrition bias) | Unclear risk | Comment: This information was not available. |
| Selective reporting (reporting bias) | High risk | Comment: Important outcomes were not reported. |
| Vested interest bias | Unclear risk | Comment: This information was not available. |
| Methods | Randomised clinical trial. | |
| Participants | Country: Australia, Canada, Denmark, Germany, Spain, Sweden, United Kingdom. | |
| Interventions | The patients were randomised to the following groups. | |
| Outcomes | The outcomes reported were mortality, adverse events, hospital stay and transfusion requirements. | |
| Notes | Attempts were made to contact the author in September 2011. | |
| Risk of bias | ||
| Bias | Authors' judgement | Support for judgement |
| Random sequence generation (selection bias) | Unclear risk | Comment: This information was not available. |
| Allocation concealment (selection bias) | Unclear risk | Comment: This information was not available. |
| Blinding of participants and personnel (performance bias) | Unclear risk | Comment: Although the authors state it is a double blinded placebo controlled randomised trial, the nature of the placebo was not known. |
| Blinding of outcome assessment (detection bias) | Unclear risk | Comment: Although the authors state it is a double blinded placebo controlled randomised trial, the nature of the placebo was not known. |
| Incomplete outcome data (attrition bias) | High risk | Comment: There were post‐randomisation drop‐outs. |
| Selective reporting (reporting bias) | High risk | Comment: Important outcomes were not reported. |
| Vested interest bias | Unclear risk | Comment: This information was not available. |
| Methods | Randomised clinical trial. | |
| Participants | Country: USA. | |
| Interventions | The patients were randomised to the following groups. | |
| Outcomes | The outcomes reported were blood transfusion requirements. | |
| Notes | Attempts were made to contact the author in September 2011. | |
| Risk of bias | ||
| Bias | Authors' judgement | Support for judgement |
| Random sequence generation (selection bias) | Low risk | Quote: "Participants were randomised by a computer program to receive, via an infusion pump, identical volumes of aprotinin (n = 21) or normal saline solution (n = 23)". |
| Allocation concealment (selection bias) | Unclear risk | Comment: This information was not available. |
| Blinding of participants and personnel (performance bias) | Low risk | Quote: "After institutional review board approval and informed consent, a prospective, placebo‐controlled, double‐blind study was performed on 44 consecutive patients undergoing OLT with veno‐venous bypass". |
| Blinding of outcome assessment (detection bias) | Low risk | Quote: "After institutional review board approval and informed consent, a prospective, placebo‐controlled, double‐blind study was performed on 44 consecutive patients undergoing OLT with veno‐venous bypass". |
| Incomplete outcome data (attrition bias) | Low risk | Comment: There were no post‐randomisation drop‐outs. |
| Selective reporting (reporting bias) | High risk | Comment: Important outcomes were not reported. |
| Vested interest bias | Unclear risk | Comment: This information was not available. |
| Methods | Randomised clinical trial. | |
| Participants | Country: Netherlands. | |
| Interventions | The patients were randomised to the following groups. | |
| Outcomes | The outcomes reported were blood transfusion requirements. | |
| Notes | Attempts were made to contact the authors in September 2011. | |
| Risk of bias | ||
| Bias | Authors' judgement | Support for judgement |
| Random sequence generation (selection bias) | Unclear risk | Comment: This information was not available. |
| Allocation concealment (selection bias) | Unclear risk | Comment: This information was not available. |
| Blinding of participants and personnel (performance bias) | Unclear risk | Comment: Although the authors state that they used placebo, the nature of the placebo was not stated. |
| Blinding of outcome assessment (detection bias) | Unclear risk | Comment: Although the authors state that they used placebo, the nature of the placebo was not stated. |
| Incomplete outcome data (attrition bias) | Low risk | Comment: There were no post‐randomisation drop‐outs. |
| Selective reporting (reporting bias) | High risk | Comment: Important outcomes were not reported. |
| Vested interest bias | Unclear risk | Comment: This information was not available. |
| Methods | Randomised clinical trial. | |
| Participants | Country: United Kingdom. | |
| Interventions | The patients were randomised to the following groups. | |
| Outcomes | The outcomes reported were haemodynamic parameters. None of the outcomes of interest for this review were reported. | |
| Notes | Attempts were made to contact the authors in September 2011. | |
| Risk of bias | ||
| Bias | Authors' judgement | Support for judgement |
| Random sequence generation (selection bias) | Low risk | Quote: "Randomization was performed by a previously determined computer‐generated schedule using coded ampoules which were supplied by the manufacturer (Bayer plc) in identical case packs. The investigators were unaware of the coding schedule". |
| Allocation concealment (selection bias) | Low risk | Quote: "Randomization was performed by a previously determined computer‐generated schedule using coded ampoules which were supplied by the manufacturer (Bayer plc) in identical case packs. The investigators were unaware of the coding schedule". |
| Blinding of participants and personnel (performance bias) | Low risk | Quote: "Randomization was performed by a previously determined computer‐generated schedule using coded ampoules which were supplied by the manufacturer (Bayer plc) in identical case packs. The investigators were unaware of the coding schedule". |
| Blinding of outcome assessment (detection bias) | Low risk | Quote: "Randomization was performed by a previously determined computer‐generated schedule using coded ampoules which were supplied by the manufacturer (Bayer plc) in identical case packs. The investigators were unaware of the coding schedule". |
| Incomplete outcome data (attrition bias) | High risk | Comment: There were post‐randomisation drop‐outs. |
| Selective reporting (reporting bias) | High risk | Comment: Important outcomes were not reported. |
| Vested interest bias | High risk | Quote: "We thank Bayer Pharmaceuticals for their support and sponsorship". |
| Methods | Randomised clinical trial. | |
| Participants | Country: Denmark, Finland, Germany, Spain, USA. | |
| Interventions | The patients were randomised to the following groups. | |
| Outcomes | The outcomes reported were serious adverse events and blood transfusion requirements. | |
| Notes | Attempts were made to contact the author in September 2011. | |
| Risk of bias | ||
| Bias | Authors' judgement | Support for judgement |
| Random sequence generation (selection bias) | Unclear risk | Comment: This information was not available. |
| Allocation concealment (selection bias) | Unclear risk | Comment: This information was not available. |
| Blinding of participants and personnel (performance bias) | Unclear risk | Comment: Although the authors state placebo was used, the nature of the placebo was not stated. |
| Blinding of outcome assessment (detection bias) | Unclear risk | Comment: Although the authors state placebo was used, the nature of the placebo was not stated. |
| Incomplete outcome data (attrition bias) | High risk | Comment: There were post‐randomisation drop‐outs. |
| Selective reporting (reporting bias) | High risk | Comment: Important outcomes were not reported. |
| Vested interest bias | Unclear risk | Comment: This information was not available. |
| Methods | Randomised clinical trial. | |
| Participants | Country: USA. | |
| Interventions | The patients were randomised to the following groups. | |
| Outcomes | The outcomes reported were hospital stay and blood transfusion requirements. | |
| Notes | Attempts were made to contact the author in September 2011. | |
| Risk of bias | ||
| Bias | Authors' judgement | Support for judgement |
| Random sequence generation (selection bias) | Low risk | Quote: "Using a computer‐generated list of random numbers, patients were assigned to receive norepinephrine (vasopressor group) or IV fluids and isotonic saline (placebo group) by the research coordinator, who had no part in the clinical management of patients". |
| Allocation concealment (selection bias) | Low risk | Quote: "Using a computer‐generated list of random numbers, patients were assigned to receive norepinephrine (vasopressor group) or IV fluids and isotonic saline (placebo group) by the research coordinator, who had no part in the clinical management of patients". |
| Blinding of participants and personnel (performance bias) | Low risk | Quote: "The blinding of the investigators to isotonic saline or norepinephrine was done by the Department of Pharmacy at the UMDNJ. Blinding was maintained throughout the study period by pharmacists, who had no role in the clinical management of the study patients and data collection. The vasopressor and placebo were both colorless fluids". |
| Blinding of outcome assessment (detection bias) | Low risk | Quote: "The blinding of the investigators to isotonic saline or norepinephrine was done by the Department of Pharmacy at the UMDNJ. Blinding was maintained throughout the study period by pharmacists, who had no role in the clinical management of the study patients and data collection. The vasopressor and placebo were both colorless fluids". |
| Incomplete outcome data (attrition bias) | Unclear risk | Comment: This information was not available. |
| Selective reporting (reporting bias) | High risk | Comment: Important outcomes were not reported. |
| Vested interest bias | Unclear risk | Comment: This information was not available. |
| Methods | Randomised clinical trial. | |
| Participants | Country: Finland, Italy, Netherlands, Sweden. | |
| Interventions | The patients were randomised to the following groups. | |
| Outcomes | The outcomes reported were mortality, primary graft non‐function, retransplantation, reoperation, adverse effects, ITU stay, and blood transfusion requirements. | |
| Notes | Attempts were made to contact the authors in September 2011. | |
| Risk of bias | ||
| Bias | Authors' judgement | Support for judgement |
| Random sequence generation (selection bias) | Low risk | Comment: From the other details available in this trial, it is highly likely that the authors used an appropriate method of random sequence generation. |
| Allocation concealment (selection bias) | Low risk | Quote: "The trial drug was provided double blind by the manufacturer in blocks of 12 identical case packs. Each case pack contained all bottles for one patient, identifiable only by the sequence number". |
| Blinding of participants and personnel (performance bias) | Unclear risk | Quote: "The trial drug was provided double blind by the manufacturer in blocks of 12 identical case packs. Each case pack contained all bottles for one patient, identifiable only by the sequence number". |
| Blinding of outcome assessment (detection bias) | Unclear risk | Quote: "The trial drug was provided double blind by the manufacturer in blocks of 12 identical case packs. Each case pack contained all bottles for one patient, identifiable only by the sequence number". |
| Incomplete outcome data (attrition bias) | High risk | Comment: There were post‐randomisation drop‐outs. |
| Selective reporting (reporting bias) | High risk | Comment: Important outcomes were not reported. |
| Vested interest bias | High risk | Quote: "Aprotinin and placebo were donated by Bayer, Wuppertal, Germany". |
| Methods | Randomised clinical trial. | |
| Participants | Country: Italy. | |
| Interventions | The patients were randomised to the following groups. | |
| Outcomes | The outcomes reported were mortality, primary graft non‐function, ITU stay, and blood transfusion requirements (the transfusion requirements during the entire operation and immediate post‐operative period was not reported and so this information could not be used). | |
| Notes | Attempts were made to contact the authors in September 2011. | |
| Risk of bias | ||
| Bias | Authors' judgement | Support for judgement |
| Random sequence generation (selection bias) | Unclear risk | Comment: This information was not available. |
| Allocation concealment (selection bias) | Unclear risk | Comment: This information was not available. |
| Blinding of participants and personnel (performance bias) | Unclear risk | Comment: Although the authors state that a placebo was used, they do not state the nature of the placebo or the groups who knew whether the test drug was rFVIIa or placebo. |
| Blinding of outcome assessment (detection bias) | Unclear risk | Comment: Although the authors state that a placebo was used, they do not state the nature of the placebo or the groups who knew whether the test drug was rFVIIa or placebo. |
| Incomplete outcome data (attrition bias) | Unclear risk | Comment: This information was not available. |
| Selective reporting (reporting bias) | High risk | Comment: Important outcomes were not reported. |
| Vested interest bias | Unclear risk | Comment: This information was not available. |
| Methods | Randomised clinical trial. | |
| Participants | Country: Belarus. | |
| Interventions | The patients were randomised to the following groups. | |
| Outcomes | The outcomes reported were sepsis, blood loss, and blood transfusion requirements. | |
| Notes | Attempts were made to contact the author in September 2011. | |
| Risk of bias | ||
| Bias | Authors' judgement | Support for judgement |
| Random sequence generation (selection bias) | Unclear risk | Comment: This information was not available. |
| Allocation concealment (selection bias) | Unclear risk | Comment: This information was not available. |
| Blinding of participants and personnel (performance bias) | Unclear risk | Comment: This information was not available. |
| Blinding of outcome assessment (detection bias) | Unclear risk | Comment: This information was not available. |
| Incomplete outcome data (attrition bias) | Unclear risk | Comment: This information was not available. |
| Selective reporting (reporting bias) | High risk | Comment: Important outcomes were not reported. |
| Vested interest bias | Unclear risk | Comment: This information was not available. |
| Methods | Randomised clinical trial. | |
| Participants | Country: France. | |
| Interventions | The patients were randomised to the following groups. | |
| Outcomes | The outcomes reported were blood transfusion requirements. | |
| Notes | Attempts were made to contact the authors in September 2011. | |
| Risk of bias | ||
| Bias | Authors' judgement | Support for judgement |
| Random sequence generation (selection bias) | Low risk | Quote: "Using a computer‐generated list of random numbers, patients were assigned to receive norepinephrine (vasopressor group) or IV fluids and isotonic saline (placebo group) by the research coordinator, who had no part in the clinical management of patients". |
| Allocation concealment (selection bias) | Low risk | Quote: "Using a computer‐generated list of random numbers, patients were assigned to receive norepinephrine (vasopressor group) or IV fluids and isotonic saline (placebo group) by the research coordinator, who had no part in the clinical management of patients". |
| Blinding of participants and personnel (performance bias) | Low risk | Quote: "The blinding of the investigators to isotonic saline or norepinephrine was done by the Department of Pharmacy at the UMDNJ. Blinding was maintained throughout the study period by pharmacists, who had no role in the clinical management of the study patients and data collection. The vasopressor and placebo were both colorless fluids". |
| Blinding of outcome assessment (detection bias) | Low risk | Quote: "The blinding of the investigators to isotonic saline or norepinephrine was done by the Department of Pharmacy at the UMDNJ. Blinding was maintained throughout the study period by pharmacists, who had no role in the clinical management of the study patients and data collection. The vasopressor and placebo were both colorless fluids". |
| Incomplete outcome data (attrition bias) | Unclear risk | Comment: This information was not available. |
| Selective reporting (reporting bias) | High risk | Comment: Important outcomes were not reported. |
| Vested interest bias | Unclear risk | Comment: This information was not available. |
| Methods | Randomised clinical trial. | |
| Participants | Country: Taiwan. | |
| Interventions | The patients were randomised to the following groups. | |
| Outcomes | The outcomes reported were mortality, blood loss, and transfusion requirements. | |
| Notes | Attempts were made to contact the author in September 2011. | |
| Risk of bias | ||
| Bias | Authors' judgement | Support for judgement |
| Random sequence generation (selection bias) | Unclear risk | Comment: This information was not available. |
| Allocation concealment (selection bias) | Unclear risk | Comment: This information was not available. |
| Blinding of participants and personnel (performance bias) | Unclear risk | Comment: This information was not available. |
| Blinding of outcome assessment (detection bias) | Unclear risk | Comment: This information was not available. |
| Incomplete outcome data (attrition bias) | Unclear risk | Comment: This information was not available. |
| Selective reporting (reporting bias) | High risk | Comment: Important outcomes were not reported. |
| Vested interest bias | Unclear risk | Comment: This information was not available. |
| Methods | Randomised clinical trial. | |
| Participants | Country: United Kingdom. | |
| Interventions | The patients were randomised to the following groups. | |
| Outcomes | The outcomes reported were blood transfusion requirements. | |
| Notes | Attempts were made to contact the author in September 2011. | |
| Risk of bias | ||
| Bias | Authors' judgement | Support for judgement |
| Random sequence generation (selection bias) | Low risk | Quote: "Assignment was accomplished by the opening of a previously allocated, computer‐generated, randomly numbered envelope". |
| Allocation concealment (selection bias) | Unclear risk | Quote: "Assignment was accomplished by the opening of a previously allocated, computer‐generated, randomly numbered envelope". Comment: Further details were not available. |
| Blinding of participants and personnel (performance bias) | Unclear risk | Comment: This information was not available. |
| Blinding of outcome assessment (detection bias) | Unclear risk | Comment: This information was not available. |
| Incomplete outcome data (attrition bias) | High risk | Comment: There were post‐randomisation drop‐outs. |
| Selective reporting (reporting bias) | High risk | Comment: Important outcomes were not reported. |
| Vested interest bias | High risk | Quote: "Supported in part by Octapharma AG (Vienna, Austria)". |
| Methods | Randomised clinical trial. | |
| Participants | Country: United Kingdom. | |
| Interventions | The patients were randomised to the following groups. | |
| Outcomes | The outcomes reported were serious adverse effects, blood loss, and transfusion requirements. | |
| Notes | Attempts were made to contact the author in September 2011. | |
| Risk of bias | ||
| Bias | Authors' judgement | Support for judgement |
| Random sequence generation (selection bias) | Unclear risk | Comment: This information was not available. |
| Allocation concealment (selection bias) | Unclear risk | Comment: This information was not available. |
| Blinding of participants and personnel (performance bias) | Unclear risk | Comment: This information was not available. |
| Blinding of outcome assessment (detection bias) | Unclear risk | Comment: This information was not available. |
| Incomplete outcome data (attrition bias) | Unclear risk | Comment: This information was not available. |
| Selective reporting (reporting bias) | High risk | Comment: Important outcomes were not reported. |
| Vested interest bias | Unclear risk | Comment: This information was not available. |
Characteristics of excluded studies [ordered by study ID]
Ir a:
| Study | Reason for exclusion |
| Does not include patients undergoing liver transplantation. | |
| Not a randomised clinical trial. | |
| Not a randomised clinical trial. | |
| Not a randomised clinical trial. | |
| Review. | |
| Review. | |
| Letter to editor with reference to included trial. | |
| Review. | |
| Not a randomised clinical trial. | |
| Not a randomised clinical trial. | |
| Letter to editor with no data from RCT. | |
| Not a randomised clinical trial. | |
| Not a randomised clinical trial. | |
| Editorial. | |
| Editorial. | |
| Review. | |
| Editorial. | |
| Editorial. | |
| Not a randomised clinical trial. | |
| Letter to editor with no data from RCT. | |
| Review. | |
| Not a randomised clinical trial. | |
| Not a randomised clinical trial. |
RCT = randomised clinical trial.
Data and analyses
| Outcome or subgroup title | No. of studies | No. of participants | Statistical method | Effect size |
| 1 60‐day mortality Show forest plot | 14 | Risk Ratio (M‐H, Fixed, 95% CI) | Subtotals only | |
| Analysis 1.1  Comparison 1 Intervention versus control, Outcome 1 60‐day mortality. | ||||
| 1.1 Aprotinin versus control | 3 | 280 | Risk Ratio (M‐H, Fixed, 95% CI) | 0.52 [0.18, 1.45] |
| 1.2 Tranexamic acid versus control | 3 | 139 | Risk Ratio (M‐H, Fixed, 95% CI) | 0.55 [0.17, 1.76] |
| 1.3 Epsilon amino caproic acid (EACA) versus control | 1 | 62 | Risk Ratio (M‐H, Fixed, 95% CI) | 0.71 [0.13, 3.94] |
| 1.4 Antithrombin III versus control | 1 | 29 | Risk Ratio (M‐H, Fixed, 95% CI) | 0.24 [0.01, 4.65] |
| 1.5 Recombinant factor VIIa (rFVIIa) versus control | 3 | 286 | Risk Ratio (M‐H, Fixed, 95% CI) | 1.51 [0.33, 6.95] |
| 1.6 Aprotinin: bolus versus continuous infusion | 1 | 23 | Risk Ratio (M‐H, Fixed, 95% CI) | 0.0 [0.0, 0.0] |
| 1.7 Solvent detergent plasma versus standard fresh frozen plasma | 1 | 25 | Risk Ratio (M‐H, Fixed, 95% CI) | 0.0 [0.0, 0.0] |
| 1.8 Tranexamic acid versus EACA | 1 | 84 | Risk Ratio (M‐H, Fixed, 95% CI) | 1.0 [0.21, 4.67] |
| 1.9 Tranexamic acid versus aprotinin | 2 | 178 | Risk Ratio (M‐H, Fixed, 95% CI) | 4.12 [0.71, 23.76] |
| 2 Mortality at maximal follow‐up Show forest plot | 2 | Risk Ratio (M‐H, Fixed, 95% CI) | Subtotals only | |
| Analysis 1.2  Comparison 1 Intervention versus control, Outcome 2 Mortality at maximal follow‐up. | ||||
| 2.1 Antithrombin III versus control | 1 | 29 | Risk Ratio (M‐H, Fixed, 95% CI) | 0.25 [0.03, 1.85] |
| 2.2 Thromboelastography versus control | 1 | 28 | Risk Ratio (M‐H, Fixed, 95% CI) | 0.67 [0.13, 3.40] |
| 3 Primary graft non‐function Show forest plot | 4 | Risk Ratio (M‐H, Fixed, 95% CI) | Subtotals only | |
| Analysis 1.3  Comparison 1 Intervention versus control, Outcome 3 Primary graft non‐function. | ||||
| 3.1 Aprotinin versus control | 2 | 217 | Risk Ratio (M‐H, Fixed, 95% CI) | 0.15 [0.02, 1.25] |
| 3.2 Tranexamic acid versus control | 1 | 32 | Risk Ratio (M‐H, Fixed, 95% CI) | 3.0 [0.13, 68.57] |
| 3.3 Recombinant factor VIIa (rFVIIa) versus control | 1 | 20 | Risk Ratio (M‐H, Fixed, 95% CI) | 0.0 [0.0, 0.0] |
| 4 Retransplantation Show forest plot | 7 | Risk Ratio (M‐H, Random, 95% CI) | Subtotals only | |
| Analysis 1.4  Comparison 1 Intervention versus control, Outcome 4 Retransplantation. | ||||
| 4.1 Aprotinin versus control | 2 | 217 | Risk Ratio (M‐H, Random, 95% CI) | 0.21 [0.02, 1.79] |
| 4.2 Tranexamic acid versus control | 2 | 77 | Risk Ratio (M‐H, Random, 95% CI) | 0.79 [0.18, 3.48] |
| 4.3 Prostaglandin versus control | 1 | 20 | Risk Ratio (M‐H, Random, 95% CI) | 0.0 [0.0, 0.0] |
| 4.4 Aprotinin: bolus versus continuous infusion | 1 | 23 | Risk Ratio (M‐H, Random, 95% CI) | 0.77 [0.05, 10.85] |
| 4.5 Tranexamic acid versus aprotinin | 1 | 127 | Risk Ratio (M‐H, Random, 95% CI) | 2.95 [0.12, 71.17] |
| 5 Thromboembolic episodes Show forest plot | 12 | Risk Ratio (M‐H, Fixed, 95% CI) | Subtotals only | |
| Analysis 1.5  Comparison 1 Intervention versus control, Outcome 5 Thromboembolic episodes. | ||||
| 5.1 Aprotinin versus control | 3 | 280 | Risk Ratio (M‐H, Fixed, 95% CI) | 0.60 [0.18, 1.96] |
| 5.2 Tranexamic acid versus control | 5 | 179 | Risk Ratio (M‐H, Fixed, 95% CI) | 2.20 [0.38, 12.64] |
| 5.3 Epsilon amino caproic acid (EACA) versus control | 1 | 62 | Risk Ratio (M‐H, Fixed, 95% CI) | 0.95 [0.09, 9.89] |
| 5.4 Recombinant factor VIIa (rFVIIa) versus control | 2 | 266 | Risk Ratio (M‐H, Fixed, 95% CI) | 1.38 [0.65, 2.91] |
| 5.5 Tranexamic acid versus EACA | 1 | 84 | Risk Ratio (M‐H, Fixed, 95% CI) | 2.0 [0.39, 10.34] |
| 5.6 Tranexamic acid versus aprotinin | 2 | 178 | Risk Ratio (M‐H, Fixed, 95% CI) | 1.97 [0.37, 10.37] |
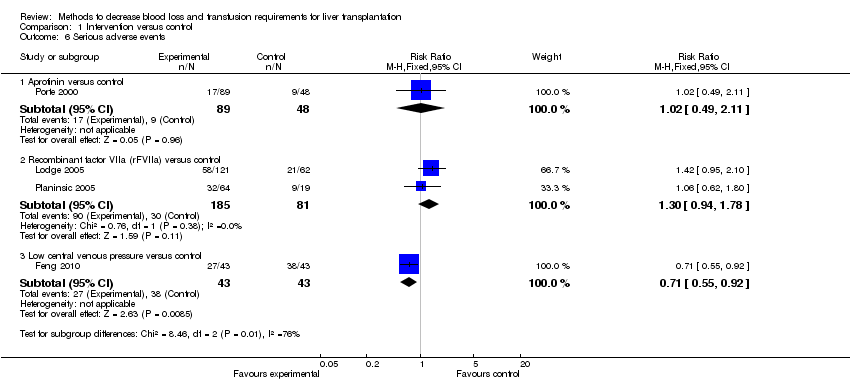
| 6 Serious adverse events Show forest plot | 4 | Risk Ratio (M‐H, Fixed, 95% CI) | Subtotals only | |
| Analysis 1.6  Comparison 1 Intervention versus control, Outcome 6 Serious adverse events. | ||||
| 6.1 Aprotinin versus control | 1 | 137 | Risk Ratio (M‐H, Fixed, 95% CI) | 1.02 [0.49, 2.11] |
| 6.2 Recombinant factor VIIa (rFVIIa) versus control | 2 | 266 | Risk Ratio (M‐H, Fixed, 95% CI) | 1.30 [0.94, 1.78] |
| 6.3 Low central venous pressure versus control | 1 | 86 | Risk Ratio (M‐H, Fixed, 95% CI) | 0.71 [0.55, 0.92] |
| 7 Blood loss Show forest plot | 11 | Mean Difference (IV, Random, 95% CI) | Subtotals only | |
| Analysis 1.7  Comparison 1 Intervention versus control, Outcome 7 Blood loss. | ||||
| 7.1 Aprotinin versus control | 3 | 195 | Mean Difference (IV, Random, 95% CI) | ‐1.36 [‐3.39, 0.66] |
| 7.2 Tranexamic acid versus control | 2 | 65 | Mean Difference (IV, Random, 95% CI) | ‐4.98 [‐10.18, 0.23] |
| 7.3 Antithrombin III versus control | 1 | 29 | Mean Difference (IV, Random, 95% CI) | 1.9 [‐4.86, 8.66] |
| 7.4 Thromboelastography versus control | 2 | 62 | Mean Difference (IV, Random, 95% CI) | ‐1.13 [‐1.85, ‐0.41] |
| 7.5 Low central venous pressure versus control | 1 | 86 | Mean Difference (IV, Random, 95% CI) | ‐1.19 [‐1.88, ‐0.50] |
| 7.6 Tranexamic acid versus aprotinin | 2 | 71 | Mean Difference (IV, Random, 95% CI) | ‐1.01 [‐2.31, 0.29] |
| 8 Red‐cell or whole blood transfusion Show forest plot | 4 | Risk Ratio (M‐H, Fixed, 95% CI) | Subtotals only | |
| Analysis 1.8  Comparison 1 Intervention versus control, Outcome 8 Red‐cell or whole blood transfusion. | ||||
| 8.1 Aprotinin versus control | 1 | 80 | Risk Ratio (M‐H, Fixed, 95% CI) | 0.68 [0.40, 1.18] |
| 8.2 Tranexamic acid versus control | 1 | 62 | Risk Ratio (M‐H, Fixed, 95% CI) | 0.77 [0.60, 0.98] |
| 8.3 Epsilon amino caproic acid (EACA) versus control | 1 | 62 | Risk Ratio (M‐H, Fixed, 95% CI) | 0.90 [0.77, 1.06] |
| 8.4 Recombinant factor VIIa (rFVIIa) versus control | 1 | 182 | Risk Ratio (M‐H, Fixed, 95% CI) | 0.91 [0.86, 0.97] |
| 8.5 Tranexamic acid versus EACA | 1 | 84 | Risk Ratio (M‐H, Fixed, 95% CI) | 0.81 [0.64, 1.02] |
| 8.6 Tranexamic acid versus aprotinin | 1 | 127 | Risk Ratio (M‐H, Fixed, 95% CI) | 0.94 [0.71, 1.23] |
| 9 Red cell or whole blood transfusion Show forest plot | 29 | Std. Mean Difference (IV, Fixed, 95% CI) | Subtotals only | |
| Analysis 1.9  Comparison 1 Intervention versus control, Outcome 9 Red cell or whole blood transfusion. | ||||
| 9.1 Aprotinin versus control | 8 | 375 | Std. Mean Difference (IV, Fixed, 95% CI) | ‐0.61 [‐0.82, ‐0.40] |
| 9.2 Tranexamic acid versus control | 4 | 159 | Std. Mean Difference (IV, Fixed, 95% CI) | ‐0.27 [‐0.59, 0.06] |
| 9.3 Epsilon amino caproic acid (EACA) versus control | 1 | 62 | Std. Mean Difference (IV, Fixed, 95% CI) | ‐0.17 [‐0.71, 0.36] |
| 9.4 Antithrombin III versus control | 1 | 29 | Std. Mean Difference (IV, Fixed, 95% CI) | ‐0.04 [‐0.77, 0.69] |
| 9.5 Recombinant factor VIIa (rFVIIa) versus control | 2 | 221 | Std. Mean Difference (IV, Fixed, 95% CI) | ‐0.05 [‐0.32, 0.23] |
| 9.6 Oestrogen versus control | 1 | 30 | Std. Mean Difference (IV, Fixed, 95% CI) | ‐0.58 [‐1.32, 0.15] |
| 9.7 Prostaglandin versus control | 1 | 20 | Std. Mean Difference (IV, Fixed, 95% CI) | ‐0.04 [‐0.92, 0.83] |
| 9.8 Norepinephrine versus control | 1 | 65 | Std. Mean Difference (IV, Fixed, 95% CI) | ‐0.04 [‐0.53, 0.44] |
| 9.9 Thromboelastography versus control | 2 | 62 | Std. Mean Difference (IV, Fixed, 95% CI) | ‐0.73 [‐1.25, ‐0.20] |
| 9.10 Low central venous pressure versus control | 1 | 86 | Std. Mean Difference (IV, Fixed, 95% CI) | ‐1.17 [‐1.62, ‐0.71] |
| 9.11 Aprotinin: bolus versus continuous infusion | 1 | 23 | Std. Mean Difference (IV, Fixed, 95% CI) | 0.86 [‐0.00, 1.73] |
| 9.12 Aprotinin: high dose versus medium dose | 1 | 189 | Std. Mean Difference (IV, Fixed, 95% CI) | 0.16 [‐0.12, 0.45] |
| 9.13 Aprotinin: high dose versus low dose | 1 | 20 | Std. Mean Difference (IV, Fixed, 95% CI) | ‐1.46 [‐2.47, ‐0.45] |
| 9.14 Whole blood versus blood components | 1 | 33 | Std. Mean Difference (IV, Fixed, 95% CI) | ‐0.04 [‐0.72, 0.65] |
| 9.15 Solvent detergent plasma versus standard fresh frozen plasma | 1 | 25 | Std. Mean Difference (IV, Fixed, 95% CI) | 0.19 [‐0.60, 0.98] |
| 9.16 Tranexamic acid versus EACA | 1 | 84 | Std. Mean Difference (IV, Fixed, 95% CI) | ‐0.23 [‐0.66, 0.20] |
| 9.17 Tranexamic acid versus aprotinin | 3 | 198 | Std. Mean Difference (IV, Fixed, 95% CI) | ‐0.09 [‐0.36, 0.19] |
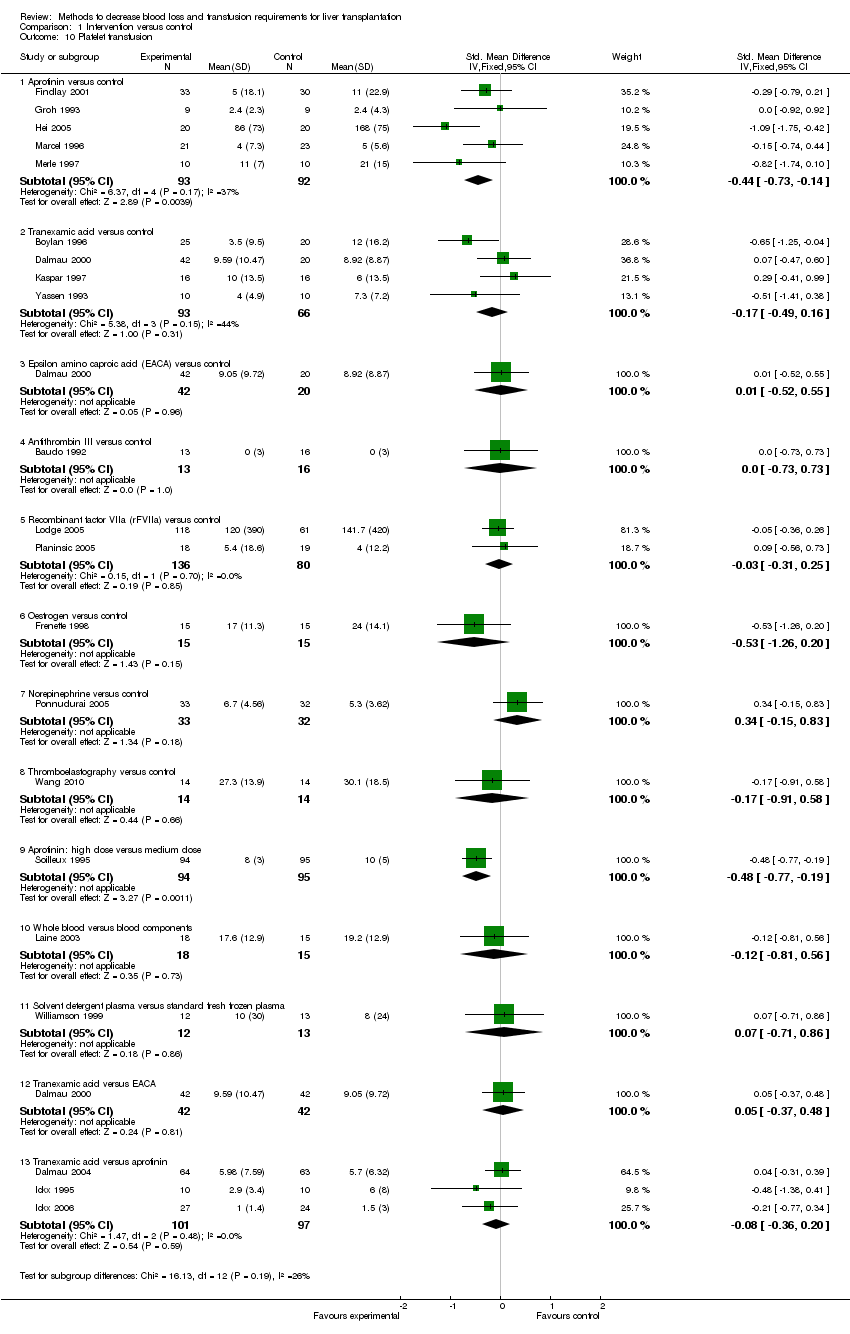
| 10 Platelet transfusion Show forest plot | 21 | Std. Mean Difference (IV, Fixed, 95% CI) | Subtotals only | |
| Analysis 1.10  Comparison 1 Intervention versus control, Outcome 10 Platelet transfusion. | ||||
| 10.1 Aprotinin versus control | 5 | 185 | Std. Mean Difference (IV, Fixed, 95% CI) | ‐0.44 [‐0.73, ‐0.14] |
| 10.2 Tranexamic acid versus control | 4 | 159 | Std. Mean Difference (IV, Fixed, 95% CI) | ‐0.17 [‐0.49, 0.16] |
| 10.3 Epsilon amino caproic acid (EACA) versus control | 1 | 62 | Std. Mean Difference (IV, Fixed, 95% CI) | 0.01 [‐0.52, 0.55] |
| 10.4 Antithrombin III versus control | 1 | 29 | Std. Mean Difference (IV, Fixed, 95% CI) | 0.0 [‐0.73, 0.73] |
| 10.5 Recombinant factor VIIa (rFVIIa) versus control | 2 | 216 | Std. Mean Difference (IV, Fixed, 95% CI) | ‐0.03 [‐0.31, 0.25] |
| 10.6 Oestrogen versus control | 1 | 30 | Std. Mean Difference (IV, Fixed, 95% CI) | ‐0.53 [‐1.26, 0.20] |
| 10.7 Norepinephrine versus control | 1 | 65 | Std. Mean Difference (IV, Fixed, 95% CI) | 0.34 [‐0.15, 0.83] |
| 10.8 Thromboelastography versus control | 1 | 28 | Std. Mean Difference (IV, Fixed, 95% CI) | ‐0.17 [‐0.91, 0.58] |
| 10.9 Aprotinin: high dose versus medium dose | 1 | 189 | Std. Mean Difference (IV, Fixed, 95% CI) | ‐0.48 [‐0.77, ‐0.19] |
| 10.10 Whole blood versus blood components | 1 | 33 | Std. Mean Difference (IV, Fixed, 95% CI) | ‐0.12 [‐0.81, 0.56] |
| 10.11 Solvent detergent plasma versus standard fresh frozen plasma | 1 | 25 | Std. Mean Difference (IV, Fixed, 95% CI) | 0.07 [‐0.71, 0.86] |
| 10.12 Tranexamic acid versus EACA | 1 | 84 | Std. Mean Difference (IV, Fixed, 95% CI) | 0.05 [‐0.37, 0.48] |
| 10.13 Tranexamic acid versus aprotinin | 3 | 198 | Std. Mean Difference (IV, Fixed, 95% CI) | ‐0.08 [‐0.36, 0.20] |
| 11 Plasma transfusion Show forest plot | 25 | Std. Mean Difference (IV, Fixed, 95% CI) | Subtotals only | |
| Analysis 1.11  Comparison 1 Intervention versus control, Outcome 11 Plasma transfusion. | ||||
| 11.1 Aprotinin versus control | 8 | 420 | Std. Mean Difference (IV, Fixed, 95% CI) | ‐0.33 [‐0.53, ‐0.13] |
| 11.2 Tranexamic acid versus control | 4 | 159 | Std. Mean Difference (IV, Fixed, 95% CI) | ‐0.21 [‐0.53, 0.11] |
| 11.3 Epsilon amino caproic acid (EACA) versus control | 1 | 62 | Std. Mean Difference (IV, Fixed, 95% CI) | ‐0.12 [‐0.66, 0.41] |
| 11.4 Antithrombin III versus control | 1 | 29 | Std. Mean Difference (IV, Fixed, 95% CI) | 0.04 [‐0.69, 0.77] |
| 11.5 Recombinant factor VIIa (rFVIIa) versus control | 2 | 262 | Std. Mean Difference (IV, Fixed, 95% CI) | ‐0.01 [‐0.28, 0.25] |
| 11.6 Oestrogen versus control | 1 | 30 | Std. Mean Difference (IV, Fixed, 95% CI) | ‐0.67 [‐1.41, 0.07] |
| 11.7 Prostaglandin versus control | 1 | 20 | Std. Mean Difference (IV, Fixed, 95% CI) | 0.0 [‐0.88, 0.88] |
| 11.8 Norepinephrine versus control | 1 | 65 | Std. Mean Difference (IV, Fixed, 95% CI) | 0.11 [‐0.38, 0.60] |
| 11.9 Thromboelastography versus control | 1 | 28 | Std. Mean Difference (IV, Fixed, 95% CI) | ‐0.82 [‐1.60, ‐0.05] |
| 11.10 Aprotinin: bolus versus continuous infusion | 1 | 23 | Std. Mean Difference (IV, Fixed, 95% CI) | 0.05 [‐0.78, 0.87] |
| 11.11 Aprotinin: high dose versus medium dose | 1 | 189 | Std. Mean Difference (IV, Fixed, 95% CI) | 0.06 [‐0.22, 0.35] |
| 11.12 Aprotinin: high dose versus low dose | 1 | 20 | Std. Mean Difference (IV, Fixed, 95% CI) | ‐1.31 [‐2.29, ‐0.32] |
| 11.13 Whole blood versus blood components | 1 | 33 | Std. Mean Difference (IV, Fixed, 95% CI) | ‐1.53 [‐2.32, ‐0.74] |
| 11.14 Tranexamic acid versus EACA | 1 | 84 | Std. Mean Difference (IV, Fixed, 95% CI) | ‐0.22 [‐0.65, 0.21] |
| 11.15 Tranexamic acid versus aprotinin | 2 | 71 | Std. Mean Difference (IV, Fixed, 95% CI) | 0.02 [‐0.45, 0.48] |
| 12 Cryoprecipitate Show forest plot | 12 | Std. Mean Difference (IV, Fixed, 95% CI) | Subtotals only | |
| Analysis 1.12  Comparison 1 Intervention versus control, Outcome 12 Cryoprecipitate. | ||||
| 12.1 Aprotinin versus control | 3 | 147 | Std. Mean Difference (IV, Fixed, 95% CI) | ‐0.49 [‐0.82, ‐0.16] |
| 12.2 Tranexamic acid versus control | 4 | 181 | Std. Mean Difference (IV, Fixed, 95% CI) | ‐0.27 [‐0.57, 0.02] |
| 12.3 Epsilon amino caproic acid (EACA) versus control | 1 | 62 | Std. Mean Difference (IV, Fixed, 95% CI) | 0.00 [‐0.53, 0.54] |
| 12.4 Antithrombin III versus control | 1 | 29 | Std. Mean Difference (IV, Fixed, 95% CI) | 0.0 [‐0.73, 0.73] |
| 12.5 Oestrogen versus control | 1 | 30 | Std. Mean Difference (IV, Fixed, 95% CI) | 0.0 [‐0.72, 0.72] |
| 12.6 Thromboelastography versus control | 1 | 28 | Std. Mean Difference (IV, Fixed, 95% CI) | ‐0.25 [1.00, 0.49] |
| 12.7 Whole blood versus blood components | 1 | 33 | Std. Mean Difference (IV, Fixed, 95% CI) | ‐0.28 [‐0.97, 0.41] |
| 12.8 Solvent detergent plasma versus standard fresh frozen plasma | 1 | 25 | Std. Mean Difference (IV, Fixed, 95% CI) | 0.10 [‐0.68, 0.89] |
| 12.9 Tranexamic acid versus EACA | 1 | 62 | Std. Mean Difference (IV, Fixed, 95% CI) | ‐0.15 [‐0.69, 0.38] |
| 13 Hospital stay Show forest plot | 6 | Mean Difference (IV, Fixed, 95% CI) | Subtotals only | |
| Analysis 1.13  Comparison 1 Intervention versus control, Outcome 13 Hospital stay. | ||||
| 13.1 Aprotinin versus control | 1 | 63 | Mean Difference (IV, Fixed, 95% CI) | 0.0 [‐4.94, 4.94] |
| 13.2 Tranexamic acid versus control | 1 | 45 | Mean Difference (IV, Fixed, 95% CI) | 4.0 [‐16.18, 24.18] |
| 13.3 Recombinant factor VIIa (rFVIIa) versus control | 1 | 180 | Mean Difference (IV, Fixed, 95% CI) | 3.40 [‐7.51, 14.31] |
| 13.4 Norepinephrine versus control | 1 | 65 | Mean Difference (IV, Fixed, 95% CI) | ‐1.00 [‐3.18, 1.18] |
| 13.5 Low central venous pressure versus control | 1 | 86 | Mean Difference (IV, Fixed, 95% CI) | 0.0 [‐19.43, 19.43] |
| 13.6 Tranexamic acid versus aprotinin | 1 | 51 | Mean Difference (IV, Fixed, 95% CI) | 5.0 [‐2.69, 12.69] |
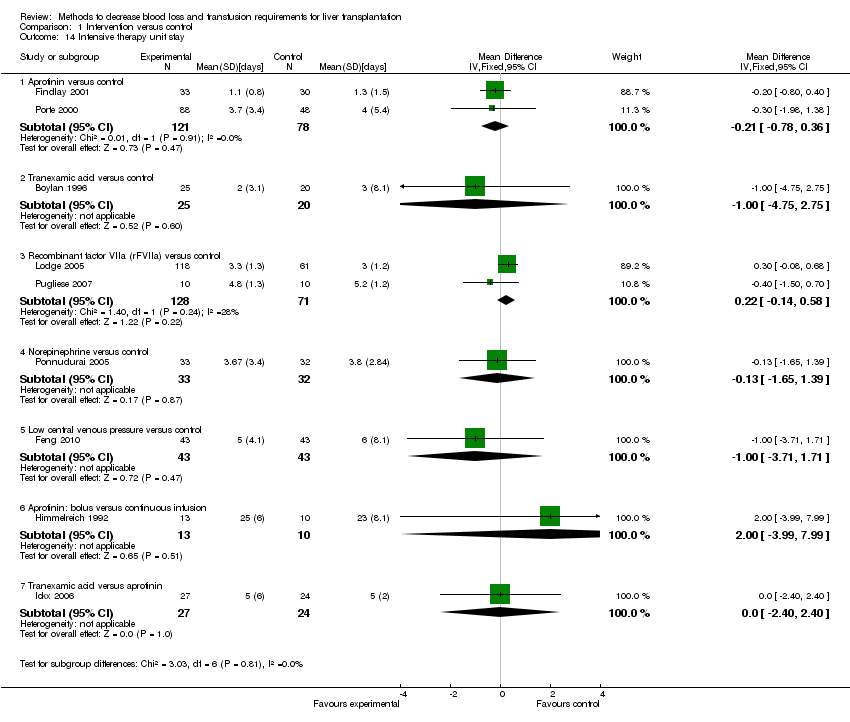
| 14 Intensive therapy unit stay Show forest plot | 9 | Mean Difference (IV, Fixed, 95% CI) | Subtotals only | |
| Analysis 1.14  Comparison 1 Intervention versus control, Outcome 14 Intensive therapy unit stay. | ||||
| 14.1 Aprotinin versus control | 2 | 199 | Mean Difference (IV, Fixed, 95% CI) | ‐0.21 [‐0.78, 0.36] |
| 14.2 Tranexamic acid versus control | 1 | 45 | Mean Difference (IV, Fixed, 95% CI) | ‐1.0 [‐4.75, 2.75] |
| 14.3 Recombinant factor VIIa (rFVIIa) versus control | 2 | 199 | Mean Difference (IV, Fixed, 95% CI) | 0.22 [‐0.14, 0.58] |
| 14.4 Norepinephrine versus control | 1 | 65 | Mean Difference (IV, Fixed, 95% CI) | ‐0.13 [‐1.65, 1.39] |
| 14.5 Low central venous pressure versus control | 1 | 86 | Mean Difference (IV, Fixed, 95% CI) | ‐1.0 [‐3.71, 1.71] |
| 14.6 Aprotinin: bolus versus continuous infusion | 1 | 23 | Mean Difference (IV, Fixed, 95% CI) | 2.0 [‐3.99, 7.99] |
| 14.7 Tranexamic acid versus aprotinin | 1 | 51 | Mean Difference (IV, Fixed, 95% CI) | 0.0 [‐2.40, 2.40] |

Study flow diagram.

Risk of bias graph: review authors' judgements about each risk of bias item presented as percentages across all included studies.
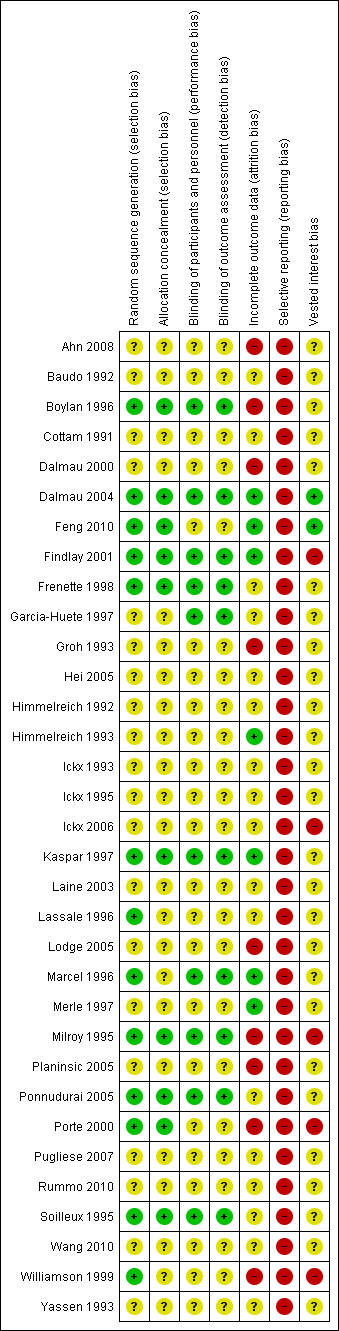
Risk of bias summary: review authors' judgements about each risk of bias item for each included study.

Trial sequential analysis (60‐day mortality) ‐ aprotinin versus control.
The blue line indicates the cumulative Z‐curve.
Current information size: 280 patients; required information size: 15,302. information fraction: 1.83%.
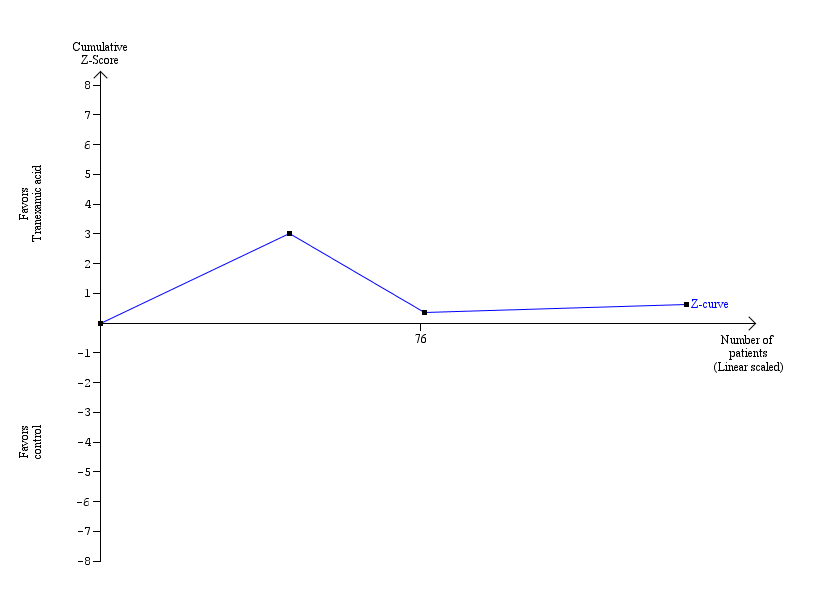
Trial sequential analysis (60‐day mortality) ‐ tranexamic acid versus control.
The blue line indicates the cumulative Z‐curve.
Current information size: 139 patients; required information size: 18,706. information fraction: 0.74%.
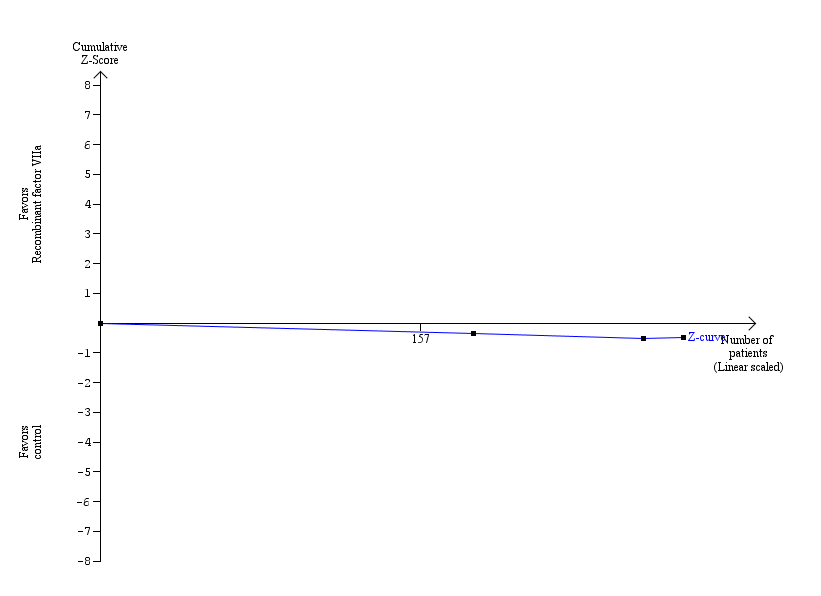
Trial sequential analysis (60‐day mortality) ‐ recombinant factor VIIa versus control.
The blue line indicates the cumulative Z‐curve.
Current information size: 286 patients; required information size: 15,302. information fraction: 1.87%.

Trial sequential analysis (60‐day mortality) ‐ tranexamic acid versus aprotinin.
The blue line indicates the cumulative Z‐curve.
Current information size: 178 patients; required information size: 15,302. information fraction: 1.16%.
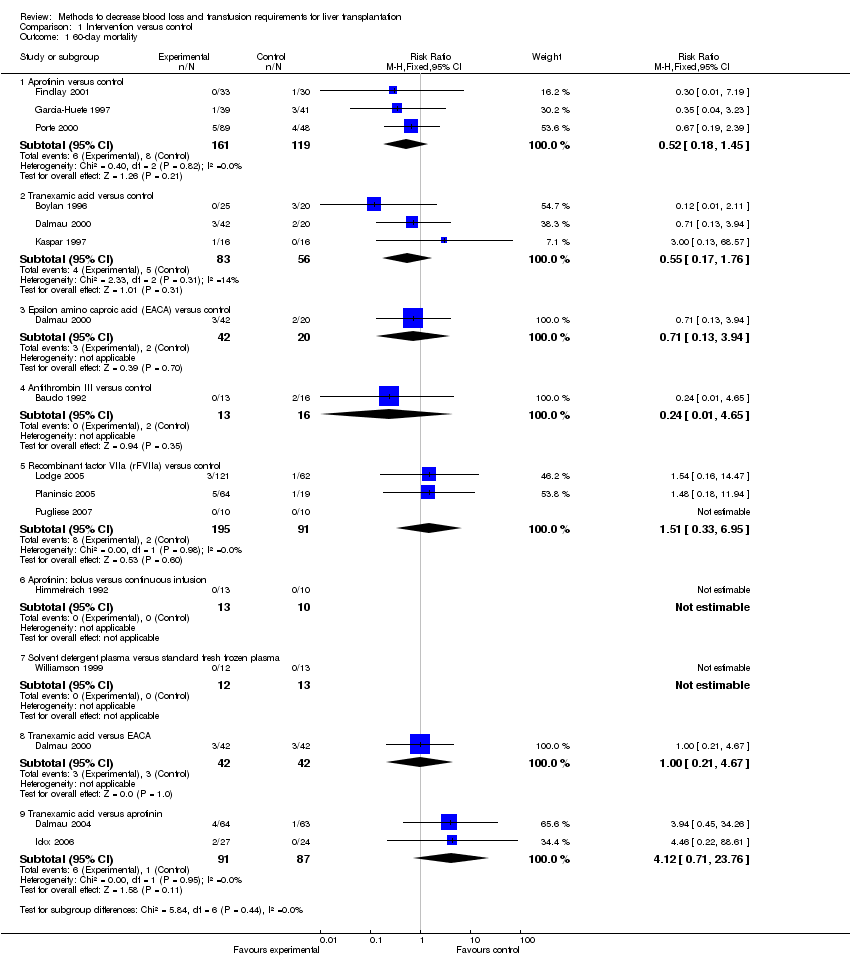
Comparison 1 Intervention versus control, Outcome 1 60‐day mortality.

Comparison 1 Intervention versus control, Outcome 2 Mortality at maximal follow‐up.

Comparison 1 Intervention versus control, Outcome 3 Primary graft non‐function.

Comparison 1 Intervention versus control, Outcome 4 Retransplantation.

Comparison 1 Intervention versus control, Outcome 5 Thromboembolic episodes.
Comparison 1 Intervention versus control, Outcome 6 Serious adverse events.

Comparison 1 Intervention versus control, Outcome 7 Blood loss.

Comparison 1 Intervention versus control, Outcome 8 Red‐cell or whole blood transfusion.

Comparison 1 Intervention versus control, Outcome 9 Red cell or whole blood transfusion.
Comparison 1 Intervention versus control, Outcome 10 Platelet transfusion.

Comparison 1 Intervention versus control, Outcome 11 Plasma transfusion.

Comparison 1 Intervention versus control, Outcome 12 Cryoprecipitate.

Comparison 1 Intervention versus control, Outcome 13 Hospital stay.
Comparison 1 Intervention versus control, Outcome 14 Intensive therapy unit stay.
| Intervention versus control for liver transplantation | ||||||
| Patient or population: Patients with liver transplantation. | ||||||
| Outcomes | Illustrative comparative risks* (95% CI) | Relative effect | No of Participants | Quality of the evidence | Comments | |
| Assumed risk | Corresponding risk | |||||
| Control | Intervention versus control | |||||
| 60‐day mortality ‐ Aprotinin versus control | Study population | RR 0.52 | 280 | ⊕⊝⊝⊝ | ||
| 67 per 1000 | 35 per 1000 | |||||
| Moderate | ||||||
| 73 per 1000 | 38 per 1000 | |||||
| 60‐day mortality ‐ Tranexamic acid versus control | Study population | RR 0.55 | 139 | ⊕⊝⊝⊝ | ||
| 89 per 1000 | 49 per 1000 | |||||
| Moderate | ||||||
| 100 per 1000 | 55 per 1000 | |||||
| 60‐day mortality ‐ Recombinant factor VIIa (rFVIIa) versus control | Study population | RR 1.51 | 286 | ⊕⊝⊝⊝ | ||
| 22 per 1000 | 33 per 1000 | |||||
| Moderate | ||||||
| 16 per 1000 | 24 per 1000 | |||||
| 60‐day mortality ‐ Tranexamic acid versus aprotinin | Study population | RR 4.12 | 178 | ⊕⊝⊝⊝ | ||
| 11 per 1000 | 47 per 1000 | |||||
| Moderate | ||||||
| 8 per 1000 | 33 per 1000 | |||||
| Primary graft non‐function ‐ Aprotinin versus control | Study population | RR 0.15 | 217 | ⊕⊝⊝⊝ | ||
| 45 per 1000 | 7 per 1000 | |||||
| Moderate | ||||||
| 45 per 1000 | 7 per 1000 | |||||
| Retransplantation ‐ Aprotinin versus control | Study population | RR 0.21 | 217 | ⊕⊝⊝⊝ | ||
| 67 per 1000 | 14 per 1000 | |||||
| Moderate | ||||||
| 66 per 1000 | 14 per 1000 | |||||
| Retransplantation ‐ Tranexamic acid versus control | Study population | RR 0.79 | 77 | ⊕⊝⊝⊝ | ||
| 83 per 1000 | 66 per 1000 | |||||
| Moderate | ||||||
| 75 per 1000 | 59 per 1000 | |||||
| *The basis for the assumed risk (e.g. the median control group risk across studies) is provided in footnotes. The corresponding risk (and its 95% confidence interval) is based on the assumed risk in the comparison group and the relative effect of the intervention (and its 95% CI). | ||||||
| GRADE Working Group grades of evidence | ||||||
| 1 All trials were at high risk of bias, | ||||||
| Intervention versus control for liver transplantation | ||||||
| Patient or population: Patients with liver transplantation. | ||||||
| Outcomes | Illustrative comparative risks* (95% CI) | Relative effect | No of Participants | Quality of the evidence | Comments | |
| Assumed risk | Corresponding risk | |||||
| Control | Intervention versus control | |||||
| Thromboembolic episodes ‐ Aprotinin versus control | Study population | RR 0.6 | 280 | ⊕⊝⊝⊝ | ||
| 42 per 1000 | 25 per 1000 | |||||
| Moderate | ||||||
| 63 per 1000 | 38 per 1000 | |||||
| Thromboembolic episodes ‐ Tranexamic acid versus control | Study population | RR 2.2 | 179 | ⊕⊝⊝⊝ | ||
| 13 per 1000 | 29 per 1000 | |||||
| Thromboembolic episodes ‐ Recombinant factor VIIa (rFVIIa) versus control | Study population | RR 1.38 | 266 | ⊕⊝⊝⊝ | ||
| 99 per 1000 | 136 per 1000 | |||||
| Moderate | ||||||
| 101 per 1000 | 139 per 1000 | |||||
| Serious adverse events ‐ Recombinant factor VIIa (rFVIIa) versus control | Study population | RR 1.3 | 266 | ⊕⊝⊝⊝ | ||
| 370 per 1000 | 481 per 1000 | |||||
| Moderate | ||||||
| 406 per 1000 | 528 per 1000 | |||||
| *The basis for the assumed risk (e.g. the median control group risk across studies) is provided in footnotes. The corresponding risk (and its 95% confidence interval) is based on the assumed risk in the comparison group and the relative effect of the intervention (and its 95% CI). | ||||||
| GRADE Working Group grades of evidence | ||||||
| 1 All trials were at high risk of bias, | ||||||
| Intervention versus control for liver transplantation | ||||||
| Patient or population: Patients with liver transplantation. | ||||||
| Outcomes | Illustrative comparative risks* (95% CI) | Relative effect | No of Participants | Quality of the evidence | Comments | |
| Assumed risk | Corresponding risk | |||||
| Control | Intervention versus control | |||||
| Blood loss ‐ Aprotinin versus control (litre) | The mean blood loss ‐ aprotinin versus control in the intervention groups was | 195 | ⊕⊝⊝⊝ | |||
| Blood loss ‐ Tranexamic acid versus control (litre) | The mean blood loss ‐ tranexamic acid versus control in the intervention groups was | 65 | ⊕⊝⊝⊝ | |||
| Blood loss ‐ Thromboelastography versus control (litre) | The mean blood loss ‐ thromboelastography versus control in the intervention groups was | 62 | ⊕⊝⊝⊝ | |||
| Blood loss ‐ Tranexamic acid versus aprotinin | The mean blood loss ‐ tranexamic acid versus aprotinin in the intervention groups was | 71 | ⊕⊝⊝⊝ | |||
| *The basis for the assumed risk (e.g. the median control group risk across studies) is provided in footnotes. The corresponding risk (and its 95% confidence interval) is based on the assumed risk in the comparison group and the relative effect of the intervention (and its 95% CI). | ||||||
| GRADE Working Group grades of evidence | ||||||
| 1 All trials were at high risk of bias, | ||||||
| Intervention versus control for liver transplantation | ||||||
| Patient or population: Patients with liver transplantation. | ||||||
| Outcomes | Illustrative comparative risks* (95% CI) | Relative effect | No of Participants | Quality of the evidence | Comments | |
| Assumed risk | Corresponding risk | |||||
| Control | Intervention versus control | |||||
| Red cell or whole blood transfusion ‐ Aprotinin versus control | The mean red cell or whole blood transfusion ‐ aprotinin versus control in the intervention groups was | 375 | ⊕⊝⊝⊝ | SMD ‐0.61 (‐0.82 to ‐0.40) | ||
| Red cell or whole blood transfusion ‐ Tranexamic acid versus control | The mean red cell or whole blood transfusion ‐ tranexamic acid versus control in the intervention groups was | 159 | ⊕⊝⊝⊝ | SMD ‐0.27 (‐0.59 to 0.06) | ||
| Red cell or whole blood transfusion ‐ Recombinant factor VIIa (rFVIIa) versus control | The mean red cell or whole blood transfusion ‐ recombinant factor VIIa (rFVIIa) versus control in the intervention groups was | 221 | ⊕⊝⊝⊝ | SMD 0.05 (‐0.32 to 0.23) | ||
| Red cell or whole blood transfusion ‐ Thromboelastography versus control | The mean red cell or whole blood transfusion ‐ thromboelastography versus control in the intervention groups was | 62 | ⊕⊝⊝⊝ | SMD ‐0.73 (‐1.69 to 0.24) | ||
| Red cell or whole blood transfusion ‐ Tranexamic acid versus aprotinin | The mean red cell or whole blood transfusion ‐ tranexamic acid versus aprotinin in the intervention groups was | 198 | ⊕⊝⊝⊝ | SMD ‐0.09 (‐0.36 to 0.19) | ||
| *The basis for the assumed risk (e.g. the median control group risk across studies) is provided in footnotes. The corresponding risk (and its 95% confidence interval) is based on the assumed risk in the comparison group and the relative effect of the intervention (and its 95% CI). | ||||||
| GRADE Working Group grades of evidence | ||||||
| 1 All trials were at high risk of bias. | ||||||
| Bolus | Continuous/hour | Additional boluses | Start time | End time | Approximate total including bolus | |
| Aprotinin (million KIU units) | ||||||
| Aprotinin versus control* | ||||||
| 2 | 0.5 | 0.05 per unit transfused | induction | not stated | 5 | |
| 1 | 0.25 | None | not stated | end of surgery | 2.5 | |
| Dalmau 2004 (control: tranexamic acid) | 2 | 0.5 | None | Beginning of surgery | 2 hours after reperfusion | 5 |
| 2 | 0.5 | None | induction | end of surgery | 5 | |
| 2 | 0.5 | None | induction | end of surgery | 5 | |
| None | 0.4 | None | induction | not stated | 2.4 | |
| None | 0.2 | None | Beginning of surgery | not stated | 1.2 | |
| 2 | 0.5 | None | anhepatic phase | not stated | 5 | |
| Ickx 2006 (control: tranexamic acid) | 2 | 0.5 | None | anhepatic phase | 2 hours after reperfusion | 3.5 |
| None | 0.2 | None | induction | not stated | 1.2 | |
| 2 | 0.5 | None | Beginning of surgery | end of surgery | 5 | |
| 2 | 0.5 | None | induction | transfer to ITU | 5 | |
| Porte 2000 (high dose A) | 2 | 1 | 1 million KIU half an hour before reperfusion | induction | 2 hours after reperfusion | 8 |
| Porte 2000 (high dose B) | 2 | 0.5 | None | induction | 2 hours after reperfusion | 5.5 |
| Different doses or methods of administration of aprotinin | ||||||
| Himmelreich 1992 (bolus method) | 0.5 | None | 0.5 during anhepatic phase and then at reperfusion | induction | reperfusion | 1 |
| Himmelreich 1992 (continuous method) | None | 0.2, increased to 0.4 during anhepatic phase and decreased to 0.1 from reperfusion | None | induction | end of surgery | 1.2 |
| Lassale 1996 (high dose) | 2 | 0.5 | None | induction | end of surgery | 5 |
| Lassale 1996 (low dose) | None | 0.1 | None | induction | end of surgery | 0.6 |
| Soilleux 1995 (high dose) | 2 | 0.5 | None | induction | transfer to ITU | 5 |
| Soilleux 1995 (medium dose) | 0.5 | 0.15 | None | induction | transfer to ITU | 1.4 |
| Tranexamic acid versus control* Units: mg/kg/hr | ||||||
| None | 40 | None | induction | reperfusion | 240 | |
| None | 10 | None | induction | reperfusion | 60 | |
| Dalmau 2004 (control: aprotinin) | None | 10 | None | Beginning of surgery | 2 hours after reperfusion | 60 |
| 80 | 40 | None | anhepatic phase | not stated | 320 | |
| Ickx 2006 (control: aprotinin) | 40 | 40 | None | anhepatic phase | 2 hours after reperfusion | 280 |
| None | 2 | None | Beginning of surgery | end of surgery | 12 | |
| 10 | 3 | None | anhepatic phase | transfer to ITU | 28 | |
| Epsilon amino caproic acid (EACA) versus control* Units: mg/kg/hour | ||||||
| None | 16 | None | induction | reperfusion | 96 | |
| Antithrombin versus control* Units: units per hour | ||||||
| (100‐plasma activity level) per kg body weight | 1000 | None | induction | end of surgery | 6000 | |
| Recombinant Factor VIIa versus control* (mcg/kg) | ||||||
| Lodge 2005 (high dose A) | 60 | None | 60 mcg/kg every 2 hours to approximately 30 minutes before reperfusion and a final dose on wound closure | within 10 minutes of skin incision | None | 180 |
| Lodge 2005 (high dose B) | 120 | None | 120 mcg/kg every 2 hours to approximately 30 minutes before reperfusion and a final dose on wound closure | within 10 minutes of skin incision | None | 360 |
| Planinsic 2005 (low dose A) | 20 | None | None | within 10 minutes of skin incision (single bolus) | None | 20 |
| Planinsic 2005 (low dose B) | 40 | None | None | within 10 minutes of skin incision (single bolus) | None | 40 |
| Planinsic 2005 (low dose C) | 80 | None | None | within 10 minutes of skin incision (single bolus) | None | 80 |
| 40 | Just before induction | None | Just before induction | None | 40 | |
| Oestrogen versus control* Units: mg | ||||||
| 100 | None | 100 mg 30 min after reperfusion | Beginning of surgery | None | 200 | |
| Prostaglandin E versus control* Units: microgram (mcg) | ||||||
| None | 10 mcg increased to 40 mcg | None | Beginning of surgery | three post‐operative days | 2800 | |
| Norpeinephrine versus control* Units: mcg/min | ||||||
| None | 0.5 mcg/min increased by 1 mcg increments up to a maximum of 6 mcg/min to maintain a systolic blood pressure and pulmonary capillary wedge pressure more than 80% of baseline values. | |||||
| * Control was placebo or no intervention unless stated. | ||||||
| P value | Effect estimate | |
| 60‐day mortality | ||
| Solvent detergent FFP | 0.5483 | RR 0; 95% CI 0 to 257517954.02 |
| Aprotinin | 0.0489 | RR 0.09; 95% CI 0.01 to 0.99 |
| Tranexamic acid | 0.0237 | RR 0.44; 95% CI 0.22 to 0.88 |
| EACA | 0.387 | RR 0.45; 95% CI 0.06 to 3.16 |
| Antithrombin III | 0.546 | RR 0; 95% CI 0 to 225447979.34 |
| rFVIIa | 0.4494 | RR 0.31; 95% CI 0.01 to 8.19 |
| Mortality at maximal follow‐up | ||
| Not performed | ||
| Primary graft non‐function | ||
| Convergence not obtained | ||
| Graft failure | ||
| Not performed | ||
| Retransplantation | ||
| Convergence not obtained | ||
| Thromboembolic episodes | ||
| rFVIIa | 0.0842 | RR 2.23; 95% CI 0.88 to 5.69 |
| control | 0.2142 | RR 0.5; 95% CI 0.16 to 1.6 |
| Aprotinin | 0.9371 | RR 1.04; 95% CI 0.36 to 2.99 |
| Tranexamic acid | 0.8742 | RR 0.88; 95% CI 0.14 to 5.46 |
| Serious adverse events | ||
| Low CVP | 0.1552 | RR 0.29; 95% CI 0.03 to 3.13 |
| Aprotinin | 0.8512 | RR 0.91; 95% CI 0.13 to 6.24 |
| rFVIIa | 0.2517 | RR 1.54; 95% CI 0.48 to 4.88 |
| Blood loss | ||
| Aprotinin | 0.4028 | MD 0.3 litre; 95% CI ‐ 0.47 to 1.07 |
| Tranexamic acid | 0.6075 | MD 0.20 litre; 95% CI ‐0.63 to 1.03 |
| Antithrombin III | 0.9966 | MD 0.03 litre; 95% CI ‐14.17 to 14.22 |
| Thromboelastometry | 0.0003 | MD ‐1.83 litre; 95% CI ‐2.55 to ‐1.12 |
| Low CVP | 0.004 | MD ‐1.12 litre; 95% CI ‐1.19 to ‐0.49 |
| Proportion of patients requiring red cell or whole blood transfusion | ||
| rFVIIa | 0.2765 | RR 0.18; 95% CI 0 to 25.84 |
| Aprotinin | 0.1301 | RR 0.37; 95% CI 0.07 to 2.04 |
| Tranexamic acid | 0.0937 | RR 0.27; 95% CI 0.04 to 1.72 |
| EACA | 0.5714 | RR 0.67; 95% CI 0.05 to 8.95 |
| Amount of blood transfused | ||
| Convergence not obtained | ||
| Platelet transfusion | ||
| Aprotinin | 0.0633 | SMD ‐0.25; 95% CI ‐0.51 to 0.02 |
| Tranexamic acid | 0.0129 | SMD ‐0.33; 95% CI ‐0.58 to ‐0.08 |
| EACA | 0.0231 | SMD ‐0.5; 95% CI ‐0.92 to ‐0.08 |
| rFVIIa | 0.7865 | SMD ‐0.04; 95% CI ‐0.32 to 0.25 |
| Oestrogen | 0.438 | SMD 0.28; 95% CI ‐0.46 to 1.02 |
| Thromboelastometry | 0.1046 | SMD 0.62; 95% CI ‐0.14 to 1.38 |
| Norepinephrine | 0.1552 | SMD 0.36; 95% CI ‐0.15 to 0.87 |
| Solvent detergent FFP | 0.3926 | SMD 0.34; 95% CI ‐0.48 to 1.17 |
| Fresh frozen plasma | ||
| Aprotinin | 0.4663 | SMD ‐0.12; 95% CI ‐0.46 to 0.22 |
| Tranexamic acid | 0.7514 | SMD ‐0.06; 95% CI ‐0.47 to 0.35 |
| EACA | 0.9742 | SMD 0.01; 95% CI ‐0.56 to 0.58 |
| Antithrombin III | 0.9217 | SMD ‐0.05; 95% CI ‐1.17 to 1.07 |
| rFVIIa | 0.9748 | SMD 0.01; 95% CI ‐0.64 to 0.66 |
| Oestrogen | 0.5834 | SMD ‐0.3; 95% CI ‐1.4 to 0.81 |
| Prostaglandin | 0.8881 | SMD ‐0.08; 95% CI ‐1.31 to 1.14 |
| Thromboelastometry | 0.7947 | SMD 0.14; 95% CI ‐0.98 to 1.27 |
| Norepinephrine | 0.628 | SMD ‐0.23; 95% CI ‐1.18 to 0.73 |
| Cryoprecipate | ||
| Aprotinin | 0.2675 | SMD ‐0.32; 95% CI ‐0.94 to 0.3 |
| Tranexamic acid | 0.2572 | SMD ‐0.35; 95% CI ‐1.01 to 0.31 |
| EACA | 0.5333 | SMD ‐0.29; 95% CI ‐1.32 to 0.74 |
| Oestrogen | 0.3963 | SMD 0.36; 95% CI ‐0.56 to 1.27 |
| Thromboelastometry | 0.8342 | SMD 0.1; 95% CI ‐0.92 to 1.11 |
| Solvent detergent FFP | 0.4925 | SMD 0.31; 95% CI ‐0.68 to 1.29 |
| Hospital stay | ||
| Aprotinin | 0.8137 | MD 0.59 days; 95% CI ‐5.89 to 7.06 |
| Tranexamic acid | 0.1876 | MD 6.45 days; 95% CI ‐4.83 to 17.74 |
| rFVIIa | 0.5458 | MD 3.04 days; 95% CI ‐9.78 to 15.87 |
| Low CVP | 0.1629 | MD 11.91 days; 95% CI ‐7.46 to 31.28 |
| Norepinephrine | 0.3781 | MD ‐1.1 days; 95% CI ‐4.19 to 1.99 |
| Intensive therapy unit stay | ||
| Aprotinin | 0.723 | MD ‐0.11 days; 95% CI ‐0.8 to 0.59 |
| Tranexamic acid | 0.9696 | MD 0.04 days; 95% CI ‐2.35 to 2.43 |
| rFVIIa | 0.6915 | MD ‐0.21 days; 95% CI ‐1.45 to 1.03 |
| Low CVP | 0.6431 | MD 0.6 days; 95% CI ‐2.39 to 3.59 |
| Norepinephrine | 0.8102 | MD 0.19 days; 95% CI ‐1.67 to 2.06 |
| CVP = central venous pressure. | ||
| Outcome or subgroup title | No. of studies | No. of participants | Statistical method | Effect size |
| 1 60‐day mortality Show forest plot | 14 | Risk Ratio (M‐H, Fixed, 95% CI) | Subtotals only | |
| 1.1 Aprotinin versus control | 3 | 280 | Risk Ratio (M‐H, Fixed, 95% CI) | 0.52 [0.18, 1.45] |
| 1.2 Tranexamic acid versus control | 3 | 139 | Risk Ratio (M‐H, Fixed, 95% CI) | 0.55 [0.17, 1.76] |
| 1.3 Epsilon amino caproic acid (EACA) versus control | 1 | 62 | Risk Ratio (M‐H, Fixed, 95% CI) | 0.71 [0.13, 3.94] |
| 1.4 Antithrombin III versus control | 1 | 29 | Risk Ratio (M‐H, Fixed, 95% CI) | 0.24 [0.01, 4.65] |
| 1.5 Recombinant factor VIIa (rFVIIa) versus control | 3 | 286 | Risk Ratio (M‐H, Fixed, 95% CI) | 1.51 [0.33, 6.95] |
| 1.6 Aprotinin: bolus versus continuous infusion | 1 | 23 | Risk Ratio (M‐H, Fixed, 95% CI) | 0.0 [0.0, 0.0] |
| 1.7 Solvent detergent plasma versus standard fresh frozen plasma | 1 | 25 | Risk Ratio (M‐H, Fixed, 95% CI) | 0.0 [0.0, 0.0] |
| 1.8 Tranexamic acid versus EACA | 1 | 84 | Risk Ratio (M‐H, Fixed, 95% CI) | 1.0 [0.21, 4.67] |
| 1.9 Tranexamic acid versus aprotinin | 2 | 178 | Risk Ratio (M‐H, Fixed, 95% CI) | 4.12 [0.71, 23.76] |
| 2 Mortality at maximal follow‐up Show forest plot | 2 | Risk Ratio (M‐H, Fixed, 95% CI) | Subtotals only | |
| 2.1 Antithrombin III versus control | 1 | 29 | Risk Ratio (M‐H, Fixed, 95% CI) | 0.25 [0.03, 1.85] |
| 2.2 Thromboelastography versus control | 1 | 28 | Risk Ratio (M‐H, Fixed, 95% CI) | 0.67 [0.13, 3.40] |
| 3 Primary graft non‐function Show forest plot | 4 | Risk Ratio (M‐H, Fixed, 95% CI) | Subtotals only | |
| 3.1 Aprotinin versus control | 2 | 217 | Risk Ratio (M‐H, Fixed, 95% CI) | 0.15 [0.02, 1.25] |
| 3.2 Tranexamic acid versus control | 1 | 32 | Risk Ratio (M‐H, Fixed, 95% CI) | 3.0 [0.13, 68.57] |
| 3.3 Recombinant factor VIIa (rFVIIa) versus control | 1 | 20 | Risk Ratio (M‐H, Fixed, 95% CI) | 0.0 [0.0, 0.0] |
| 4 Retransplantation Show forest plot | 7 | Risk Ratio (M‐H, Random, 95% CI) | Subtotals only | |
| 4.1 Aprotinin versus control | 2 | 217 | Risk Ratio (M‐H, Random, 95% CI) | 0.21 [0.02, 1.79] |
| 4.2 Tranexamic acid versus control | 2 | 77 | Risk Ratio (M‐H, Random, 95% CI) | 0.79 [0.18, 3.48] |
| 4.3 Prostaglandin versus control | 1 | 20 | Risk Ratio (M‐H, Random, 95% CI) | 0.0 [0.0, 0.0] |
| 4.4 Aprotinin: bolus versus continuous infusion | 1 | 23 | Risk Ratio (M‐H, Random, 95% CI) | 0.77 [0.05, 10.85] |
| 4.5 Tranexamic acid versus aprotinin | 1 | 127 | Risk Ratio (M‐H, Random, 95% CI) | 2.95 [0.12, 71.17] |
| 5 Thromboembolic episodes Show forest plot | 12 | Risk Ratio (M‐H, Fixed, 95% CI) | Subtotals only | |
| 5.1 Aprotinin versus control | 3 | 280 | Risk Ratio (M‐H, Fixed, 95% CI) | 0.60 [0.18, 1.96] |
| 5.2 Tranexamic acid versus control | 5 | 179 | Risk Ratio (M‐H, Fixed, 95% CI) | 2.20 [0.38, 12.64] |
| 5.3 Epsilon amino caproic acid (EACA) versus control | 1 | 62 | Risk Ratio (M‐H, Fixed, 95% CI) | 0.95 [0.09, 9.89] |
| 5.4 Recombinant factor VIIa (rFVIIa) versus control | 2 | 266 | Risk Ratio (M‐H, Fixed, 95% CI) | 1.38 [0.65, 2.91] |
| 5.5 Tranexamic acid versus EACA | 1 | 84 | Risk Ratio (M‐H, Fixed, 95% CI) | 2.0 [0.39, 10.34] |
| 5.6 Tranexamic acid versus aprotinin | 2 | 178 | Risk Ratio (M‐H, Fixed, 95% CI) | 1.97 [0.37, 10.37] |
| 6 Serious adverse events Show forest plot | 4 | Risk Ratio (M‐H, Fixed, 95% CI) | Subtotals only | |
| 6.1 Aprotinin versus control | 1 | 137 | Risk Ratio (M‐H, Fixed, 95% CI) | 1.02 [0.49, 2.11] |
| 6.2 Recombinant factor VIIa (rFVIIa) versus control | 2 | 266 | Risk Ratio (M‐H, Fixed, 95% CI) | 1.30 [0.94, 1.78] |
| 6.3 Low central venous pressure versus control | 1 | 86 | Risk Ratio (M‐H, Fixed, 95% CI) | 0.71 [0.55, 0.92] |
| 7 Blood loss Show forest plot | 11 | Mean Difference (IV, Random, 95% CI) | Subtotals only | |
| 7.1 Aprotinin versus control | 3 | 195 | Mean Difference (IV, Random, 95% CI) | ‐1.36 [‐3.39, 0.66] |
| 7.2 Tranexamic acid versus control | 2 | 65 | Mean Difference (IV, Random, 95% CI) | ‐4.98 [‐10.18, 0.23] |
| 7.3 Antithrombin III versus control | 1 | 29 | Mean Difference (IV, Random, 95% CI) | 1.9 [‐4.86, 8.66] |
| 7.4 Thromboelastography versus control | 2 | 62 | Mean Difference (IV, Random, 95% CI) | ‐1.13 [‐1.85, ‐0.41] |
| 7.5 Low central venous pressure versus control | 1 | 86 | Mean Difference (IV, Random, 95% CI) | ‐1.19 [‐1.88, ‐0.50] |
| 7.6 Tranexamic acid versus aprotinin | 2 | 71 | Mean Difference (IV, Random, 95% CI) | ‐1.01 [‐2.31, 0.29] |
| 8 Red‐cell or whole blood transfusion Show forest plot | 4 | Risk Ratio (M‐H, Fixed, 95% CI) | Subtotals only | |
| 8.1 Aprotinin versus control | 1 | 80 | Risk Ratio (M‐H, Fixed, 95% CI) | 0.68 [0.40, 1.18] |
| 8.2 Tranexamic acid versus control | 1 | 62 | Risk Ratio (M‐H, Fixed, 95% CI) | 0.77 [0.60, 0.98] |
| 8.3 Epsilon amino caproic acid (EACA) versus control | 1 | 62 | Risk Ratio (M‐H, Fixed, 95% CI) | 0.90 [0.77, 1.06] |
| 8.4 Recombinant factor VIIa (rFVIIa) versus control | 1 | 182 | Risk Ratio (M‐H, Fixed, 95% CI) | 0.91 [0.86, 0.97] |
| 8.5 Tranexamic acid versus EACA | 1 | 84 | Risk Ratio (M‐H, Fixed, 95% CI) | 0.81 [0.64, 1.02] |
| 8.6 Tranexamic acid versus aprotinin | 1 | 127 | Risk Ratio (M‐H, Fixed, 95% CI) | 0.94 [0.71, 1.23] |
| 9 Red cell or whole blood transfusion Show forest plot | 29 | Std. Mean Difference (IV, Fixed, 95% CI) | Subtotals only | |
| 9.1 Aprotinin versus control | 8 | 375 | Std. Mean Difference (IV, Fixed, 95% CI) | ‐0.61 [‐0.82, ‐0.40] |
| 9.2 Tranexamic acid versus control | 4 | 159 | Std. Mean Difference (IV, Fixed, 95% CI) | ‐0.27 [‐0.59, 0.06] |
| 9.3 Epsilon amino caproic acid (EACA) versus control | 1 | 62 | Std. Mean Difference (IV, Fixed, 95% CI) | ‐0.17 [‐0.71, 0.36] |
| 9.4 Antithrombin III versus control | 1 | 29 | Std. Mean Difference (IV, Fixed, 95% CI) | ‐0.04 [‐0.77, 0.69] |
| 9.5 Recombinant factor VIIa (rFVIIa) versus control | 2 | 221 | Std. Mean Difference (IV, Fixed, 95% CI) | ‐0.05 [‐0.32, 0.23] |
| 9.6 Oestrogen versus control | 1 | 30 | Std. Mean Difference (IV, Fixed, 95% CI) | ‐0.58 [‐1.32, 0.15] |
| 9.7 Prostaglandin versus control | 1 | 20 | Std. Mean Difference (IV, Fixed, 95% CI) | ‐0.04 [‐0.92, 0.83] |
| 9.8 Norepinephrine versus control | 1 | 65 | Std. Mean Difference (IV, Fixed, 95% CI) | ‐0.04 [‐0.53, 0.44] |
| 9.9 Thromboelastography versus control | 2 | 62 | Std. Mean Difference (IV, Fixed, 95% CI) | ‐0.73 [‐1.25, ‐0.20] |
| 9.10 Low central venous pressure versus control | 1 | 86 | Std. Mean Difference (IV, Fixed, 95% CI) | ‐1.17 [‐1.62, ‐0.71] |
| 9.11 Aprotinin: bolus versus continuous infusion | 1 | 23 | Std. Mean Difference (IV, Fixed, 95% CI) | 0.86 [‐0.00, 1.73] |
| 9.12 Aprotinin: high dose versus medium dose | 1 | 189 | Std. Mean Difference (IV, Fixed, 95% CI) | 0.16 [‐0.12, 0.45] |
| 9.13 Aprotinin: high dose versus low dose | 1 | 20 | Std. Mean Difference (IV, Fixed, 95% CI) | ‐1.46 [‐2.47, ‐0.45] |
| 9.14 Whole blood versus blood components | 1 | 33 | Std. Mean Difference (IV, Fixed, 95% CI) | ‐0.04 [‐0.72, 0.65] |
| 9.15 Solvent detergent plasma versus standard fresh frozen plasma | 1 | 25 | Std. Mean Difference (IV, Fixed, 95% CI) | 0.19 [‐0.60, 0.98] |
| 9.16 Tranexamic acid versus EACA | 1 | 84 | Std. Mean Difference (IV, Fixed, 95% CI) | ‐0.23 [‐0.66, 0.20] |
| 9.17 Tranexamic acid versus aprotinin | 3 | 198 | Std. Mean Difference (IV, Fixed, 95% CI) | ‐0.09 [‐0.36, 0.19] |
| 10 Platelet transfusion Show forest plot | 21 | Std. Mean Difference (IV, Fixed, 95% CI) | Subtotals only | |
| 10.1 Aprotinin versus control | 5 | 185 | Std. Mean Difference (IV, Fixed, 95% CI) | ‐0.44 [‐0.73, ‐0.14] |
| 10.2 Tranexamic acid versus control | 4 | 159 | Std. Mean Difference (IV, Fixed, 95% CI) | ‐0.17 [‐0.49, 0.16] |
| 10.3 Epsilon amino caproic acid (EACA) versus control | 1 | 62 | Std. Mean Difference (IV, Fixed, 95% CI) | 0.01 [‐0.52, 0.55] |
| 10.4 Antithrombin III versus control | 1 | 29 | Std. Mean Difference (IV, Fixed, 95% CI) | 0.0 [‐0.73, 0.73] |
| 10.5 Recombinant factor VIIa (rFVIIa) versus control | 2 | 216 | Std. Mean Difference (IV, Fixed, 95% CI) | ‐0.03 [‐0.31, 0.25] |
| 10.6 Oestrogen versus control | 1 | 30 | Std. Mean Difference (IV, Fixed, 95% CI) | ‐0.53 [‐1.26, 0.20] |
| 10.7 Norepinephrine versus control | 1 | 65 | Std. Mean Difference (IV, Fixed, 95% CI) | 0.34 [‐0.15, 0.83] |
| 10.8 Thromboelastography versus control | 1 | 28 | Std. Mean Difference (IV, Fixed, 95% CI) | ‐0.17 [‐0.91, 0.58] |
| 10.9 Aprotinin: high dose versus medium dose | 1 | 189 | Std. Mean Difference (IV, Fixed, 95% CI) | ‐0.48 [‐0.77, ‐0.19] |
| 10.10 Whole blood versus blood components | 1 | 33 | Std. Mean Difference (IV, Fixed, 95% CI) | ‐0.12 [‐0.81, 0.56] |
| 10.11 Solvent detergent plasma versus standard fresh frozen plasma | 1 | 25 | Std. Mean Difference (IV, Fixed, 95% CI) | 0.07 [‐0.71, 0.86] |
| 10.12 Tranexamic acid versus EACA | 1 | 84 | Std. Mean Difference (IV, Fixed, 95% CI) | 0.05 [‐0.37, 0.48] |
| 10.13 Tranexamic acid versus aprotinin | 3 | 198 | Std. Mean Difference (IV, Fixed, 95% CI) | ‐0.08 [‐0.36, 0.20] |
| 11 Plasma transfusion Show forest plot | 25 | Std. Mean Difference (IV, Fixed, 95% CI) | Subtotals only | |
| 11.1 Aprotinin versus control | 8 | 420 | Std. Mean Difference (IV, Fixed, 95% CI) | ‐0.33 [‐0.53, ‐0.13] |
| 11.2 Tranexamic acid versus control | 4 | 159 | Std. Mean Difference (IV, Fixed, 95% CI) | ‐0.21 [‐0.53, 0.11] |
| 11.3 Epsilon amino caproic acid (EACA) versus control | 1 | 62 | Std. Mean Difference (IV, Fixed, 95% CI) | ‐0.12 [‐0.66, 0.41] |
| 11.4 Antithrombin III versus control | 1 | 29 | Std. Mean Difference (IV, Fixed, 95% CI) | 0.04 [‐0.69, 0.77] |
| 11.5 Recombinant factor VIIa (rFVIIa) versus control | 2 | 262 | Std. Mean Difference (IV, Fixed, 95% CI) | ‐0.01 [‐0.28, 0.25] |
| 11.6 Oestrogen versus control | 1 | 30 | Std. Mean Difference (IV, Fixed, 95% CI) | ‐0.67 [‐1.41, 0.07] |
| 11.7 Prostaglandin versus control | 1 | 20 | Std. Mean Difference (IV, Fixed, 95% CI) | 0.0 [‐0.88, 0.88] |
| 11.8 Norepinephrine versus control | 1 | 65 | Std. Mean Difference (IV, Fixed, 95% CI) | 0.11 [‐0.38, 0.60] |
| 11.9 Thromboelastography versus control | 1 | 28 | Std. Mean Difference (IV, Fixed, 95% CI) | ‐0.82 [‐1.60, ‐0.05] |
| 11.10 Aprotinin: bolus versus continuous infusion | 1 | 23 | Std. Mean Difference (IV, Fixed, 95% CI) | 0.05 [‐0.78, 0.87] |
| 11.11 Aprotinin: high dose versus medium dose | 1 | 189 | Std. Mean Difference (IV, Fixed, 95% CI) | 0.06 [‐0.22, 0.35] |
| 11.12 Aprotinin: high dose versus low dose | 1 | 20 | Std. Mean Difference (IV, Fixed, 95% CI) | ‐1.31 [‐2.29, ‐0.32] |
| 11.13 Whole blood versus blood components | 1 | 33 | Std. Mean Difference (IV, Fixed, 95% CI) | ‐1.53 [‐2.32, ‐0.74] |
| 11.14 Tranexamic acid versus EACA | 1 | 84 | Std. Mean Difference (IV, Fixed, 95% CI) | ‐0.22 [‐0.65, 0.21] |
| 11.15 Tranexamic acid versus aprotinin | 2 | 71 | Std. Mean Difference (IV, Fixed, 95% CI) | 0.02 [‐0.45, 0.48] |
| 12 Cryoprecipitate Show forest plot | 12 | Std. Mean Difference (IV, Fixed, 95% CI) | Subtotals only | |
| 12.1 Aprotinin versus control | 3 | 147 | Std. Mean Difference (IV, Fixed, 95% CI) | ‐0.49 [‐0.82, ‐0.16] |
| 12.2 Tranexamic acid versus control | 4 | 181 | Std. Mean Difference (IV, Fixed, 95% CI) | ‐0.27 [‐0.57, 0.02] |
| 12.3 Epsilon amino caproic acid (EACA) versus control | 1 | 62 | Std. Mean Difference (IV, Fixed, 95% CI) | 0.00 [‐0.53, 0.54] |
| 12.4 Antithrombin III versus control | 1 | 29 | Std. Mean Difference (IV, Fixed, 95% CI) | 0.0 [‐0.73, 0.73] |
| 12.5 Oestrogen versus control | 1 | 30 | Std. Mean Difference (IV, Fixed, 95% CI) | 0.0 [‐0.72, 0.72] |
| 12.6 Thromboelastography versus control | 1 | 28 | Std. Mean Difference (IV, Fixed, 95% CI) | ‐0.25 [1.00, 0.49] |
| 12.7 Whole blood versus blood components | 1 | 33 | Std. Mean Difference (IV, Fixed, 95% CI) | ‐0.28 [‐0.97, 0.41] |
| 12.8 Solvent detergent plasma versus standard fresh frozen plasma | 1 | 25 | Std. Mean Difference (IV, Fixed, 95% CI) | 0.10 [‐0.68, 0.89] |
| 12.9 Tranexamic acid versus EACA | 1 | 62 | Std. Mean Difference (IV, Fixed, 95% CI) | ‐0.15 [‐0.69, 0.38] |
| 13 Hospital stay Show forest plot | 6 | Mean Difference (IV, Fixed, 95% CI) | Subtotals only | |
| 13.1 Aprotinin versus control | 1 | 63 | Mean Difference (IV, Fixed, 95% CI) | 0.0 [‐4.94, 4.94] |
| 13.2 Tranexamic acid versus control | 1 | 45 | Mean Difference (IV, Fixed, 95% CI) | 4.0 [‐16.18, 24.18] |
| 13.3 Recombinant factor VIIa (rFVIIa) versus control | 1 | 180 | Mean Difference (IV, Fixed, 95% CI) | 3.40 [‐7.51, 14.31] |
| 13.4 Norepinephrine versus control | 1 | 65 | Mean Difference (IV, Fixed, 95% CI) | ‐1.00 [‐3.18, 1.18] |
| 13.5 Low central venous pressure versus control | 1 | 86 | Mean Difference (IV, Fixed, 95% CI) | 0.0 [‐19.43, 19.43] |
| 13.6 Tranexamic acid versus aprotinin | 1 | 51 | Mean Difference (IV, Fixed, 95% CI) | 5.0 [‐2.69, 12.69] |
| 14 Intensive therapy unit stay Show forest plot | 9 | Mean Difference (IV, Fixed, 95% CI) | Subtotals only | |
| 14.1 Aprotinin versus control | 2 | 199 | Mean Difference (IV, Fixed, 95% CI) | ‐0.21 [‐0.78, 0.36] |
| 14.2 Tranexamic acid versus control | 1 | 45 | Mean Difference (IV, Fixed, 95% CI) | ‐1.0 [‐4.75, 2.75] |
| 14.3 Recombinant factor VIIa (rFVIIa) versus control | 2 | 199 | Mean Difference (IV, Fixed, 95% CI) | 0.22 [‐0.14, 0.58] |
| 14.4 Norepinephrine versus control | 1 | 65 | Mean Difference (IV, Fixed, 95% CI) | ‐0.13 [‐1.65, 1.39] |
| 14.5 Low central venous pressure versus control | 1 | 86 | Mean Difference (IV, Fixed, 95% CI) | ‐1.0 [‐3.71, 1.71] |
| 14.6 Aprotinin: bolus versus continuous infusion | 1 | 23 | Mean Difference (IV, Fixed, 95% CI) | 2.0 [‐3.99, 7.99] |
| 14.7 Tranexamic acid versus aprotinin | 1 | 51 | Mean Difference (IV, Fixed, 95% CI) | 0.0 [‐2.40, 2.40] |