| 1 Change in quality of life Show forest plot | 2 | 732 | Mean Difference (Fixed, 95% CI) | ‐1.61 [‐2.93, ‐0.29] |
|
| 1.1 Salmeterol | 1 | 304 | Mean Difference (Fixed, 95% CI) | ‐1.8 [‐3.32, ‐0.28] |
| 1.2 Formoterol | 1 | 428 | Mean Difference (Fixed, 95% CI) | ‐1.0 [‐3.70, 1.70] |
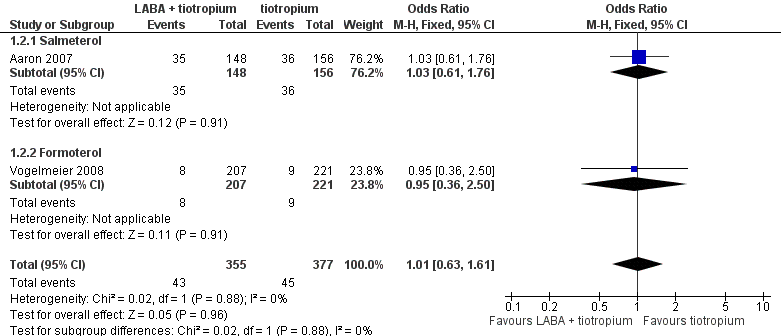
| 2 Hospital admission (all cause) Show forest plot | 2 | 732 | Odds Ratio (M‐H, Fixed, 95% CI) | 1.01 [0.63, 1.61] |
|
| 2.1 Salmeterol | 1 | 304 | Odds Ratio (M‐H, Fixed, 95% CI) | 1.03 [0.61, 1.76] |
| 2.2 Formoterol | 1 | 428 | Odds Ratio (M‐H, Fixed, 95% CI) | 0.95 [0.36, 2.50] |
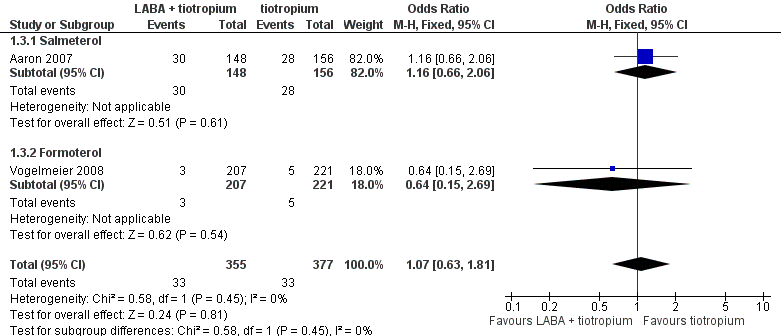
| 3 Hospital admission (exacerbation) Show forest plot | 2 | 732 | Odds Ratio (M‐H, Fixed, 95% CI) | 1.07 [0.63, 1.81] |
|
| 3.1 Salmeterol | 1 | 304 | Odds Ratio (M‐H, Fixed, 95% CI) | 1.16 [0.66, 2.06] |
| 3.2 Formoterol | 1 | 428 | Odds Ratio (M‐H, Fixed, 95% CI) | 0.64 [0.15, 2.69] |
| 4 Mortality (all cause) Show forest plot | 5 | 3263 | Peto Odds Ratio (Peto, Fixed, 95% CI) | 1.56 [0.56, 4.33] |
|
| 4.1 Salmeterol | 1 | 304 | Peto Odds Ratio (Peto, Fixed, 95% CI) | 1.59 [0.45, 5.62] |
| 4.2 Formoterol | 2 | 683 | Peto Odds Ratio (Peto, Fixed, 95% CI) | 0.0 [0.0, 0.0] |
| 4.3 Indacaterol | 2 | 2276 | Peto Odds Ratio (Peto, Fixed, 95% CI) | 1.48 [0.26, 8.57] |
| 5 Exacerbation Show forest plot | 3 | | Odds Ratio (M‐H, Random, 95% CI) | Totals not selected |
|
| 5.1 Salmeterol | 1 | | Odds Ratio (M‐H, Random, 95% CI) | 0.0 [0.0, 0.0] |
| 5.2 Formoterol | 2 | | Odds Ratio (M‐H, Random, 95% CI) | 0.0 [0.0, 0.0] |
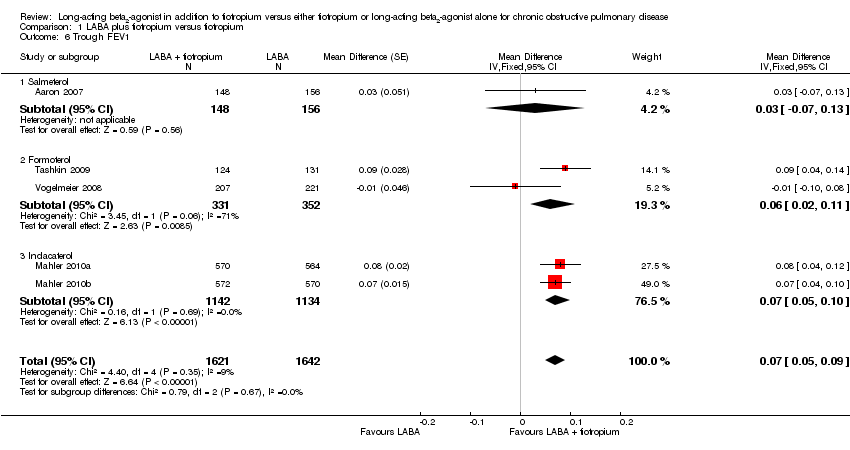
| 6 Trough FEV1 Show forest plot | 5 | 3263 | Mean Difference (Fixed, 95% CI) | 0.07 [0.05, 0.09] |
|
| 6.1 Salmeterol | 1 | 304 | Mean Difference (Fixed, 95% CI) | 0.03 [‐0.07, 0.13] |
| 6.2 Formoterol | 2 | 683 | Mean Difference (Fixed, 95% CI) | 0.06 [0.02, 0.11] |
| 6.3 Indacaterol | 2 | 2276 | Mean Difference (Fixed, 95% CI) | 0.07 [0.05, 0.10] |
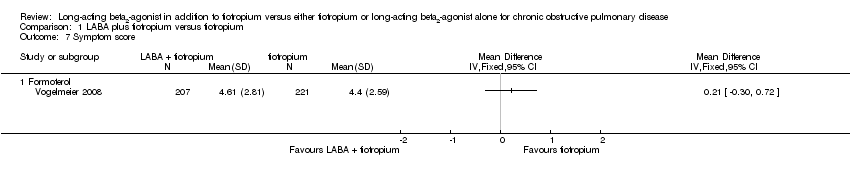
| 7 Symptom score Show forest plot | 1 | | Mean Difference (IV, Fixed, 95% CI) | Totals not selected |
|
| 7.1 Formoterol | 1 | | Mean Difference (IV, Fixed, 95% CI) | 0.0 [0.0, 0.0] |
| 8 Serious adverse event (non‐fatal) Show forest plot | 5 | 3263 | Odds Ratio (M‐H, Fixed, 95% CI) | 1.09 [0.76, 1.55] |
|
| 8.1 Salmeterol | 1 | 304 | Odds Ratio (M‐H, Fixed, 95% CI) | 0.95 [0.37, 2.40] |
| 8.2 Formoterol | 2 | 683 | Odds Ratio (M‐H, Fixed, 95% CI) | 1.07 [0.54, 2.13] |
| 8.3 Indacaterol | 2 | 2276 | Odds Ratio (M‐H, Fixed, 95% CI) | 1.14 [0.72, 1.81] |
| 9 Withdrawal Show forest plot | 5 | 3263 | Odds Ratio (M‐H, Random, 95% CI) | 1.00 [0.74, 1.37] |
|
| 9.1 Salmeterol | 1 | 304 | Odds Ratio (M‐H, Random, 95% CI) | 0.84 [0.54, 1.33] |
| 9.2 Formoterol | 2 | 683 | Odds Ratio (M‐H, Random, 95% CI) | 1.46 [0.52, 4.09] |
| 9.3 Indacaterol | 2 | 2276 | Odds Ratio (M‐H, Random, 95% CI) | 0.93 [0.65, 1.34] |