Wpływ kakao na ciśnienie krwi
Appendices
Appendix 1. MEDLINE search strategy
Database: Ovid MEDLINE(R) 1948 to Present with Daily Update
Search Date: 24 November 2011
‐‐‐‐‐‐‐‐‐‐‐‐‐‐‐‐‐‐‐‐‐‐‐‐‐‐‐‐‐‐‐‐‐‐‐‐‐‐‐‐‐‐‐‐‐‐‐‐‐‐‐‐‐‐‐‐‐‐‐‐‐‐‐‐‐‐‐‐‐‐‐‐‐‐‐‐‐‐‐‐
1 (cacao$ or cocoa$ or chocolat$).mp.
2 exp cardiovascular diseases/
3 exp cardiovascular system/
4 cardiovascular.mp.
5 exp hypertension/
6 hypertens$.mp.
7 exp blood pressure/
8 blood$.mp.
9 or/2‐8
10 randomized controlled trial.pt.
11 controlled clinical trial.pt.
12 randomized.tw.
13 placebo.tw.
14 drug therapy/
15 randomly.tw.
16 trial.tw.
17 groups.tw.
18 or/10‐17
19 animals/ not (humans/ and animals/)
20 18 not 19
21 1 and 9 and 20
Appendix 2. Hypertension Group Specialised Register search strategy
Database: Hypertension Group Specialised Register
Search Date: 24 November 2011
‐‐‐‐‐‐‐‐‐‐‐‐‐‐‐‐‐‐‐‐‐‐‐‐‐‐‐‐‐‐‐‐‐‐‐‐‐‐‐‐‐‐‐‐‐‐‐‐‐‐‐‐‐‐‐‐‐‐‐‐‐‐‐‐‐‐‐‐‐‐‐‐‐‐‐‐‐‐‐‐
1 All fields (cacao* or cocoa* or chocolat*)
Appendix 3. CENTRAL search strategy
Database: Wiley ‐ Cochrane Central Register of Controlled Trials <2011 Issue 4>
Search Date: 24 November 2011
‐‐‐‐‐‐‐‐‐‐‐‐‐‐‐‐‐‐‐‐‐‐‐‐‐‐‐‐‐‐‐‐‐‐‐‐‐‐‐‐‐‐‐‐‐‐‐‐‐‐‐‐‐‐‐‐‐‐‐‐‐‐‐‐‐‐‐‐‐‐‐‐‐‐‐‐‐‐‐‐
#1 (cacao* or cocoa* or chocolat*):ti,ab,kw in Clinical Trials
#2 MeSH descriptor Cardiovascular Diseases explode all trees
#3 MeSH descriptor Cardiovascular System explode all trees
#4 (cardiovascular):ti,ab,kw in Clinical Trials
#5 MeSH descriptor Hypertension explode all trees
#6 (hypertens*):ti,ab,kw in Clinical Trials
#7 MeSH descriptor Blood Pressure explode all trees
#8 (blood*):ti,ab,kw in Clinical Trials
#9 (#2 OR #3 OR #4 OR #5 OR #6 OR #7 OR #8)
#10 (#1 AND #9)
Appendix 4. EMBASE search strategy
Database: Embase <1980 to 2011 November 23>
Search Date: 24 November 2011
‐‐‐‐‐‐‐‐‐‐‐‐‐‐‐‐‐‐‐‐‐‐‐‐‐‐‐‐‐‐‐‐‐‐‐‐‐‐‐‐‐‐‐‐‐‐‐‐‐‐‐‐‐‐‐‐‐‐‐‐‐‐‐‐‐‐‐‐‐‐‐‐‐‐‐‐‐‐‐‐
1 (cacao$ or cocoa$ or chocolat$).mp.
2 exp cardiovascular disease/
3 exp cardiovascular system/
4 cardiovascular.mp.
5 exp hypertension/
6 hypertens$.tw.
7 exp blood pressure/
8 blood$.mp.
9 or/2‐8 (
10 randomized controlled trial/
11 crossover procedure/
12 double‐blind procedure/
13 random$.tw.
14 (crossover$ or cross‐over$).tw.
15 placebo$.tw.
16 (doubl$ adj blind$).tw.
17 assign$.tw.
18 allocat$.tw.
19 or/10‐18
20 9 and 19
21 (animal$ not (human$ and animal$)).mp.
22 20 not 21
23 1 and 9 and 22
Appendix 5. Food Science and Technology Abstracts search strategy
Database: Food Science and Technology Abstracts <1969 to 2011 November Week 3>
Search Date: 25 November 2011
‐‐‐‐‐‐‐‐‐‐‐‐‐‐‐‐‐‐‐‐‐‐‐‐‐‐‐‐‐‐‐‐‐‐‐‐‐‐‐‐‐‐‐‐‐‐‐‐‐‐‐‐‐‐‐‐‐‐‐‐‐‐‐‐‐‐‐‐‐‐‐‐‐‐‐‐‐‐‐‐
1 (cacao$ or cocoa$ or chocolat$).mp.
2 exp cardiovascular diseases/
3 cardiovascular.mp.
4 hypertension/
5 hypertens$.tw.
6 blood pressure/
7 blood$.mp.
8 or/2‐7
9 ((control$ or clinical) adj2 trial$).tw.
10 random$.tw.
11 placebo$.tw.
12 trial.ab.
13 groups.ab.
14 doubl$ blind$.tw.
15 or/9‐14
16 1 and 8 and 15


Risk of bias summary: review authors' judgements about each risk of bias item for each included study.
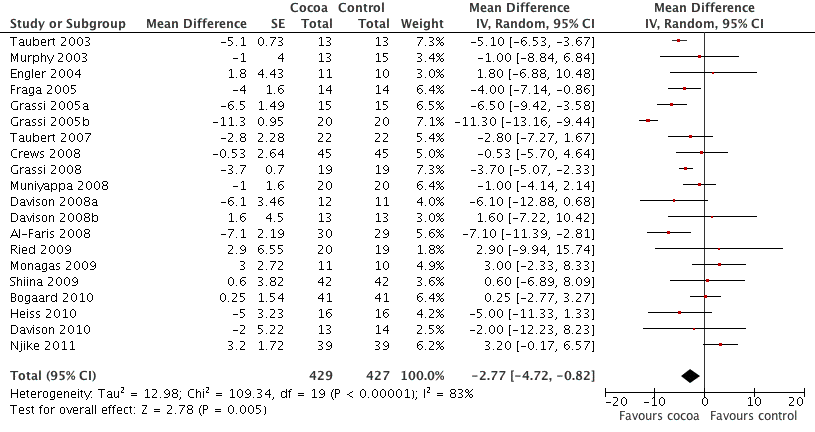
Forest plot of comparison: 1 Effect of cocoa on BP, outcome: 1.1 SBP.

Forest plot of comparison: 1 Effect of cocoa on BP, outcome: 1.2 DBP.

Forest plot of comparison: 2 Flavanol free or low flavanol control, outcome: 2.1 SBP.

Forest plot of comparison: 2 Flavanol free or low flavanol control, outcome: 2.2 DBP.
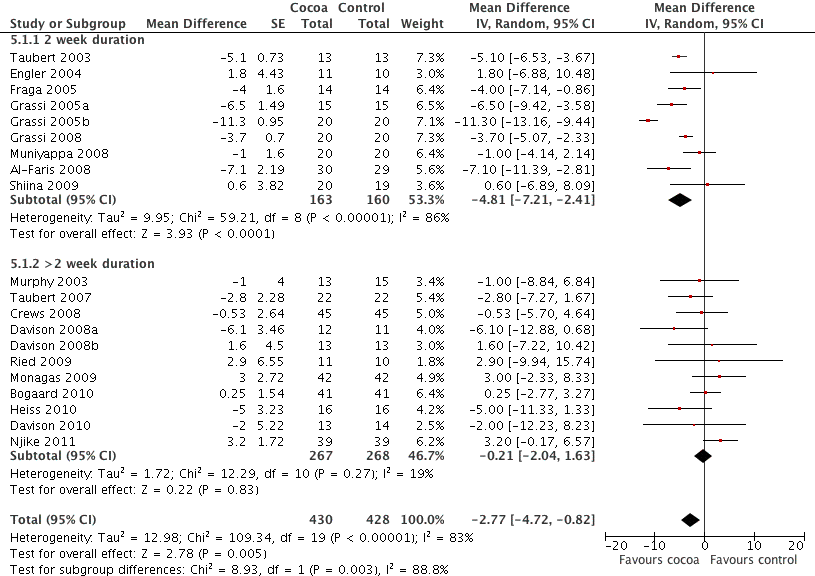
Forest plot of comparison: 7 Study duration 2 weeks or >2 weeks, outcome: 7.1 SBP.

Forest plot of comparison: 7 Study duration 2 weeks or >2 weeks, outcome: 7.2 DBP.
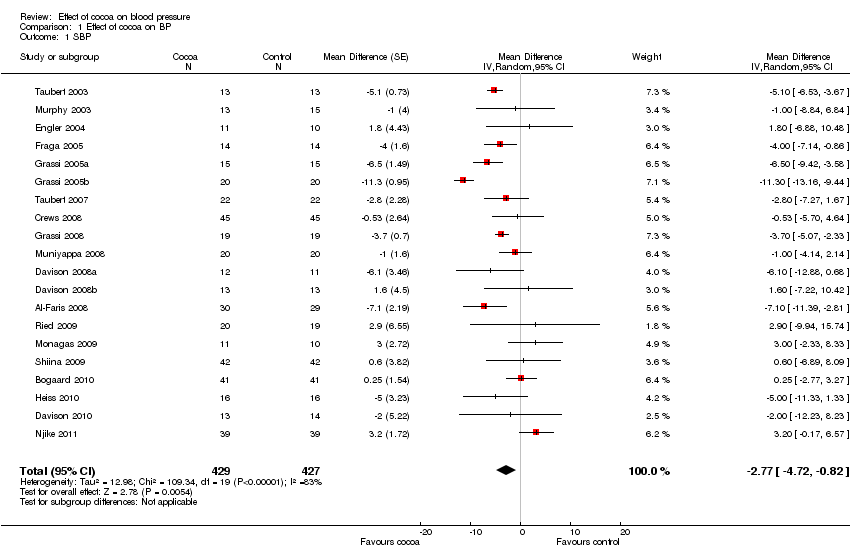
Comparison 1 Effect of cocoa on BP, Outcome 1 SBP.
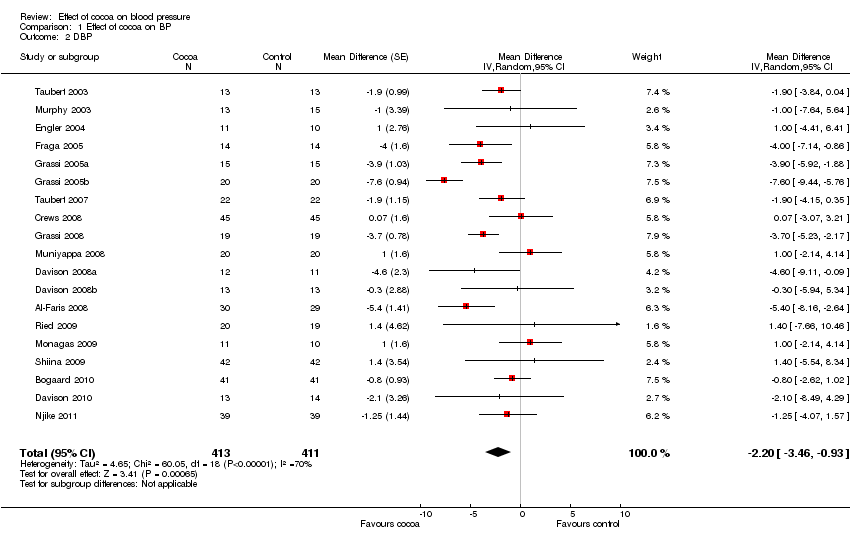
Comparison 1 Effect of cocoa on BP, Outcome 2 DBP.

Comparison 2 Flavanol free or low flavanol control, Outcome 1 SBP.

Comparison 2 Flavanol free or low flavanol control, Outcome 2 DBP.

Comparison 3 Hypertensive or normotensive subjects, Outcome 1 SBP.

Comparison 3 Hypertensive or normotensive subjects, Outcome 2 DBP.

Comparison 4 <10g or >10g sugar in cocoa/day with BMI >25, Outcome 1 SBP.

Comparison 4 <10g or >10g sugar in cocoa/day with BMI >25, Outcome 2 DBP.
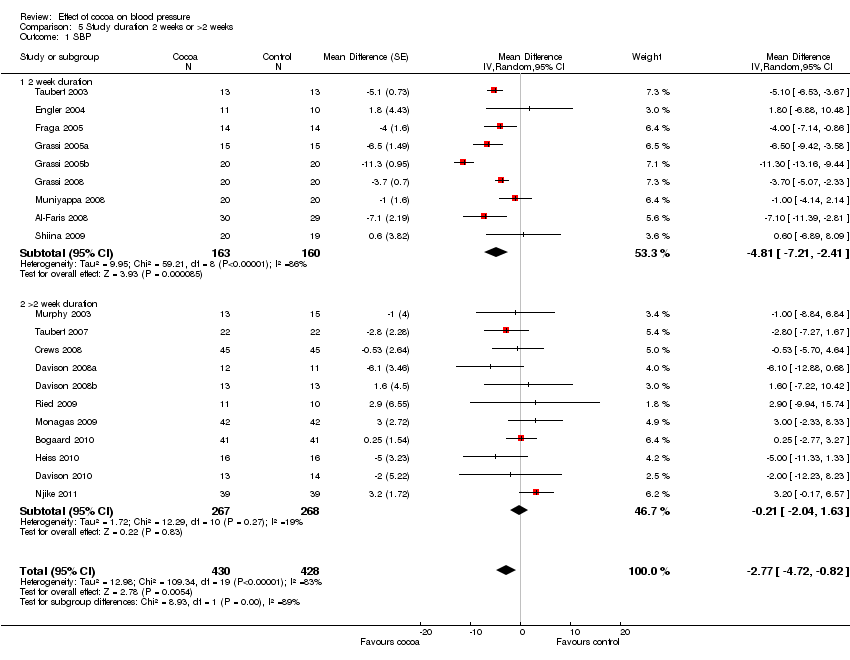
Comparison 5 Study duration 2 weeks or >2 weeks, Outcome 1 SBP.

Comparison 5 Study duration 2 weeks or >2 weeks, Outcome 2 DBP.

Comparison 6 Subjects >50 or <50 years old, Outcome 1 SBP.

Comparison 6 Subjects >50 or <50 years old, Outcome 2 DBP.
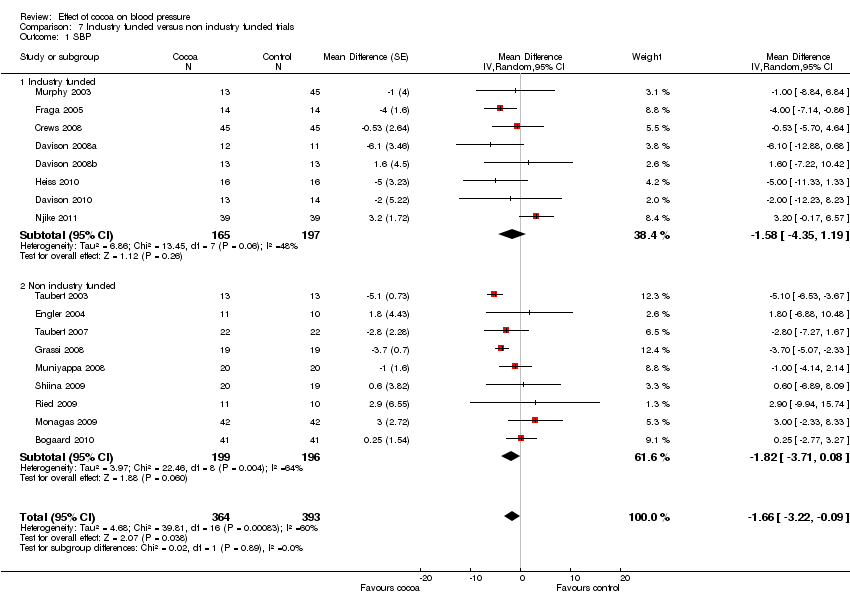
Comparison 7 Industry funded versus non industry funded trials, Outcome 1 SBP.
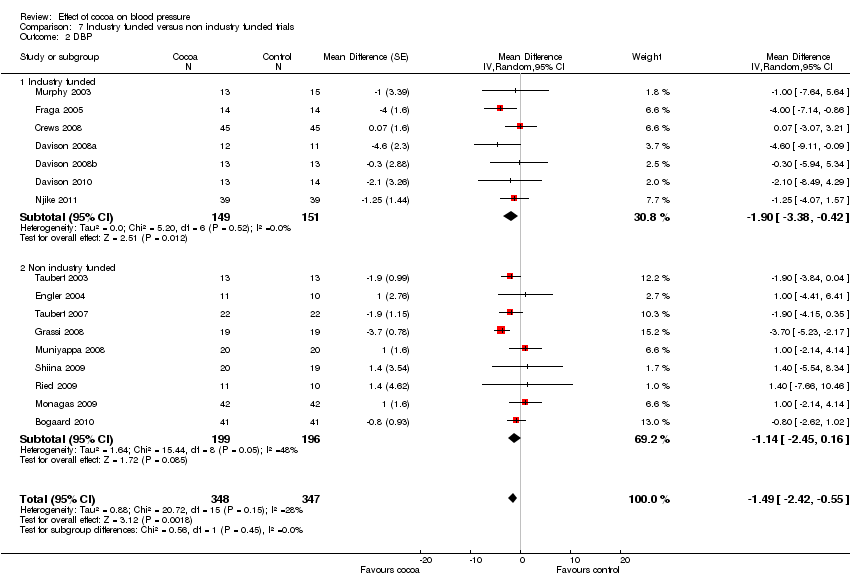
Comparison 7 Industry funded versus non industry funded trials, Outcome 2 DBP.
| Flavanol‐rich cocoa products for blood pressure | ||||||
| Patient or population: adults with or without hypertension | ||||||
| Outcomes | Illustrative comparative risks* (95% CI) | Relative effect | No of Participants | Quality of the evidence | Comments | |
| Assumed risk | Corresponding risk | |||||
| Control | Flavanol‐rich cocoa products | |||||
| Systolic blood pressure | The mean systolic blood pressure ranged across control groups from 110 to 154 mm Hg | The mean systolic blood pressure in the intervention groups was | 856 | ⊕⊕⊝⊝ | ||
| Diastolic blood pressure | The mean diastolic blood pressure ranged across control groups from 66 to 91.6 mm Hg | The mean diastolic blood pressure in the intervention groups was | 824 | ⊕⊕⊝⊝ | ||
| *The basis for the assumed risk (e.g. the median control group risk across studies) is provided in footnotes. The corresponding risk (and its 95% confidence interval) is based on the assumed risk in the comparison group and the relative effect of the intervention (and its 95% CI). | ||||||
| GRADE Working Group grades of evidence | ||||||
| 1 11 out of 20 trials provided insufficient information regarding allocation concealment. 9 trials were single blinded, using unblinded controls, one trial blinded control group but not intervention group.Two trials had more than 20% attrition. | ||||||
| Study | Study Design | Participants | Cocoa# Dosage; Brand | Cocoa product | Total Flavanols (mg)
| Epi‐/ catechin (mg) | Theobromine (mg) | Sugar | Duration | Baseline SBP (mm Hg) | Baseline DBP (mm Hg) | Age; BMI |
| Cocoa / Control group | ||||||||||||
| Taubert 03 | C | 13/13 | 100g bar; Rittersport Halbbitter, D | 50% DC/WC | 500/0 | 89/0 | 560/0 | 49 | 2 weeks | 153.3/153.6 | 84.5/84.2 | 59.5 yrs; 24.1 |
| Murphy 03 | P | 13/15 | 6 tablets; Cocoapro Mars, US | HiFl/LoFl tablets | 234/6.4 | ‐ | ‐ | 0 | 4 weeks | 118/116 | 78/76 | 43.5 yrs; 26.0 |
| Engler 04 | P | 11/10 | 46g bar; Dove Mars, US | HiFl/LoFl DC | 213/0 | 46/0 | ‐ | 15 | 2 weeks | 121/112.8 | 68.1/66.1 | 32.1 yrs; 22.6 |
| Fraga 05 | C | 14/14 | 105g M&M confectionary Mars, US | 16% MC/WC | 168/0 | 39/0 | 179/0 | 57 | 2 weeks | 123/123 | 72/71 | 18.0 yrs; 24.1 |
| Grassi 05a | C | 15/15 | 100g bar; Rittersport, D | 50% DC/WC | 500/0 | 89/0 | 560/0 | 49 | 2 weeks | 112.9/113.2 | 74/73.8 | 33.9 yrs; 22.6 |
| Grassi 05b | C | 20/20 | 100g bar; Rittersport, D | 50% DC/WC | 500/0 | 89/0 | 560/0 | 49 | 2 weeks | 141.3/141.1 | 92.4/91.8 | 43.7 yrs; 25.4 |
| Taubert 07 | P | 22/22 | 6.3g bar; Rittersport, D | 50% DC/WC | 30/0 | 7.1/0 | 26.4/0 | 3 | 18 weeks | 147.7/147.5 | 86.4/86.7 | 63.6 yrs; 24.0 |
| Crews 08 | P | 45/45 | 37g bar + 12g powder; Hershey, US | HiFl/LoFl bar & drink | 755/41 | ‐ | ‐ | 15 | 6 weeks | 126.8/128.6 | 74.2/75 | 68.8 yrs; 25.3 |
| Grassi 08 | C | 19/19 | 100g bar; Cuorenero, Ital | 90% DC/WC | 1080/0 | 150/0 | 170/0 | 0 | 2 weeks | 141.1/140.9 | 91.2/91.1 | 44.8 yrs; 26.5 |
| Muniyappa 08 | C | 20/20 | 62g powder; CocoaPro Mars, US | HiFl/LoFl drink | 902/28 | 236/10 | 674/654 | 17 | 2 weeks | 141/141 | 91/91 | 51.0 yrs; 33.2 |
| Davison 08a | P | 12/11 | powder; Mars, US | HiFl/LoFl drink | 902/36 | ‐ | 337/327 | 9.4 | 12 weeks | 124/124 | 76/77 | 44.9 yrs; 33.6 |
| Davison 08b | P | 13/13 | powder; Mars, US | HiFl/LoFl drink | 902/36 | ‐ | 337/327 | 9.4 | 12 weeks | 126/121 | 78/74 | 45.4 yrs; 33.3 |
| Al‐Faris 08 | P | 30/29 | 100g bar; Galaxy/Dove Mars, US
| 50% DC/WC | 500/0 | 10.6/0 | ‐ | 59 | 2 weeks | 115.9/115.2 | 73/72.8 | 21.3 yrs; 22 |
| Shiina 09 | P | 20/19 | 45g bar; Meiji, Jpn | 80% DC/WC | 550/0 | ‐ | ‐ | 9 | 2 weeks | 116.4/121.6 | 64.7/72.2 | 29.8 yrs; 22.6
|
| Ried 09 | P | 11/10 | 50g bar Haighs, AUS | 70% DC/placebo pill | 750/0 | ‐ | ‐ | 15 | 8 weeks | 135/135.7 | 83.6/77.8 | 53.1 yrs; 26.6 |
| Monagas 09 | C | 42/42 | 40g powder; Nutrexpa, Spain | HiFl/0 in milk | 495/0 | 56.5/0 | 440/0 | 26 | 4 weeks | 138/138 | 84/84 | 69.7 yrs; 27.6 |
| Bogaard 10 | C | 41/41 | 3.6 g powder; Aticoa, Barry Callebaut, Belg | HiFl/LoFl drink
| 529/0 | 38/0 | 543/0
| 1 | 3 weeks | 141.7/141.7 | 84.2/84.2 | 62.0 yrs; 25.9 |
| Heiss 10 | C | 16/16 | powder Cocoapro, Mars, US | HiFl/LoFl drink in milk or water | 750/18 | 130/6 | 186/192 | 8.6 | 4 weeks | 132/131 | ‐ | 64.0 yrs; 27.8 |
| Desch 10 | P | 43/48 | 25g/6g bar; Rittersport, D | 50% DC/DC | 125/30 | 29.5/7.1 | 110/26.4 | 13 | 12 weeks | 135.7/134.3 | 79.3/75.8 | 66.0 yrs; 28.1 |
| Davison 10 | p | 13/14 | 174g powder; Mars, US | HiFl/LoFl drink | 1052/33 | 266/12 | 460.5/ 402.2 | 17.7 | 6 weeks | 143/145.4 | 83.2/88 | 56.6 yrs; 29.3 |
| Njike 11 | C | 38/38 | 22g powder; Hershey, US | HiFl/LoFl drink | 805/9 | 69/0 | 436/0 | 46 | 6 weeks | 123.3/123.6 | 68.5/67.3 | 52.2 yrs; 30.3 |
|
| Variable | Number of studies | Regression coefficient | P‐value |
| SBP | Blinded or non‐blinded control group | 20 | 3.9952 | 0.031 |
|
| Sugar dosage (continuous) | 20 | ‐0.0794 | 0.079 |
|
| Duration: 2 weeks or >2 weeks | 20 | 4.4342 | 0.016 |
|
|
|
|
|
|
| DBP | Blinded or non‐blinded control group | 19 | 3.272 | 0.005 |
|
| Sugar dosage (continuous) | 19 | ‐0.0569 | 0.052 |
|
| Duration: 2 weeks or >2 weeks | 19 | 2.3324 | 0.055 |
|
| Age (continuous) | 19 | 0.0870 | 0.029 |
| Sensitivity analyses
| Comparison | Mean difference (95% CI) | p‐value | I2 | I2 before sensitivity analysis |
| Excluding Grassi 2005b | SBP all | ‐2.33 (‐3.83,‐0.83) | 0.002 | 63% | 83% |
|
| DBP all | ‐1.90 (‐2.88, ‐0.92) | 0.0001 | 44% | 70% |
|
| SBP flavanol‐free subgroup | ‐3.20 (‐4.84, ‐1.56) | 0.0001 | 62% | 86% |
|
| DBP flavanol‐free subgroup | ‐2.29 (‐3.49, ‐1.09) | 0.0002 | 54% | 77% |
|
| SBP hypertensive subgroup | ‐2.84 (‐4.61, ‐1.07) | 0.002 | 63% | 91% |
|
| DBP hypertensive subgroup | ‐1.76 (‐3.09, ‐0.44) | 0.009 | 50% | 85% |
|
| SBP sugar > 10g, BMI > 25 subgroup | 0.95 (‐0.95, 2.85) | 0.33 | 0% | 93% |
|
| DBP sugar > 10g, BMI > 25 subgroup | 0.04 (‐1.42, 1.50) | 0.96 | 0% | 86% |
|
| SBP 2 weeks subgroup | ‐4.12 (‐5.53, ‐2.70) | <0.0001 | 48% | 86% |
|
| DBP 2 weeks subgroup | ‐2.68 (‐4.14, ‐1.22) | 0.0003 | 56% | 77% |
|
| SBP <50 yrs age subgroup | ‐4.33 (‐5.87, ‐2.79) | <0.0001 | 23% | 84% |
|
| DBP <50 yrs age subgroup | ‐3.72 (‐4.70, ‐2.74) | <0.0001 | 0% | 60% |
| Excluding Taubert 2007 | SBP all | ‐2.75 (‐4.79, ‐0.72) | 0.008 | 83% | 83% |
| DBP all | ‐2.20 (‐3.55, ‐0.85) | 0.001 | 71% | 70% | |
| SBP flavanol‐free subgroup | ‐3.76 (‐6.22, ‐1.30) | 0.003 | 87% | 86% | |
| DBP flavanol‐free subgroup | ‐2.77 (‐4.47, ‐1.06) | 0.001 | 78% | 77% | |
| SBP hypertensive subgroup | ‐4.16 (‐7.48, ‐0.84) | 0.01 | 92% | 91% | |
| DBP hypertensive subgroup | ‐2.11 (‐3.58, ‐0.63) | 0.005 | 60% | 85% | |
| SBP >2 weeks subgroup | ‐0.20 (‐1.71, 2.12) | 0.83 | 15% | 19% | |
| DBP >2 weeks subgroup | ‐0.76 (‐1.90, 0.38) | 0.19 | 0% | 0% | |
| SBP >50 yrs age subgroup | ‐0.72 (‐3.48, 2.04) | 0.61 | 76% | 73% | |
| DBP >50 yrs age subgroup | ‐0.70 (‐1.69, 0.28) | 0.16 | 0% | 0% | |
|
|
|
|
|
|
|
| Excluding trials with loss‐of‐follow up/poor compliance > 20% (Muniyappa 2008, Davison 2008b) | SBP all | ‐3.03 (‐5.09, ‐0.97) | 0.004 | 83% | 83% |
|
| DBP all | ‐2.48 (‐3.78, ‐1.18) | 0.0002 | 70% | 70% |
|
| SBP low‐flavanol subgroup | ‐1.24 (‐4.59, 2.12) | 0.47 | 46% | 27% |
|
| DBP low‐flavanol subgroup | ‐1.39 (‐3.15, 0.37) | 0.12 | 0% | 0% |
|
| SBP hypertensive subgroup (–M8) | ‐4.52 (‐7.81, ‐1.22) | 0.007 | 92% | 91% |
|
| DBP hypertensive subgroup (‐M8) | ‐3.12 (‐5.31, ‐0.92) | 0.005 | 84% | 85% |
|
| SBP normotensive subgroup (–D8b) | ‐2.24 (‐4.95, 0.47) | 0.11 | 68% | 66% |
|
| DBP normotensive subgroup (‐D8b) | ‐2.32 (‐4.02, ‐0.62) | 0.007 | 52% | 47% |
|
| SBP sugar >10g, BMI > 25 subgroup (‐M8) | ‐1.07 (‐8.41, 6.26) | 0.77 | 94% | 93% |
|
| DBP sugar >10g, BMI > 25 subgroup (‐M8) | ‐1.74 (‐5.49, 2.00) | 0.36 | 86% | 86% |
|
| SBP sugar <10g, BMI > 25 subgroup (‐D8b) | ‐2.77 (‐5.07, ‐0.46) | 0.02 | 41% | 37% |
|
| DBP sugar <10g, BMI > 25 subgroup (‐D8b) | ‐2.55 (‐4.60, ‐0.49) | 0.02 | 55% | 45% |
|
| SBP 2 weeks subgroup (‐M8) | ‐5.35 (‐7.35, ‐2.85) | <0.0001 | 86% | 86% |
|
| DBP 2 weeks subgroup (‐M8) | ‐3.78 (‐5.50, ‐2.06) | <0.0001 | 73% | 77% |
|
| SBP >2 wks subgroup (‐D8b) | ‐0.35 (‐2.32, 1.63) | 0.73 | 26% | 19% |
|
| DBP >2 wks subgroup (‐D8b) | ‐1.01 (‐2.05, 0.02) | 0.06 | 0% | 0% |
|
| SBP <50 yrs age subgroup (‐D8b) | ‐5.46 (‐8.47, ‐2.45) | 0.0004 | 86% | 84% |
|
| DBP <50 yrs age subgroup (‐D8b) | ‐4.37 (‐5.94, ‐2.79) | <0.0001 | 60% | 60% |
|
| SBP >50 yrs age subgroup (‐M8) | ‐0.93 (‐3.79, 1.93) | 0.52 | 75% | 73% |
|
| DBP >50 yrs age subgroup (‐M8) | ‐1.06 (‐2.01, ‐0.12) | 0.03 | 0% | 0% |
| Using alternative correlation coefficients for cross‐over trials (main analysis: r=0.68) | SBP r=0.5 | ‐2.85 (‐4.76, ‐0.93) | 0.004 | 75% | 83% |
| SBP r=0.3 | ‐2.93 (‐4.82, ‐1.05) | 0.002 | 67.3% | 83% | |
| DBP r=0.5 | ‐2.23 (‐3.45, ‐1.00) | <0.0001 | 57.2% | 70% | |
| DBP r=0.3 | ‐2.24 (‐3.44, ‐1.05) | <0.0001 | 44.7% | 70% |
| Study | Study design
| Participants* Cocoa/ Control | Withdrawn Cocoa/Control | Adverse effects Cocoa/Control | Compliance rate
| Change in heart rate Mean (SD) |
| Taubert 03 | C | 13/13 | 0 | ‐ | 100% | Not significant |
| Murphy 03 | P | 13/15 | 3 | Family illness (2) Non‐compliance in final week (1) | 90% | ‐ |
| Engler 04 | P | 11/10 | 0 | ‐ | 100% | ‐ |
| Fraga 05 | C | 14/14 | 1 | no reason given | 96% | ‐ |
| Grassi 05a | C | 15/15 | 0 | ‐ | 100% | ‐ |
| Grassi 05b | C | 20/20 | 0 | ‐ | 100% | ‐ |
| Taubert 07 | P | 22/22 | 0 | ‐ | 100% | ‐ |
| Crews 08 | P | 45/45 | 6/5 | Gastrointestinal upset/headache/cold sweat (2/1) Bronchitis (1/0) Jitteriness/increased energy (1/0) Artrial arrhythmia/medication change (1/0) Distaste of study product (1/1) Family illness (0/1) Unspecified reason (0/1) No adherence to trial regimen (0/1) | 89% | Cocoa: 4.72 (7.93) Control: 0.33 (8.19) P= 0.007 |
| Grassi 08 | C | 19/19 | 0 | ‐ | 100% | ‐ |
| Muniyappa 08 | C | 20/20 | 5/4 | Loss‐to‐follow‐up (0/1) Discontinued intervention (4/2) due to intolerance to treatment, family emergencies, personal problems excluded from analysis (1/1) | 69% | ‐ |
| Davison 08a | P | 12/11 | 7 | Time restrictions, personal circumstances (14) Non‐compliance (exercise or diet) (2)
| 79% | Not significant |
| Davison 08b | P | 13/13 | 5 | 84% | Not significant | |
| Al‐Faris 08 | P | 30/29 | 0 | ‐ | 100% | Not significant |
| Shiina 09 | P | 20/19 | 0 | ‐ | 100% | Not significant |
| Ried 09 | P | 11/10 | 2/2 | Study product unpalatable (2/0) Gastrointestinal upset (0/1) Illness unrelated to study (0/1) | 84% | ‐ |
| Monagas 09 | C | 42/42 | 0 | Constipation (resolved with fibre intake) | 100% | Not significant |
| Bogaard 10 | C | 41/41 | 3 | Nausea (1) Headache (1) Arrythmia unrelated (1)
| 93% | ‐ |
| Heiss 10 | C | 16/16 | 3 | Did not come to first visit | 94% | Not significant |
| Davison 10 | P | 13/14 | 7 | Mild gastric symptoms (1) Non‐compliance to study protocol (1) Withdrew due to personal circumstances (5) | 88% | Not significant |
| Njike 11 | C | 38/38 | 7 | Non‐compliance to study protocol (1) Withdrew due to personal reasons (6)
| 84% | ‐ |
| Outcome or subgroup title | No. of studies | No. of participants | Statistical method | Effect size |
| 1 SBP Show forest plot | 20 | 856 | Mean Difference (Random, 95% CI) | ‐2.77 [‐4.72, ‐0.82] |
| 2 DBP Show forest plot | 19 | 824 | Mean Difference (Random, 95% CI) | ‐2.20 [‐3.46, ‐0.93] |
| Outcome or subgroup title | No. of studies | No. of participants | Statistical method | Effect size |
| 1 SBP Show forest plot | 20 | 856 | Mean Difference (Random, 95% CI) | ‐2.77 [‐4.72, ‐0.82] |
| 1.1 Flavanol free | 12 | 512 | Mean Difference (Random, 95% CI) | ‐3.70 [‐6.02, ‐1.38] |
| 1.2 Low flavanol | 8 | 344 | Mean Difference (Random, 95% CI) | ‐0.71 [‐2.99, 1.57] |
| 2 DBP Show forest plot | 19 | 824 | Mean Difference (Random, 95% CI) | ‐2.20 [‐3.46, ‐0.93] |
| 2.1 Flavanol free | 12 | 512 | Mean Difference (Random, 95% CI) | ‐2.71 [‐4.26, ‐1.15] |
| 2.2 Low flavanol | 7 | 312 | Mean Difference (Random, 95% CI) | ‐0.78 [‐2.26, 0.70] |
| Outcome or subgroup title | No. of studies | No. of participants | Statistical method | Effect size |
| 1 SBP Show forest plot | 19 | 817 | Mean Difference (Random, 95% CI) | ‐2.89 [‐4.88, ‐0.90] |
| 1.1 Hypertensive | 7 | 297 | Mean Difference (Random, 95% CI) | ‐3.99 [‐7.02, ‐0.97] |
| 1.2 Normotensive | 12 | 520 | Mean Difference (Random, 95% CI) | ‐2.04 [‐4.64, 0.57] |
| 2 DBP Show forest plot | 17 | 753 | Mean Difference (Random, 95% CI) | ‐2.20 [‐3.17, ‐1.23] |
| 2.1 Hypertensive | 7 | 287 | Mean Difference (Random, 95% CI) | ‐2.11 [‐3.35, ‐0.86] |
| 2.2 Normotensive | 10 | 466 | Mean Difference (Random, 95% CI) | ‐2.22 [‐3.83, ‐0.60] |
| Outcome or subgroup title | No. of studies | No. of participants | Statistical method | Effect size |
| 1 SBP Show forest plot | 13 | 609 | Mean Difference (Random, 95% CI) | ‐1.86 [‐4.95, 1.23] |
| 1.1 <10g sugar, BMI >25 | 6 | 229 | Mean Difference (Random, 95% CI) | ‐2.52 [‐4.74, ‐0.31] |
| 1.2 >10sugar, BMI >25 | 7 | 380 | Mean Difference (Random, 95% CI) | ‐1.12 [‐7.08, 4.85] |
| 2 DBP Show forest plot | 12 | 577 | Mean Difference (Random, 95% CI) | ‐1.79 [‐3.72, 0.13] |
| 2.1 <10g sugar, BMI >25 | 5 | 197 | Mean Difference (Random, 95% CI) | ‐2.34 [‐4.19, ‐0.50] |
| 2.2 >10g sugar, BMI >25 | 7 | 380 | Mean Difference (Random, 95% CI) | ‐1.32 [‐4.70, 2.06] |
| Outcome or subgroup title | No. of studies | No. of participants | Statistical method | Effect size |
| 1 SBP Show forest plot | 20 | 858 | Mean Difference (Random, 95% CI) | ‐2.77 [‐4.72, ‐0.82] |
| 1.1 2 week duration | 9 | 323 | Mean Difference (Random, 95% CI) | ‐4.81 [‐7.21, ‐2.41] |
| 1.2 >2 week duration | 11 | 535 | Mean Difference (Random, 95% CI) | ‐0.21 [‐2.04, 1.63] |
| 2 DBP Show forest plot | 19 | 823 | Mean Difference (Random, 95% CI) | ‐2.20 [‐3.46, ‐0.93] |
| 2.1 2 week duration | 9 | 321 | Mean Difference (Random, 95% CI) | ‐3.19 [‐3.00, ‐1.38] |
| 2.2 >2 week duration | 10 | 502 | Mean Difference (Random, 95% CI) | ‐0.99 [‐2.01, 0.03] |
| Outcome or subgroup title | No. of studies | No. of participants | Statistical method | Effect size |
| 1 SBP Show forest plot | 20 | 856 | Mean Difference (Random, 95% CI) | ‐2.77 [‐4.72, ‐0.82] |
| 1.1 <50 years | 10 | 332 | Mean Difference (Random, 95% CI) | ‐4.57 [‐7.41, ‐1.73] |
| 1.2 >50 years | 10 | 524 | Mean Difference (Random, 95% CI) | ‐0.96 [‐3.44, 1.52] |
| 2 DBP Show forest plot | 19 | 824 | Mean Difference (Random, 95% CI) | ‐2.20 [‐3.46, ‐0.93] |
| 2.1 <50 years | 10 | 332 | Mean Difference (Random, 95% CI) | ‐3.85 [‐5.45, ‐2.26] |
| 2.2 >50 years | 9 | 492 | Mean Difference (Random, 95% CI) | ‐0.89 [‐1.80, 0.01] |
| Outcome or subgroup title | No. of studies | No. of participants | Statistical method | Effect size |
| 1 SBP Show forest plot | 17 | 757 | Mean Difference (Random, 95% CI) | ‐1.66 [‐3.22, ‐0.09] |
| 1.1 Industry funded | 8 | 362 | Mean Difference (Random, 95% CI) | ‐1.58 [‐4.35, 1.19] |
| 1.2 Non industry funded | 9 | 395 | Mean Difference (Random, 95% CI) | ‐1.82 [‐3.71, 0.08] |
| 2 DBP Show forest plot | 16 | 695 | Mean Difference (Random, 95% CI) | ‐1.49 [‐2.42, ‐0.55] |
| 2.1 Industry funded | 7 | 300 | Mean Difference (Random, 95% CI) | ‐1.90 [‐3.38, ‐0.42] |
| 2.2 Non industry funded | 9 | 395 | Mean Difference (Random, 95% CI) | ‐1.14 [‐2.45, 0.16] |