Kakao za snižavanje krvnog tlaka
Abstract
Background
High blood pressure is an important risk factor for cardiovascular disease, contributing to about 50% of cardiovascular events worldwide and 37% of cardiovascular‐related deaths in Western populations. Epidemiological studies suggest that cocoa‐rich products reduce the risk of cardiovascular disease. Flavanols found in cocoa have been shown to increase the formation of endothelial nitric oxide which promotes vasodilation and therefore blood pressure reduction. Here we update previous meta‐analyses on the effect of cocoa on blood pressure.
Objectives
To assess the effects on blood pressure of chocolate or cocoa products versus low‐flavanol products or placebo in adults with or without hypertension when consumed for two weeks or longer.
Search methods
This is an updated version of the review initially published in 2012. In this updated version, we searched the following electronic databases from inception to November 2016: Cochrane Hypertension Group Specialised Register, CENTRAL, MEDLINE and Embase. We also searched international trial registries, and the reference lists of review articles and included trials.
Selection criteria
Randomised controlled trials (RCTs) investigating the effects of chocolate or cocoa products on systolic and diastolic blood pressure in adults for a minimum of two weeks duration.
Data collection and analysis
Two review authors independently extracted data and assessed the risks of bias in each trial. We conducted random‐effects meta‐analyses on the included studies using Review Manager 5. We explored heterogeneity with subgroup analyses by baseline blood pressure, flavanol content of control group, blinding, age and duration. Sensitivity analyses explored the influence of unusual study design.
Main results
Thirty‐five trials (including 40 treatment comparisons) met the inclusion criteria. Of these, we added 17 trials (20 treatment comparisons) to the 18 trials (20 treatment comparisons) in the previous version of this updated review.
Trials provided participants with 30 to 1218 mg of flavanols (mean = 670 mg) in 1.4 to 105 grams of cocoa products per day in the active intervention group. The control group received either a flavanol‐free product (n = 26 treatment comparisons) or a low‐flavanol‐containing cocoa powder (range 6.4 to 88 mg flavanols (mean = 55 mg, 13 treatment comparisons; 259 mg, 1 trial).
Meta‐analyses of the 40 treatment comparisons involving 1804 mainly healthy participants revealed a small but statistically significant blood pressure‐reducing effect of flavanol‐rich cocoa products compared with control in trials of two to 18 weeks duration (mean nine weeks):
Mean difference systolic blood pressure (SBP) (95% confidence interval (CI): ‐1.76 (‐3.09 to ‐0.43) mmHg, P = 0.009, n = 40 treatment comparisons, 1804 participants;
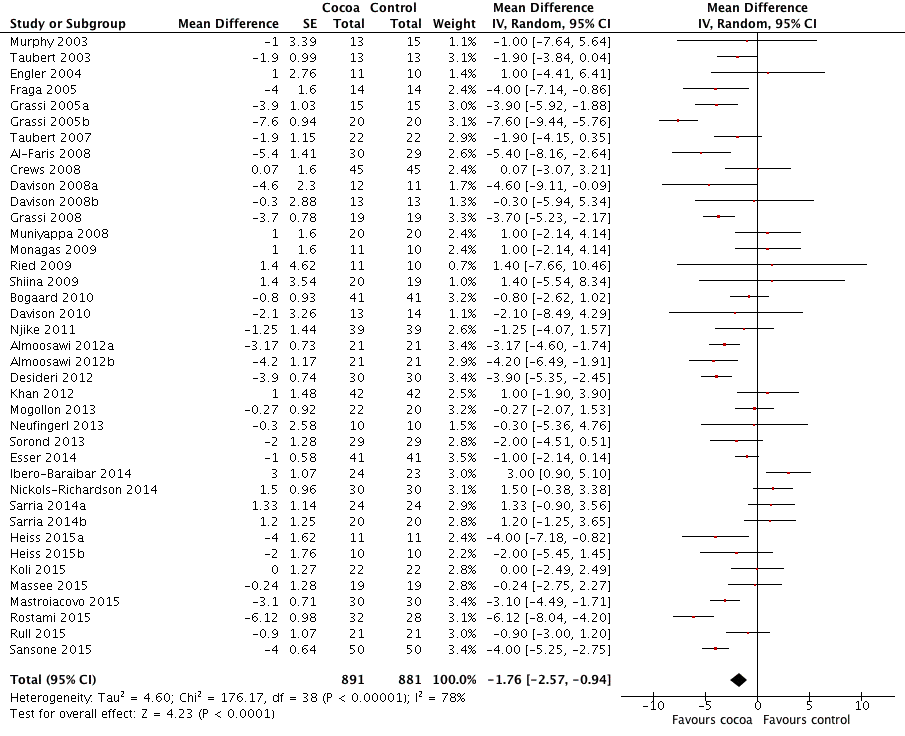
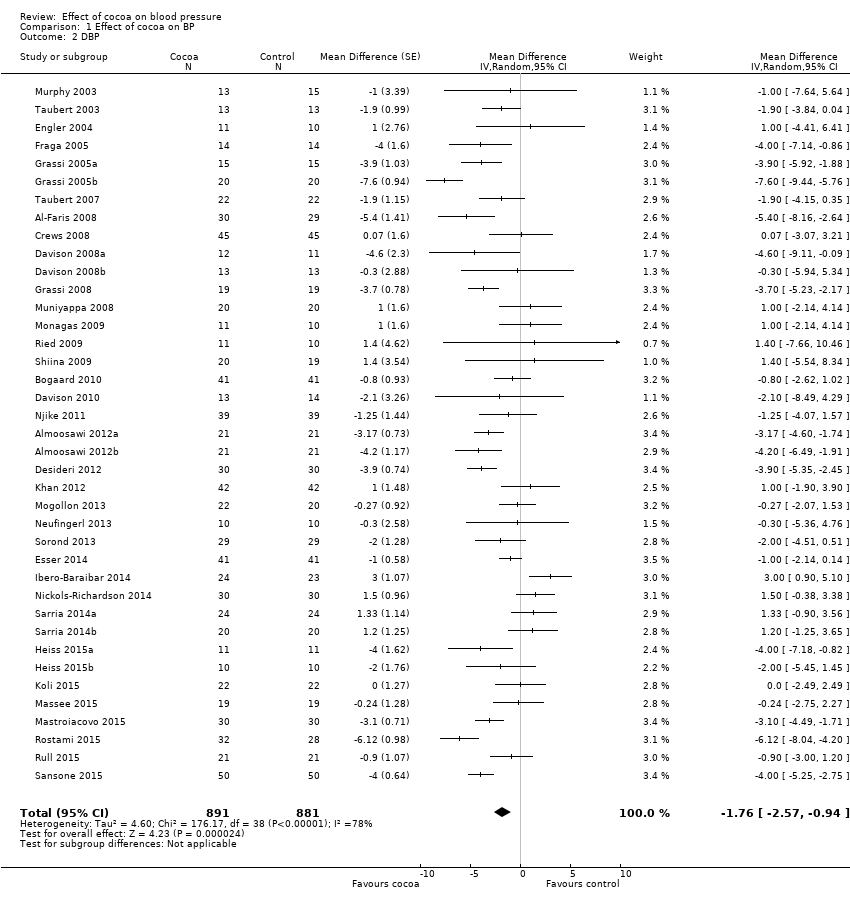
Mean difference diastolic blood pressure (DBP) (95% CI): ‐1.76 (‐2.57 to ‐0.94) mmHg, P < 0.001, n = 39 treatment comparisons, 1772 participants.
Baseline blood pressure may play a role in the effect of cocoa on blood pressure. While systolic blood pressure was reduced significantly by 4 mmHg in hypertensive people (n = 9 treatment comparisons, 401 participants), and tended to be lowered in prehypertensive people (n= 8 treatment comparisons, 340 participants), there was no significant difference in normotensive people (n = 23 treatment comparisons, 1063 participants); however, the test for subgroup differences was of borderline significance (P = 0.08; I2 = 60%), requiring further research to confirm the findings.
Subgroup meta‐analysis by blinding suggested a trend towards greater blood pressure reduction in unblinded trials compared to double‐blinded trials, albeit statistically not significant. Further research is needed to confirm whether participant expectation may influence blood pressure results. Subgroup analysis by type of control (flavanol‐free versus low‐flavanol control) did not reveal a significant difference.
Whether the age of participants plays a role in the effect of cocoa on blood pressure, with younger participants responding with greater blood pressure reduction, needs to be further investigated.
Sensitivity analysis excluding trials with authors employed by trials sponsoring industry (33 trials, 1482 participants) revealed a small reduction in effect size, indicating some reporting bias.
Due to the remaining heterogeneity, which we could not explain in terms of blinding, flavanol content of the control groups, age of participants, or study duration, we downgraded the quality of the evidence from high to moderate.
Results of subgroup analyses should be interpreted with caution and need to be confirmed or refuted in trials using direct randomised comparisons.
Generally, cocoa products were highly tolerable, with adverse effects including gastrointestinal complaints and nausea being reported by 1% of participants in the active cocoa intervention group and 0.4% of participants in the control groups (moderate‐quality evidence).
Authors' conclusions
This review provides moderate‐quality evidence that flavanol‐rich chocolate and cocoa products cause a small (2 mmHg) blood pressure‐lowering effect in mainly healthy adults in the short term.
These findings are limited by the heterogeneity between trials, which could not be explained by prespecified subgroup analyses, including blinding, flavanol content of the control groups, age of participants, or study duration. However, baseline blood pressure may play a role in the effect of cocoa on blood pressure; subgroup analysis of trials with (pre)hypertensive participants revealed a greater blood pressure‐reducing effect of cocoa compared to normotensive participants with borderline significance.
Long‐term trials investigating the effect of cocoa on clinical outcomes are also needed to assess whether cocoa has an effect on cardiovascular events and to assess potential adverse effects associated with chronic ingestion of cocoa products.
PICO
Laički sažetak
Kakao za snižavanje krvnog tlaka
Istraživačko pitanje
U ovom Cochrane sustavnom pregledu procijenjen je učinak proizvoda od kakaa na krvni tlak odraslih ljudi, koji su proizvode od kakaa konzumirali svakodnevno tijekom najmanje dva tjedna. Nakon pretraživanja literature uključeno je 35 istraživanja u kojima je analizirano 40 različitih usporedbi terapija.
Dosadašnje spoznaje
Crna čokolada i proizvodi od kakaa bogati su kemijskim spojevima koji se nazivaju flavanoli. Flavanoli su u zadnje vrijeme pobudili zanimanje javnosti jer se pretpostavlja da mogu smanjiti arterijski krvni tlak. Povišeni arterijski krvni tlak je poznati čimbenik rizika za srčano‐žilne bolesti (kardiovaskularne bolesti). Smatra se da flavonoli mogu sniziti arterijski krvni tlak djelovanjem na širenje krvnih žila putem dušikovog oksida.
Obilježja uključenih istraživanja
Uključena istraživanja bila su kratka. Uglavnom su trajala između 2 i 12 tjedana. Samo jedna studija trajala je 18 tjedana. Istraživanja su uključila 1804 odraslih, uglavnom zdravih ispitanika. Ispitanici su dobijali 30‐1218 mg flavanola (prosječno 670 mg) u 1,4 do 105 grama proizvoda kaka svaki dan u aktivnim intervencijskim skupinama. Sedam istraživanja financirale su tvrtke koje imaju Dokazi se temelje na literaturi objavljenoj do studenog 2016.
Ključni rezultati
Meta‐analiza 40 terapijskih usporedbi pokazala je malen, ali statistički značajan učinak proizvoda od kakaa na snižavanje arterijskog krvog tlaka (sistoličkog i dijastoličnog) od 1,8 mm Hg. Taj mali učinak može pojačati učinak drugih mogućnosti liječenja i može doprinijeti smanjenju rizika od srčano‐žilnih bolesti.
Istraženo je mogu li se razlike između istraživanja objasniti razlikama u razini arterijskog krvnog tlaka na početku istraživanja, dobi ispitanika, poznavanju kojoj skupini ispitanici pripadaju (aktivnoj ili kontrolnoj), sadržaju flavonola u kontrolnoj skupini ili trajanju istraživanja. Razina arterijskog krvnog tlaka na početku istraživanja (visok krvni tlak ili normalan krvni tlak) vjerojatno utječe na veličinu učinka kakaa. Utjecaj drugih čimbenika treba potvrditi ili odbaciti u budućim istraživanjima.
Nuspojave uključuju probavne tegobe i odbojnost prma pojedinim istraživanim proizvodima. Takve nuspojave opisalo je 1% osoba u aktivnoj intervencijskoj skupini koja je primala kakao, a 0,4% osoba u kontrolnim skupinama.
Potrebna su dugotrajna istraživanja koja će procijeniti može li dugoročno konzumiranje proizvoda kakaa koji su bogati flavonolina imati povoljan učinak na arterijski krvni tlak i zdravlje srca i krvnih žila tijeko duljeg vremena. Također je nužno ispitati nuspojave svakodnevnog konzumiranja proizvoda kakaa.
Kvaliteta dokaza
Dokazi su umjerene kvalitete. Nisu pronađeni klinički pokusi koji su istražili učinak dugotrajnog svakodnevnog konzumiranja proizvoda od kakaa na arterijski krvni tlak. Također nisu pronađena istraživanja koja su mjerila posljedice visokog krvnog tlaka, kao što su srčani ili moždani udari.
Authors' conclusions
Summary of findings
| Flavanol‐rich cocoa products for blood pressure | ||||||
| Patient or population: adults with or without hypertension | ||||||
| Outcomes | Illustrative comparative risks* (95% CI) | Relative effect | No of Participants | Quality of the evidence | Comments | |
| Assumed risk | Corresponding risk | |||||
| Control | Flavanol‐rich cocoa products | |||||
| Systolic blood pressure | The mean systolic blood pressure ranged across control groups from 107 to 154 mm Hg | The mean systolic blood pressure in the intervention groups was | 1804 | ⊕⊕⊕⊕ | ||
| Diastolic blood pressure | The mean diastolic blood pressure ranged across control groups from 66 to 92 mm Hg | The mean diastolic blood pressure in the intervention groups was | 1772 | ⊕⊕⊕⊕ | ||
| Withdrawals due to adverse effects | 8 trials reported no withdrawals and no adverse effects. 9 trials reported adverse effects, including gastrointestinal complaints (cocoa groups: n = 8/760 (1%), control groups: n = 3/754 (0.4%)); dislike of the trial product (cocoa: n = 4/760; control: n = 1/754), headache (cocoa: n = 2/760; control: n = 1/754), and jitteriness (cocoa: n = 1/760, control: n = 0/754). | 1514 (31 trials) reported on withdrawals and adverse effects | ⊕⊕⊕⊕ | |||
| *The basis for the assumed risk (e.g. the median control group risk across studies) is provided in footnotes. The corresponding risk (and its 95% confidence interval) is based on the assumed risk in the comparison group and the relative effect of the intervention (and its 95% CI). | ||||||
| GRADE Working Group grades of evidence | ||||||
| 1.Downgraded to moderate quality due to high heterogeneity which cannot be explained by subgroup analyses. SBP/DBP: I2 = 87%/78%. 2.Good quality across 40 treatment comparisons. Only 5 trials (12.5%) had 2 items at high risk of bias, 19 trials (47.5%) had 1 item at high risk of bias, and 16 trials (40%) had no items at high risk of bias. 17 trials were unblinded or single‐blinded. 7 industry‐sponsored trials had authors employed by industry. Only 4 trials (10%) had more than 20% attrition. We explored influence of trials with items at high risk of bias by subgroup and sensitivity analysis. | ||||||
Background
Dark chocolate and flavanol‐rich cocoa products have attracted interest as an alternative treatment option for hypertension, a known risk factor for cardiovascular disease. Even small reductions in blood pressure may substantially reduce cardiovascular risk. Current guidelines strongly recommend integration of lifestyle modification and complementary treatment with the use of conventional blood pressure medications.
The interest in the effect of cocoa on blood pressure (BP) started with the discovery that an island population in Central America, the Kuna Indians, had a distinctively low rate of hypertension coupled with a consistent healthy low blood pressure unaffected by age (Hollenberg 2006; Kean 1944). The majority of the Kuna Indians live on the San Blas Island off Panama (population approximately 35,000); those Kuna Indians who migrated to the mainland had a higher prevalence of hypertension as well as an age‐dependent rise in blood pressure, implying that lifestyle factors such as diet rather than genetics play a protective role (McCullough 2006). Island‐dwelling Kuna Indians consume about three to four cups of cocoa drinks on average per day, while the mainland‐dwelling Kuna Indians consume up to 10 times less cocoa (McCullough 2006; Schroeter 2006). Average high salt intake was not associated with the differences in blood pressure (McCullough 2006). Mean blood pressure of the island‐dwelling adult Kuna Indians hovers around 110 mmHg systolic and 70 mmHg diastolic, while on the mainland the observed age‐related rise in blood pressure and prevalence of hypertension is comparable with that of Western populations (Hollenberg 2006).
Description of the condition
High blood pressure is a critically important risk factor for cardiovascular disease, attributable for 47% of ischaemic heart disease and 54% of stroke events worldwide (Lawes 2008). More than a third (37%) of cardiovascular deaths are attributed to hypertension in Western populations (Martiniuk 2007), and 13.5% globally (Lawes 2008). The association between cardiovascular risk and blood pressure levels is continuous (McInnes 2005) with the risk of ischaemic heart disease and stroke halved for every 20 mmHg reduction in systolic blood pressure (SBP) and 10 mmHg diastolic blood pressure (DBP) (Lewington 2002). Even small reductions in blood pressure may therefore reduce cardiovascular events at a population level.
However, a steady increase in SBP with age is expected, whereas DBP tends to fall after middle age, with studies in elderly and middle‐aged populations suggesting a nonlinear J‐ or U‐shaped relationship between blood pressure and mortality (Bangalore 2010; Denker 2013). Appropriate assessment of an individual’s BP status is important to guide whether antihypertension therapy is indicated or to avoid potential overtreatment.
Blood pressure levels are defined as:
Primary hypertension: SBP ≥ 140 mmHg or DBP ≥ 90 mm‐Hg
Prehypertension: SBP 120 ‐ 139 mmHg or DBP 80 ‐ 89 mmHg
Normotension: SBP < 120 mmHg or DBP < 80 mmHg, secondary hypertension
Description of the intervention
Cocoa is extracted from cacao beans, the fatty seeds of the Theobroma cacao tree. Cocoa is rich in flavanols, particularly epicatechin, catechin and procyanidins, proposed to be responsible for the blood pressure‐lowering effect (Corti 2009; Heiss 2010a). Flavanols are also found in other plant‐derived produce, including beans, apricots, blackberries, apples and tea leaves, albeit in a lower concentration than in cocoa products (460 ‐ 610 mg/kg of flavanol monomers; 4 ‐ 5 g/kg of flavanol polymers) (Fernandez‐Murga 2011; Hammerstone 2000). Flavanol intake is, however, also dependent on serving size, and flavanol content depends on the processing of the cacao beans and raw cocoa.
Traditionally cocoa was consumed as a cold unsweetened drink of raw dried cacao powder, often mixed with starch and spices by the native Latin‐American Indians, but this was considered bitter and unpalatable by the early European explorers, including Christopher Columbus in 1502 and Hernando Cortes in 1519. The Spanish brought cocoa to Europe, added sugar to it and heated the drink (Dillinger 2000; Lippi 2009). Subsequent roasting (up to 120 °C), mixing (conching), alkalising (dutching), adding sugar, milk, vanilla and lecithin emulsifiers make chocolate as we know it today (Beckett 2008). Various chocolate manufacturers have fine‐tuned the processing, leading to different flavours and smoothness of chocolates, but also to altered cocoa and flavanol content in various cocoa products.
Dark chocolate contains larger amounts of cocoa (50% ‐ 85%) than milk chocolate (20% ‐ 30%). Different processes influence the flavanol content of the cocoa in the chocolate; a 70% cocoa‐containing chocolate bar from one company therefore might not contain the same amount of flavanols and flavanol composition as a 70% chocolate bar from another company. Content and composition of flavanols depend on the variety and ripeness of cocoa beans used, as well as the manufacturing steps.
Fresh and fermented cocoa beans contain about 10% of flavanols (100 mg/g). The cocoa powder consumed by the Kuna Indians contains about 3.6% of flavanols, and cocoa‐rich dark chocolate on the market about 0.5% of flavanols (Chaitman 2006; Chevaux 2001). Moreover, heavy dutching (the alkalising of chocolate to pH 7 ‐ 8) can reduce the flavanol content to less than 10 mg per 100 grams (0.001%).
Research suggests that the monomeric portion of cocoa flavanols, epicatechin and catechin and to a lesser extent the polymeric flavanols, the procyanidins, are linked to blood pressure and vasoactive effects (Schroeter 2006). Modern processing of cacao reduces the monomeric flavanol content and influences the epicatechin/catechin ratio (Payne 2010). Fresh and fermented cocoa beans contain between 2.5 and 16.5 mg of epicatechin per gram, depending on the variety, the growing region and harvesting practices (Kim 1984; Wollgast 2000), whereas processed cocoa retains only 2% ‐ 18% of the original epicatechin, due to roasting and dutching (Payne 2010). Because of the large variation in flavanol content in chocolate and cocoa products, it is critical to compare the dosages of flavanols rather than simply the amounts of chocolate or administered cocoa products in clinical trials investigating the effect of cocoa on blood pressure.
How the intervention might work
The blood pressure‐lowering properties of cocoa have been linked to the formation of endothelial nitric oxide (NO) which promotes vasodilation and consequently lowers blood pressure. Increased NO production might be triggered by upregulation of NO‐synthase through the insulin‐mediated signalling pathway (Addison 2008). Insulin sensitivity has been shown to be improved after cocoa intake in a number of trials (Davison 2008a; Faridi 2008; Grassi 2005a; Grassi 2008), although Muniyappa 2008 did not confirm this. Secondly, cocoa flavanols have been shown to inhibit angiotensin converting enzyme (ACE) activity, and hence reduce blood pressure (Actis‐Goretta 2006; Persson 2011). Thirdly, there is evidence to suggest that cocoa flavanols have an indirect antioxidant effect within the cardiovascular system, upregulating NO‐synthase activity and hence reducing blood pressure (Fraga 2011; Keen 2005).
Why it is important to do this review
In the last decade, several clinical trials have investigated the effect of chocolate and cocoa products on blood pressure. This systematic review updates previous meta‐analyses by Taubert 2007a (including five trials), Desch 2010a (10 trials), Ried 2010 (15 trials), and updates a previous version of this Cochrane Review (20 treatment comparisons) (Ried 2012). In addition, we explore the influence of baseline blood pressure, type of control (flavanol dosage), age, duration, and trial quality, in particular blinding, on blood pressure outcomes.
Objectives
To assess the effects on blood pressure of chocolate or cocoa products versus low‐flavanol products or placebo in adults with or without hypertension when consumed for two weeks or longer.
Methods
Criteria for considering studies for this review
Types of studies
Randomised controlled parallel or cross‐over, single‐blind, double‐blind or open‐label trials of 14 days or longer duration that reported the clinical mean or median with or without standard deviation (SD) or standard error (SE) SBP or DBP at baseline, before and after intervention.
Types of participants
Adults, with no further restrictions.
Types of interventions
We included trials if the control group received an intervention, e.g. a placebo or a minimal dose of flavanol‐containing cocoa product.
We excluded:
-
Trials in which the control dose exceeds 25% cocoa polyphenols of the active dose
-
Trials testing isolated flavanols on blood pressure
-
Trials with a very high attrition rate (loss to follow‐up greater than 50%)
Types of outcome measures
Primary outcomes
Difference between cocoa and control group in systolic and diastolic blood pressure at final follow‐up, and adjusted for baseline differences.
Secondary outcomes
Number of participants who withdrew due to adverse effects or intolerance, and total adverse events.
Search methods for identification of studies
Electronic searches
We searched the following electronic databases on OVID for primary studies:
-
Cochrane Hypertension Group Specialised Register (1948 ‐ Nov 2016), Cochrane Central Register of Controlled Trials (CENTRAL) (2015, Issue 2), MEDLINE (1948 ‐ Nov 2016), Embase (1980 ‐ Nov 2016), and Food Science and Technology Abstracts (1969 ‐ Nov 2016).
-
International trial registries (clinicaltrials.gov; www.trialregister.nl; www.anzctr.org.au; www.controlled‐trials.com; www.apps.who.int/trialsearch/WHO clinical trials) for unpublished but completed studies investigating chocolate/cocoa for blood pressure.
We searched the electronic databases using a strategy combining the Cochrane Highly Sensitive Search Strategy for identifying randomised trials in MEDLINE: sensitivity‐maximising version (2008 revision) with selected MeSH terms and free‐text terms, including cocoa, chocolate, blood pressure, and hypertension, with no language restrictions. The MEDLINE search strategy (Appendix 1) was translated into the Hypertension Group Specialised Register (Appendix 2), CENTRAL (Appendix 3), Embase (Appendix 4), and Food Science and Technology Abstracts (Appendix 5), using the appropriate controlled vocabulary as applicable, and the Database of Abstracts of Reviews of Effectiveness (DARE) and the Cochrane Database of Systematic Reviews for related reviews.
Searching other resources
-
We identified reference lists of all papers and relevant reviews.
-
We contacted authors of relevant papers regarding any further published or unpublished work.
-
We searched ISI Web of Science for papers which cite studies included in the review.
Data collection and analysis
Selection of studies
Two review authors independently assessed titles and abstracts of search results for relevant articles, and critically appraised the full text of relevant articles according to the inclusion criteria listed above. We resolved any discrepancies by discussion.
Data extraction and management
Two review authors independently extracted data using a standardised data extraction form and then cross‐checked them.
Assessment of risk of bias in included studies
Two review authors assessed the risks of bias for each trial by using the Cochrane tool for assessing risk of bias. This covers random sequence generation (selection bias), allocation concealment (selection bias), incomplete outcome data (attrition bias), selective reporting (reporting bias), blinding of participants and personnel (performance bias), blinding of outcome assessment (detection bias), and source of funding (other bias).
Measures of treatment effect
Mean difference in SBP/DBP in mmHg at final follow‐up, adjusted for baseline differences. We estimated the precision of mean differences as the standard deviation (SD) at final follow‐up.
When blood pressure measurements were reported in more than one position, the order of preference was: 1) sitting; 2) standing; and 3) supine.
When both clinical and ambulatory blood pressure measurements were available, the order of preference was: 1) clinical; 2) ambulatory.
Unit of analysis issues
If results are reported for several periods of follow‐up, we preferred the longest follow‐up from each study for comparison with baseline.
We conducted meta‐analysis of cross‐over trials by the generic invariance method, using mean differences and standard errors between outcome measurements (blood pressure) of experimental (cocoa) versus control groups. We extracted the mean (SE) blood pressure before and after intervention from tables, graphs, and text from individual studies included in the meta‐analysis.
In multiple‐arm studies, we included only the intervention arms and their comparable control arms in the meta‐analysis. Comparable intervention/control groups in multiple‐arm studies may have been stratified by age, body mass index (BMI), or blood markers. We avoided double‐counting of individual participants in the meta‐analysis.
Dealing with missing data
We contacted the authors of studies with missing information on mean SBP/DBP or SD or both in intervention and control groups and asked them to provide the missing data.
If standard errors were given instead of standard deviations, we calculated standard deviations at one time point with the formula SD = SE x square root of n. We assumed a correlation of 0.68 between the final follow‐up SBP/DBP results for the two treatment arms in a cross‐over trial, similar to previous meta‐analyses by Taubert 2007a and Desch 2010a.
If both standard deviations and standard errors were missing, we imputed standard deviations based on the information in the same trial or from other trials using the same intervention. We used the following hierarchy to impute standard deviation values:
-
standard deviation of blood pressure at end of treatment taken in a different position from that of the blood pressure data used
-
standard deviation of blood pressure at baseline
-
mean standard deviation of blood pressure at end of treatment from other trials using the same intervention
Assessment of heterogeneity
We assessed heterogeneity by the I2 statistic (Higgins 2003). We tested the following variables by subgroup analyses: baseline SBP or DBP, dosage of flavanols in the control group, age, study duration, and blinding.
Assessment of reporting biases
We assessed small‐study effects by funnel plots.
Data synthesis
For each study, we recorded the number of participants, mean difference, and the SE of intervention and control groups in Cochrane Review Manager 5 software. We used the generic inverse variance method to combine both parallel‐group and cross‐over trials, and the random‐effects model to incorporate heterogeneity.
Subgroup analysis and investigation of heterogeneity
We required at least four studies to conduct subgroup analysis.
We performed the following subgroup analyses:
-
Baseline SBP ≥ 140 mmHg versus SBP 130 ‐ 140 versus SBP < 130 mmHg
-
Baseline DBP ≥ 80 mmHg versus DBP < 80 mmHg
-
Flavanol‐free control versus low flavanol control
-
Double‐blind versus single‐blind/unblinded trials
-
Mean age < 50 years versus ≥ 50 years
-
Trial duration two to four weeks versus more than four weeks
We considered evidence of the differences found between subgroups to be stronger when the variation of the mean effects in the different subgroups was higher, as measured by the I2statistic for subgroup differences (e.g. I2 = 90% was considered more significant than I2 = 70%).
Sensitivity analysis
We tested the robustness of the results using the following sensitivity analyses:
Exclusion of trials using a unique study design compared to other trials (e.g. high flavanol content in the control group (20% ‐ 25%) compared to active group, close to threshold level for excluded trials (> 25% flavanol content in control group).
'Summary of findings' table
The summary of findings Table for the main comparison summarises the magnitude of the effect of cocoa on systolic and diastolic blood pressure of the 35 RCTs including 40 treatment comparisons and 1804 adults, and rates the quality of the evidence using the GRADE system, by assessing potential within‐study biases and between‐study heterogeneity (Guyatt 2008).
Results
Description of studies
Results of the search
The updated Cochrane search strategy (inception to October 2015) using Scopus, PubMed and Embase, identified 254 potentially relevant publications which we assessed at the title/abstract level,in addition to the 136 articles in the previous review. Of 26 new potentially relevant trials (in 27 articles) assessed at the full‐text level, 17 new trials (20 new treatment comparisons, active vs control) met the inclusion criteria for meta‐analysis. Adding these to the 20 treatment comparisons in 18 trials from the previous version of this review (Ried 2012) gives a total of 40 treatment comparisons (from 35 trials) in the updated meta‐analysis. (Figure 1).

PRISMA Flow diagram
Included studies
We include 35 trials involving 1804 participants in this updated review.
Of the 35 trials, five contained two treatment arms with comparable non‐overlapping control groups, resulting in 40 bringing the number of treatment comparisons in the updated review. Trials with multiple treatment arms provided results stratified on the basis of blood pressure (normotensive/hypertensive) (Grassi 2005a), exercise (treatment only or in addition to exercise) (Davison 2008a), BMI (< 25, > 25 kg/m2) (Almoosawi 2012a), cholesterol (high, normal) (Sarria 2014), or age (young, elderly) (Heiss 2015a).
Eleven trials used commercially available chocolate and 24 trials used flavanol‐rich cocoa powder (tablet, bar, or powder mixed with water or milk) and compared the effect to a control group, which either took flavanol‐free placebo (white chocolate, milk or placebo pill) or low‐flavanol powder. The active intervention group received either dark chocolate of 3.6 to 105 grams (6 grams are equal to one piece of a 100‐gram dark chocolate bar) containing 50% to 90% cocoa, milk chocolate‐based confectionary (105 grams of < 10% cocoa) or flavanol‐enriched cocoa powder, containing a dosage of 30 to 1218 mg (mean = 670 mg) of flavanols per day. Trials ran between two weeks and 12 weeks, with a single trial ran 18 weeks.
Excluded studies
We excluded 24 trials from our meta‐analysis, because:
-
Trials investigated the acute effects within two hours after cocoa ingestion (n = 2)
-
The intervention period was less than two weeks (n = 7)
-
Trials did not have a true control group (n = 6)
-
The intervention was cocoa plus another active ingredient (n = 3)
-
Data required for meta‐analysis were not available (n = 5)
-
The trial was of low quality (n = 1)
See Figure 1; Characteristics of excluded studies table.
Ongoing studies
Eleven unpublished trials were identified in trial registries, they were either not completed at time of meta‐analysis or data were not yet available (Characteristics of ongoing studies).
Studies awaiting classification
Eight recent additional studies were found just before finalizing the updated review for publication (Characteristics of studies awaiting classification). These could potentially meet the inclusion criteria but in order to establish that it would require careful assessment. We chose not to include these studies in this update to avoid further delays in publication, but this will be done in a future update.
Risk of bias in included studies
'Risk of bias' assessments are summarised in Figure 2.
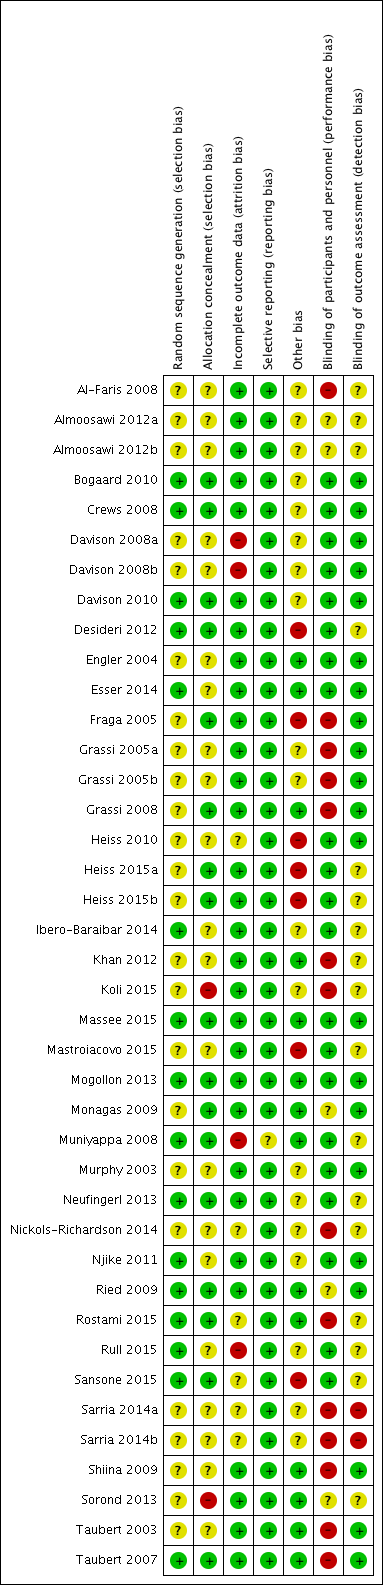
Risk of bias summary: review authors' judgements about each risk of bias item for each included study.
Allocation
Random sequence generation
Sixteen trials adequately described random sequence generation (Bogaard 2010; Crews 2008; Davison 2010; Desideri 2012; Esser 2014; Ibero‐Baraibar 2014; Massee 2015; Mogollon 2013; Muniyappa 2008; Neufingerl 2013; Njike 2011; Ried 2009; Rostami 2015; Rull 2015; Sansone 2015; Taubert 2007).
Random sequence generation was unclear in 19 trials (Al‐Faris 2008; Almoosawi 2012a (two treatment comparisons); Davison 2008a (two treatment comparisons); Engler 2004; Fraga 2005; Grassi 2005a (two treatment comparisons); Grassi 2008; Heiss 2010; Heiss 2015a (two treatment comparisons); Khan 2012; Koli 2015; Mastroiacovo 2015; Monagas 2009; Murphy 2003; Nickols‐Richardson 2014; Sarria 2014 (two treatment comparisons); Shiina 2009; Sorond 2013; Taubert 2003).
Allocation concealment
Eighteen trials described adequate allocation concealment (Bogaard 2010; Crews 2008; Davison 2010; Desideri 2012; Esser 2014; Fraga 2005; Grassi 2008; Heiss 2015a (two treatment comparisons); Massee 2015; Mogollon 2013; Monagas 2009; Muniyappa 2008; Neufingerl 2013; Ried 2009; Rostami 2015; Sansone 2015; Taubert 2007).
Seventeen trials provided insufficient information regarding allocation concealment (Al‐Faris 2008; Almoosawi 2012a; Davison 2008a (two treatment comparisons); Engler 2004; Grassi 2005a (two treatment comparisons); Heiss 2010; Ibero‐Baraibar 2014; Khan 2012; Mastroiacovo 2015; Murphy 2003; Nickols‐Richardson 2014; Njike 2011; Rull 2015; Sarria 2014 (two treatment comparisons); Shiina 2009; Sorond 2013; Taubert 2003).
Allocation was unconcealed in one trial (Koli 2015).
Blinding
Performance bias
Unblinded/ single‐blinded trials
Thirteen trials compared the cocoa group with unblinded controls using commercially available white chocolate, or only milk or water (Al‐Faris 2008; Fraga 2005; Grassi 2005a (two treatment comparisons); Grassi 2008; Khan 2012; Koli 2015; Monagas 2009; Nickols‐Richardson 2014; Rostami 2015; Sarria 2014 (two treatment comparisons); Shiina 2009; Taubert 2003; Taubert 2007).
One trial (Almoosawi 2012a; two treatment comparisons) reported a single‐blind design, with participants but not investigators probably blinded, as the placebo dark chocolate was matched in taste, texture, colour and macronutrient composition.
Double‐blinded trials
Thirteen trials used a low‐flavanol cocoa product as the control aiming to facilitate ‘blinding’ or ‘masking’ of participants to minimise any expectation bias or placebo effect (Crews 2008; Davison 2008a (two treatment comparisons); Davison 2010; Desideri 2012; Esser 2014; Heiss 2010; Mastroiacovo 2015; Mogollon 2013; Muniyappa 2008; Murphy 2003; Njike 2011; Rull 2015; Sorond 2013).
Eight trials used a blinded design with flavanol‐free control groups (Bogaard 2010; Engler 2004; Heiss 2015a (two treatment comparisons); Ibero‐Baraibar 2014; Massee 2015; Neufingerl 2013; Ried 2009; Sansone 2015).
Blinding was achieved in seven of the eight trials by matching taste, colour, texture, energy and nutrient components of the cocoa and placebo products. In addition, one trial (Ried 2009) compared the effect on blood pressure of dark chocolate or tomato extract capsules with placebo capsules. In this trial, blinding of the control group but not the dark chocolate group was assured, as participants in the control group did not know if they were allocated into an active or placebo capsule group.
Detection bias
One trial (Almoosawi 2012a; two treatment comparisons) reported adequate outcome assessment (n = 21), or did not report details but used standard blood pressure monitoring procedures (n = 16).
Incomplete outcome data
All but three trials (Davison 2008a (two treatment comparisons); Muniyappa 2008; Rull 2015) had less than 20% attrition.
Selective reporting
None of the trials was biased due to selective reporting. However, industry‐funding may have introduced a bias.
Other potential sources of bias
We found a small risk of publication bias, with slightly asymmetrical funnel plots, probably due to high heterogeneity of the 35 trials included in the meta‐analysis.
Involvement of industry‐sponsored studies may have influenced results. We therefore conducted a sensitivity analysis excluding trials (n = 6 trials) in which authors were employed by industry (Desideri 2012; Fraga 2005; Heiss 2010; Heiss 2015a (two comparisons); Mastroiacovo 2015; Sansone 2015) (see Analysis 7.1 and Analysis 7.2).
Effects of interventions
See: Summary of findings for the main comparison Flavanol‐rich cocoa products for blood pressure
Meta‐analysis of all 40 treatment comparisons revealed a significant blood pressure‐reducing effect of flavanol‐rich cocoa products compared with control.
Mean difference systolic blood pressure (SBP) (95% confidence interval (CI)): ‐1.76 (‐3.09 to ‐0.43) mmHg, P = 0.009, 40 comparisons, 1804 participants;
Mean difference diastolic blood pressure (DBP) (95% CI): ‐ 1.76 (‐2.57 to ‐0.94) mmHg, P < 0.001, 39 comparisons, 1772 participants.
Analysis 1.1, (Figure 3); Analysis 1.2, (Figure 4)

Forest plot of comparison: 1 Effect of cocoa on BP, outcome: 1.1 SBP.

Forest plot of comparison: 1 Effect of cocoa on BP, outcome: 1.2 DBP.
Baseline blood pressure ‐ hypertensive, prehypertensive, normotensive
The previous versions of our review had revealed a difference in effect of cocoa products on blood pressure, depending on hypertension status at baseline. While blood pressure was significantly lowered in people with systolic hypertension (≥ 140 mmHg) or diastolic prehypertension (≥ 80 mmHg), there was no significant effect of cocoa on people with normal blood pressure (120/80 mmHg) (Ried 2010; Ried 2012).
Systolic blood pressure
The updated meta‐analysis (Analysis 2.1; Figure 5) shows a significant systolic blood pressure‐reducing effect in the hypertensive subgroup, a trend towards blood pressure reduction in the prehypertensive subgroup, and a small non‐significant effect in the normotensive subgroup:

Forest plot of comparison: 2 Hypertensive or normotensive subjects, outcome: 2.1 SBP.
Hypertensive subgroup (baseline SBP > 140 mmHg): mean SBP difference (95% CI): ‐4.00 (‐6.71 to ‐1.30) mmHg, P = 0.004, 9 comparisons, 401 participants;
Prehypertensive subgroup (baseline SBP > 130 mmHg): mean SBP difference (95% CI): ‐2.43 (‐5.02 to 0.17) mmHg, P = 0.07, 8 comparisons, 340 participants;
Normotensive subgroup (baseline SBP < 130 mm Hg): mean SBP difference (95% CI): ‐0.65 (‐2.13 to 0.84) mmHg, P = 0.39, 23 comparisons, 1063 participants.
The 'Test for subgroup differences' (hypertensive/prehypertensive/normotensive) provided a trend between the subgroups with borderline significance: SBP: I2 = 60%, P = 0.08.
Notably, effect sizes in the hypertensive and prehypertensive subgroups were larger than the effect size of the main meta‐analysis including 40 trial comparisons (mean SBP differences (SE): ‐1.76 (1.3) mmHg).
Diastolic blood pressure
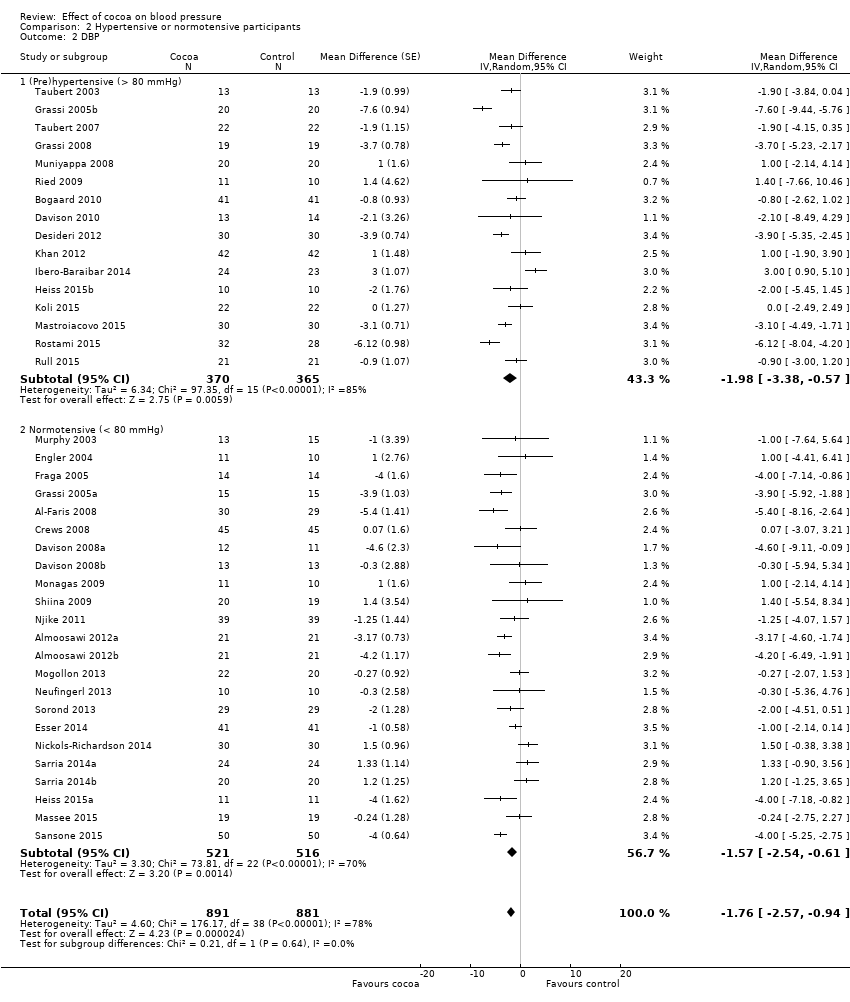
None of the trials in this meta‐analysis involved participants with hypertensive diastolic blood pressure (DBP > 90 mm Hg), so we undertook subgroup analysis by prehypertensive (mean DBP > 80 mm Hg) versus normotensive participants (mean DBP < 80 mmHg) (Analysis 2.2; Figure 6).

Forest plot of comparison: 2 Hypertensive or normotensive subjects, outcome: 2.2 DBP.
While a significant effect of cocoa on DBP was evident in both subgroups, there was no difference between the subgroups (I2 = 0%, P = 0.64).
Prehypertensive subgroup (baseline DBP > 80 mmHg): mean DBP difference (95% CI): ‐1.98 (‐3.38 to ‐0.57) mmHg, P = 0.006, 16 comparisons, 735 participants;
Normotensive subgroup (baseline DBP < 80 mmHg): mean DBP difference (95% CI): ‐1.57 (‐2.54 to ‐0.61) mmHg, P = 0.001, 23 comparisons, 1037 participants.
Dosage of flavanols and type of control group
Dosage of flavanol content was determined by two common standardised methods (Adamson 1999; Singleton 1965). We are reasonably confident that flavanol dosages are comparable.
Trials provided participants in the active group with 30 to 1218 mg of flavanols (mean = 670 mg) in 3.6 to 105 grams of cocoa products per day. The control group received either a flavanol‐free product (n = 26 treatment comparisons) or a low‐flavanol cocoa powder (n = 14 treatment comparisons). Flavanol dosage of low‐flavanol products in the control group ranged between 6.4 and 88 mg (mean = 45 mg), with one trial (Esser 2014) providing 259 mg flavanols in the control group per day.
Meta‐analysis 3.1.1 and 3.2.1 of trials with true (flavanol‐free) control groups revealed a significant blood pressure‐reducing effect:
Mean difference SBP (95% CI): ‐1.80 (‐3.46 to ‐0.13) mmHg, P = 0.03, 26 comparisons, 1116 participants;
Mean difference DBP (95% CI): ‐1.82 (‐2.95 to ‐0.68) mmHg, P = 0.002, 26 comparisons, 1116 participants.
Subgroup 3.1.2 and 3.2.2 analysis of trials with low‐flavanol control groups provided similar effect sizes:
Mean difference SBP (95% CI): ‐1.67 (‐4.03 to 0.69) mmHg, P = 0.17, 14 comparisons, 688 participants;
Mean difference DBP (95% CI): ‐1.62 (‐2.56 to ‐0.68) mmHg, P < 0.001, 13 comparisons, 656 participants.
Similarity of subgroup findings was confirmed with the 'Test for subgroup differences' (flavanol‐free trials compared with low flavanol trials):
I2 = 0%, P = 0.9 (no heterogeneity, no difference).
Sensitivity analysis of subgroup 2 (low‐flavanol control group) excluding the trial with very high flavanol content in the control group (Esser 2014), 1078 mg (active) versus 259 mg (24% of flavanol in the active group), did not change results appreciably.
Mean difference SBP (95% CI): ‐1.73 (‐4.35 to 0.90) mmHg, P = 0.20, 13 comparisons, 606 participants;
Mean difference DBP (95% CI): ‐1.71 (‐2.77 to ‐0.65) mmHg, P = 0.002, 12 comparisons, 1690 participants.
Participants in nine of the 14 trials using low‐flavanol control groups received higher or similar dosages of flavanols (33 ‐ 259 mg flavanols) (Crews 2008; Davison 2008a; Davison 2010; Desideri 2012; Esser 2014; Mastroiacovo 2015; Mogollon 2013; Rull 2015) than the active intervention group in the trial by Taubert 2007 (30 mg flavanols; 0 mg flavanol control).
Blinding
We investigated whether blinding of participants and investigators may have played a role in the overall effect.
Subgroup analysis 4.1.1 and 4.2.1 of double‐blind trials provided a small effect size:
Mean difference SBP (95% CI): ‐0.95 (‐2.77 to 0.86) mm Hg, P = 0.30, 23 comparisons, 1059 participants;
Mean difference DBP (95% CI): ‐1.16 (‐2.05 to ‐0.27) mm Hg, P = 0.01, 21 comparisons, 927 participants.
In contrast, subgroup analysis 4.1.2 and 4.2.2 of unblinded and single‐blinded trials revealed a greater effect size:
Mean difference SBP (95% CI): ‐2.71 (‐4.66 to ‐0.76) mmHg, P < 0.001, 17 comparisons, 745 participants;
Mean difference DBP (95% CI): ‐2.33 (‐3.62 to ‐1.04) mmHg, P < 0.001, 18 comparisons, 845 participants.
Nine out of the 23 comparisons (39%) in the double‐blind subgroup had flavanol‐free (0 mg) control groups, so differences between the blinding subgroups cannot be explained only by the type of control group. Instead, small changes in blood pressure can easily be influenced by participant expectation, as well as outcome measurement by unblinded investigators.
However, the 'Test for subgroup differences' (double‐blinded versus unblinded/single‐blinded) did not provide sufficient evidence for a genuine difference between the subgroups of SBP: I2 = 40.4%, P = 0.20.
Age
Subgroup differences by age were not statistically significant (I2 = 0%, P = 0.6).
Subgroup analysis 5.1.1 and 5.2.1 of trials with younger participants (< 50 years):
Mean difference SBP (95% CI): ‐1.79 (‐4.05 to 0.48) mmHg, P = 0.12, 18 comparisons, 726 participants;
Mean difference DBP (95% CI): ‐2.01 (‐3.45 to ‐0.58) mmHg, P 0.006, 18 comparisons, 726 participants.
Subgroup analysis 5.2.1 and 5.2.2 of trials with older participants (≥ 50 years):
Mean difference SBP (95% CI): ‐0.98 (‐2.87 to 0.90) mmHg, P = 0.30, 20 comparisons, 1036 participants;
Mean difference DBP (95% CI): ‐1.28 (‐2.32 to ‐0.24) mmHg, P = 0.02, 19 comparisons, 962 participants.
One trial (Almoosawi 2012a; 2 treatment comparisons) did not provide participants' age details and was therefore excluded from this subgroup analysis.
Duration
24 treatment comparisons were of two to four weeks duration, while 16 treatment comparisons were of six to 18 weeks duration (mean = 9 weeks).
We found no statistically significant difference between the subgroups by duration (I2 = 0%, P = 0.5).
Subgroup analysis 6.1.1 and 6.2.1 of trials of two to four weeks duration:
Mean SBP difference (95% CI): ‐1.37 (‐3.23 to 0.49) mmHg, P = 0.15, 24 comparisons, 1043 participants;
Mean DBP difference (95% CI): ‐1.55 (‐2.71 to ‐0.39) mmHg, P = 0.009, 23 comparisons, 1011 participants.
Subgroup analysis 6.1.2 and 6.2.2 of trials of 6 to 18 weeks duration:
Mean SBP difference (95% CI): ‐2.37 (‐4.30 to ‐0.44) mmHg, P = 0.02, 16 comparisons, 761 participants;
Mean DBP difference (95% CI): ‐2.04 (‐3.18 to ‐0.91) mmHg, P < 0.001, 16 comparisons, 761 participants.
Analysis 6.1; Analysis 6.2
Sensitivity analyses of all trials excluding those in which authors were employed by industry (n = 6) revealed a marked difference in results, reducing effect sizes and statistical significance, in particular for systolic blood pressure.
Mean difference SBP (95% CI): ‐1.08 (‐2.60 to 0.43) mmHg, P = 0.16, 33 comparisons, 1482 participants;
Mean difference DBP (95% CI): ‐1.37 (‐2.31 to ‐0.43) mmHg, P = 0.004, 33 comparisons, 1482 participants.
Summary of secondary outcomes
We did not meta‐analyse withdrawals and adverse effects across trials, but we summarise them in Table 1.
| Study | Study design
| Participants Cocoa/ Control | Withdrawn Cocoa/Control | Reasons for withdrawal including adverse effects Cocoa/Control |
| Taubert 2003 | C | 13/13 | 0/0 | ‐ |
| Murphy 2003 | P | 13/15 | 3 in total | Family illness (2) Non‐compliance in final week (1) |
| Engler 2004 | P | 11/10 | 0/0 | ‐ |
| Fraga 2005 | C | 14/14 | 1/0 | No reason given |
| Grassi 2005a | C | 15/15 | 0/0 | ‐ |
| Grassi 2005b | C | 20/20 | 0/0 | ‐ |
| Taubert 2007 | P | 22/22 | 0/0 | ‐ |
| Crews 2008 | P | 45/45 | 6/5 | Gastrointestinal upset/headache/cold sweat (2/1) Bronchitis (1/0) Jitteriness/increased energy (1/0) Atrial arrhythmia/medication change (1/0) Dislike of study product (1/1) Family illness (0/1) Unspecified reason (0/1) No adherence to trial regimen (0/1) |
| Grassi 2008 | C | 19/19 | 0/0 | ‐ |
| Muniyappa 2008 | C | 20/20 | 5/4 | Lost to follow‐up (0/1) Discontinued intervention (4/2) due to Intolerance to treatment, family emergencies, personal problems excluded from analysis (1/1) |
| Davison 2008a | P | 12/11 | 7 in total | Time restrictions, personal circumstances (14) Non‐compliance (exercise or diet) (2)
|
| Davison 2008b | P | 13/13 | 5 in total | |
| Al‐Faris 2008 | P | 30/29 | 0/0 | ‐ |
| Shiina 2009 | P | 20/19 | 0/0 | ‐ |
| Ried 2009 | P | 11/10 | 2/2 | Study product unpalatable (2/0) Gastrointestinal upset (0/1) Illness unrelated to study (0/1) |
| Monagas 2009 | C | 42/42 | 0/0 | Constipation (resolved with fibre intake) |
| Bogaard 2010 | C | 41/41 | 3 in total | Nausea (1) Headache (1) Arrythmia unrelated (1)
|
| Heiss 2010 | C | 16/16 | 3 in total | Did not come to first visit |
| Davison 2010 | P | 13/14 | 7 in total | Mild gastric symptoms (1) Non‐compliance with study protocol (1) Withdrew due to personal circumstances (5) |
| Njike 2011 | C | 38/38 | 7 in total | Non‐compliance with study protocol (1) Withdrew for personal reasons (6)
|
| Almoosawi 2012a | C | 21/21 | 1/1 | Personal reasons unrelated to study |
| Desideri 2012 | P | 30/30 | 0/1 | Gastric discomfort (1) |
| Khan 2012 | C | 42/42 | 1/0 | Constipation |
| Mogollon 2013 | P | 22/20 | 1/1 | Unrelated to study (1)/headache (1) |
| Neufingerl 2013 | P | 10/10 | 1/1 | Nausea (1)/unrelated (1) |
| Sorond 2013 | P | 29/29 | 1/1 | No details provided |
| Esser 2014 | C | 41/41 | 3 in total | Medical reasons (1), disliked chocolate (1), poor compliance (1) |
| Ibero‐Baraibar 2014 | P | 24/23 | 2/1 | Personal reason (2), poor compliance (1) |
| Nickols‐Richardson 2014 | P | 30/30 | 0/0 | None |
| Sarria 2014 (a) | C | 24/24 20/20 | ? | No information given |
| Heiss 2015 (a) | P | 11/11 10/10 | 0/0 | None |
| Massee 2015 | P | 19/19 | 1/1 | Personal reasons (1) |
| Rostami 2015 | P | 32/28 | 2/6 | No information given |
| Koli 2015 | C | 22/22 | 0/0 | No side effects reported |
| Mastroiacovo 2015 | P | 30/30 | 1/0 | Personal reasons (1) No side effects reported |
| Rull 2015 | C | 21/21 | 11 | No details provided |
| Sansone 2015 | P | 50/50 | ? | No information given |
C:Cross‐over
P: Parallel
Four trials did not provide any information on reasons for withdrawals or adverse effects (Rostami 2015; Rull 2015; Sansone 2015; Sarria 2014).
Out of 31 comparisons (1514 participants, cocoa groups: n = 760; control groups: n = 754) which provided information on withdrawals and adverse effects, eight trials reported no withdrawals and no adverse effects (Engler 2004; Grassi 2005a; Grassi 2008; Heiss 2015a; Koli 2015; Nickols‐Richardson 2014; Taubert 2003; Taubert 2007).
In the remaining 23 comparisons, reasons for withdrawal included personal and trial‐unrelated reasons or adverse effects.
Withdrawals due to adverse effects were reported in nine trials (Bogaard 2010; Crews 2008; Davison 2010; Desideri 2012; Esser 2014; Khan 2012; Mogollon 2013; Neufingerl 2013; Ried 2009), including gastrointestinal complaints (cocoa groups: n = 8/760 (1%), control groups: n = 3/754 (0.4%)); dislike of the trial product (cocoa: n = 4/760; control: n = 1/754), headache (cocoa: n = 2/760; control: n = 1/754), and jitteriness (cocoa: n = 1/760, control: n = 0/754).
The product with a high theobromine content in one trial (Bogaard 2010) had a laxative effect (cocoa: n = 12/41, control: n = 2/41), but the affected participants completed the trial. Interestingly, two additional study groups in Neufingerl 2013, not included in this review, tested high theobromine content (850 mg or 1000 mg) and reported a high incidence of nausea, vomiting, headache, and diarrhoea (n = 7/20 participants).
While the potential effect on blood pressure is rather small, cocoa may have other cardiovascular benefits, including improved endothelial function and reduced vascular stiffness (Davison 2008a; Engler 2004; Grassi 2005a; Grassi 2008; Heiss 2010; Heiss 2015a; Mogollon 2013; Sansone 2015; Shiina 2009), as well as improved glucose metabolism and reduced insulin resistance, in particular in overweight or obese individuals (Almoosawi 2012a; Desideri 2012; Grassi 2005a; Grassi 2008; Mastroiacovo 2015; Muniyappa 2008; Nickols‐Richardson 2014). It may reduce triglyceride levels and oxidised LDL‐cholesterol (Almoosawi 2012a; Ibero‐Baraibar 2014; Khan 2012; Rostami 2015; Sarria 2014), decrease platelet aggregation (Murphy 2003; Rull 2015), reduce inflammation (Esser 2014; Monagas 2009), and improve cognitive function (Desideri 2012; Massee 2015; Mastroiacovo 2015; Sorond 2013).
Discussion
Summary of main results
Our updated meta‐analysis of 35 short‐term trials with 40 treatment comparisons involving 1804 mainly healthy individuals suggests flavanol‐rich cocoa products (mean 670 mg flavanols) to have a small but statistically significant effect in reducing blood pressure compared with control by 1.8 mmHg.
Heterogeneity was generally high. We explored reasons for heterogeneity in subgroup and sensitivity analyses.
Whilst subgroup meta‐analyses by baseline blood pressure indicated a larger average effect of cocoa in systolic hypertension compared with systolic prehypertension or normotension, the test for interaction was of borderline significance (Test for subgroups differences: I2 = 60%, P = 0.08). Further studies with hypertensive people are needed to confirm any significant interaction between baseline blood pressure and effect size.
A significant blood pressure‐lowering effect of cocoa was evident in diastolic blood pressure, independent of status at baseline.
We investigated whether blinding may play a role. While meta‐analysis of trials with unblinded/single‐blinded trials revealed a greater systolic blood pressure‐reducing effect, compared to double‐blinded trials, the test for subgroup differences was statistically not significant. In addition, any differences cannot be explained by the type of control alone (flavanol‐free versus low flavanol control ), and may suggest an influence of participant expectations when unblinded to the intervention.
We found the effect of cocoa to be slightly attenuated by age, so that blood pressure reduction tended to be greater in younger individuals (mean age range 18 to 49 yrs; 18 trials) compared with older individuals (mean age range 50 to 73 yrs; 20 trials). While there was no statistically significance difference between subgroups, an age‐related difference in the effect of cocoa on blood pressure is biologically plausible. The age‐related effect might be associated with structural and biochemical changes in the arterial wall associated with aging (O'Rourke 1990) and subsequent vascular reactivity to stimuli. Age‐related changes include arterial stiffening together with decrease of elastin, and increase of collagen and glycosaminoglycans (O'Rourke 1990). In addition, endothelin‐1, a potent vasoconstrictor protein, is elevated in older adults (Donato 2009) and endothelial oxidative stress compromising nitric oxide availability is more pronounced in the elderly (Taddei 2001). Cocoa flavanols have been shown to reduce vascular resistance and arterial stiffness, and are potent scavengers of free radicals (Loke 2008; Schroeter 2006), which may lead to improved vascular function. In the short‐term studies included in our review the effect of cocoa on blood pressure might be more pronounced in younger individuals, due to the age‐related decrease in vascular reactivity to physiological stimuli such as cocoa flavanols.
Trial duration slightly influenced results, with greater effect sizes observed in the longer trials of six to 18 weeks compared to the shorter trials of two to four weeks, albeit not a statistically significant difference.
In this review, we assessed the flavanol content of cocoa products. Cocoa also contains the stimulant theobromine, which has been suggested to affect vasoactivity and thus blood pressure reduction in cocoa products (Kelly 2005). Theobromine is the bitter alkaloid of the cacao plant, and is also found in other plants, such as tea and the cola nut. Other similar compounds, the methylxanthines, include caffeine in coffee. However, analysis of the effect of cocoa on blood pressure by theobromine content was hindered by the lack of reporting of the theobromine content in a number of trials. Instead, ingestion of higher concentrations of theobromine have been associated with a higher rate of adverse effects, in particular nausea, vomiting, dizziness, and diarrhoea, as reported in a number of trials.
It is also questionable whether chocolate and cocoa products are palatable if large amounts of theobromine are included. While some animals, such as dogs, might succumb to theobromine poisoning from as little as 50 grams of chocolate for a smaller dog and 400 grams for an average‐sized dog due to slow metabolism of theobromine (Strachan 1994), it is estimated that a 60 kg human would need to consume about 4.5 kg of dark chocolate containing natural theobromine to be poisoned (Rusconi 2010).
Sensitivity analysis of 33 treatment comparisons, excluding those with at least one of the authors employed by the trial sponsoring industry and with a commercial interest in the test cocoa product, revealed a reduced effect size and reduced statistical significance, alerting to a potential bias in reporting of results, and may explain some of the heterogeneity.
Overall completeness and applicability of evidence
Data were available for the 35 identified trials with 40 treatment comparisons fitting the inclusion criteria. We excluded two trials due to lack of data (Balzer 2008; Farouque 2006). Most trials studied healthy people with or without elevated blood pressure, including one trial of healthy pregnant women (Mogollon 2013). One trial (Heiss 2010) included people with coronary artery disease, three trials assessed individuals with impaired glucose tolerance or diabetes (Grassi 2008; Khan 2012; Rostami 2015), and one trial studied elderly people with mild cognitive impairment (Desideri 2012). Our findings are therefore applicable largely to healthy adults with or without hypertension. Our review included all types of cocoa products.
Our meta‐analysis contributes to the evidence for flavanol‐rich cocoa products being beneficial to cardiovascular health, albeit a modest effect. No long‐term trials investigating the effect of cocoa products on clinical outcomes are available to shed light on the effects of cocoa on cardiovascular events or long‐term adverse effects.
Quality of the evidence
We found a sufficient number of trials (35, with 40 treatment comparisons) and a reasonably large sample size (1804 participants) to generate meaningful meta‐analysis and to allow several subgroup analyses, exploring heterogeneity. Because of the large number of trials, many of high quality, and despite unexplained high heterogeneity, we consider the quality of the evidence to be moderate (summary of findings Table for the main comparison). We explored heterogeneity in several subgroup analyses with a reasonable number of trials.
Potential biases in the review process
A strength of this updated review is the comprehensive literature search including several databases, trial registries and reference lists of included trials.
While we investigated heterogeneity in several subgroup analyses, we could not fully explain the variations in effect of cocoa on blood pressure. Continuing high levels of heterogeneity within subgroup analyses suggest that there may be a combination of factors, or additional ones beyond those we considered. It is possible that subgroups by age and hypertension status at baseline might be subject to ecological bias. The effect we found between studies might not hold within studies. However, analysis of individual patient data was not an approach that we adopted for this review.
Agreements and disagreements with other studies or reviews
While the effect on cocoa on systolic blood pressure is significant, noticeably, the effect sizes became smaller with the increasing number of studies compared to previous meta‐analyses. It is likely that a larger sample size provided a more unbiased result by reducing the influence of individual studies.
-
Ried 2012 (20 treatment comparisons): mean difference SBP (95% CI): ‐2.77 (‐4.72 to ‐0.82) mmHg, P = 0.005, 856 participants
-
Ried 2010 (15 treatment comparisons): mean difference SBP (95% CI): ‐3.16 (‐5.08 to ‐1.23) mmHg, P = 0.001, 578 participants
-
Desch 2010a (10 treatment comparisons): mean difference SBP (95% CI): ‐4.52 (‐5.87 to ‐3.16) mmHg, P < 001, 297 participants
-
Taubert 2007a (5 treatment comparisons): mean difference SBP (95% CI): ‐4.7 (‐7.6 to ‐1.8) mm‐Hg, P = 0.002, 97 participants
Overall reduction in diastolic blood pressure in our updated meta‐analysis is also smaller than reported in earlier versions of this review and previous meta‐analyses:
-
Ried 2012 (19 treatment comparisons): mean difference DBP (95% CI): ‐2.20 (‐3.46 to ‐0.93) mmHg, P = 0.006, 824 participants
-
Ried 2010 (15 treatment comparisons): mean difference DBP (95% CI): ‐2.02 (‐3.35 to 0.69) mmHg, P = 0.003, 578 participants
-
Desch 2010a (10 treatment comparisons): mean difference DBP (95% CI): ‐2.5 (‐3.90 to 1.20) mmHg, P < 0.001, 297 participants
-
Taubert 2007a (5 treatment comparisons): mean difference DBP (95% CI): ‐2.8 (‐4.80 to ‐0.80) mmHg, P = 0.006, 97 participants

PRISMA Flow diagram

Risk of bias summary: review authors' judgements about each risk of bias item for each included study.

Forest plot of comparison: 1 Effect of cocoa on BP, outcome: 1.1 SBP.
Forest plot of comparison: 1 Effect of cocoa on BP, outcome: 1.2 DBP.

Forest plot of comparison: 2 Hypertensive or normotensive subjects, outcome: 2.1 SBP.

Forest plot of comparison: 2 Hypertensive or normotensive subjects, outcome: 2.2 DBP.

Comparison 1 Effect of cocoa on BP, Outcome 1 SBP.
Comparison 1 Effect of cocoa on BP, Outcome 2 DBP.

Comparison 2 Hypertensive or normotensive participants, Outcome 1 SBP.
Comparison 2 Hypertensive or normotensive participants, Outcome 2 DBP.

Comparison 3 Flavanol‐free or low flavanol control, Outcome 1 SBP.
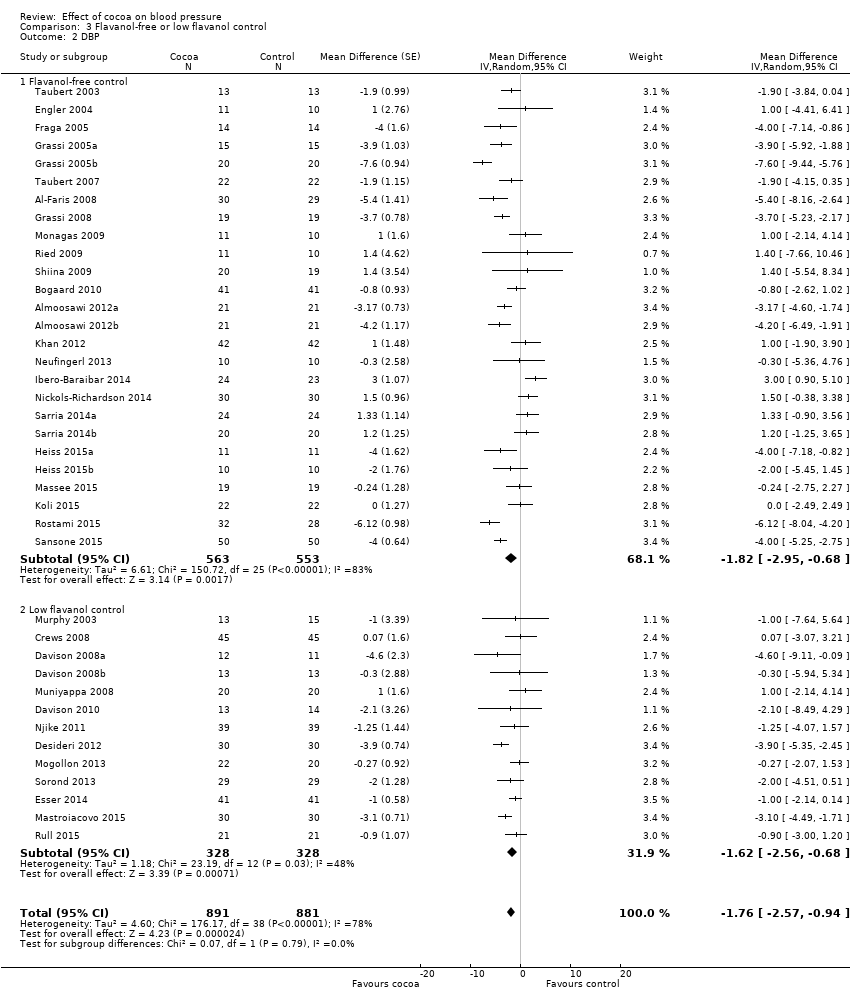
Comparison 3 Flavanol‐free or low flavanol control, Outcome 2 DBP.

Comparison 4 Double‐blinded or unblinded/single‐blinded, Outcome 1 SBP.
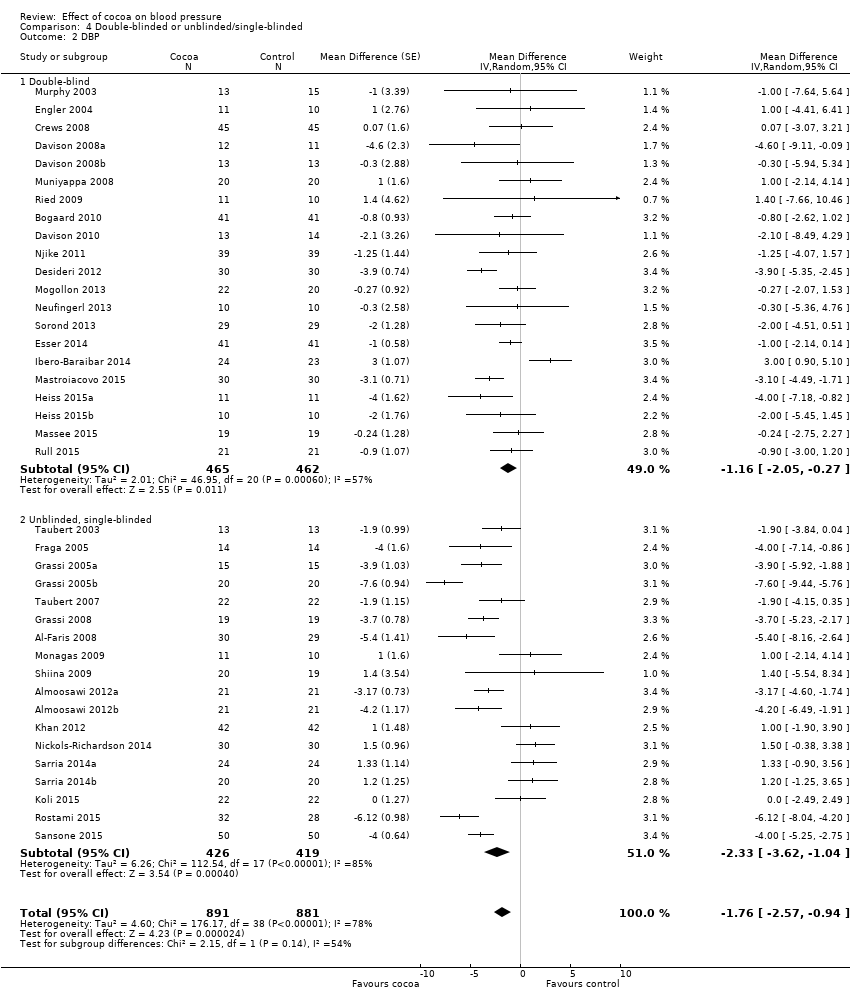
Comparison 4 Double‐blinded or unblinded/single‐blinded, Outcome 2 DBP.

Comparison 5 Participants ≥50 or <50 years old, Outcome 1 SBP.

Comparison 5 Participants ≥50 or <50 years old, Outcome 2 DBP.
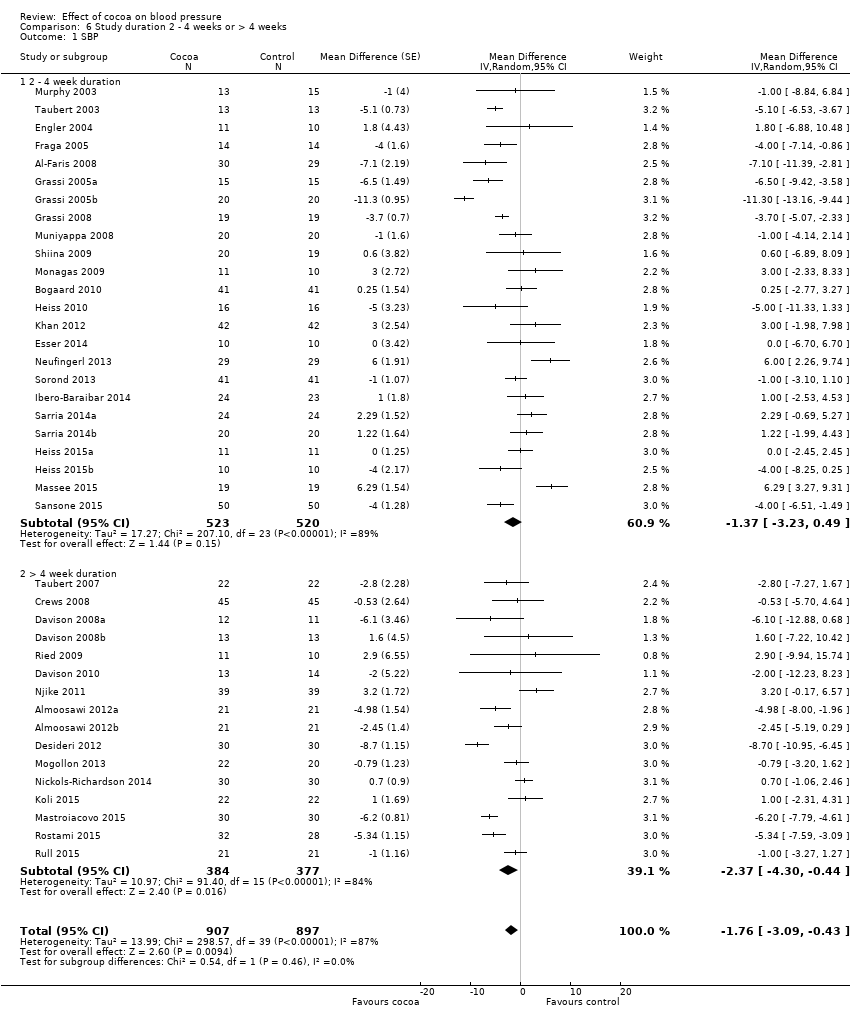
Comparison 6 Study duration 2 ‐ 4 weeks or > 4 weeks, Outcome 1 SBP.
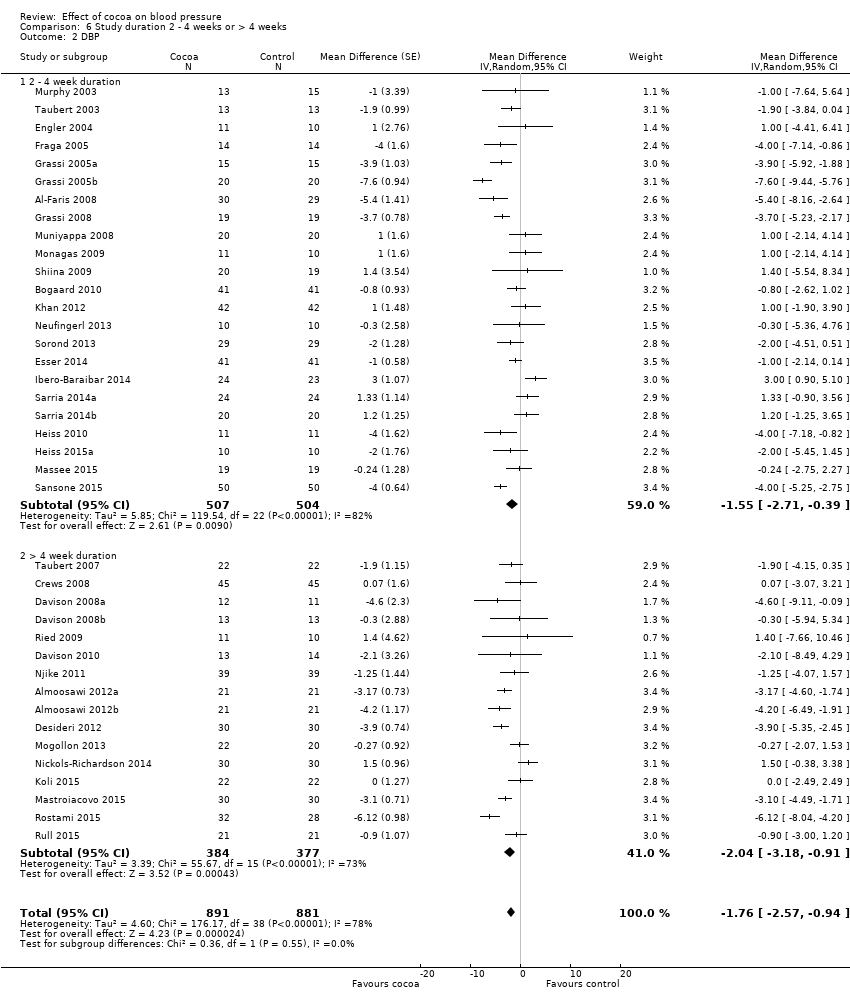
Comparison 6 Study duration 2 ‐ 4 weeks or > 4 weeks, Outcome 2 DBP.
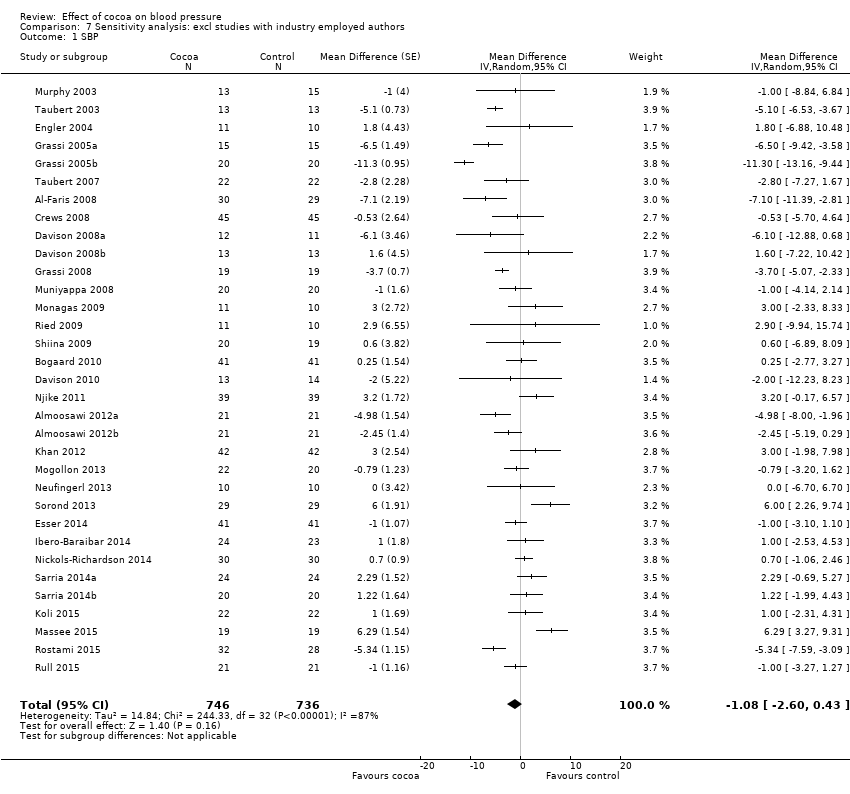
Comparison 7 Sensitivity analysis: excl studies with industry employed authors, Outcome 1 SBP.

Comparison 7 Sensitivity analysis: excl studies with industry employed authors, Outcome 2 DBP.
| Flavanol‐rich cocoa products for blood pressure | ||||||
| Patient or population: adults with or without hypertension | ||||||
| Outcomes | Illustrative comparative risks* (95% CI) | Relative effect | No of Participants | Quality of the evidence | Comments | |
| Assumed risk | Corresponding risk | |||||
| Control | Flavanol‐rich cocoa products | |||||
| Systolic blood pressure | The mean systolic blood pressure ranged across control groups from 107 to 154 mm Hg | The mean systolic blood pressure in the intervention groups was | 1804 | ⊕⊕⊕⊕ | ||
| Diastolic blood pressure | The mean diastolic blood pressure ranged across control groups from 66 to 92 mm Hg | The mean diastolic blood pressure in the intervention groups was | 1772 | ⊕⊕⊕⊕ | ||
| Withdrawals due to adverse effects | 8 trials reported no withdrawals and no adverse effects. 9 trials reported adverse effects, including gastrointestinal complaints (cocoa groups: n = 8/760 (1%), control groups: n = 3/754 (0.4%)); dislike of the trial product (cocoa: n = 4/760; control: n = 1/754), headache (cocoa: n = 2/760; control: n = 1/754), and jitteriness (cocoa: n = 1/760, control: n = 0/754). | 1514 (31 trials) reported on withdrawals and adverse effects | ⊕⊕⊕⊕ | |||
| *The basis for the assumed risk (e.g. the median control group risk across studies) is provided in footnotes. The corresponding risk (and its 95% confidence interval) is based on the assumed risk in the comparison group and the relative effect of the intervention (and its 95% CI). | ||||||
| GRADE Working Group grades of evidence | ||||||
| 1.Downgraded to moderate quality due to high heterogeneity which cannot be explained by subgroup analyses. SBP/DBP: I2 = 87%/78%. 2.Good quality across 40 treatment comparisons. Only 5 trials (12.5%) had 2 items at high risk of bias, 19 trials (47.5%) had 1 item at high risk of bias, and 16 trials (40%) had no items at high risk of bias. 17 trials were unblinded or single‐blinded. 7 industry‐sponsored trials had authors employed by industry. Only 4 trials (10%) had more than 20% attrition. We explored influence of trials with items at high risk of bias by subgroup and sensitivity analysis. | ||||||
| Study | Study design
| Participants Cocoa/ Control | Withdrawn Cocoa/Control | Reasons for withdrawal including adverse effects Cocoa/Control |
| Taubert 2003 | C | 13/13 | 0/0 | ‐ |
| Murphy 2003 | P | 13/15 | 3 in total | Family illness (2) Non‐compliance in final week (1) |
| Engler 2004 | P | 11/10 | 0/0 | ‐ |
| Fraga 2005 | C | 14/14 | 1/0 | No reason given |
| Grassi 2005a | C | 15/15 | 0/0 | ‐ |
| Grassi 2005b | C | 20/20 | 0/0 | ‐ |
| Taubert 2007 | P | 22/22 | 0/0 | ‐ |
| Crews 2008 | P | 45/45 | 6/5 | Gastrointestinal upset/headache/cold sweat (2/1) Bronchitis (1/0) Jitteriness/increased energy (1/0) Atrial arrhythmia/medication change (1/0) Dislike of study product (1/1) Family illness (0/1) Unspecified reason (0/1) No adherence to trial regimen (0/1) |
| Grassi 2008 | C | 19/19 | 0/0 | ‐ |
| Muniyappa 2008 | C | 20/20 | 5/4 | Lost to follow‐up (0/1) Discontinued intervention (4/2) due to Intolerance to treatment, family emergencies, personal problems excluded from analysis (1/1) |
| Davison 2008a | P | 12/11 | 7 in total | Time restrictions, personal circumstances (14) Non‐compliance (exercise or diet) (2)
|
| Davison 2008b | P | 13/13 | 5 in total | |
| Al‐Faris 2008 | P | 30/29 | 0/0 | ‐ |
| Shiina 2009 | P | 20/19 | 0/0 | ‐ |
| Ried 2009 | P | 11/10 | 2/2 | Study product unpalatable (2/0) Gastrointestinal upset (0/1) Illness unrelated to study (0/1) |
| Monagas 2009 | C | 42/42 | 0/0 | Constipation (resolved with fibre intake) |
| Bogaard 2010 | C | 41/41 | 3 in total | Nausea (1) Headache (1) Arrythmia unrelated (1)
|
| Heiss 2010 | C | 16/16 | 3 in total | Did not come to first visit |
| Davison 2010 | P | 13/14 | 7 in total | Mild gastric symptoms (1) Non‐compliance with study protocol (1) Withdrew due to personal circumstances (5) |
| Njike 2011 | C | 38/38 | 7 in total | Non‐compliance with study protocol (1) Withdrew for personal reasons (6)
|
| Almoosawi 2012a | C | 21/21 | 1/1 | Personal reasons unrelated to study |
| Desideri 2012 | P | 30/30 | 0/1 | Gastric discomfort (1) |
| Khan 2012 | C | 42/42 | 1/0 | Constipation |
| Mogollon 2013 | P | 22/20 | 1/1 | Unrelated to study (1)/headache (1) |
| Neufingerl 2013 | P | 10/10 | 1/1 | Nausea (1)/unrelated (1) |
| Sorond 2013 | P | 29/29 | 1/1 | No details provided |
| Esser 2014 | C | 41/41 | 3 in total | Medical reasons (1), disliked chocolate (1), poor compliance (1) |
| Ibero‐Baraibar 2014 | P | 24/23 | 2/1 | Personal reason (2), poor compliance (1) |
| Nickols‐Richardson 2014 | P | 30/30 | 0/0 | None |
| Sarria 2014 (a) | C | 24/24 20/20 | ? | No information given |
| Heiss 2015 (a) | P | 11/11 10/10 | 0/0 | None |
| Massee 2015 | P | 19/19 | 1/1 | Personal reasons (1) |
| Rostami 2015 | P | 32/28 | 2/6 | No information given |
| Koli 2015 | C | 22/22 | 0/0 | No side effects reported |
| Mastroiacovo 2015 | P | 30/30 | 1/0 | Personal reasons (1) No side effects reported |
| Rull 2015 | C | 21/21 | 11 | No details provided |
| Sansone 2015 | P | 50/50 | ? | No information given |
| C:Cross‐over | ||||
| Outcome or subgroup title | No. of studies | No. of participants | Statistical method | Effect size |
| 1 SBP Show forest plot | 40 | 1804 | Mean Difference (Random, 95% CI) | ‐1.76 [‐3.09, ‐0.43] |
| 2 DBP Show forest plot | 39 | 1772 | Mean Difference (Random, 95% CI) | ‐1.76 [‐2.57, ‐0.94] |
| Outcome or subgroup title | No. of studies | No. of participants | Statistical method | Effect size |
| 1 SBP Show forest plot | 40 | 1804 | Mean Difference (Random, 95% CI) | ‐1.76 [‐3.09, ‐0.43] |
| 1.1 Hypertensive (> 140 mmHg) | 9 | 401 | Mean Difference (Random, 95% CI) | ‐4.00 [‐6.71, ‐1.30] |
| 1.2 Prehypertensive (> 130 mmHg) | 8 | 340 | Mean Difference (Random, 95% CI) | ‐2.43 [‐5.02, 0.17] |
| 1.3 Normotensive | 23 | 1063 | Mean Difference (Random, 95% CI) | ‐0.65 [‐2.13, 0.84] |
| 2 DBP Show forest plot | 39 | 1772 | Mean Difference (Random, 95% CI) | ‐1.76 [‐2.57, ‐0.94] |
| 2.1 (Pre)hypertensive (> 80 mmHg) | 16 | 735 | Mean Difference (Random, 95% CI) | ‐1.98 [‐3.38, ‐0.57] |
| 2.2 Normotensive (< 80 mmHg) | 23 | 1037 | Mean Difference (Random, 95% CI) | ‐1.57 [‐2.54, ‐0.61] |
| Outcome or subgroup title | No. of studies | No. of participants | Statistical method | Effect size |
| 1 SBP Show forest plot | 40 | 1804 | Mean Difference (Random, 95% CI) | ‐1.76 [‐3.09, ‐0.43] |
| 1.1 Flavanol‐free control | 26 | 1116 | Mean Difference (Random, 95% CI) | ‐1.80 [‐3.46, ‐0.13] |
| 1.2 Low flavanol control | 14 | 688 | Mean Difference (Random, 95% CI) | ‐1.67 [‐4.03, 0.69] |
| 2 DBP Show forest plot | 39 | 1772 | Mean Difference (Random, 95% CI) | ‐1.76 [‐2.57, ‐0.94] |
| 2.1 Flavanol‐free control | 26 | 1116 | Mean Difference (Random, 95% CI) | ‐1.82 [‐2.95, ‐0.68] |
| 2.2 Low flavanol control | 13 | 656 | Mean Difference (Random, 95% CI) | ‐1.62 [‐2.56, ‐0.68] |
| Outcome or subgroup title | No. of studies | No. of participants | Statistical method | Effect size |
| 1 SBP Show forest plot | 40 | 1804 | Mean Difference (Random, 95% CI) | ‐1.76 [‐3.09, ‐0.43] |
| 1.1 Double‐blind | 23 | 1059 | Mean Difference (Random, 95% CI) | ‐0.95 [‐2.77, 0.86] |
| 1.2 Unblinded, single‐blinded | 17 | 745 | Mean Difference (Random, 95% CI) | ‐2.71 [‐4.66, ‐0.76] |
| 2 DBP Show forest plot | 39 | 1772 | Mean Difference (Random, 95% CI) | ‐1.76 [‐2.57, ‐0.94] |
| 2.1 Double‐blind | 21 | 927 | Mean Difference (Random, 95% CI) | ‐1.16 [‐2.05, ‐0.27] |
| 2.2 Unblinded, single‐blinded | 18 | 845 | Mean Difference (Random, 95% CI) | ‐2.33 [‐3.62, ‐1.04] |
| Outcome or subgroup title | No. of studies | No. of participants | Statistical method | Effect size |
| 1 SBP Show forest plot | 38 | 1762 | Mean Difference (Random, 95% CI) | ‐1.36 [‐2.79, 0.06] |
| 1.1 < 50 years | 18 | 726 | Mean Difference (Random, 95% CI) | ‐1.79 [‐4.05, 0.48] |
| 1.2 ≥ 50 years | 20 | 1036 | Mean Difference (Random, 95% CI) | ‐0.98 [‐2.87, 0.90] |
| 2 DBP Show forest plot | 37 | 1688 | Mean Difference (Random, 95% CI) | ‐1.62 [‐2.49, ‐0.76] |
| 2.1 < 50 years | 18 | 726 | Mean Difference (Random, 95% CI) | ‐2.01 [‐3.45, ‐0.58] |
| 2.2 ≥ 50 years | 19 | 962 | Mean Difference (Random, 95% CI) | ‐1.28 [‐2.32, ‐0.24] |
| Outcome or subgroup title | No. of studies | No. of participants | Statistical method | Effect size |
| 1 SBP Show forest plot | 40 | 1804 | Mean Difference (Random, 95% CI) | ‐1.76 [‐3.09, ‐0.43] |
| 1.1 2 ‐ 4 week duration | 24 | 1043 | Mean Difference (Random, 95% CI) | ‐1.37 [‐3.23, 0.49] |
| 1.2 > 4 week duration | 16 | 761 | Mean Difference (Random, 95% CI) | ‐2.37 [‐4.30, ‐0.44] |
| 2 DBP Show forest plot | 39 | 1772 | Mean Difference (Random, 95% CI) | ‐1.76 [‐2.57, ‐0.94] |
| 2.1 2 ‐ 4 week duration | 23 | 1011 | Mean Difference (Random, 95% CI) | ‐1.55 [‐2.71, ‐0.39] |
| 2.2 > 4 week duration | 16 | 761 | Mean Difference (Random, 95% CI) | ‐2.04 [‐3.18, ‐0.91] |
| Outcome or subgroup title | No. of studies | No. of participants | Statistical method | Effect size |
| 1 SBP Show forest plot | 33 | 1482 | Mean Difference (Random, 95% CI) | ‐1.08 [‐2.60, 0.43] |
| 2 DBP Show forest plot | 33 | 1482 | Mean Difference (Random, 95% CI) | ‐1.37 [‐2.31, ‐0.43] |