Wpływ kakao na ciśnienie krwi
Referencias
References to studies included in this review
References to studies excluded from this review
Additional references
References to other published versions of this review
Characteristics of studies
Characteristics of included studies [author‐defined order]
Ir a:
| Methods | C SB | |
| Participants | N=13 Age: 55‐64 Male: 54% Hypertensive | |
| Interventions | 100g dark chocolate / 90g white chocolate; daily. Duration: 2 weeks | |
| Outcomes | Seated SBP and DBP (left upper arm) measured daily. Primary | |
| Notes | ||
| Risk of bias | ||
| Bias | Authors' judgement | Support for judgement |
| Random sequence generation (selection bias) | Unclear risk | Participants were randomly assigned to receive 14 consecutive daily doses of either treatment. Sequence generation not described. |
| Allocation concealment (selection bias) | Unclear risk | Insufficient information provided. |
| Incomplete outcome data (attrition bias) | Low risk | No loss to follow‐up. No missing outcome data reported. |
| Selective reporting (reporting bias) | Low risk | BP data was provided for all time points. |
| Other bias | Low risk | Sponsor not involved in data collection or analysis. |
| Blinding of participants and personnel (performance bias) | High risk | No blinding of participants. |
| Blinding of outcome assessment (detection bias) | Low risk | BP was recorded "in a blinded fashion". |
| Methods | P DB | |
| Participants | N=28 Age: 43.5 Male: 53% Normotensive | |
| Interventions | Cocoa tablets (234 mg flavanols and procyanidins) / placebo tablets (<6 mg cocoa flavanols and procyanidins); daily Duration: 28 days | |
| Outcomes | SBP and DBP measured after 28 days. (No description of position of patient or which arm.) Secondary. | |
| Notes | ||
| Risk of bias | ||
| Bias | Authors' judgement | Support for judgement |
| Random sequence generation (selection bias) | Unclear risk | Subjects were separated into 2 groups that were sex Sequence generation not described. |
| Allocation concealment (selection bias) | Unclear risk | Insufficient information provided |
| Incomplete outcome data (attrition bias) | Low risk | 12.5% (4 of 32) loss of follow‐up: one was found not to meet inclusion criteria, 2 withdrew because of family illnesses, and 1 failed to consume the specified number of tablets during the final week of the intervention. No other missing outcome data reported. |
| Selective reporting (reporting bias) | Low risk | BP reported at beginning and end of intervention. |
| Other bias | High risk | Supported in part by Mars Inc, USA who supplied active tablets (CocoaPro; Mars Inc, Hackettstown, NJ) and placebo tablets. |
| Blinding of participants and personnel (performance bias) | Low risk | Double‐blinded (active and placebo tablets) |
| Blinding of outcome assessment (detection bias) | Low risk | Adequate. |
| Methods | P DB | |
| Participants | N=21 Age: 38 (21‐55) Male: 52% Normotensive | |
| Interventions | 46g dark high flavanoid chocolate / 46g dark low flavanoid chocolate; daily Duration: 2 weeks | |
| Outcomes | Resting supine SBP and DBP after two weeks. Secondary | |
| Notes | ||
| Risk of bias | ||
| Bias | Authors' judgement | Support for judgement |
| Random sequence generation (selection bias) | Unclear risk | Randomized. Sequence generation not described. |
| Allocation concealment (selection bias) | Unclear risk | Insufficient information provided. |
| Incomplete outcome data (attrition bias) | Low risk | No loss to follow‐up. Excellent compliance in all participants was documented by the return of all empty sample wrappers and by plasma epicatechin concentrations at 2 weeks. |
| Selective reporting (reporting bias) | Low risk | BP reported at beginning and end of intervention. |
| Other bias | Low risk | Funded by the University of California, San Francisco. Chocolate sourced from American Cocoa Research Institute, Vienna, VA. Sponsor not involved in data collection or analysis. |
| Blinding of participants and personnel (performance bias) | Low risk | Each chocolate sample was provided in coded foil wrapped containers. Both high‐ and low‐flavonol chocolate bars were similar in physical appearance and taste. |
| Blinding of outcome assessment (detection bias) | Low risk | Adequate. |
| Methods | C SB | |
| Participants | N=28 Age: 18 (18‐21) Male: 100% Normotensive | |
| Interventions | 105g flavanol containing milk chocolate (M&M's) / 105g cocoa butter chocolate; daily Duration: 2 weeks | |
| Outcomes | SBP and DBP measured daily. No description of position of patient or which arm. Primary outcome. | |
| Notes | ||
| Risk of bias | ||
| Bias | Authors' judgement | Support for judgement |
| Random sequence generation (selection bias) | Unclear risk | Randomized. Sequence generation not described. |
| Allocation concealment (selection bias) | Low risk | Two treatments were provided in 105 g‐coded bags (1‐d dose) for 7‐d periods. |
| Incomplete outcome data (attrition bias) | Low risk | 3.6% (1 out of 28) loss to follow‐up. Reason not reported. |
| Selective reporting (reporting bias) | Low risk | BP reported at beginning and end of intervention. |
| Other bias | High risk | 3 authors from Mars. Funding supplied by the University of Buenos Aires and Argentinian government (ANPCYT). |
| Blinding of participants and personnel (performance bias) | High risk | Non blinding of participants. (dark/white chocolate) |
| Blinding of outcome assessment (detection bias) | Low risk | Adequate |
| Methods | C SB | |
| Participants | N=15 Age: 34 (SD=7.6) Male: 47% Normotensive | |
| Interventions | 100 g dark chocolate / 90 g white chocolate; daily Duration: 15 days. | |
| Outcomes | Seated resting SBP and DBP after 15 days. Primary | |
| Notes | The authors declared no conflict of interest. | |
| Risk of bias | ||
| Bias | Authors' judgement | Support for judgement |
| Random sequence generation (selection bias) | Unclear risk | Randomized. |
| Allocation concealment (selection bias) | Unclear risk | No information given. |
| Incomplete outcome data (attrition bias) | Low risk | No loss to follow‐up. |
| Selective reporting (reporting bias) | Low risk | BP at start and end of study reported. |
| Other bias | Unclear risk | Influence of funding body unclear. |
| Blinding of participants and personnel (performance bias) | High risk | No blinding of participants. |
| Blinding of outcome assessment (detection bias) | Low risk | BP was measured always by the same physician who was unaware of the study design, results, and purpose. |
| Methods | C SB | |
| Participants | N=20 Age: 44 (SD=7.8) Male: 50% Hypertensive | |
| Interventions | 100 g dark chocolate / 90 g white chocolate; daily Duration: 15 days. | |
| Outcomes | 24‐hour automated ambulatory SBP and DBP, in addition to seated SBP and DBP; after 15 days. Primary | |
| Notes | ||
| Risk of bias | ||
| Bias | Authors' judgement | Support for judgement |
| Random sequence generation (selection bias) | Unclear risk | Randomized. Sequence generation not described. |
| Allocation concealment (selection bias) | Unclear risk | No information given. |
| Incomplete outcome data (attrition bias) | Low risk | No loss to follow‐up. |
| Selective reporting (reporting bias) | Low risk | BP data reported at start and end of study. |
| Other bias | Unclear risk | Source of funding not stated. |
| Blinding of participants and personnel (performance bias) | High risk | No blinding of participants. |
| Blinding of outcome assessment (detection bias) | Low risk | Adequate |
| Methods | C SB | |
| Participants | N=44 Age: 55‐75 Male: 45% Prehypertensive | |
| Interventions | 6.3g dark chocolate / 5.6 g white chocolate; daily Duration: 18 weeks | |
| Outcomes | Seated resting SBP and DBP (left upper arm) after 6, 12, and 18 weeks. Primary | |
| Notes | ||
| Risk of bias | ||
| Bias | Authors' judgement | Support for judgement |
| Random sequence generation (selection bias) | Low risk | Permuted randomisation in sex‐stratified blocks of 4 persons each, sequentially allocated to dark chocolate and white chocolate using a computer‐generated random number sequence. |
| Allocation concealment (selection bias) | Low risk | To conceal allocation from investigators, instructed trained staff at a separate site not involved with the trial generated and maintained the randomization list and prepared the chocolate. |
| Incomplete outcome data (attrition bias) | Low risk | No loss to follow‐up. |
| Selective reporting (reporting bias) | Low risk | BP data at start, during and end of study. |
| Other bias | Low risk | Funded by the University Hospital of Cologne, Germany. Funding body not involved in study |
| Blinding of participants and personnel (performance bias) | High risk | No blinding of participants (dark/white chocolate) All clinical investigations, dietary assessments, laboratory tests, data collection, and data analysis were performed by physicians and trained staff who were blinded to group assignment. |
| Blinding of outcome assessment (detection bias) | Low risk | Participants received no information about their examination data and the exact objective of the study until trial completion. Participants were instructed that disclosing their group assignment to investigators would result in exclusion from the study. To further minimize the confounding influence of alerting reactions on BP, measurements were performed at a separate location outside the physician’s office and not associated with usual patient care. |
| Methods | P DB | |
| Participants | N=90 Age: 69 (SD=8.3) Male: 42% Normotensive | |
| Interventions | High‐flavanol dark chocolate bars (37.0 g; containing 60% cacao) and cocoa beverage (12 g cocoa) / low‐flavanol placebos matched for appearance, smell, taste, and caloric content; daily. Duration: 6 weeks | |
| Outcomes | Seated resting SBP and DBP (left upper arm) after 3 and 6 weeks. | |
| Notes | The authors declared no conflict of interest. | |
| Risk of bias | ||
| Bias | Authors' judgement | Support for judgement |
| Random sequence generation (selection bias) | Low risk | Computerised randomisation of the products was conducted by an independent researcher. |
| Allocation concealment (selection bias) | Low risk | The boxes and containers containing the products (and their randomization numbers, 1–101) were subsequently issued to participants in an ascending and sequential order as they entered the study (at the time of their pretreatment baseline assessments). |
| Incomplete outcome data (attrition bias) | Low risk | 11% (11 of 101) loss to follow‐up. 10 withdrew, 1 was excluded from analysis due to non‐compliance. |
| Selective reporting (reporting bias) | Low risk | BP reported at start, middle, and end of study. |
| Other bias | High risk | Industry research grant. |
| Blinding of participants and personnel (performance bias) | Low risk | Placebos were matched for appearance (e.g., colour and quantity), smell, taste, and caloric content. |
| Blinding of outcome assessment (detection bias) | Low risk | Adequate |
| Methods | C SB | |
| Participants | N=19 Age: 45 (SD=8) Male: 58% Hypertensive | |
| Interventions | 100 g flavanol‐rich dark chocolate bars / 100 g flavanol‐free white chocolate bars; daily. Duration: 15 days | |
| Outcomes | 24‐hour automated ambulatory SBP and DBP, in addition to seated SBP and DBP; after 15 days. Primary | |
| Notes | The authors declared no conflict of interest. | |
| Risk of bias | ||
| Bias | Authors' judgement | Support for judgement |
| Random sequence generation (selection bias) | Unclear risk | Randomized. Sequence generation not described. |
| Allocation concealment (selection bias) | Low risk | Chocolate doses for each subject were rolled in aluminum foil and administered in dated, sequentially numbered, nontransparent boxes not labeled with regard to content. Involved physicians and staff were unaware of the group assignment. |
| Incomplete outcome data (attrition bias) | Low risk | No loss to follow‐up. |
| Selective reporting (reporting bias) | Low risk | BP reported at beginning and end of intervention. |
| Other bias | Low risk | Supported by the Italian government (Ministero della Universita´e della Ricerca Scientifica) and the US government (USDA Agricultural Research Service). The dark chocolate bars were donated by the manufacturer. |
| Blinding of participants and personnel (performance bias) | High risk | No blinding of participants, only of personnel. Patients did not receive information regarding the chocolate and were instructed not to disclose their assigned group to investigators. |
| Blinding of outcome assessment (detection bias) | Low risk | Adequate |
| Methods | C DB | |
| Participants | N=20 Age: 51 (SEM=1.5) Male: 40% Hypertensive | |
| Interventions | 31 g cocoa drink powder mixed in 150mL warm water (≈450 mg total flavanols twice a day) / 31 g matching placebo drink powder mixed in 150mL warm water (≈14mg total flavanols twice a day); daily. Duration: 2 weeks. | |
| Outcomes | Resting (seated) SBP and DBP (on nondominant arm) measured thrice weekly. Primary | |
| Notes | The authors declared no conflict of interest. | |
| Risk of bias | ||
| Bias | Authors' judgement | Support for judgement |
| Random sequence generation (selection bias) | Low risk | Block randomization by NIH Clinical Center Pharmacy. |
| Allocation concealment (selection bias) | Low risk | Assignment codes were not available to investigators until 20 participants completed the entire study and the database had been completed and secured. |
| Incomplete outcome data (attrition bias) | High risk | 31% (9 out of 29) participants completed the study. |
| Selective reporting (reporting bias) | Unclear risk | BP measured thrice weekly, but only outcomes at baseline and after two weeks treatment reported. |
| Other bias | Low risk | Supported by the US government (Intramural Research Program, NCCAM, NIH, and Office of Dietary Supplements, NIH). Cocoa and placebo preparations provided by manufacturer (Mars Inc.), not involved in research. |
| Blinding of participants and personnel (performance bias) | Low risk | The cocoa and placebo drinks were similar in colour, taste, and packaging and participants were blinded to treatment assignment. Participant blinding was assessed by a questionnaire administered at the end of 6 wk that asked patients to indicate which treatment they believed they received during each of the 2 phases (cocoa, placebo, or uncertain). |
| Blinding of outcome assessment (detection bias) | High risk | In addition to monitoring BP in the outpatient clinic, participants were required to self‐monitor their blood pressure at home using a portable BP device. |
| Methods | P DB | |
| Participants | Intervention: N=12 Age: 45 (SD=4.4) Male: 33% Control: N=11 Age: 44 (SD=4.4) Male: 27% Normotensive | |
| Interventions | HiFl/LoFl drink (902/36 mg Fl); daily. Duration: 12 weeks | |
| Outcomes | Resting supine SBP and DBP at 6 and 12 weeks. Primary | |
| Notes | ||
| Risk of bias | ||
| Bias | Authors' judgement | Support for judgement |
| Random sequence generation (selection bias) | Unclear risk | Volunteers were block‐matched into two groups according to BMI, gender, age and BP. The groups were then randomized to the daily consumption. Sequence generation not described. |
| Allocation concealment (selection bias) | Unclear risk | Insufficient information provided. |
| Incomplete outcome data (attrition bias) | High risk | 21% (14 out of 65) loss to follow‐up. |
| Selective reporting (reporting bias) | Unclear risk | Only combined data of both trial arms reported. |
| Other bias | High risk | Manufacturer (Mars Inc.) provided the cocoa drinks and financial support. |
| Blinding of participants and personnel (performance bias) | Low risk | Double‐blind. Cocoa beverages were matched for taste and appearance. |
| Blinding of outcome assessment (detection bias) | Low risk | Adequate. |
| Methods | P DB | |
| Participants | Intervention: N=13 Age: 45 (SD=3.0) Male: 31% Control: N=13 Age: 46 (SD=4.0) Male: 46% Normotensive | |
| Interventions | HiFl/LoFl drink (902/36 mg Fl); daily; in addition to physical exercise. Duration: 12 weeks | |
| Outcomes | Resting supine SBP and DBP at 6 and 12 weeks Primary | |
| Notes | ||
| Risk of bias | ||
| Bias | Authors' judgement | Support for judgement |
| Random sequence generation (selection bias) | Unclear risk | Volunteers were block‐matched into two groups according to BMI, gender, age and BP. The groups were then randomized to the daily consumption. Sequence generation not described. |
| Allocation concealment (selection bias) | Unclear risk | Insufficient information provided. |
| Incomplete outcome data (attrition bias) | High risk | 21% (14 out of 65) loss to follow‐up. |
| Selective reporting (reporting bias) | Unclear risk | Only combined data of both trial arms reported. |
| Other bias | High risk | Manufacturer (Mars Inc.) provided the cocoa drinks and financial support. |
| Blinding of participants and personnel (performance bias) | Low risk | Double‐blind. Cocoa beverages were matched for taste and appearance. |
| Blinding of outcome assessment (detection bias) | Low risk | Adequate |
| Methods | P SB | |
| Participants | Intervention: N=30 Age: 21 (SD=2.0) Male: 0% Control: N=30 Age: 22 (SD=1.8) Male: 0% Normotensive | |
| Interventions | 100g dark chocolate (50%)/ 90g white chocolate; daily Duration: 15 days | |
| Outcomes | Resting SBP and DBP (position not stated) after 15 days; primary | |
| Notes | ||
| Risk of bias | ||
| Bias | Authors' judgement | Support for judgement |
| Random sequence generation (selection bias) | Unclear risk | Randomized. |
| Allocation concealment (selection bias) | Unclear risk | Insufficient information provided. |
| Incomplete outcome data (attrition bias) | Low risk | No loss to follow‐up. |
| Selective reporting (reporting bias) | Low risk | BP reported at beginning and end of intervention. |
| Other bias | Unclear risk | Funding not reported. |
| Blinding of participants and personnel (performance bias) | High risk | No blinding of participants. |
| Blinding of outcome assessment (detection bias) | Unclear risk | No information provided. |
| Methods | P SB | |
| Participants | Intervention: N=20 Age: 29 (SD=3.4) Male: 100% Control: N=19 Age: 30 (SD=4.5) Male: 100% Normotensive | |
| Interventions | 45g dark chocolate (80%)/ 35g white chocolate; daily Duration: 2 weeks | |
| Outcomes | Resting SBP and DBP (position not stated) after 2 weeks; secondary | |
| Notes | No conflict of interest | |
| Risk of bias | ||
| Bias | Authors' judgement | Support for judgement |
| Random sequence generation (selection bias) | Unclear risk | Randomized. Sequence generation not described. |
| Allocation concealment (selection bias) | Unclear risk | Insufficient information provided. |
| Incomplete outcome data (attrition bias) | Low risk | No loss to follow‐up. |
| Selective reporting (reporting bias) | Low risk | BP reported at beginning and end of intervention. |
| Other bias | Low risk | Sponsor not involved in data collection and analysis. |
| Blinding of participants and personnel (performance bias) | High risk | Participants were not blinded (dark/white chocolate). |
| Blinding of outcome assessment (detection bias) | Low risk | Adequate |
| Methods | P SB | |
| Participants | Intervention: N=11 Age: 49 (SD=12.2) Male: 64% Control: N=10 Age: 58 (SD=13.4) Male: 50% Prehypertensive | |
| Interventions | 50g dark chocolate (70%) / placebo pill; daily Duration: 8 weeks | |
| Outcomes | Resting supine SBP and DBP at 4 and 8 weeks. Primary | |
| Notes | The authors declared no conflict of interest. | |
| Risk of bias | ||
| Bias | Authors' judgement | Support for judgement |
| Random sequence generation (selection bias) | Low risk | Participants were randomly allocated by permuted block randomisation using the SAS 9.1 software package. |
| Allocation concealment (selection bias) | Low risk | To conceal allocation from investigators, trained staff not involved in trial design and analysis handed out intervention packs to participants. |
| Incomplete outcome data (attrition bias) | Low risk | 8% (4 out of 39) loss‐of‐follow up/ withdrawal. |
| Selective reporting (reporting bias) | Low risk | BP data reported comprehensively. |
| Other bias | Low risk | Chocolate provided by manufacturer (Haigh's Chocolates, Adelaide). Manufacturer did not provide funding and were not involved in study design, data collection, analysis or preparation of the manuscript. |
| Blinding of participants and personnel (performance bias) | Unclear risk | Blinding of participants to chocolate was impractical, however blinding of participants in the capsule groups was achieved by identical packaging of active tomato extract and placebo capsules. Control group and personnel blinded. |
| Blinding of outcome assessment (detection bias) | Low risk | Adequate |
| Methods | C SB | |
| Participants | N=25 Age: 70 Male: 45% Prehypertensive | |
| Interventions | 40g cocoa powder in milk / only milk; daily Duration: 4 weeks | |
| Outcomes | Resting SBP and DBP (position not stated) after 4 weeks, secondary | |
| Notes | No conflict of interest | |
| Risk of bias | ||
| Bias | Authors' judgement | Support for judgement |
| Random sequence generation (selection bias) | Unclear risk | Randomized. Sequence generation not described. |
| Allocation concealment (selection bias) | Low risk | Allocation concealment achieved by using closed envelopes with correlative numbers by prespecified subgroups of sex and age. |
| Incomplete outcome data (attrition bias) | Low risk | No loss to follow‐up. |
| Selective reporting (reporting bias) | Low risk | BP reported at beginning and end of intervention. |
| Other bias | Low risk | Supported by grants from the Spanish Ministries of Education and Science and Innovation. Funding body not involved in the study. |
| Blinding of participants and personnel (performance bias) | Unclear risk | No blinding of participants, but blinding of personnel: The clinical investigators and laboratory technicians were blinded to the interventions. |
| Blinding of outcome assessment (detection bias) | Low risk | Adequate |
| Methods | C DB | |
| Participants | 41 Age: 62 (SD=4.5) Male: 76% Hypertensive | |
| Interventions | High flavanol drink / low flavanol drink; daily Duration: 3 weeks | |
| Outcomes | Resting (seated) SBP and DBP (on nondominant arm) after 3 weeks; 24h automated ambulatory SBP and DBP (on nondominant arm) after 3 weeks; primary | |
| Notes | ||
| Risk of bias | ||
| Bias | Authors' judgement | Support for judgement |
| Random sequence generation (selection bias) | Low risk | Test product allocation and order of treatment were determined by a computer‐ generated randomized schedule. |
| Allocation concealment (selection bias) | Low risk | Test products were provided in sequentially numbered sealed bottles. |
| Incomplete outcome data (attrition bias) | Low risk | 4% (2 out of 42) loss to follow‐up. |
| Selective reporting (reporting bias) | Low risk | BP reported at beginning and end of intervention. |
| Other bias | Low risk | Sponsored by manufacturer (Unilever); one co‐author (but none of the investigators) employed by Unilever; The contractual agreement between the Academic Medical Center and Unilever allowed the sponsor to review and comment on the article, but the investigators remained responsible for its contents and decision to submit the results for publication. |
| Blinding of participants and personnel (performance bias) | Low risk | The different test products all had similar taste and appearance. |
| Blinding of outcome assessment (detection bias) | Low risk | All of the hemodynamic measurements were performed by a single investigator, blinded for treatment allocation. |
| Methods | C | |
| Participants | N=16 Age: 64 (SD=3) Male: 19% Prehypertensive | |
| Interventions | High flavanol drink / low flavanol drink; daily Duration: 30 days | |
| Outcomes | Resting supine SBP and DBP after 30 days. Tertiary | |
| Notes | ||
| Risk of bias | ||
| Bias | Authors' judgement | Support for judgement |
| Random sequence generation (selection bias) | Unclear risk | Randomization and cocoa drink dispensations were performed by the Depart‐ ment of Pharmacology. Sequence generation not described. |
| Allocation concealment (selection bias) | Unclear risk | Insufficient information provided. |
| Incomplete outcome data (attrition bias) | Unclear risk | 6% (1 out of 17) loss to follow‐up. |
| Selective reporting (reporting bias) | Low risk | BP reported at beginning and end of intervention. |
| Other bias | High risk | This study was supported by a grant from the American Heart Association, and an unrestricted research grant from Mars, Inc. Two authors received funding from industry and the company provided the cocoa beverage powders for the preparation of the standardized test drinks used in this investigation. |
| Blinding of participants and personnel (performance bias) | Low risk | All drinks were similar in taste. Patients and investigators were masked throughout the study with regard to flavanol content of the test drinks. |
| Blinding of outcome assessment (detection bias) | Low risk | Adequate |
| Methods | P DB | |
| Participants | Group 1 (33mg flavanol): N=14 Age: 53 (SD=6.7) Male: 71%) Group 2 (372mg flavanol): N=12 Age: 56 (SD=14.2) Male: 58% Group 3 (712mg flavanol) N=13 Age: 60 (SD=13.7) Male: 62% Group 4 (1052mg flavanol): N=13 Age: 57 (SD=9.7) Male: 54% Hypertensive | |
| Interventions | Cocoa drink containing 33mg / 372mg flavanol / 712mg flavanol / 1052mg flavanol; daily Duration: 6 weeks | |
| Outcomes | Seated clinic DBP and SBP (non‐dominant arm) after 3 and 6 weeks; 24‐h automated ambulatory SBP and DBP (non‐dominant arm) after 3 and 6 weeks Primary | |
| Notes | The authors declared no conflict of interest. | |
| Risk of bias | ||
| Bias | Authors' judgement | Support for judgement |
| Random sequence generation (selection bias) | Low risk | Randomization of groups was undertaken independently of group minimization procedure by separate staff members of the research centre not otherwise involved with the trial. |
| Allocation concealment (selection bias) | Low risk | Trial investigators remained blinded to treatment allocation until after the completion of data analysis. |
| Incomplete outcome data (attrition bias) | Low risk | 12% (7 of 59) loss of follow‐up: 5 withdrawals, 1 exclusion due to non‐compliance (deliberate weight loss), 1 exclusion due to gastric complaints |
| Selective reporting (reporting bias) | Low risk | BP reported for each assessment point (baseline, week 3, week 6). |
| Other bias | High risk | Trial received funding from industry. |
| Blinding of participants and personnel (performance bias) | Low risk | The reconstituted cocoa beverages were matched with regards appearance and taste. |
| Blinding of outcome assessment (detection bias) | Low risk | Adequate |
| Methods | C DB | |
| Participants | N=38 Age=52.5 (SD=10.4) Male=15% Normotensive | |
| Interventions | High flavanol drink / low flavanol drink; daily Duration: 6 weeks | |
| Outcomes | Resting supine SBP and DBP after 6 weeks; secondary | |
| Notes | ||
| Risk of bias | ||
| Bias | Authors' judgement | Support for judgement |
| Random sequence generation (selection bias) | Low risk | Forty‐four participants were randomly assigned using a computer‐generated random number sequence. |
| Allocation concealment (selection bias) | Unclear risk | Insufficient information provided. |
| Incomplete outcome data (attrition bias) | Low risk | 16% (7 of 44) loss to follow‐up. |
| Selective reporting (reporting bias) | Low risk | BP reported at beginning and end of intervention. |
| Other bias | High risk | Grant funding from manufacturer Hershey. Author received speaker's fee. |
| Blinding of participants and personnel (performance bias) | Low risk | Double‐blinded |
| Blinding of outcome assessment (detection bias) | Low risk | Adequate |
Characteristics of excluded studies [author‐defined order]
Ir a:
| Study | Reason for exclusion |
| same population studied as in another trial included in meta‐analysis (Grassi 2005a) | |
| data for meta‐analysis not available (mean SBP/DBP, SD) | |
| low quality (50% LOF, small sample size) | |
| duration < 2 weeks, acute effects of cocoa, (heart transplant patients) | |
| high cocoa dosage in control group, cocoa+plant sterols vs cocoa; same study as Erdman 2008 | |
| high cocoa dosage in control group, cocoa+plant sterols vs cocoa; same study as Allen 2008 | |
| data for meta‐analysis not available (mean SBP/DBP, SD) | |
| duration < 2 weeks, acute effects of cocoa | |
| high cocoa dosage in control group | |
| duration < 2 weeks, acute effects of cocoa | |
| high cocoa dosage in control group | |
| unpublished, no data available | |
| not completed at time of meta‐analysis | |
| not completed at time of meta‐analysis |
Data and analyses
| Outcome or subgroup title | No. of studies | No. of participants | Statistical method | Effect size |
| 1 SBP Show forest plot | 20 | 856 | Mean Difference (Random, 95% CI) | ‐2.77 [‐4.72, ‐0.82] |
| Analysis 1.1  Comparison 1 Effect of cocoa on BP, Outcome 1 SBP. | ||||
| 2 DBP Show forest plot | 19 | 824 | Mean Difference (Random, 95% CI) | ‐2.20 [‐3.46, ‐0.93] |
| Analysis 1.2  Comparison 1 Effect of cocoa on BP, Outcome 2 DBP. | ||||
| Outcome or subgroup title | No. of studies | No. of participants | Statistical method | Effect size |
| 1 SBP Show forest plot | 20 | 856 | Mean Difference (Random, 95% CI) | ‐2.77 [‐4.72, ‐0.82] |
| Analysis 2.1  Comparison 2 Flavanol free or low flavanol control, Outcome 1 SBP. | ||||
| 1.1 Flavanol free | 12 | 512 | Mean Difference (Random, 95% CI) | ‐3.70 [‐6.02, ‐1.38] |
| 1.2 Low flavanol | 8 | 344 | Mean Difference (Random, 95% CI) | ‐0.71 [‐2.99, 1.57] |
| 2 DBP Show forest plot | 19 | 824 | Mean Difference (Random, 95% CI) | ‐2.20 [‐3.46, ‐0.93] |
| Analysis 2.2  Comparison 2 Flavanol free or low flavanol control, Outcome 2 DBP. | ||||
| 2.1 Flavanol free | 12 | 512 | Mean Difference (Random, 95% CI) | ‐2.71 [‐4.26, ‐1.15] |
| 2.2 Low flavanol | 7 | 312 | Mean Difference (Random, 95% CI) | ‐0.78 [‐2.26, 0.70] |
| Outcome or subgroup title | No. of studies | No. of participants | Statistical method | Effect size |
| 1 SBP Show forest plot | 19 | 817 | Mean Difference (Random, 95% CI) | ‐2.89 [‐4.88, ‐0.90] |
| Analysis 3.1  Comparison 3 Hypertensive or normotensive subjects, Outcome 1 SBP. | ||||
| 1.1 Hypertensive | 7 | 297 | Mean Difference (Random, 95% CI) | ‐3.99 [‐7.02, ‐0.97] |
| 1.2 Normotensive | 12 | 520 | Mean Difference (Random, 95% CI) | ‐2.04 [‐4.64, 0.57] |
| 2 DBP Show forest plot | 17 | 753 | Mean Difference (Random, 95% CI) | ‐2.20 [‐3.17, ‐1.23] |
| Analysis 3.2  Comparison 3 Hypertensive or normotensive subjects, Outcome 2 DBP. | ||||
| 2.1 Hypertensive | 7 | 287 | Mean Difference (Random, 95% CI) | ‐2.11 [‐3.35, ‐0.86] |
| 2.2 Normotensive | 10 | 466 | Mean Difference (Random, 95% CI) | ‐2.22 [‐3.83, ‐0.60] |
| Outcome or subgroup title | No. of studies | No. of participants | Statistical method | Effect size |
| 1 SBP Show forest plot | 13 | 609 | Mean Difference (Random, 95% CI) | ‐1.86 [‐4.95, 1.23] |
| Analysis 4.1  Comparison 4 <10g or >10g sugar in cocoa/day with BMI >25, Outcome 1 SBP. | ||||
| 1.1 <10g sugar, BMI >25 | 6 | 229 | Mean Difference (Random, 95% CI) | ‐2.52 [‐4.74, ‐0.31] |
| 1.2 >10sugar, BMI >25 | 7 | 380 | Mean Difference (Random, 95% CI) | ‐1.12 [‐7.08, 4.85] |
| 2 DBP Show forest plot | 12 | 577 | Mean Difference (Random, 95% CI) | ‐1.79 [‐3.72, 0.13] |
| Analysis 4.2  Comparison 4 <10g or >10g sugar in cocoa/day with BMI >25, Outcome 2 DBP. | ||||
| 2.1 <10g sugar, BMI >25 | 5 | 197 | Mean Difference (Random, 95% CI) | ‐2.34 [‐4.19, ‐0.50] |
| 2.2 >10g sugar, BMI >25 | 7 | 380 | Mean Difference (Random, 95% CI) | ‐1.32 [‐4.70, 2.06] |
| Outcome or subgroup title | No. of studies | No. of participants | Statistical method | Effect size |
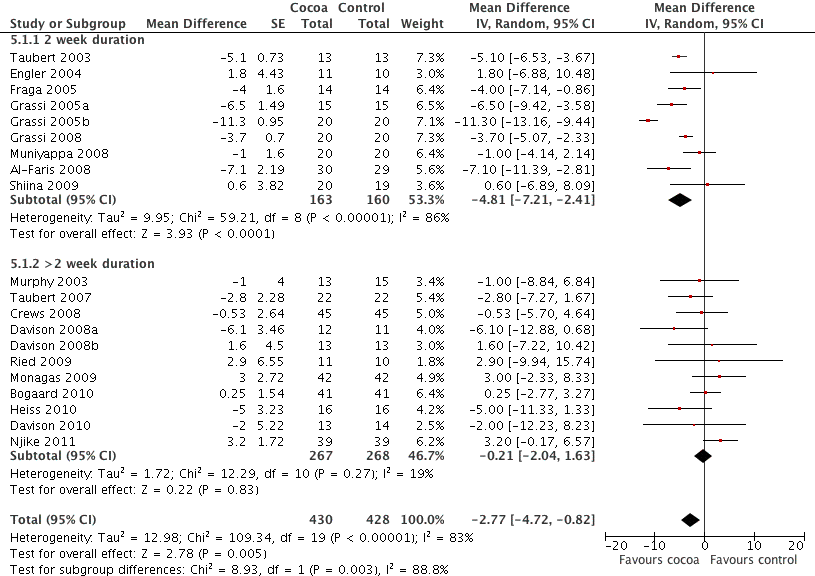
| 1 SBP Show forest plot | 20 | 858 | Mean Difference (Random, 95% CI) | ‐2.77 [‐4.72, ‐0.82] |
| Analysis 5.1  Comparison 5 Study duration 2 weeks or >2 weeks, Outcome 1 SBP. | ||||
| 1.1 2 week duration | 9 | 323 | Mean Difference (Random, 95% CI) | ‐4.81 [‐7.21, ‐2.41] |
| 1.2 >2 week duration | 11 | 535 | Mean Difference (Random, 95% CI) | ‐0.21 [‐2.04, 1.63] |
| 2 DBP Show forest plot | 19 | 823 | Mean Difference (Random, 95% CI) | ‐2.20 [‐3.46, ‐0.93] |
| Analysis 5.2  Comparison 5 Study duration 2 weeks or >2 weeks, Outcome 2 DBP. | ||||
| 2.1 2 week duration | 9 | 321 | Mean Difference (Random, 95% CI) | ‐3.19 [‐3.00, ‐1.38] |
| 2.2 >2 week duration | 10 | 502 | Mean Difference (Random, 95% CI) | ‐0.99 [‐2.01, 0.03] |
| Outcome or subgroup title | No. of studies | No. of participants | Statistical method | Effect size |
| 1 SBP Show forest plot | 20 | 856 | Mean Difference (Random, 95% CI) | ‐2.77 [‐4.72, ‐0.82] |
| Analysis 6.1  Comparison 6 Subjects >50 or <50 years old, Outcome 1 SBP. | ||||
| 1.1 <50 years | 10 | 332 | Mean Difference (Random, 95% CI) | ‐4.57 [‐7.41, ‐1.73] |
| 1.2 >50 years | 10 | 524 | Mean Difference (Random, 95% CI) | ‐0.96 [‐3.44, 1.52] |
| 2 DBP Show forest plot | 19 | 824 | Mean Difference (Random, 95% CI) | ‐2.20 [‐3.46, ‐0.93] |
| Analysis 6.2  Comparison 6 Subjects >50 or <50 years old, Outcome 2 DBP. | ||||
| 2.1 <50 years | 10 | 332 | Mean Difference (Random, 95% CI) | ‐3.85 [‐5.45, ‐2.26] |
| 2.2 >50 years | 9 | 492 | Mean Difference (Random, 95% CI) | ‐0.89 [‐1.80, 0.01] |
| Outcome or subgroup title | No. of studies | No. of participants | Statistical method | Effect size |
| 1 SBP Show forest plot | 17 | 757 | Mean Difference (Random, 95% CI) | ‐1.66 [‐3.22, ‐0.09] |
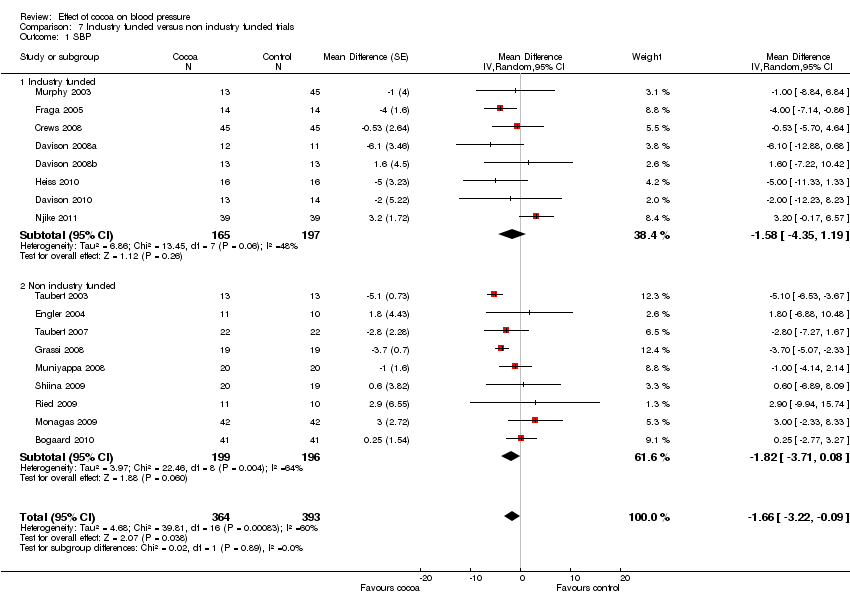
| Analysis 7.1  Comparison 7 Industry funded versus non industry funded trials, Outcome 1 SBP. | ||||
| 1.1 Industry funded | 8 | 362 | Mean Difference (Random, 95% CI) | ‐1.58 [‐4.35, 1.19] |
| 1.2 Non industry funded | 9 | 395 | Mean Difference (Random, 95% CI) | ‐1.82 [‐3.71, 0.08] |
| 2 DBP Show forest plot | 16 | 695 | Mean Difference (Random, 95% CI) | ‐1.49 [‐2.42, ‐0.55] |
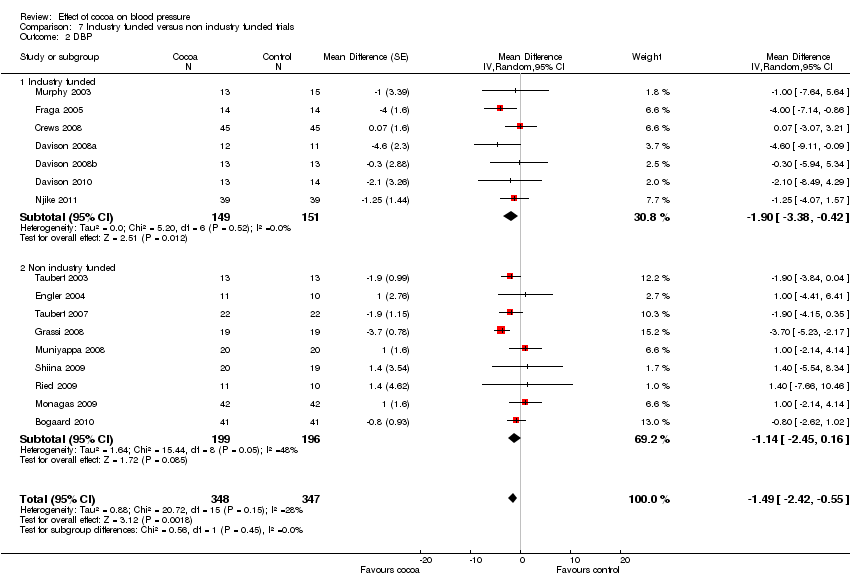
| Analysis 7.2  Comparison 7 Industry funded versus non industry funded trials, Outcome 2 DBP. | ||||
| 2.1 Industry funded | 7 | 300 | Mean Difference (Random, 95% CI) | ‐1.90 [‐3.38, ‐0.42] |
| 2.2 Non industry funded | 9 | 395 | Mean Difference (Random, 95% CI) | ‐1.14 [‐2.45, 0.16] |


Risk of bias summary: review authors' judgements about each risk of bias item for each included study.
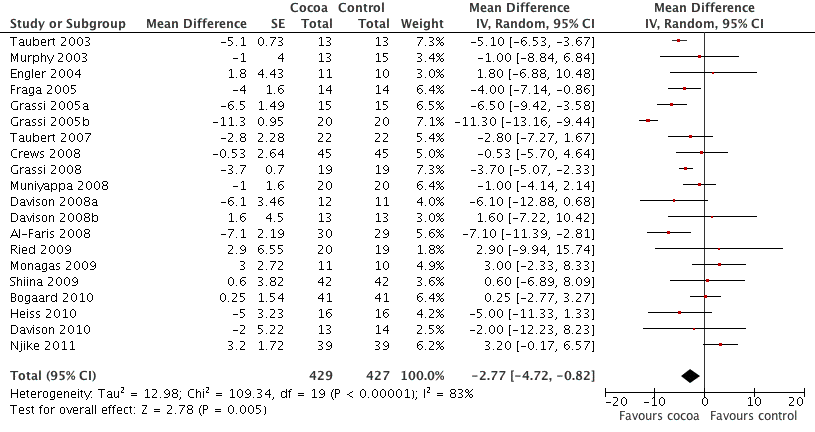
Forest plot of comparison: 1 Effect of cocoa on BP, outcome: 1.1 SBP.

Forest plot of comparison: 1 Effect of cocoa on BP, outcome: 1.2 DBP.

Forest plot of comparison: 2 Flavanol free or low flavanol control, outcome: 2.1 SBP.

Forest plot of comparison: 2 Flavanol free or low flavanol control, outcome: 2.2 DBP.
Forest plot of comparison: 7 Study duration 2 weeks or >2 weeks, outcome: 7.1 SBP.

Forest plot of comparison: 7 Study duration 2 weeks or >2 weeks, outcome: 7.2 DBP.
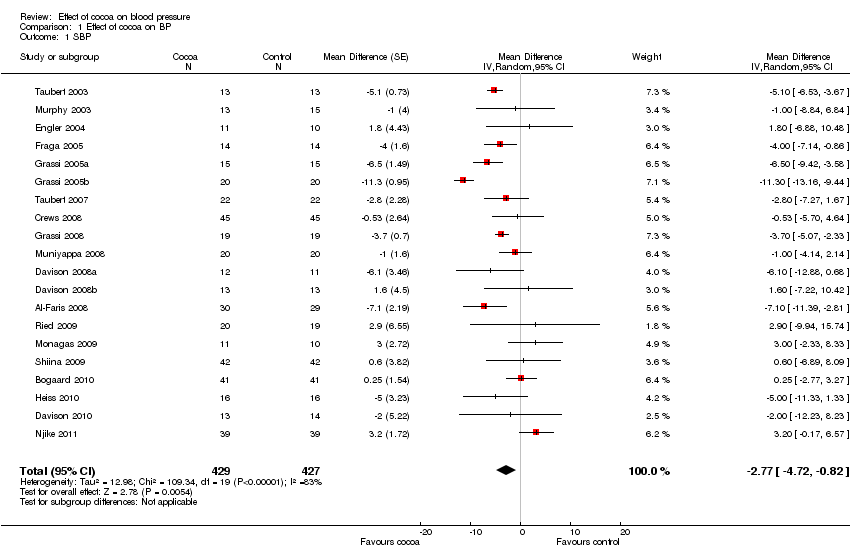
Comparison 1 Effect of cocoa on BP, Outcome 1 SBP.
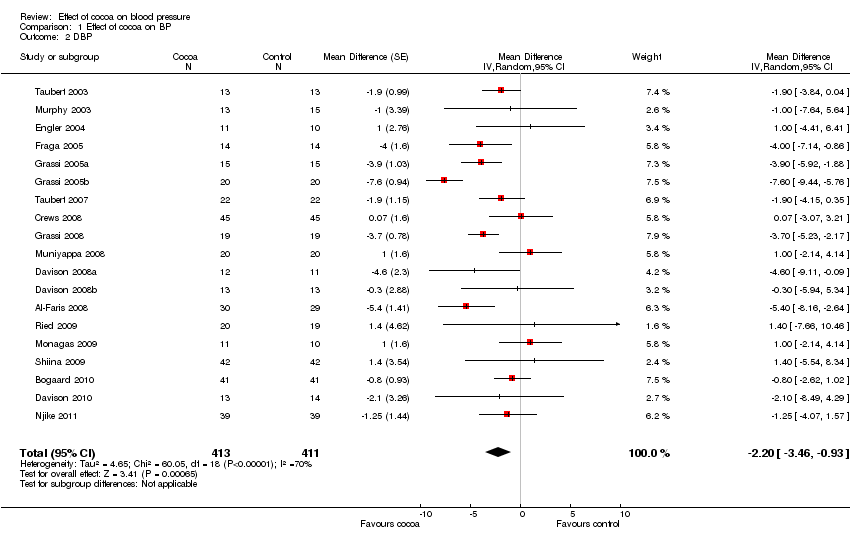
Comparison 1 Effect of cocoa on BP, Outcome 2 DBP.

Comparison 2 Flavanol free or low flavanol control, Outcome 1 SBP.

Comparison 2 Flavanol free or low flavanol control, Outcome 2 DBP.

Comparison 3 Hypertensive or normotensive subjects, Outcome 1 SBP.

Comparison 3 Hypertensive or normotensive subjects, Outcome 2 DBP.

Comparison 4 <10g or >10g sugar in cocoa/day with BMI >25, Outcome 1 SBP.

Comparison 4 <10g or >10g sugar in cocoa/day with BMI >25, Outcome 2 DBP.
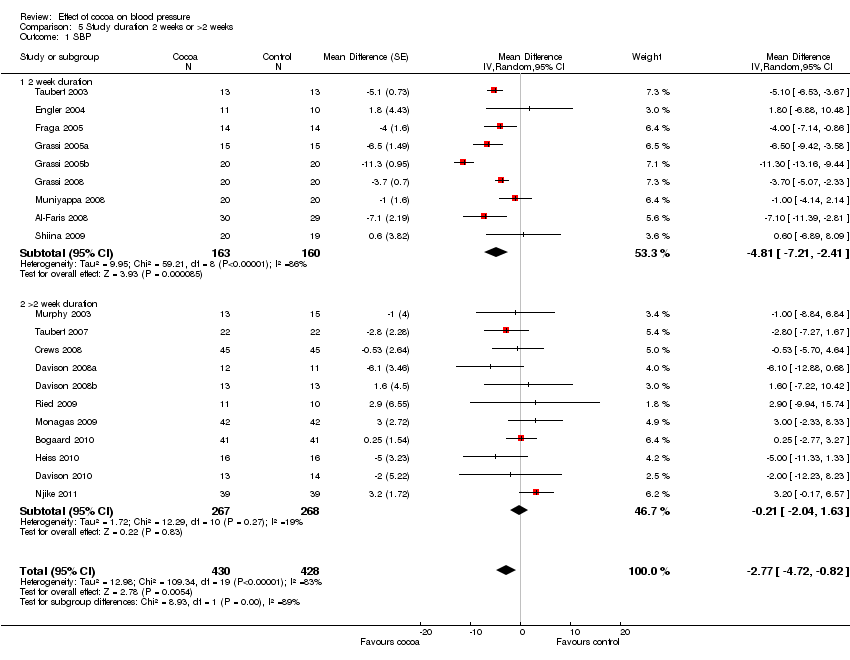
Comparison 5 Study duration 2 weeks or >2 weeks, Outcome 1 SBP.

Comparison 5 Study duration 2 weeks or >2 weeks, Outcome 2 DBP.

Comparison 6 Subjects >50 or <50 years old, Outcome 1 SBP.

Comparison 6 Subjects >50 or <50 years old, Outcome 2 DBP.
Comparison 7 Industry funded versus non industry funded trials, Outcome 1 SBP.
Comparison 7 Industry funded versus non industry funded trials, Outcome 2 DBP.
| Flavanol‐rich cocoa products for blood pressure | ||||||
| Patient or population: adults with or without hypertension | ||||||
| Outcomes | Illustrative comparative risks* (95% CI) | Relative effect | No of Participants | Quality of the evidence | Comments | |
| Assumed risk | Corresponding risk | |||||
| Control | Flavanol‐rich cocoa products | |||||
| Systolic blood pressure | The mean systolic blood pressure ranged across control groups from 110 to 154 mm Hg | The mean systolic blood pressure in the intervention groups was | 856 | ⊕⊕⊝⊝ | ||
| Diastolic blood pressure | The mean diastolic blood pressure ranged across control groups from 66 to 91.6 mm Hg | The mean diastolic blood pressure in the intervention groups was | 824 | ⊕⊕⊝⊝ | ||
| *The basis for the assumed risk (e.g. the median control group risk across studies) is provided in footnotes. The corresponding risk (and its 95% confidence interval) is based on the assumed risk in the comparison group and the relative effect of the intervention (and its 95% CI). | ||||||
| GRADE Working Group grades of evidence | ||||||
| 1 11 out of 20 trials provided insufficient information regarding allocation concealment. 9 trials were single blinded, using unblinded controls, one trial blinded control group but not intervention group.Two trials had more than 20% attrition. | ||||||
| Study | Study Design | Participants | Cocoa# Dosage; Brand | Cocoa product | Total Flavanols (mg)
| Epi‐/ catechin (mg) | Theobromine (mg) | Sugar | Duration | Baseline SBP (mm Hg) | Baseline DBP (mm Hg) | Age; BMI |
| Cocoa / Control group | ||||||||||||
| Taubert 03 | C | 13/13 | 100g bar; Rittersport Halbbitter, D | 50% DC/WC | 500/0 | 89/0 | 560/0 | 49 | 2 weeks | 153.3/153.6 | 84.5/84.2 | 59.5 yrs; 24.1 |
| Murphy 03 | P | 13/15 | 6 tablets; Cocoapro Mars, US | HiFl/LoFl tablets | 234/6.4 | ‐ | ‐ | 0 | 4 weeks | 118/116 | 78/76 | 43.5 yrs; 26.0 |
| Engler 04 | P | 11/10 | 46g bar; Dove Mars, US | HiFl/LoFl DC | 213/0 | 46/0 | ‐ | 15 | 2 weeks | 121/112.8 | 68.1/66.1 | 32.1 yrs; 22.6 |
| Fraga 05 | C | 14/14 | 105g M&M confectionary Mars, US | 16% MC/WC | 168/0 | 39/0 | 179/0 | 57 | 2 weeks | 123/123 | 72/71 | 18.0 yrs; 24.1 |
| Grassi 05a | C | 15/15 | 100g bar; Rittersport, D | 50% DC/WC | 500/0 | 89/0 | 560/0 | 49 | 2 weeks | 112.9/113.2 | 74/73.8 | 33.9 yrs; 22.6 |
| Grassi 05b | C | 20/20 | 100g bar; Rittersport, D | 50% DC/WC | 500/0 | 89/0 | 560/0 | 49 | 2 weeks | 141.3/141.1 | 92.4/91.8 | 43.7 yrs; 25.4 |
| Taubert 07 | P | 22/22 | 6.3g bar; Rittersport, D | 50% DC/WC | 30/0 | 7.1/0 | 26.4/0 | 3 | 18 weeks | 147.7/147.5 | 86.4/86.7 | 63.6 yrs; 24.0 |
| Crews 08 | P | 45/45 | 37g bar + 12g powder; Hershey, US | HiFl/LoFl bar & drink | 755/41 | ‐ | ‐ | 15 | 6 weeks | 126.8/128.6 | 74.2/75 | 68.8 yrs; 25.3 |
| Grassi 08 | C | 19/19 | 100g bar; Cuorenero, Ital | 90% DC/WC | 1080/0 | 150/0 | 170/0 | 0 | 2 weeks | 141.1/140.9 | 91.2/91.1 | 44.8 yrs; 26.5 |
| Muniyappa 08 | C | 20/20 | 62g powder; CocoaPro Mars, US | HiFl/LoFl drink | 902/28 | 236/10 | 674/654 | 17 | 2 weeks | 141/141 | 91/91 | 51.0 yrs; 33.2 |
| Davison 08a | P | 12/11 | powder; Mars, US | HiFl/LoFl drink | 902/36 | ‐ | 337/327 | 9.4 | 12 weeks | 124/124 | 76/77 | 44.9 yrs; 33.6 |
| Davison 08b | P | 13/13 | powder; Mars, US | HiFl/LoFl drink | 902/36 | ‐ | 337/327 | 9.4 | 12 weeks | 126/121 | 78/74 | 45.4 yrs; 33.3 |
| Al‐Faris 08 | P | 30/29 | 100g bar; Galaxy/Dove Mars, US
| 50% DC/WC | 500/0 | 10.6/0 | ‐ | 59 | 2 weeks | 115.9/115.2 | 73/72.8 | 21.3 yrs; 22 |
| Shiina 09 | P | 20/19 | 45g bar; Meiji, Jpn | 80% DC/WC | 550/0 | ‐ | ‐ | 9 | 2 weeks | 116.4/121.6 | 64.7/72.2 | 29.8 yrs; 22.6
|
| Ried 09 | P | 11/10 | 50g bar Haighs, AUS | 70% DC/placebo pill | 750/0 | ‐ | ‐ | 15 | 8 weeks | 135/135.7 | 83.6/77.8 | 53.1 yrs; 26.6 |
| Monagas 09 | C | 42/42 | 40g powder; Nutrexpa, Spain | HiFl/0 in milk | 495/0 | 56.5/0 | 440/0 | 26 | 4 weeks | 138/138 | 84/84 | 69.7 yrs; 27.6 |
| Bogaard 10 | C | 41/41 | 3.6 g powder; Aticoa, Barry Callebaut, Belg | HiFl/LoFl drink
| 529/0 | 38/0 | 543/0
| 1 | 3 weeks | 141.7/141.7 | 84.2/84.2 | 62.0 yrs; 25.9 |
| Heiss 10 | C | 16/16 | powder Cocoapro, Mars, US | HiFl/LoFl drink in milk or water | 750/18 | 130/6 | 186/192 | 8.6 | 4 weeks | 132/131 | ‐ | 64.0 yrs; 27.8 |
| Desch 10 | P | 43/48 | 25g/6g bar; Rittersport, D | 50% DC/DC | 125/30 | 29.5/7.1 | 110/26.4 | 13 | 12 weeks | 135.7/134.3 | 79.3/75.8 | 66.0 yrs; 28.1 |
| Davison 10 | p | 13/14 | 174g powder; Mars, US | HiFl/LoFl drink | 1052/33 | 266/12 | 460.5/ 402.2 | 17.7 | 6 weeks | 143/145.4 | 83.2/88 | 56.6 yrs; 29.3 |
| Njike 11 | C | 38/38 | 22g powder; Hershey, US | HiFl/LoFl drink | 805/9 | 69/0 | 436/0 | 46 | 6 weeks | 123.3/123.6 | 68.5/67.3 | 52.2 yrs; 30.3 |
|
| Variable | Number of studies | Regression coefficient | P‐value |
| SBP | Blinded or non‐blinded control group | 20 | 3.9952 | 0.031 |
|
| Sugar dosage (continuous) | 20 | ‐0.0794 | 0.079 |
|
| Duration: 2 weeks or >2 weeks | 20 | 4.4342 | 0.016 |
|
|
|
|
|
|
| DBP | Blinded or non‐blinded control group | 19 | 3.272 | 0.005 |
|
| Sugar dosage (continuous) | 19 | ‐0.0569 | 0.052 |
|
| Duration: 2 weeks or >2 weeks | 19 | 2.3324 | 0.055 |
|
| Age (continuous) | 19 | 0.0870 | 0.029 |
| Sensitivity analyses
| Comparison | Mean difference (95% CI) | p‐value | I2 | I2 before sensitivity analysis |
| Excluding Grassi 2005b | SBP all | ‐2.33 (‐3.83,‐0.83) | 0.002 | 63% | 83% |
|
| DBP all | ‐1.90 (‐2.88, ‐0.92) | 0.0001 | 44% | 70% |
|
| SBP flavanol‐free subgroup | ‐3.20 (‐4.84, ‐1.56) | 0.0001 | 62% | 86% |
|
| DBP flavanol‐free subgroup | ‐2.29 (‐3.49, ‐1.09) | 0.0002 | 54% | 77% |
|
| SBP hypertensive subgroup | ‐2.84 (‐4.61, ‐1.07) | 0.002 | 63% | 91% |
|
| DBP hypertensive subgroup | ‐1.76 (‐3.09, ‐0.44) | 0.009 | 50% | 85% |
|
| SBP sugar > 10g, BMI > 25 subgroup | 0.95 (‐0.95, 2.85) | 0.33 | 0% | 93% |
|
| DBP sugar > 10g, BMI > 25 subgroup | 0.04 (‐1.42, 1.50) | 0.96 | 0% | 86% |
|
| SBP 2 weeks subgroup | ‐4.12 (‐5.53, ‐2.70) | <0.0001 | 48% | 86% |
|
| DBP 2 weeks subgroup | ‐2.68 (‐4.14, ‐1.22) | 0.0003 | 56% | 77% |
|
| SBP <50 yrs age subgroup | ‐4.33 (‐5.87, ‐2.79) | <0.0001 | 23% | 84% |
|
| DBP <50 yrs age subgroup | ‐3.72 (‐4.70, ‐2.74) | <0.0001 | 0% | 60% |
| Excluding Taubert 2007 | SBP all | ‐2.75 (‐4.79, ‐0.72) | 0.008 | 83% | 83% |
| DBP all | ‐2.20 (‐3.55, ‐0.85) | 0.001 | 71% | 70% | |
| SBP flavanol‐free subgroup | ‐3.76 (‐6.22, ‐1.30) | 0.003 | 87% | 86% | |
| DBP flavanol‐free subgroup | ‐2.77 (‐4.47, ‐1.06) | 0.001 | 78% | 77% | |
| SBP hypertensive subgroup | ‐4.16 (‐7.48, ‐0.84) | 0.01 | 92% | 91% | |
| DBP hypertensive subgroup | ‐2.11 (‐3.58, ‐0.63) | 0.005 | 60% | 85% | |
| SBP >2 weeks subgroup | ‐0.20 (‐1.71, 2.12) | 0.83 | 15% | 19% | |
| DBP >2 weeks subgroup | ‐0.76 (‐1.90, 0.38) | 0.19 | 0% | 0% | |
| SBP >50 yrs age subgroup | ‐0.72 (‐3.48, 2.04) | 0.61 | 76% | 73% | |
| DBP >50 yrs age subgroup | ‐0.70 (‐1.69, 0.28) | 0.16 | 0% | 0% | |
|
|
|
|
|
|
|
| Excluding trials with loss‐of‐follow up/poor compliance > 20% (Muniyappa 2008, Davison 2008b) | SBP all | ‐3.03 (‐5.09, ‐0.97) | 0.004 | 83% | 83% |
|
| DBP all | ‐2.48 (‐3.78, ‐1.18) | 0.0002 | 70% | 70% |
|
| SBP low‐flavanol subgroup | ‐1.24 (‐4.59, 2.12) | 0.47 | 46% | 27% |
|
| DBP low‐flavanol subgroup | ‐1.39 (‐3.15, 0.37) | 0.12 | 0% | 0% |
|
| SBP hypertensive subgroup (–M8) | ‐4.52 (‐7.81, ‐1.22) | 0.007 | 92% | 91% |
|
| DBP hypertensive subgroup (‐M8) | ‐3.12 (‐5.31, ‐0.92) | 0.005 | 84% | 85% |
|
| SBP normotensive subgroup (–D8b) | ‐2.24 (‐4.95, 0.47) | 0.11 | 68% | 66% |
|
| DBP normotensive subgroup (‐D8b) | ‐2.32 (‐4.02, ‐0.62) | 0.007 | 52% | 47% |
|
| SBP sugar >10g, BMI > 25 subgroup (‐M8) | ‐1.07 (‐8.41, 6.26) | 0.77 | 94% | 93% |
|
| DBP sugar >10g, BMI > 25 subgroup (‐M8) | ‐1.74 (‐5.49, 2.00) | 0.36 | 86% | 86% |
|
| SBP sugar <10g, BMI > 25 subgroup (‐D8b) | ‐2.77 (‐5.07, ‐0.46) | 0.02 | 41% | 37% |
|
| DBP sugar <10g, BMI > 25 subgroup (‐D8b) | ‐2.55 (‐4.60, ‐0.49) | 0.02 | 55% | 45% |
|
| SBP 2 weeks subgroup (‐M8) | ‐5.35 (‐7.35, ‐2.85) | <0.0001 | 86% | 86% |
|
| DBP 2 weeks subgroup (‐M8) | ‐3.78 (‐5.50, ‐2.06) | <0.0001 | 73% | 77% |
|
| SBP >2 wks subgroup (‐D8b) | ‐0.35 (‐2.32, 1.63) | 0.73 | 26% | 19% |
|
| DBP >2 wks subgroup (‐D8b) | ‐1.01 (‐2.05, 0.02) | 0.06 | 0% | 0% |
|
| SBP <50 yrs age subgroup (‐D8b) | ‐5.46 (‐8.47, ‐2.45) | 0.0004 | 86% | 84% |
|
| DBP <50 yrs age subgroup (‐D8b) | ‐4.37 (‐5.94, ‐2.79) | <0.0001 | 60% | 60% |
|
| SBP >50 yrs age subgroup (‐M8) | ‐0.93 (‐3.79, 1.93) | 0.52 | 75% | 73% |
|
| DBP >50 yrs age subgroup (‐M8) | ‐1.06 (‐2.01, ‐0.12) | 0.03 | 0% | 0% |
| Using alternative correlation coefficients for cross‐over trials (main analysis: r=0.68) | SBP r=0.5 | ‐2.85 (‐4.76, ‐0.93) | 0.004 | 75% | 83% |
| SBP r=0.3 | ‐2.93 (‐4.82, ‐1.05) | 0.002 | 67.3% | 83% | |
| DBP r=0.5 | ‐2.23 (‐3.45, ‐1.00) | <0.0001 | 57.2% | 70% | |
| DBP r=0.3 | ‐2.24 (‐3.44, ‐1.05) | <0.0001 | 44.7% | 70% |
| Study | Study design
| Participants* Cocoa/ Control | Withdrawn Cocoa/Control | Adverse effects Cocoa/Control | Compliance rate
| Change in heart rate Mean (SD) |
| Taubert 03 | C | 13/13 | 0 | ‐ | 100% | Not significant |
| Murphy 03 | P | 13/15 | 3 | Family illness (2) Non‐compliance in final week (1) | 90% | ‐ |
| Engler 04 | P | 11/10 | 0 | ‐ | 100% | ‐ |
| Fraga 05 | C | 14/14 | 1 | no reason given | 96% | ‐ |
| Grassi 05a | C | 15/15 | 0 | ‐ | 100% | ‐ |
| Grassi 05b | C | 20/20 | 0 | ‐ | 100% | ‐ |
| Taubert 07 | P | 22/22 | 0 | ‐ | 100% | ‐ |
| Crews 08 | P | 45/45 | 6/5 | Gastrointestinal upset/headache/cold sweat (2/1) Bronchitis (1/0) Jitteriness/increased energy (1/0) Artrial arrhythmia/medication change (1/0) Distaste of study product (1/1) Family illness (0/1) Unspecified reason (0/1) No adherence to trial regimen (0/1) | 89% | Cocoa: 4.72 (7.93) Control: 0.33 (8.19) P= 0.007 |
| Grassi 08 | C | 19/19 | 0 | ‐ | 100% | ‐ |
| Muniyappa 08 | C | 20/20 | 5/4 | Loss‐to‐follow‐up (0/1) Discontinued intervention (4/2) due to intolerance to treatment, family emergencies, personal problems excluded from analysis (1/1) | 69% | ‐ |
| Davison 08a | P | 12/11 | 7 | Time restrictions, personal circumstances (14) Non‐compliance (exercise or diet) (2)
| 79% | Not significant |
| Davison 08b | P | 13/13 | 5 | 84% | Not significant | |
| Al‐Faris 08 | P | 30/29 | 0 | ‐ | 100% | Not significant |
| Shiina 09 | P | 20/19 | 0 | ‐ | 100% | Not significant |
| Ried 09 | P | 11/10 | 2/2 | Study product unpalatable (2/0) Gastrointestinal upset (0/1) Illness unrelated to study (0/1) | 84% | ‐ |
| Monagas 09 | C | 42/42 | 0 | Constipation (resolved with fibre intake) | 100% | Not significant |
| Bogaard 10 | C | 41/41 | 3 | Nausea (1) Headache (1) Arrythmia unrelated (1)
| 93% | ‐ |
| Heiss 10 | C | 16/16 | 3 | Did not come to first visit | 94% | Not significant |
| Davison 10 | P | 13/14 | 7 | Mild gastric symptoms (1) Non‐compliance to study protocol (1) Withdrew due to personal circumstances (5) | 88% | Not significant |
| Njike 11 | C | 38/38 | 7 | Non‐compliance to study protocol (1) Withdrew due to personal reasons (6)
| 84% | ‐ |
| Outcome or subgroup title | No. of studies | No. of participants | Statistical method | Effect size |
| 1 SBP Show forest plot | 20 | 856 | Mean Difference (Random, 95% CI) | ‐2.77 [‐4.72, ‐0.82] |
| 2 DBP Show forest plot | 19 | 824 | Mean Difference (Random, 95% CI) | ‐2.20 [‐3.46, ‐0.93] |
| Outcome or subgroup title | No. of studies | No. of participants | Statistical method | Effect size |
| 1 SBP Show forest plot | 20 | 856 | Mean Difference (Random, 95% CI) | ‐2.77 [‐4.72, ‐0.82] |
| 1.1 Flavanol free | 12 | 512 | Mean Difference (Random, 95% CI) | ‐3.70 [‐6.02, ‐1.38] |
| 1.2 Low flavanol | 8 | 344 | Mean Difference (Random, 95% CI) | ‐0.71 [‐2.99, 1.57] |
| 2 DBP Show forest plot | 19 | 824 | Mean Difference (Random, 95% CI) | ‐2.20 [‐3.46, ‐0.93] |
| 2.1 Flavanol free | 12 | 512 | Mean Difference (Random, 95% CI) | ‐2.71 [‐4.26, ‐1.15] |
| 2.2 Low flavanol | 7 | 312 | Mean Difference (Random, 95% CI) | ‐0.78 [‐2.26, 0.70] |
| Outcome or subgroup title | No. of studies | No. of participants | Statistical method | Effect size |
| 1 SBP Show forest plot | 19 | 817 | Mean Difference (Random, 95% CI) | ‐2.89 [‐4.88, ‐0.90] |
| 1.1 Hypertensive | 7 | 297 | Mean Difference (Random, 95% CI) | ‐3.99 [‐7.02, ‐0.97] |
| 1.2 Normotensive | 12 | 520 | Mean Difference (Random, 95% CI) | ‐2.04 [‐4.64, 0.57] |
| 2 DBP Show forest plot | 17 | 753 | Mean Difference (Random, 95% CI) | ‐2.20 [‐3.17, ‐1.23] |
| 2.1 Hypertensive | 7 | 287 | Mean Difference (Random, 95% CI) | ‐2.11 [‐3.35, ‐0.86] |
| 2.2 Normotensive | 10 | 466 | Mean Difference (Random, 95% CI) | ‐2.22 [‐3.83, ‐0.60] |
| Outcome or subgroup title | No. of studies | No. of participants | Statistical method | Effect size |
| 1 SBP Show forest plot | 13 | 609 | Mean Difference (Random, 95% CI) | ‐1.86 [‐4.95, 1.23] |
| 1.1 <10g sugar, BMI >25 | 6 | 229 | Mean Difference (Random, 95% CI) | ‐2.52 [‐4.74, ‐0.31] |
| 1.2 >10sugar, BMI >25 | 7 | 380 | Mean Difference (Random, 95% CI) | ‐1.12 [‐7.08, 4.85] |
| 2 DBP Show forest plot | 12 | 577 | Mean Difference (Random, 95% CI) | ‐1.79 [‐3.72, 0.13] |
| 2.1 <10g sugar, BMI >25 | 5 | 197 | Mean Difference (Random, 95% CI) | ‐2.34 [‐4.19, ‐0.50] |
| 2.2 >10g sugar, BMI >25 | 7 | 380 | Mean Difference (Random, 95% CI) | ‐1.32 [‐4.70, 2.06] |
| Outcome or subgroup title | No. of studies | No. of participants | Statistical method | Effect size |
| 1 SBP Show forest plot | 20 | 858 | Mean Difference (Random, 95% CI) | ‐2.77 [‐4.72, ‐0.82] |
| 1.1 2 week duration | 9 | 323 | Mean Difference (Random, 95% CI) | ‐4.81 [‐7.21, ‐2.41] |
| 1.2 >2 week duration | 11 | 535 | Mean Difference (Random, 95% CI) | ‐0.21 [‐2.04, 1.63] |
| 2 DBP Show forest plot | 19 | 823 | Mean Difference (Random, 95% CI) | ‐2.20 [‐3.46, ‐0.93] |
| 2.1 2 week duration | 9 | 321 | Mean Difference (Random, 95% CI) | ‐3.19 [‐3.00, ‐1.38] |
| 2.2 >2 week duration | 10 | 502 | Mean Difference (Random, 95% CI) | ‐0.99 [‐2.01, 0.03] |
| Outcome or subgroup title | No. of studies | No. of participants | Statistical method | Effect size |
| 1 SBP Show forest plot | 20 | 856 | Mean Difference (Random, 95% CI) | ‐2.77 [‐4.72, ‐0.82] |
| 1.1 <50 years | 10 | 332 | Mean Difference (Random, 95% CI) | ‐4.57 [‐7.41, ‐1.73] |
| 1.2 >50 years | 10 | 524 | Mean Difference (Random, 95% CI) | ‐0.96 [‐3.44, 1.52] |
| 2 DBP Show forest plot | 19 | 824 | Mean Difference (Random, 95% CI) | ‐2.20 [‐3.46, ‐0.93] |
| 2.1 <50 years | 10 | 332 | Mean Difference (Random, 95% CI) | ‐3.85 [‐5.45, ‐2.26] |
| 2.2 >50 years | 9 | 492 | Mean Difference (Random, 95% CI) | ‐0.89 [‐1.80, 0.01] |
| Outcome or subgroup title | No. of studies | No. of participants | Statistical method | Effect size |
| 1 SBP Show forest plot | 17 | 757 | Mean Difference (Random, 95% CI) | ‐1.66 [‐3.22, ‐0.09] |
| 1.1 Industry funded | 8 | 362 | Mean Difference (Random, 95% CI) | ‐1.58 [‐4.35, 1.19] |
| 1.2 Non industry funded | 9 | 395 | Mean Difference (Random, 95% CI) | ‐1.82 [‐3.71, 0.08] |
| 2 DBP Show forest plot | 16 | 695 | Mean Difference (Random, 95% CI) | ‐1.49 [‐2.42, ‐0.55] |
| 2.1 Industry funded | 7 | 300 | Mean Difference (Random, 95% CI) | ‐1.90 [‐3.38, ‐0.42] |
| 2.2 Non industry funded | 9 | 395 | Mean Difference (Random, 95% CI) | ‐1.14 [‐2.45, 0.16] |