Effect of cocoa on blood pressure
Abstract
Background
High blood pressure is an important risk factor for cardiovascular disease attributing to about 50% of cardiovascular events worldwide and 37% of cardiovascular related deaths in Western populations. Epidemiological studies suggest that cocoa rich products reduce the risk of cardiovascular disease. Flavanols found in cocoa have been shown to increase the formation of endothelial nitric oxide which promotes vasodilation and therefore blood pressure reduction. Previous meta‐analyses have shown that cocoa‐rich foods may reduce blood pressure. Recently additional trials had conflicting results.
Objectives
To determine the effect of flavanol‐rich chocolate or cocoa products on blood pressure in people with or without hypertension.
Search methods
We searched the following electronic databases from inception to November 2011: Cochrane Hypertension Group Specialised Register, CENTRAL, MEDLINE and EMBASE. In addition we searched international trial registries, and the reference lists of review articles and included trials.
Selection criteria
Randomised controlled trials (RCT) investigating the effects of chocolate or cocoa products on systolic and diastolic blood pressure in adults for a minimum of two weeks duration.
Data collection and analysis
Two authors independently extracted data and assessed the risk of bias in each trial in consultation with a third author. Random effects meta‐analyses on all studies fitting the inclusion criteria were conducted using Review Manager version 5.1 and Stata version 12. Heterogeneity was explored by subgroup analyses and univariate meta‐regression analysis of several variables including dosage of flavanol content (total or monomers) in chocolate or cocoa products, blinding, baseline blood pressure, theobromine content, sugar content, body‐mass‐index (BMI), duration and age.
Main results
Twenty studies met the inclusion criteria. Meta‐analyses of the 20 studies involving 856 mainly healthy participants revealed a statistically significant blood pressure reducing effect of flavanol‐rich cocoa products compared with control in short‐term trials of 2‐18 weeks duration:
Mean difference SBP (95%CI): ‐2.77 (‐4.72, ‐0.82) mm Hg, p=0.005, n=20;
mean difference DBP (95%CI): ‐ 2.20 (‐3.46, ‐0.93) mm Hg, p=0.006, n=19 available for DBP.
Trials provided participants with 30‐1080 mg of flavanols (mean=545.5 mg) in 3.6‐105 g of cocoa products per day in the active intervention group. In half of the trials (n=10) the active group consumed 500‐750 mg of flavanols per day. The control group received either a flavanol‐free product (n=12) or a low‐flavanol containing cocoa powder (6.4 and 41 mg flavanols, n=8). Subgroup meta‐analysis of trials with a flavanol‐free control group revealed a significant blood pressure reducing effect, in contrast to trials using a low‐flavanol product in the control group. This analysis may have been confounded by trial duration and the level of blinding of participants.
Trial duration was short (mean 4.4 weeks, range 2‐8 weeks, n=19, and one trial of 18 weeks). A significant blood pressure reducing effect was evident in trials of 2 weeks duration (n=9), but not in trials of >2 weeks duration (n=11). It is important to note that seven out of the nine trials (78%) of 2 weeks duration also had a flavanol‐free control group. Therefore, subgroup analysis by duration might be confounded by flavanol dosage used in the control groups, and the level of blinding of participants.
Adverse effects including gastrointestinal complaints and distaste of the trial product were reported by 5% of patients in the active cocoa intervention group and 1% of patients in the control groups.
Authors' conclusions
Flavanol‐rich chocolate and cocoa products may have a small but statistically significant effect in lowering blood pressure by 2‐3 mm Hg in the short term.
Our findings are limited by the heterogeneity between trials, which was explored by univariate meta‐regression and subgroup analyses. Subgroup meta‐analysis of trials using a flavanol‐free control group revealed a significant blood pressure reducing effect of cocoa, whereas analysis of trials using a low‐flavanol control product did not. While it appears that shorter trials of 2 weeks duration were more effective, analysis may be confounded by type of control and unblinding of participants, as the majority of 2‐week trials also used a flavanol‐free control and unblinding of participants. Results of these and other subgroup analyses based on, for example, age of participants, should be interpreted with caution and need to be confirmed or refuted in trials using direct randomized comparison.
Long‐term trials investigating the effect of cocoa products are needed to determine whether or not blood pressure is reduced on a chronic basis by daily ingestion of cocoa. Furthermore, long‐term trials investigating the effect of cocoa on clinical outcomes are also needed to assess whether cocoa has an effect on cardiovascular events and to assess potential adverse effects associated with chronic ingestion of cocoa products.
PICO
Plain language summary
Effect of cocoa on blood pressure
Flavanols found in cocoa have been associated with blood pressure lowering properties due to their stimulation of nitric oxide dependent vasodilation. In this review we assessed the effect of cocoa products on blood pressure in adults when consumed daily for a minimum of two weeks.
Meta‐analysis of 20 studies involving 856 mainly healthy participants revealed a small but statistically significant blood pressure reducing effect of ‐2.8 mm Hg systolic and ‐2.2 mm Hg diastolic.
Trials were of short duration, all but one trial were between two and eight weeks long (n=1 of 18 weeks). While a significant effect with trials of two weeks duration (n=9) was evident, it was not with trials of longer duration (n=11). It is not clear whether this result is directly attributable to the trial length or may be due to another factor such as the type of control group used in the shorter trials or the level of blinding of participants to the treatment. While analysis of trials using a flavanol free control group indicated a significant effect on blood pressure, analysis of trials using a low flavanol control group did not.
Adverse effects including gastrointestinal complaints and distaste of the trial product were reported by 5% of patients in the active cocoa intervention group and 1% of patients in the control groups.
Although we did further analyses and explored other subgroups for an effect (including by age, body mass index and baseline blood pressure; sugar content of the cocoa product), the results of all subgroup analyses, and any measured association of effect, need to be tested, and confirmed or refuted, in further trials.
The small reduction in blood pressure of about 2‐3 mm Hg observed in the pooled trials overall might complement other treatment options and might contribute to reducing the risk of cardiovascular disease. However, we were unable to identify any randomized, controlled trials that tested the effect of long‐term daily ingestion of cocoa products on blood pressure and there were no trials that measured an effect on clinical outcomes related to high blood pressure such as heart attacks or strokes.
More trials in which the intake of low flavanol dosages are compared with flavanol‐free controls are required to test whether low dosages are effective in reducing blood pressure. In addition, longer term trials are needed to elucidate whether regular consumption of flavanol‐rich cocoa products has a beneficial effect on blood pressure and cardiovascular health over time, and whether there are any potential adverse effects of long‐term ingestion of cocoa products on a daily basis.
Authors' conclusions
Summary of findings
| Flavanol‐rich cocoa products for blood pressure | ||||||
| Patient or population: adults with or without hypertension | ||||||
| Outcomes | Illustrative comparative risks* (95% CI) | Relative effect | No of Participants | Quality of the evidence | Comments | |
| Assumed risk | Corresponding risk | |||||
| Control | Flavanol‐rich cocoa products | |||||
| Systolic blood pressure | The mean systolic blood pressure ranged across control groups from 110 to 154 mm Hg | The mean systolic blood pressure in the intervention groups was | 856 | ⊕⊕⊝⊝ | ||
| Diastolic blood pressure | The mean diastolic blood pressure ranged across control groups from 66 to 91.6 mm Hg | The mean diastolic blood pressure in the intervention groups was | 824 | ⊕⊕⊝⊝ | ||
| *The basis for the assumed risk (e.g. the median control group risk across studies) is provided in footnotes. The corresponding risk (and its 95% confidence interval) is based on the assumed risk in the comparison group and the relative effect of the intervention (and its 95% CI). | ||||||
| GRADE Working Group grades of evidence | ||||||
| 1 11 out of 20 trials provided insufficient information regarding allocation concealment. 9 trials were single blinded, using unblinded controls, one trial blinded control group but not intervention group.Two trials had more than 20% attrition. | ||||||
Background
Dark chocolate and flavanol‐rich cocoa products have attracted interest as an alternative treatment option for hypertension, a known risk factor for cardiovascular disease. Even small reductions in blood pressure substantially reduce cardiovascular risk. Current guidelines strongly recommend integration of lifestyle modification and complementary treatment with the use of conventional blood pressure medications.
The interest in the effect of cocoa on blood pressure started with the discovery that an island population in Central America, the Kuna Indians had a distinctively low rate of hypertension coupled with a consistent healthy low blood pressure unaffected by age (Hollenberg 2006, Kean 1944). The majority of the Kuna Indians live on the San Blas Island off Panama (population approx. 35,000); those Kuna Indians who migrated to the mainland manifest a higher prevalence of hypertension as well as an age‐dependent rise of blood pressure, implying that lifestyle factors such as diet rather than genetics play a protective role (McCullough 2006). Island‐dwelling Kuna Indians consume about 3‐4 cups of cocoa drinks on average per day, while the mainland‐dwelling Kuna Indians consume up to 10 times less cocoa (McCullough 2006, Schroeter 2006). Average high salt intake was not associated with the differences in blood pressure (McCullough 2006). Mean blood pressure of the island‐dwelling adult Kuna Indians hovers around 110 mm Hg systolic and 70 mm Hg diastolic, while on the mainland observed age‐related blood pressure rise and hypertension prevalence is comparable to that of Western populations (Hollenberg 2006).
High blood pressure is a critically important risk factor for cardiovascular disease, attributable for 47% of ischemic heart disease and 54% of stroke events worldwide (Lawes 2008). More than a third (37%) of cardiovascular deaths are attributed to hypertension in Western populations (Martiniuk 2007) and 13.5% globally (Lawes 2008). The association between cardiovascular risk and blood pressure levels are continuous (McInnes 2005) with the risk of ischemic heart disease and stroke halved for every 20 mm Hg reduction in systolic blood pressure (SBP) and 10 mm Hg diastolic blood pressure (DBP) (Lewington 2002). Even small reductions in blood pressure therefore can substantially reduce cardiovascular events at a population level.
Cocoa is extracted from cacao beans, the fatty seeds of the Theobroma cacao tree. Cocoa is rich in flavanols, particularly epicatechin, catechin and procyanidins, proposed to be responsible for the blood pressure lowering effect (Corti 2009, Heiss 2010a). Flavanols are also found in other plant‐derived produce, including beans, apricots, blackberries, apples and tea leaves, albeit in a lower concentration than in cocoa products (460‐610 mg/kg of flavanol monomers; 4‐5 g/kg of flavanol polymers) (Fernandez‐Murga 2011, Hammerstone 2000). Flavanol intake is, however, also dependent on serving size, and flavanol content depends on the processing of the cacao beans and raw cocoa.
Traditionally cocoa was consumed as a cold unsweetened drink of raw dried cacao powder, often mixed with starch and spices by the native Indians, but this was considered bitter and unpalatable for the early European explorers, including Christopher Columbus in 1502 and Hernando Cortes in 1519. The Spanish brought cocoa to Europe, to which sugar was added and the drink was heated (Lippi 2009, Dillinger 2000). Subsequent roasting (up to 120 °C), mixing (conching), alkalising (dutching), adding sugar, milk, vanilla and lecithin emulsifiers make chocolate as we know it today (Beckett 2008). Various chocolate manufacturers have fine‐tuned the processing leading to different flavours and smoothness of chocolates, but also to altered cocoa and flavanol content in various cocoa products.
Dark chocolate contains larger amounts of cocoa (50‐85%) than milk chocolate (20‐30%). Different processing procedures however influence the flavanol content of the cocoa in the chocolate; a 70% cocoa containing chocolate bar from one company therefore might not contain the same amount of flavanols and flavanol composition as a 70% chocolate bar from another company. Content and composition of flavanols depend on the variety and ripeness of cocoa beans used as well as the manufacturing steps.
Fresh and fermented cocoa beans contain about 10% of flavanols (100 mg/g), the cocoa powder consumed by the Kuna Indians contains about 3.6% of flavanols, and cocoa‐rich dark chocolate on the market about 0.5 % of flavanols (Chevaux 2001, Chaitman 2006). Moreover, heavy dutching, the alkalising of chocolate to pH 7‐8, can reduce the flavanol content to less than 10 mg per 100 g (0.001 %).
Furthermore, research suggests that the monomeric portion of cocoa flavanols, epicatechin and catechin and to a lesser extend the polymeric flavanols, the procyanidins, are linked to blood pressure and vasoactive effects (Schroeter 2006). Modern processing of cacao reduces the monomeric flavanol content and influences the epicatechin/catechin ratio (Payne 2010). Fresh and fermented cocoa beans contain between 2.5 to 16.5 mg of epicatechin per gram depending on the variety, the growing region and harvesting practices (Kim 1984, Wollgast 2000), whereas processed cocoa retains only 2‐18% of the original epicatechin, due to roasting and dutching (Payne 2010).
Due to the large variation in flavanol content in chocolate and cocoa products, it is critical to compare the dosages of flavanols rather than simply the amounts of chocolate or administered cocoa products in clinical trials investigating the effect of cocoa on blood pressure.
Description of the condition
Primary hypertension: systolic blood pressure (SBP) ≥ 140 or diastolic blood pressure (DBP) ≥ 90 mm Hg.
Prehypertension: SBP 120‐139 or DBP 80‐89 mm Hg.
Normotension: SBP < 120 or DBP < 80 mm Hg, secondary hypertension.
Description of the intervention
Flavanol‐rich chocolate and cocoa products compared with control (low‐flavanol products or placebo) consumed on a daily basis for two weeks or more.
How the intervention might work
The blood pressure lowering properties of cocoa have been linked to the formation of endothelial nitric oxide (NO) which promotes vasodilation and consequently lowers blood pressure. Increased NO production might be triggered by upregulation of NO‐synthase through the insulin‐mediated signalling pathway (Addison 2008). Insulin sensitivity was shown to be improved after cocoa intake in a number of trials (Davison 2008a; Grassi 2005a; Grassi 2008; Faridi 2008), but not in one (Muniyappa 2008). Secondly, cocoa flavanols have been shown to inhibit angiotensin converting enzyme (ACE) activity, and hence reduce blood pressure (Actis‐Goretta 2006, Persson 2011). Thirdly, there is evidence to suggest cocoa flavanols to have an indirect antioxidant effect within the cardiovascular system, upregulating NO‐synthase activity and hence reducing blood pressure (Keen 2005, Fraga 2011).
Why it is important to do this review
In the last decade, several clinical trials have investigated the effect of chocolate and cocoa products on blood pressure. This systematic review updates previous meta‐analyses by Taubert 2007a (including 5 trials), Desch 2010a (10 trials), and Ried 2010 (15 trials). In addition, we explored the influence of baseline blood pressure, flavanol dosage, duration, type of control, study design, age, body mass index, and trial quality on blood pressure outcome.
Objectives
To assess the effects of chocolate or cocoa products versus low‐flavanol products or placebo on blood pressure in adults with or without hypertension when consumed for 2 weeks or longer.
Methods
Criteria for considering studies for this review
Types of studies
Randomised controlled, parallel or crossover, single‐blind, double‐blind or open‐label trials of ≥ 14 days duration that reported the clinical mean or median ±SD (or ±SE) SBP or DBP at baseline, before and after intervention.
Types of participants
Adults with no further restrictions.
Types of interventions
Trials were included if the control group received a placebo or a minimal dose of flavanol‐containing cocoa product.
Minimal dose of cocoa accepted as control is defined as products containing ≤ 10% of the dose of cocoa polyphenols given as the active intervention product.
Trials in which the control dose exceeds 10% cocoa polyphenols of the active dose were excluded.
Trials testing isolated flavanols on blood pressure were excluded.
Trials with a very high attrition rate (loss‐to‐follow‐up > 50%) were excluded.
Types of outcome measures
Primary outcomes
Difference in systolic and diastolic blood pressure at final follow‐up between cocoa and control group and adjusted for baseline.
Secondary outcomes
-
Number of patients who withdrew due to adverse effects or intolerance.
-
Compliance/persistence rates.
-
Change in heart rate compared to control.
-
Cardiovascular and cerebrovascular events such as myocardial infarction and stroke.
-
Total adverse events.
-
Change in absolute cardiovascular risk compared to control as defined by the Australian Cardiovascular Risk Charts (NVDPA 2009).
Search methods for identification of studies
Electronic searches
We searched the following electronic databases from inception to November 2011:
The Database of Abstracts of Reviews of Effectiveness (DARE) and the Cochrane Database of Systematic Reviews were searched for related reviews.
The following electronic databases were searched for primary studies:
-
Cochrane Hypertension Group Specialised Register (1948‐November 2011), CENTRAL (2011, Issue 4), MEDLINE (1948‐November 2011), EMBASE (1980‐November 2011), and Food Science and Technology Abstracts (1969‐November 2011
-
International trial registries (clinicaltrials.gov; www.trialregister.nl; www.anzctr.org.au; www.controlled‐trials.com, www.apps.who.int/trialsearch/WHO clinical trials) were checked for unpublished but completed studies investigating chocolate/cocoa for blood pressure.
Electronic databases were searched using a strategy combining the Cochrane Highly Sensitive Search Strategy for identifying randomized trials in MEDLINE: sensitivity‐maximizing version (2008 revision) with selected MeSH terms and free text terms including cocoa, chocolate, blood pressure, and hypertension. No language restrictions were used. The MEDLINE search strategy (Appendix 1) was translated into the Hypertension Group Specialised Register (Appendix 2), CENTRAL (Appendix 3), EMBASE (Appendix 4), and Food Science and Technology Abstracts (Appendix 5) using the appropriate controlled vocabulary as applicable.
Searching other resources
-
Reference lists of all papers and relevant reviews were identified
-
Authors of relevant papers were contacted regarding any further published or unpublished work
-
ISI Web of Science was searched for papers which cite studies included in the review
Data collection and analysis
Selection of studies
Two reviewers independently assessed titles and abstracts of search results for relevant articles. Two independent reviewers critically appraised the full text of relevant articles according to the inclusion criteria listed above. Any discrepancies were resolved by discussion and in consultation with a third reviewer.
Data extraction and management
Two reviewers independently extracted data by using a standardized data extraction form and then cross‐checked. A statistician reviewer confirmed all numeric calculations and graphic interpolations.
Assessment of risk of bias in included studies
Two reviewers assessed the risk of bias for each trial by using the Cochrane Collaboration’s tool for assessing risk of bias. If there was evidence of heterogeneity between studies, results of studies at high or unclear risk of bias were compared with those of studies at low risk of bias by meta‐regression analysis.
Measures of treatment effect
Mean difference in SBP/DBP in mm Hg at final follow‐up adjusted for baseline differences. Precision of mean differences was calculated as standard deviation (SD) at final follow‐up.
When blood pressure measurements was reported in more than one position, the order of preference was: 1) sitting; 2) standing; and 3) supine.
When both clinical and ambulatory blood pressure measurements are available, the order of preference was: 1) clinical; 2) ambulatory.
Unit of analysis issues
If results are reported for several periods of follow‐up, the longest follow‐up from each study was selected for comparison to baseline.
In addition, if available, short‐term and medium‐term follow‐up was compared in separate analyses.
Dealing with missing data
We contacted the authors of studies with missing information on mean SBP/DBP and/or SD in intervention and control groups and asked them to provide the missing data.
If standard errors were given instead of standard deviations, we calculated standard deviations at one time point with the formula SD = SE x squareroot of n. We assumed a correlation of 0.68 between the final follow‐up SBP/DBP results for the two treatment arms in a crossover trial, similar to previous meta‐analyses by Taubert 2007a and Desch 2010a. We conducted sensitivity analyses with alternative correlation coefficients of 0.3 and 0.5.
If both standard deviations and standard errors were missing, we imputed standard deviations based on the information in the same trial or from other trials using the same intervention. We used the following hierarchy to impute standard deviation values:
-
standard deviation of blood pressure at end of treatment taken in a different position than that of the blood pressure data used
-
standard deviation of blood pressure at baseline
-
mean standard deviation of blood pressure at end of treatment from other trials using the same intervention
Assessment of heterogeneity
We assessed heterogeneity by I²‐statistic. We conducted univariate meta‐regression analyses using Stata version 12 to explore reasons for high heterogeneity in the pooled meta‐analysis of all studies. We tested the following variables: dosage of flavanols, type of chocolate (milk, dark), source of chocolate (company), duration, type of study design, baseline SBP or DBP, average body mass index (BMI), average age.
Assessment of reporting biases
We assessed small study effects by Begg’s funnel plots and Egger's test (Egger 1997).
Data synthesis
For each study, N, mean SBP/DBP, SD of intervention and control groups was entered into Cochrane Review Manager software. We used the random‐effects model. We used the generic inverse variance method to combine both parallel‐group and cross‐over trials.
Subgroup analysis and investigation of heterogeneity
A minimum number of four studies was required for subgroup analysis.
We performed the following subgroup analyses:
-
Baseline SBP ≥140 mm Hg versus SBP <140 mm Hg
-
Baseline DBP ≥80 mm Hg versus DBP <80 mm Hg
-
Double‐blind versus single‐blind trials
-
Industry‐sponsored versus non‐industry‐sponsored trials
-
Any variables tested in meta‐regression analysis indicating significant contribution to heterogeneity (e.g. parallel versus crossover trials)
Evidence of the differences found between subgroups was considered stronger when the variation of the mean effects in the different subgroups was higher, as measured by I2‐test for subgroup differences (e.g. I2 = 90% was considered more significant than I2 = 70%).
Sensitivity analysis
We tested the robustness of the results using the following sensitivity analyses:
-
Trials with control product containing ≤5% cocoa polyphenols of the product given to the active treatment group
-
Exclusion of trials using a unique study design compared to other trials (e.g. longer duration, active treatment with very low cocoa flavanol content)
-
Exclusion of trials with loss of follow up >20%
-
Exclusion of trials with poor compliance in >20% of participants
-
Using alternative correlation coefficients for cross‐over trials (r=0.3, r=0.5, r=0.68)
Results
Description of studies
Results of the search
The search strategy identified 136 potentially relevant publications and 3 unpublished studies in trial registries, of which 130 articles were retrieved from the Scopus database (PubMed and Embase) and 6 additional articles from reference lists of relevant reviews and published primary trials. Of 30 potentially relevant trials, 20 RCTs met the inclusion criteria for meta‐analysis (Figure 1).

Flow diagram.
Included studies
A total of 20 studies involving 856 participants were included in the meta‐analysis (Characteristics of included studies and Table 1).
| Study | Study Design | Participants | Cocoa# Dosage; Brand | Cocoa product | Total Flavanols (mg)
| Epi‐/ catechin (mg) | Theobromine (mg) | Sugar | Duration | Baseline SBP (mm Hg) | Baseline DBP (mm Hg) | Age; BMI |
| Cocoa / Control group | ||||||||||||
| Taubert 03 | C | 13/13 | 100g bar; Rittersport Halbbitter, D | 50% DC/WC | 500/0 | 89/0 | 560/0 | 49 | 2 weeks | 153.3/153.6 | 84.5/84.2 | 59.5 yrs; 24.1 |
| Murphy 03 | P | 13/15 | 6 tablets; Cocoapro Mars, US | HiFl/LoFl tablets | 234/6.4 | ‐ | ‐ | 0 | 4 weeks | 118/116 | 78/76 | 43.5 yrs; 26.0 |
| Engler 04 | P | 11/10 | 46g bar; Dove Mars, US | HiFl/LoFl DC | 213/0 | 46/0 | ‐ | 15 | 2 weeks | 121/112.8 | 68.1/66.1 | 32.1 yrs; 22.6 |
| Fraga 05 | C | 14/14 | 105g M&M confectionary Mars, US | 16% MC/WC | 168/0 | 39/0 | 179/0 | 57 | 2 weeks | 123/123 | 72/71 | 18.0 yrs; 24.1 |
| Grassi 05a | C | 15/15 | 100g bar; Rittersport, D | 50% DC/WC | 500/0 | 89/0 | 560/0 | 49 | 2 weeks | 112.9/113.2 | 74/73.8 | 33.9 yrs; 22.6 |
| Grassi 05b | C | 20/20 | 100g bar; Rittersport, D | 50% DC/WC | 500/0 | 89/0 | 560/0 | 49 | 2 weeks | 141.3/141.1 | 92.4/91.8 | 43.7 yrs; 25.4 |
| Taubert 07 | P | 22/22 | 6.3g bar; Rittersport, D | 50% DC/WC | 30/0 | 7.1/0 | 26.4/0 | 3 | 18 weeks | 147.7/147.5 | 86.4/86.7 | 63.6 yrs; 24.0 |
| Crews 08 | P | 45/45 | 37g bar + 12g powder; Hershey, US | HiFl/LoFl bar & drink | 755/41 | ‐ | ‐ | 15 | 6 weeks | 126.8/128.6 | 74.2/75 | 68.8 yrs; 25.3 |
| Grassi 08 | C | 19/19 | 100g bar; Cuorenero, Ital | 90% DC/WC | 1080/0 | 150/0 | 170/0 | 0 | 2 weeks | 141.1/140.9 | 91.2/91.1 | 44.8 yrs; 26.5 |
| Muniyappa 08 | C | 20/20 | 62g powder; CocoaPro Mars, US | HiFl/LoFl drink | 902/28 | 236/10 | 674/654 | 17 | 2 weeks | 141/141 | 91/91 | 51.0 yrs; 33.2 |
| Davison 08a | P | 12/11 | powder; Mars, US | HiFl/LoFl drink | 902/36 | ‐ | 337/327 | 9.4 | 12 weeks | 124/124 | 76/77 | 44.9 yrs; 33.6 |
| Davison 08b | P | 13/13 | powder; Mars, US | HiFl/LoFl drink | 902/36 | ‐ | 337/327 | 9.4 | 12 weeks | 126/121 | 78/74 | 45.4 yrs; 33.3 |
| Al‐Faris 08 | P | 30/29 | 100g bar; Galaxy/Dove Mars, US
| 50% DC/WC | 500/0 | 10.6/0 | ‐ | 59 | 2 weeks | 115.9/115.2 | 73/72.8 | 21.3 yrs; 22 |
| Shiina 09 | P | 20/19 | 45g bar; Meiji, Jpn | 80% DC/WC | 550/0 | ‐ | ‐ | 9 | 2 weeks | 116.4/121.6 | 64.7/72.2 | 29.8 yrs; 22.6
|
| Ried 09 | P | 11/10 | 50g bar Haighs, AUS | 70% DC/placebo pill | 750/0 | ‐ | ‐ | 15 | 8 weeks | 135/135.7 | 83.6/77.8 | 53.1 yrs; 26.6 |
| Monagas 09 | C | 42/42 | 40g powder; Nutrexpa, Spain | HiFl/0 in milk | 495/0 | 56.5/0 | 440/0 | 26 | 4 weeks | 138/138 | 84/84 | 69.7 yrs; 27.6 |
| Bogaard 10 | C | 41/41 | 3.6 g powder; Aticoa, Barry Callebaut, Belg | HiFl/LoFl drink
| 529/0 | 38/0 | 543/0
| 1 | 3 weeks | 141.7/141.7 | 84.2/84.2 | 62.0 yrs; 25.9 |
| Heiss 10 | C | 16/16 | powder Cocoapro, Mars, US | HiFl/LoFl drink in milk or water | 750/18 | 130/6 | 186/192 | 8.6 | 4 weeks | 132/131 | ‐ | 64.0 yrs; 27.8 |
| Desch 10 | P | 43/48 | 25g/6g bar; Rittersport, D | 50% DC/DC | 125/30 | 29.5/7.1 | 110/26.4 | 13 | 12 weeks | 135.7/134.3 | 79.3/75.8 | 66.0 yrs; 28.1 |
| Davison 10 | p | 13/14 | 174g powder; Mars, US | HiFl/LoFl drink | 1052/33 | 266/12 | 460.5/ 402.2 | 17.7 | 6 weeks | 143/145.4 | 83.2/88 | 56.6 yrs; 29.3 |
| Njike 11 | C | 38/38 | 22g powder; Hershey, US | HiFl/LoFl drink | 805/9 | 69/0 | 436/0 | 46 | 6 weeks | 123.3/123.6 | 68.5/67.3 | 52.2 yrs; 30.3 |
Summary of included studies: Nine studies used commercially available chocolate and 11 studies used flavanol‐rich cocoa powder (tablet, bar, or powder mixed with water or milk) and compared the effect to a control group, which either took flavanol‐free placebo (white chocolate, milk or placebo pill) or low‐flavanol powder, respectively.The active intervention group received either dark chocolate of 3.6‐105 g (6 g are equal to one piece of a 100 g dark chocolate bar) containing 50‐90% cocoa, milk‐chocolate based confectionary (105 g of < 10% cocoa) or flavanol‐enriched cocoa powder, containing a dosage of 30‐1080 mg (mean = 545.5 mg) of flavanols per day. Trials ran between 2 weeks and 18 weeks.
Excluded studies
We excluded 10 trials reported in 11 articles from our meta‐analysis because studies investigated the acute effects within two hours after cocoa ingestion (n=3), studies administered a high dosage of flavanol‐rich cocoa to both active and control groups (> 5% of active dosage) (n=3), data required for meta‐analysis was not available (n=2), the trial was of low quality (n=1), or the same population had been studied as in another trial included in our meta‐analysis. See Characteristics of excluded studies table.
We excluded three unpublished trials identified in trial registries, because two were not completed at time of meta‐analysis (Giraldo Restrepo ML 2010; Reutens A & Shaw J 2008) and one was completed but data were not available (Poulter 2007).
Risk of bias in included studies
Risk of bias is summarised in Figure 2.

Risk of bias summary: review authors' judgements about each risk of bias item for each included study.
Allocation
Nine trials described adequate allocation concealment (Bogaard 2010; Crews 2008; Davison 2010; Fraga 2005; Grassi 2008; Monagas 2009; Muniyappa 2008; Ried 2009; Taubert 2007). Eleven trials provided insufficient information regarding allocation concealment (Al‐Faris 2008; Davison 2008a; Davison 2008b; Engler 2004; Grassi 2005a; Grassi 2005b; Heiss 2010; Murphy 2003; Njike 2011; Shiina 2009; Taubert 2003).
Blinding
Nine trials included in our review compared the cocoa group with unblinded controls using commercially available white chocolate, or only milk or water (Al‐Faris 2008; Fraga 2005; Grassi 2005a; Grassi 2005b; Grassi 2008; Monagas 2009; Shiina 2009; Taubert 2003; Taubert 2007).
One trial compared the effect of dark chocolate or tomato extract capsules with placebo capsules on blood pressure. In this trial, blinding of the control group but not the dark chocolate group was assured, as participants in the control group did not know if they were allocated into an active or placebo capsule group (Ried 2009).
The ten trials using low‐flavanol cocoa products as the control aimed to facilitate ‘blinding’ or ‘masking’ of participants to minimise any expectation bias or placebo effect (Bogaard 2010; Crews 2008; Davison 2008a; Davison 2008b; Davison 2010; Engler 2004; Heiss 2010; Muniyappa 2008; Murphy 2003; Njike 2011). In addition, other energy and nutrient components in the high‐ versus low‐flavanol trial products were matched to eliminate other potential confounding factors. However, the masked control products used in nine of the eleven trials contained small but potentially sufficient amounts of flavanols to influence a vascular response and blood pressure change. Only two trials used a blinded design with flavanol‐free control groups (Engler 2004, Bogaard 2010). Sensitivity analysis of blinded trials versus unblinded (open‐label) trials confirmed the results of our subgroup meta‐analyses by flavanol‐content of the control group (flavanol‐free versus low‐flavanol) as described above.
Incomplete outcome data
All but two trials (Davison 2008b; Muniyappa 2008) had less than 20% attrition.
Selective reporting
None of the trials were biased due to selective reporting.
Other potential sources of bias
We considered influence of funding source a potential bias. We conducted subgroup analysis of industry‐sponsored versus non‐industry sponsored trials. Three trials were excluded in this subgroup analysis, as the involvement of the funding body was unclear (Al‐Faris 2008; Grassi 2005a; Grassi 2005b).
There was evidence of some publication bias (Figure 3; Figure 4), although this was not statistically significant by Egger's test (p=0.081 for SBP, p=0.105 for DBP).
Effects of interventions
See: Summary of findings for the main comparison Flavanol‐rich cocoa products for blood pressure
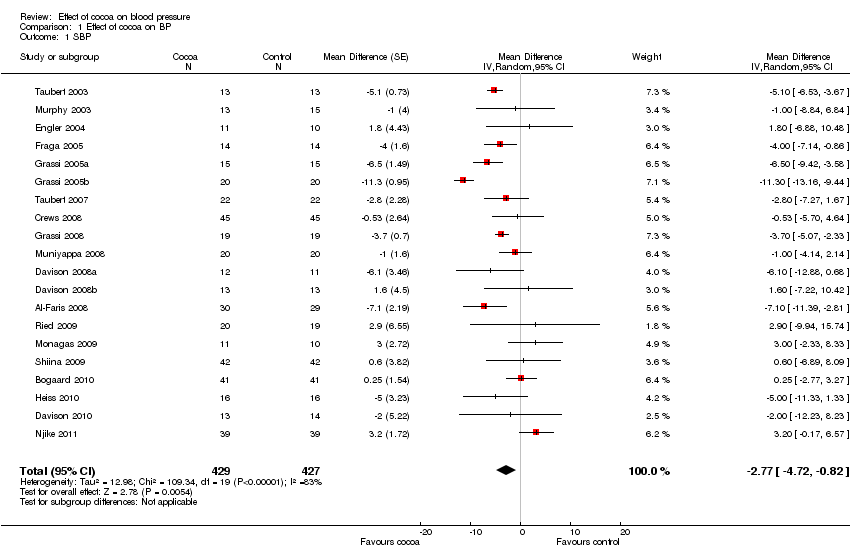
Meta‐analysis of all 20 studies revealed a significant blood pressure reducing effect of flavanol‐rich cocoa products compared with control.
Mean difference SBP (95%CI): ‐2.77 (‐4.72, ‐0.82) mm Hg, p=0.005, n=20;
mean difference DBP (95%CI): ‐ 2.20 (‐3.46, ‐0.93) mm Hg, p=0.006, n=19 available for DBP.
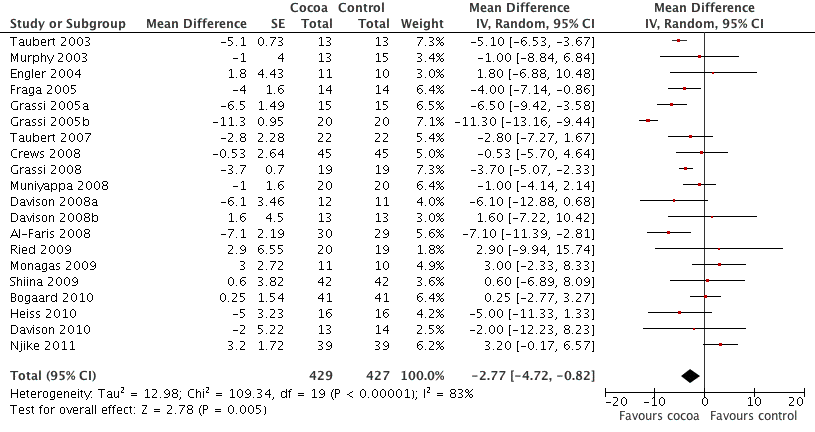
Forest plot of comparison: 1 Effect of cocoa on BP, outcome: 1.1 SBP.

Forest plot of comparison: 1 Effect of cocoa on BP, outcome: 1.2 DBP.
Dosage of total flavanols
Dosage of flavanol content was determined by two common standardised methods (Adamson 1999; Singleton 1965). We are reasonably confident that flavanol dosages are comparable.
Trials provided participants with 30‐1080 mg of flavanols (mean=545.5 mg) in 3.6‐105 g of cocoa products per day. In half of the trials (n= 10) the active group consumed 500‐750 mg of flavanols per day. The active group consumed less than 250 mg per day in four studies, and more than 750 mg per day in six studies. The control group received either a flavanol‐free product (n=12) or a low‐flavanol cocoa powder (n=8). Flavanol dosage of low‐flavanol products ranged between 6.4 and 41 mg per day (Table 1).
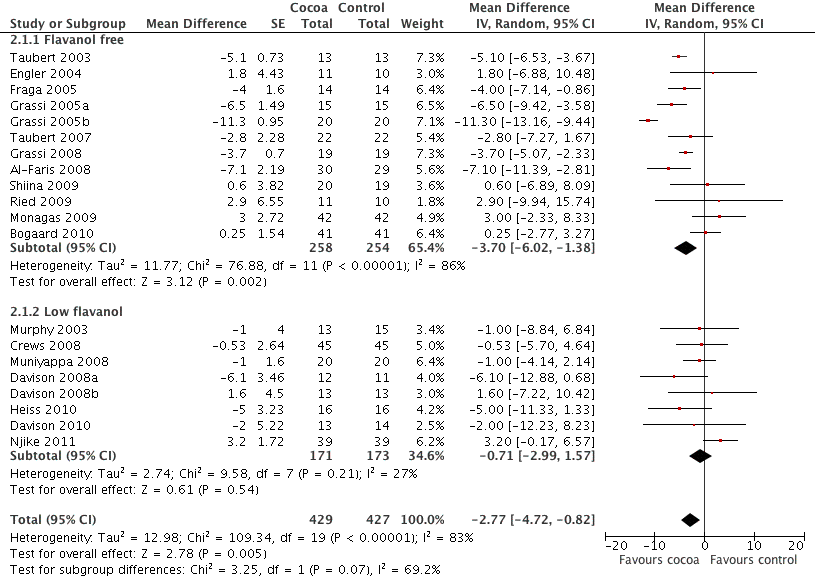
Total flavanol content in the active treatment group was not significantly associated with blood pressure change. However, if we distinguished between studies which had a true control group with no flavanol intake versus control groups consuming low‐flavanol products, we found a significant difference in effect between these groups.
Meta‐analysis of trials with true (flavanol free) control groups revealed a significant blood pressure reducing effect:
mean difference SBP (95% CI): ‐3.70 (‐6.02, ‐1.36) mm Hg, p=0.002, n=12;
mean difference DBP (95% CI): ‐2.71 (4.26, ‐1.5) mm Hg, p<0.001, n=11.
In contrast, there was no significant difference between treatment and control groups of trials using a low‐flavanol product in the control group:
mean difference SBP (95% CI): ‐0.71 (‐2.99, 1.57) mm Hg, p=0.54, n=8;
mean difference DBP (95% CI): ‐0.78 (‐2.26, 0.70) mm Hg, p=0.30, n=7.
The test for subgroup differences (flavanol free trials compared with low flavanol trials) provided moderate confidence that there is a genuine difference between the groups: SBP/DBP: I2=69.2%/67.5%.
Four of the eight trials using low‐flavanol control groups received higher or similar dosages of flavanols (Crews 2008,Davison 2008a, Davison 2008b, Davison 2010) than the active intervention group in the trial by Taubert 2007 which used a flavanol‐free control group.
Forest plot of comparison: 2 Flavanol free or low flavanol control, outcome: 2.1 SBP.

Forest plot of comparison: 2 Flavanol free or low flavanol control, outcome: 2.2 DBP.
Blinding
The ten trials using low‐flavanol cocoa products as control aimed to facilitate 'blinding' or 'masking' of participants to minimise any expectation bias or placebo effect. In addition, other energy and nutrient component in the high‐ versus low‐flavanol trial products were matched to eliminate other potential confounding factors. However, the masked control products used in eight of the ten trials contained small but potentially sufficient amounts of flavanols to influence a vascular response and blood pressure change. Only two trials used a blinded design with flavanol‐free control groups (Engler 2004, Bogaard 2010). Sensitivity analysis of blinded trials versus unblinded (open‐label) trials confirmed the results of our subgroup analysis by flavanol‐content in the control group (flavanol‐free versus low‐flavanol) as described above.
Dosage of flavanol monomers: epicatechin and catechin
Fourteen out of the 20 trials measured the proportion of monomeric flavanols. Dosage of epicatechin and catechin ranged between 7 to 236 mg per day in the intervention group, and 6‐12 mg in three control groups. We did not find an association between monomeric flavanol dosage and blood pressure change using meta‐regression analysis.
Baseline blood pressure ‐ hypertensive, prehypertensive, normotensive
Our previous meta‐analysis revealed a difference in effect of cocoa products on blood pressure dependent on hypertension status at baseline. While blood pressure was significantly lowered in people with systolic hypertension (≥ 140 mm Hg) or diastolic prehypertension (≥ 80 mm Hg), no significant effect of cocoa on people with normal blood pressure (120/80 mm Hg) was evident (Ried 2010).
The inclusion of five additional trials in this meta‐analysis provided a similar result.
A significant blood pressure lowering effect was evident in the hypertensive subgroup (> 140 mm Hg) but not for SBP < 140 mm Hg at baseline:
Hypertensive subgroup: mean SBP difference (95%CI): ‐3.99 (‐7.02, ‐0.97) mmHg, p=0.01;
Normotensive subgroup: mean SBP difference (95%CI): ‐2.04 (‐4.64, 0.57) mm Hg, p=0.13.
However, the separation into the two subgroups (hypertensive and normotensive) was not supported by the test for subgroup differences (I2=0%).
A significant blood pressure lowering effect was evident independent of baseline diastolic blood pressure.
Theobromine
The theobromine content of cacao products, measured with standardised HPLC methodology (Naik 2001) and reported in a selection of studies included in our meta‐analysis (n=15), ranged between 0.17‐27.2 g per 100 g, with a daily dosage intake of participants between 26 to 979 mg of theobromine. Our meta‐regression analysis indicated theobromine not to be associated with the effect of cocoa on blood pressure.
Sugar content
Commercially available milk chocolate contains about 50% of sucrose (range 45‐65 g per 100 g), and dark chocolate about 30% sugar (range 13‐45%). Chocolate and cocoa products tested in the studies included in our review contained between zero and 80% of sugar. One study compared the effect of 80% sugar with sugar‐free cocoa powder on blood pressure and endothelial function (Njike 2011). A larger beneficial effect on endothelial function was observed with sugar‐free cocoa powder compared with sugared cocoa powder (Akbari 1998).
Our meta‐analysis indicated a larger beneficial effect on blood pressure if test products contained low amounts of sugar (< 10 g/day) (n=6). The beneficial effect of cocoa products with low sugar content was even more pronounced in overweight and obese individuals (BMI > 25) (n=8). Meta‐regression analysis indicated an association between sugar content and effect size to be of borderline significance Table 2.
|
| Variable | Number of studies | Regression coefficient | P‐value |
| SBP | Blinded or non‐blinded control group | 20 | 3.9952 | 0.031 |
|
| Sugar dosage (continuous) | 20 | ‐0.0794 | 0.079 |
|
| Duration: 2 weeks or >2 weeks | 20 | 4.4342 | 0.016 |
|
|
|
|
|
|
| DBP | Blinded or non‐blinded control group | 19 | 3.272 | 0.005 |
|
| Sugar dosage (continuous) | 19 | ‐0.0569 | 0.052 |
|
| Duration: 2 weeks or >2 weeks | 19 | 2.3324 | 0.055 |
|
| Age (continuous) | 19 | 0.0870 | 0.029 |
|
| <10g sugar in cocoa/day, BMI>25 | >10g sugar in cocoa/day, BMI>25 |
| Mean difference SBP (95% CI) | ‐2.52 (‐4.74,‐0.31) mm Hg, p=0.03 | ‐1.12 (‐7.08, 4.85) mm Hg, p=0.71 |
| Mean difference DBP (95% CI) | ‐2.34 (‐4.19, ‐0.50) mm Hg, p=0.01 | ‐1.32 (‐4.70, 2.06) mm Hg, p=0.45 |
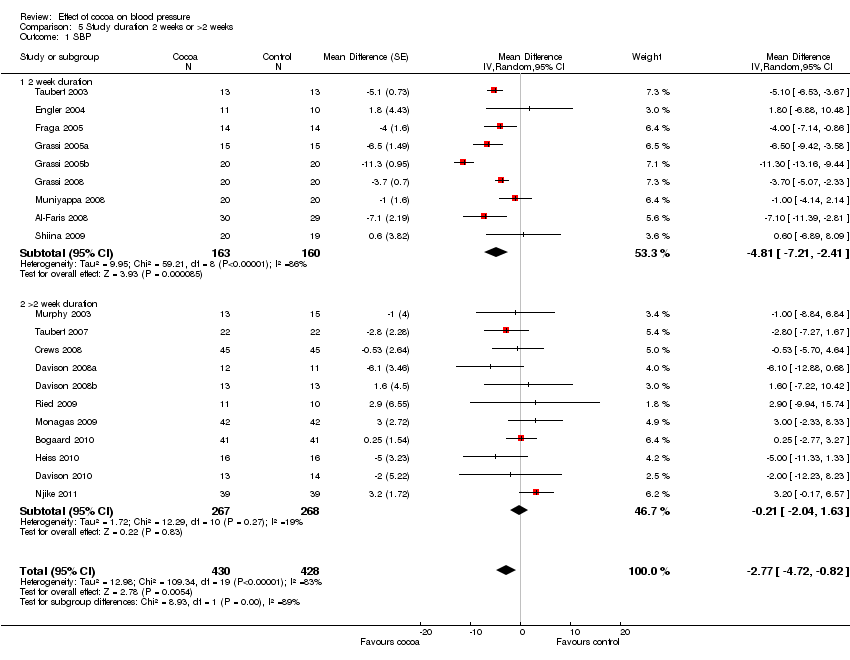
Duration
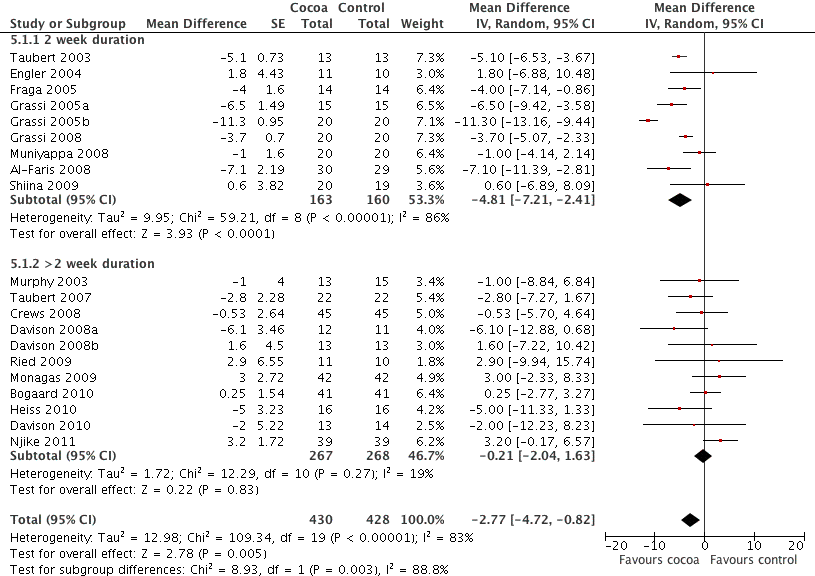
Just under half of the included studies (n=9 out of 20) were of 2 weeks duration. A further eight trials studied participants for 3 to 8 weeks, and one trial followed participants for 18 weeks. However, the longest study gave participants the smallest dose of chocolate (6 g of 50% cocoa chocolate containing 30 mg of flavanols (Taubert 2007).
Meta‐analysis of trials of 2 weeks duration revealed a significant blood pressure lowering effect:
mean SBP difference (95%CI): ‐4.81 (‐7.21, ‐2.41) mm Hg, p<0.001, n=9;
mean DBP difference (95% CI): ‐3.19 (‐5.00, ‐1.38) mm Hg, p=0.0006, n=9
In contrast, meta‐analysis of longer‐term trials (> 2 weeks) obliterated the blood pressure lowering effect of cocoa:
mean SBP difference (95%CI): ‐0.21 (‐2.04, 1.63) mm Hg, p=0.83,n=11;
mean DBP difference (95% CI): ‐0.99 (‐2.01, 0.03) mm Hg, p=0.06, n=10.
Test for subgroup difference (SBP/DBP): I2=88.8%/76.8% (strong indication for genuine difference).
It is important to note that seven out of the nine trials (78%) of 2 weeks duration also had a flavanol‐free control group, therefore this subgroup analysis by duration might be confounded by flavanol dosage used in the control groups, and the level of blinding of participants.
Furthermore, six out of the seven 2‐week trials asked participants to consume a large amount of chocolate per day (1 bar = 100 g).

Forest plot of comparison: 7 Study duration 2 weeks or >2 weeks, outcome: 7.1 SBP.

Forest plot of comparison: 7 Study duration 2 weeks or >2 weeks, outcome: 7.2 DBP.
Age
Our meta‐analysis indicated that the effect of cocoa on blood pressure was attenuated with increasing age. While cocoa had a significant blood pressure lowering effect in trials with younger participants (mean age < 50 years, mean age range 18‐45.4 yrs), we did not find a significant difference between treatment and control groups of trials with older participants (mean age > 50 years, mean age range 51‐69.7 yrs). This effect was more pronounced if we compared trials of participants with a mean age of less than 50 years versus more than 50 years.
|
| < 50yrs | > 50yrs |
| Mean difference SBP (95% CI) | ‐4.57 (7.41, ‐1.73) mm Hg, p=0.002, n=10 | ‐0.96 (‐3.44, 1.52) mm Hg, p=0.45, n=10 |
| Mean difference DBP (95% CI) | ‐3.85 (‐5.45, ‐2.26) mm Hg, p<0.001, n=9 | ‐0.89 (‐1.80, 0.01) mm Hg, p=0.05, n=10 |
Test for subgroup differences (SBP/DBP): I2=71.5%/90.1% (good indication for genuine difference).
Industry funding
Results of these subgroup analyses need to be interpreted with caution, as results are likely confounded by other variables, e.g. flavanol‐free versus low‐flavanol control group.
Geographical location
Subgroup analysis by geographical location was not meaningful, as 5 of the 7 trials conducted in Europe were done by two research groups (Grassi 2005a; Grassi 2005b; Grassi 2008; Taubert 2003; Taubert 2007), which might have introduced some bias.There was only one trial conducted in Japan (Shiina 2009), and one in the Middle East (Al‐Faris 2008). The remainder were conducted in the USA (n=7), and Australia (n=4, with 3 trials conducted by the same research group, Davison 2008a; Davison 2008b; Davison 2010). We considered other variables to be more meaningful for subgroup analyses.
Meta‐regression analyses
Meta‐regression analyses supported choice of variables for subgroup analyses (Table 2).
Sensitivity analyses
Table 3 summarises results of sensitivity analyses.
| Sensitivity analyses
| Comparison | Mean difference (95% CI) | p‐value | I2 | I2 before sensitivity analysis |
| Excluding Grassi 2005b | SBP all | ‐2.33 (‐3.83,‐0.83) | 0.002 | 63% | 83% |
|
| DBP all | ‐1.90 (‐2.88, ‐0.92) | 0.0001 | 44% | 70% |
|
| SBP flavanol‐free subgroup | ‐3.20 (‐4.84, ‐1.56) | 0.0001 | 62% | 86% |
|
| DBP flavanol‐free subgroup | ‐2.29 (‐3.49, ‐1.09) | 0.0002 | 54% | 77% |
|
| SBP hypertensive subgroup | ‐2.84 (‐4.61, ‐1.07) | 0.002 | 63% | 91% |
|
| DBP hypertensive subgroup | ‐1.76 (‐3.09, ‐0.44) | 0.009 | 50% | 85% |
|
| SBP sugar > 10g, BMI > 25 subgroup | 0.95 (‐0.95, 2.85) | 0.33 | 0% | 93% |
|
| DBP sugar > 10g, BMI > 25 subgroup | 0.04 (‐1.42, 1.50) | 0.96 | 0% | 86% |
|
| SBP 2 weeks subgroup | ‐4.12 (‐5.53, ‐2.70) | <0.0001 | 48% | 86% |
|
| DBP 2 weeks subgroup | ‐2.68 (‐4.14, ‐1.22) | 0.0003 | 56% | 77% |
|
| SBP <50 yrs age subgroup | ‐4.33 (‐5.87, ‐2.79) | <0.0001 | 23% | 84% |
|
| DBP <50 yrs age subgroup | ‐3.72 (‐4.70, ‐2.74) | <0.0001 | 0% | 60% |
| Excluding Taubert 2007 | SBP all | ‐2.75 (‐4.79, ‐0.72) | 0.008 | 83% | 83% |
| DBP all | ‐2.20 (‐3.55, ‐0.85) | 0.001 | 71% | 70% | |
| SBP flavanol‐free subgroup | ‐3.76 (‐6.22, ‐1.30) | 0.003 | 87% | 86% | |
| DBP flavanol‐free subgroup | ‐2.77 (‐4.47, ‐1.06) | 0.001 | 78% | 77% | |
| SBP hypertensive subgroup | ‐4.16 (‐7.48, ‐0.84) | 0.01 | 92% | 91% | |
| DBP hypertensive subgroup | ‐2.11 (‐3.58, ‐0.63) | 0.005 | 60% | 85% | |
| SBP >2 weeks subgroup | ‐0.20 (‐1.71, 2.12) | 0.83 | 15% | 19% | |
| DBP >2 weeks subgroup | ‐0.76 (‐1.90, 0.38) | 0.19 | 0% | 0% | |
| SBP >50 yrs age subgroup | ‐0.72 (‐3.48, 2.04) | 0.61 | 76% | 73% | |
| DBP >50 yrs age subgroup | ‐0.70 (‐1.69, 0.28) | 0.16 | 0% | 0% | |
|
|
|
|
|
|
|
| Excluding trials with loss‐of‐follow up/poor compliance > 20% (Muniyappa 2008, Davison 2008b) | SBP all | ‐3.03 (‐5.09, ‐0.97) | 0.004 | 83% | 83% |
|
| DBP all | ‐2.48 (‐3.78, ‐1.18) | 0.0002 | 70% | 70% |
|
| SBP low‐flavanol subgroup | ‐1.24 (‐4.59, 2.12) | 0.47 | 46% | 27% |
|
| DBP low‐flavanol subgroup | ‐1.39 (‐3.15, 0.37) | 0.12 | 0% | 0% |
|
| SBP hypertensive subgroup (–M8) | ‐4.52 (‐7.81, ‐1.22) | 0.007 | 92% | 91% |
|
| DBP hypertensive subgroup (‐M8) | ‐3.12 (‐5.31, ‐0.92) | 0.005 | 84% | 85% |
|
| SBP normotensive subgroup (–D8b) | ‐2.24 (‐4.95, 0.47) | 0.11 | 68% | 66% |
|
| DBP normotensive subgroup (‐D8b) | ‐2.32 (‐4.02, ‐0.62) | 0.007 | 52% | 47% |
|
| SBP sugar >10g, BMI > 25 subgroup (‐M8) | ‐1.07 (‐8.41, 6.26) | 0.77 | 94% | 93% |
|
| DBP sugar >10g, BMI > 25 subgroup (‐M8) | ‐1.74 (‐5.49, 2.00) | 0.36 | 86% | 86% |
|
| SBP sugar <10g, BMI > 25 subgroup (‐D8b) | ‐2.77 (‐5.07, ‐0.46) | 0.02 | 41% | 37% |
|
| DBP sugar <10g, BMI > 25 subgroup (‐D8b) | ‐2.55 (‐4.60, ‐0.49) | 0.02 | 55% | 45% |
|
| SBP 2 weeks subgroup (‐M8) | ‐5.35 (‐7.35, ‐2.85) | <0.0001 | 86% | 86% |
|
| DBP 2 weeks subgroup (‐M8) | ‐3.78 (‐5.50, ‐2.06) | <0.0001 | 73% | 77% |
|
| SBP >2 wks subgroup (‐D8b) | ‐0.35 (‐2.32, 1.63) | 0.73 | 26% | 19% |
|
| DBP >2 wks subgroup (‐D8b) | ‐1.01 (‐2.05, 0.02) | 0.06 | 0% | 0% |
|
| SBP <50 yrs age subgroup (‐D8b) | ‐5.46 (‐8.47, ‐2.45) | 0.0004 | 86% | 84% |
|
| DBP <50 yrs age subgroup (‐D8b) | ‐4.37 (‐5.94, ‐2.79) | <0.0001 | 60% | 60% |
|
| SBP >50 yrs age subgroup (‐M8) | ‐0.93 (‐3.79, 1.93) | 0.52 | 75% | 73% |
|
| DBP >50 yrs age subgroup (‐M8) | ‐1.06 (‐2.01, ‐0.12) | 0.03 | 0% | 0% |
| Using alternative correlation coefficients for cross‐over trials (main analysis: r=0.68) | SBP r=0.5 | ‐2.85 (‐4.76, ‐0.93) | 0.004 | 75% | 83% |
| SBP r=0.3 | ‐2.93 (‐4.82, ‐1.05) | 0.002 | 67.3% | 83% | |
| DBP r=0.5 | ‐2.23 (‐3.45, ‐1.00) | <0.0001 | 57.2% | 70% | |
| DBP r=0.3 | ‐2.24 (‐3.44, ‐1.05) | <0.0001 | 44.7% | 70% |
Heterogeneity was considerably reduced when we excluded the trial by Grassi 2005b, which did not overlap with most trials and could be considered an outlier. Effect sizes and significance (p‐values) of meta‐analyses did not change appreciably, therefore increasing robustness of outcomes and interpretation of results as described above.
Exclusion of the trial by Taubert 2007, which was of considerably longer duration (18 weeks) than other trials (2‐8 weeks, n=19) and provided participants in the active treatment group with a considerably lower flavanol dosage (30 mg/day) than other trials (125‐1080 mg/day, n=19), did not change effects sizes or heterogeneity appreciably.
Exclusion of two trials with higher attrition rates (Davison 2008b; Muniyappa 2008) ‐ we combined loss of follow up and compliance rate ‐ did not change results or heterogeneity appreciably.
Sensitivity analyses using alternative correlation coefficients for cross‐over trials (r=0.5 and r=0.3) instead of r=0.68 did not change results appreciably; however, as expected, heterogeneity was reduced.
Planned sensitivity analysis of trials with control product < 5% cocoa polyphenols of the product given to the active treatment group was dismissed, as we conducted a similar analysis when comparing trials using flavanol‐free versus low‐flavanol controls.
Summary of secondary outcomes
The following secondary outcomes of included studies are summarised in Table 4:
| Study | Study design
| Participants* Cocoa/ Control | Withdrawn Cocoa/Control | Adverse effects Cocoa/Control | Compliance rate
| Change in heart rate Mean (SD) |
| Taubert 03 | C | 13/13 | 0 | ‐ | 100% | Not significant |
| Murphy 03 | P | 13/15 | 3 | Family illness (2) Non‐compliance in final week (1) | 90% | ‐ |
| Engler 04 | P | 11/10 | 0 | ‐ | 100% | ‐ |
| Fraga 05 | C | 14/14 | 1 | no reason given | 96% | ‐ |
| Grassi 05a | C | 15/15 | 0 | ‐ | 100% | ‐ |
| Grassi 05b | C | 20/20 | 0 | ‐ | 100% | ‐ |
| Taubert 07 | P | 22/22 | 0 | ‐ | 100% | ‐ |
| Crews 08 | P | 45/45 | 6/5 | Gastrointestinal upset/headache/cold sweat (2/1) Bronchitis (1/0) Jitteriness/increased energy (1/0) Artrial arrhythmia/medication change (1/0) Distaste of study product (1/1) Family illness (0/1) Unspecified reason (0/1) No adherence to trial regimen (0/1) | 89% | Cocoa: 4.72 (7.93) Control: 0.33 (8.19) P= 0.007 |
| Grassi 08 | C | 19/19 | 0 | ‐ | 100% | ‐ |
| Muniyappa 08 | C | 20/20 | 5/4 | Loss‐to‐follow‐up (0/1) Discontinued intervention (4/2) due to intolerance to treatment, family emergencies, personal problems excluded from analysis (1/1) | 69% | ‐ |
| Davison 08a | P | 12/11 | 7 | Time restrictions, personal circumstances (14) Non‐compliance (exercise or diet) (2)
| 79% | Not significant |
| Davison 08b | P | 13/13 | 5 | 84% | Not significant | |
| Al‐Faris 08 | P | 30/29 | 0 | ‐ | 100% | Not significant |
| Shiina 09 | P | 20/19 | 0 | ‐ | 100% | Not significant |
| Ried 09 | P | 11/10 | 2/2 | Study product unpalatable (2/0) Gastrointestinal upset (0/1) Illness unrelated to study (0/1) | 84% | ‐ |
| Monagas 09 | C | 42/42 | 0 | Constipation (resolved with fibre intake) | 100% | Not significant |
| Bogaard 10 | C | 41/41 | 3 | Nausea (1) Headache (1) Arrythmia unrelated (1)
| 93% | ‐ |
| Heiss 10 | C | 16/16 | 3 | Did not come to first visit | 94% | Not significant |
| Davison 10 | P | 13/14 | 7 | Mild gastric symptoms (1) Non‐compliance to study protocol (1) Withdrew due to personal circumstances (5) | 88% | Not significant |
| Njike 11 | C | 38/38 | 7 | Non‐compliance to study protocol (1) Withdrew due to personal reasons (6)
| 84% | ‐ |
Number of patients who withdrew and reasons including adverse effects or intolerance:
Adverse effects were reported by 22 out of 429 (5%) patients in the active cocoa intervention group and 5 out of 427 (1%) patients in the control groups. Adverse effects included gastrointestinal complaints (cocoa/control: n=5/2), distaste of the trial product (n=3/1), headache (n=2/0), and jitteriness (n=1/0). The product with a high theobromine content in one trial (Bogaard 2010) had a laxative effect on (n=12/2) patients.
Compliance/persistence rates:
Nine of the 20 trials reported a 100% compliance rate, four trials reported compliance of >= 90%, five trials of >80%, and one trial of 79%, and one trial of 69%. For trials details refer to Table 4.
Change in heart rate compared to control:
Nine out of 20 trials investigated heart rate, 8 of these did not find a significant difference, and one reported a significantly higher heart rate in the cocoa treatment group compared with the control group (p=0.007) (Crews 2008).
None of the studies included in this review reported any cardiovascular and cerebrovascular events such as myocardial infarction and stroke, or change in absolute cardiovascular risk compared to control as defined by the Australian Cardiovascular Risk Charts.
Discussion
Summary of main results
Our meta‐analysis suggests chocolate or cocoa products to be more effective in reducing blood pressure compared with control:
Mean difference SBP (95%CI): ‐2.77 (‐4.72, ‐0.82) mm Hg, p=0.005, n=20;
mean difference DBP (95%CI): ‐ 2.20 (‐3.46, ‐0.93) mm Hg, p=0.0006, n=19.
Trials were generally of short duration (n=19: range 2‐8 weeks, one of 18 weeks) and the majority was conducted in healthy individuals. Heterogeneity was generally high. We explored reasons for heterogeneity in the following subgroup analyses.
Meta‐analysis of trials with flavanol‐free control groups revealed a significant blood pressure reducing effect, while no significant effect was found when pooling trials using a low‐flavanol product in the control group.
It is plausible that any differences found between the treatment and control groups were weakened in trials using high‐flavanol versus low‐flavanol products, as the low‐flavanol product may also have an effect on blood pressure. In fact, trials studying acute effects reported a sustained accumulative effect on vascular function when flavanols were taken daily over 1 or 3 weeks (Heiss 2007, Balzer 2008). In addition, one trial included in our review provided a small amount of daily dark versus white chocolate (6.3 g) over a 4‐month period and reported a cumulative effect on blood pressure at 6, 12 to 18 weeks, respectively (Taubert 2007): mean SBP (SD) difference of ‐0.5 (1.6), ‐2.0 (1.7), ‐2.8 (1.6) mm Hg; and mean DBP (SD) difference of ‐0.4 (1.5), ‐1.6 (1.0), ‐1.9 (1.5) mm Hg.
Subgroup meta‐analyses by baseline blood pressure revealed a more pronounced effect of cocoa in systolic hypertension, compared with systolic prehypertension or normotension. However, a differentiation into those groups was not supported by meta‐regression and test for subgroup differences. A significant blood pressure lowering effect of cocoa was evident in diastolic blood pressure independent of status at baseline.
It has been suggested that theobromine found in cocoa might be indicative for vasoactivity and thus blood pressure reduction of cocoa products (Kelly 2005) However, we did not find an association between theobromine content in cocoa and blood pressure. Theobromine is the bitter alkaloid of the cacao plant, and also found in other plants, such as tea and the cola nut. Other similar compounds, the methylxanthines include caffeine in coffee.
It is questionable whether the chocolate and cocoa products are palatable if large amounts of the bitter theobromine are included. In addition, very high dosages of theobromine might have side effects in humans. While some animals, such as dogs, might succumb to theobromine poisoning from as little as 50 g of chocolate for a smaller dog and 400 g for an average‐sized dog due to slow metabolism of theobromine (Strachan 1994), it is estimated that a 60 kg human would need to consume about 4.5 kg of dark chocolate with natural containing theobromine to be poisoned (Rusconi 2010). However, theobromine‐enriched cocoa powder containing about 30 times more theobromine than commercial chocolate has been used in small quantities in a trial included in this review (Bogaard 2010). Adverse effects of such theobromine‐enriched cocoa might be expected by intake of only 150 grams.
We found a larger beneficial effect of cocoa on blood pressure if the test products contained only low amounts of sugar (< 10 g/day). The beneficial effect of cocoa products with low sugar content was even more pronounced in overweight and obese individuals ( BMI > 25). A high sugar load might reduce micro‐ and macrocirculation in the arteries due to acute hyperglycemia (Akbari 1998).
While we did not identify Body Mass Index (BMI) to be a predicting variable for the effect of cocoa on blood pressure, if viewed in combination with sugar intake the differences in effect could be explained by an increased insulin‐resistance often associated with higher BMI. Fat accumulation in skeletal muscle disrupts the insulin‐mediated signalling pathway, causing higher levels of insulin and elevation of blood pressure (Addison 2008).
While we found a difference in the effect of 2‐week long trials compared with longer trials, it is possible that this subgroup analysis by duration was confounded by the fact that the majority of trials with a flavanol‐free control group were also of two weeks duration. Furthermore, several 2‐week trials asked participants to consume a large amount of chocolate per day (1 bar = 100 g). This might be impractical in the long‐term and might cause some unwanted side effects such as weight gain. Therefore, while shorter term trials appear more effective, meta‐analysis results by duration should be interpreted cautiously.
We found cocoa to be more effective in reducing blood pressure in younger individuals (mean age range 18‐45.4 yrs) in the short term trials compared with older individuals (mean age range 51‐69.7 yrs). The age‐ related effect might be associated with the structural and biochemical changes in the arterial wall apparent with aging (O'Rourke 1990) and subsequent vascular reactivity to stimuli. Age‐related changes include arterial stiffening in association with decrease of elastin, and increase of collagen and glycosaminglycans (O'Rourke 1990). In addition, endothelin‐1, a potent vasoconstrictor protein is elevated in older adults (Donato 2009) and endothelial oxidative stress compromising NO availability is more pronounced in the elderly (Taddei 2001). Cocoa flavanols have been shown to reduce vascular resistance, arterial stiffness, endothelin‐1 and are potent scavengers of free radicals (Schroeter 2006, Loke 2008) leading to improved vascular function.
In the short‐term studies included in our review, the effect of cocoa on blood pressure might be more pronounced in younger individuals due to the age‐related decrease of vascular reactivity to physiological stimuli such as cocoa flavanols.
Overall completeness and applicability of evidence
Data were available for the majority of identified trials fitting the inclusion criteria (n=20). Two trials were excluded due to lack of data (Balzer 2008; Farouque 2006). Most trials studied healthy subjects with or without elevated blood pressure (n=18). One trial (Heiss 2010) included subjects with coronary artery disease, and one trial assessed individuals with impaired glucose tolerance (Grassi 2008). Therefore, our findings are applicable largely to healthy adults with or without hypertension. Our review included all types of cocoa products. Six out of 20 included trials did not report on epicatechin content of the cocoa product, and six out of 20 did not report on theobromine content, therefore limiting conclusions of meta‐regression analysis of these two variables.
Our meta‐analysis contributes to the evidence of flavanol‐rich cocoa products to benefit cardiovascular health, albeit the effect of cocoa on blood pressure overall appears to be modest. No long‐term trials investigating the effect of cocoa products on clinical outcomes are available to draw conclusions on the effect of cocoa on cardiovascular events or long‐term adverse effects.
Quality of the evidence
A sufficient number of trials (n=20) and a reasonably large sample size (n=856) was available to generate meaningful meta‐analysis and allowed several subgroup analyses. Subgroup analyses were supported by meta‐regression analyses and explored heterogeneity. Due to high heterogeneity, insufficient evidence on adequate allocation concealment in 55% of trials, single‐blinding in 45% of trials, and some publication bias, the quality of the evidence is considered low (summary of findings Table for the main comparison). Further research is very likely to have an important impact on our confidence in the estimate of the effect and is likely to change the estimate. However, remaining high heterogeneity in selected subgroups was reduced considerably by exclusion of one trial (Grassi 2005b), therefore increasing robustness of results. Sensitivity analyses excluding Grassi 2005b did not change effect sizes appreciably.
Subgroup analyses by age, BMI, and hypertension status at baseline might be subject to ecological bias. The effect found between studies might not hold within studies. However, individual patient data was not available.
Potential biases in the review process
A strength of this review is the comprehensive literature search including several databases, trial registries and reference lists of included trials. While we were able to obtain unpublished data from authors of three trials for inclusion, we had to exclude two trials due to lack of data. We followed the Cochrane Handbook for analysis of the data.
Agreements and disagreements with other studies or reviews
Our meta‐analysis suggests chocolate or cocoa products to be more effective in reducing blood pressure compared with control:
Mean difference SBP (95%CI): ‐2.77 (‐4.72, ‐0.82) mm Hg, p=0.005, n=20;
mean difference DBP (95%CI): ‐ 2.20 (‐3.46, ‐0.93) mm Hg, p=0.006, n=19 available for DBP.
Albeit significant, the reduction in systolic blood pressure weakened with increasing number of studies compared to previous meta‐analyses:
a) Ried 2010 (15 trials): mean difference SBP (95%CI): ‐3.16 (‐5.08, ‐1.23) mm Hg, p=0.001;
b) Desch 2010a (10 trials): mean difference SBP (95%CI): ‐4.52 (‐5.87, ‐3.16) mm Hg, p<001; and
c) Taubert 2007a (5 trials): mean difference SBP (95%CI): ‐4.7 (‐7.6, ‐1.8) mm Hg, p=0.002.
Overall reduction in diastolic blood pressure in our updated meta‐analysis is also a little smaller than reported in earlier meta‐analyses:
a) Ried 2010 (15 trials): mean difference DBP (95%CI): ‐2.02 (‐3.35, 0.69) mm Hg, p=0.003;
b) Desch 2010a (10 trials): mean difference DBP (95%CI): ‐2.5 (‐3.9, 1.2) mm Hg, p<0.001; and
c) Taubert 2007a (5 trials): mean difference DBP (95% CI): ‐2.8 (‐4.8, ‐0.8) mm Hg, p=0.006.


Risk of bias summary: review authors' judgements about each risk of bias item for each included study.

Forest plot of comparison: 1 Effect of cocoa on BP, outcome: 1.1 SBP.

Forest plot of comparison: 1 Effect of cocoa on BP, outcome: 1.2 DBP.

Forest plot of comparison: 2 Flavanol free or low flavanol control, outcome: 2.1 SBP.

Forest plot of comparison: 2 Flavanol free or low flavanol control, outcome: 2.2 DBP.
Forest plot of comparison: 7 Study duration 2 weeks or >2 weeks, outcome: 7.1 SBP.

Forest plot of comparison: 7 Study duration 2 weeks or >2 weeks, outcome: 7.2 DBP.
Comparison 1 Effect of cocoa on BP, Outcome 1 SBP.
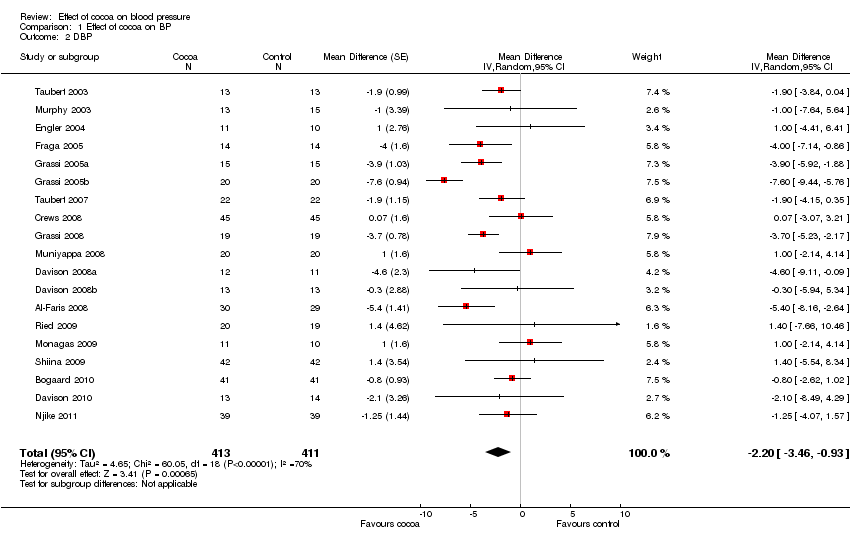
Comparison 1 Effect of cocoa on BP, Outcome 2 DBP.

Comparison 2 Flavanol free or low flavanol control, Outcome 1 SBP.

Comparison 2 Flavanol free or low flavanol control, Outcome 2 DBP.

Comparison 3 Hypertensive or normotensive subjects, Outcome 1 SBP.

Comparison 3 Hypertensive or normotensive subjects, Outcome 2 DBP.

Comparison 4 <10g or >10g sugar in cocoa/day with BMI >25, Outcome 1 SBP.

Comparison 4 <10g or >10g sugar in cocoa/day with BMI >25, Outcome 2 DBP.
Comparison 5 Study duration 2 weeks or >2 weeks, Outcome 1 SBP.

Comparison 5 Study duration 2 weeks or >2 weeks, Outcome 2 DBP.

Comparison 6 Subjects >50 or <50 years old, Outcome 1 SBP.

Comparison 6 Subjects >50 or <50 years old, Outcome 2 DBP.
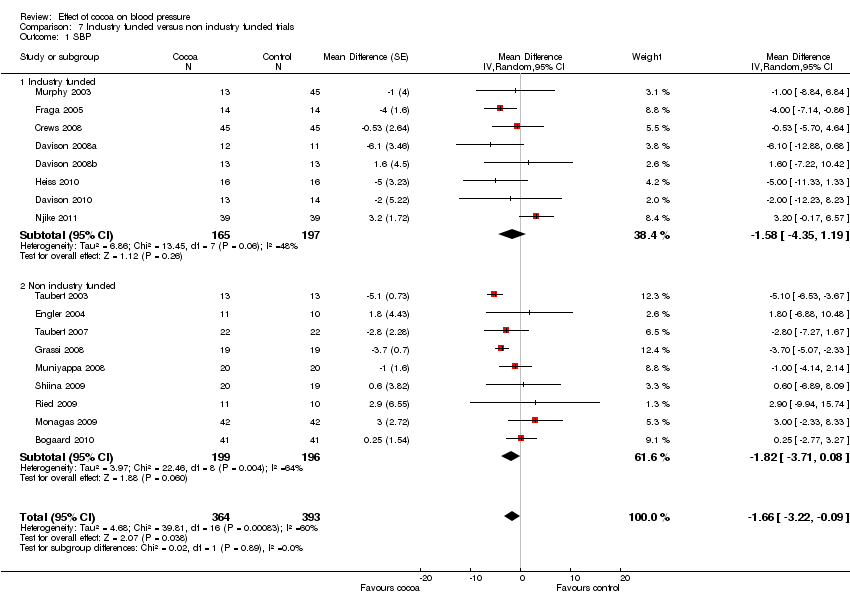
Comparison 7 Industry funded versus non industry funded trials, Outcome 1 SBP.
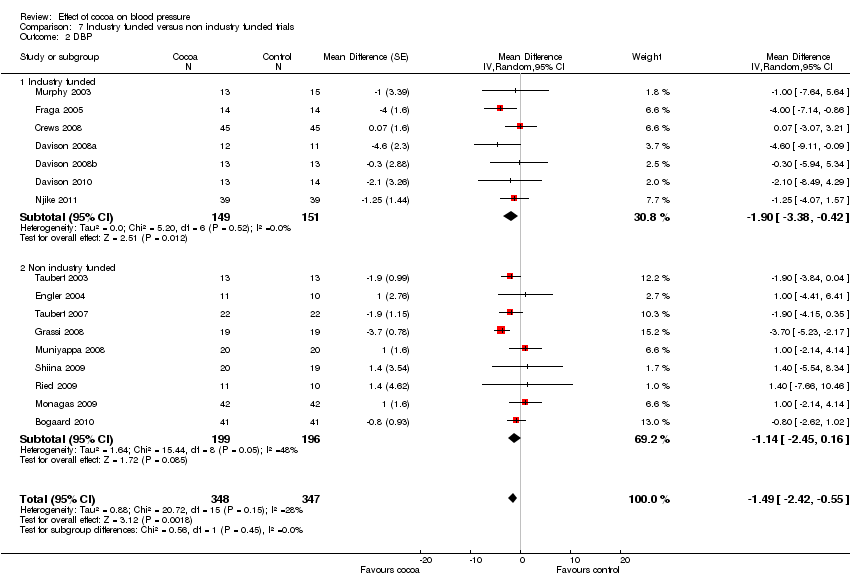
Comparison 7 Industry funded versus non industry funded trials, Outcome 2 DBP.
| Flavanol‐rich cocoa products for blood pressure | ||||||
| Patient or population: adults with or without hypertension | ||||||
| Outcomes | Illustrative comparative risks* (95% CI) | Relative effect | No of Participants | Quality of the evidence | Comments | |
| Assumed risk | Corresponding risk | |||||
| Control | Flavanol‐rich cocoa products | |||||
| Systolic blood pressure | The mean systolic blood pressure ranged across control groups from 110 to 154 mm Hg | The mean systolic blood pressure in the intervention groups was | 856 | ⊕⊕⊝⊝ | ||
| Diastolic blood pressure | The mean diastolic blood pressure ranged across control groups from 66 to 91.6 mm Hg | The mean diastolic blood pressure in the intervention groups was | 824 | ⊕⊕⊝⊝ | ||
| *The basis for the assumed risk (e.g. the median control group risk across studies) is provided in footnotes. The corresponding risk (and its 95% confidence interval) is based on the assumed risk in the comparison group and the relative effect of the intervention (and its 95% CI). | ||||||
| GRADE Working Group grades of evidence | ||||||
| 1 11 out of 20 trials provided insufficient information regarding allocation concealment. 9 trials were single blinded, using unblinded controls, one trial blinded control group but not intervention group.Two trials had more than 20% attrition. | ||||||
| Study | Study Design | Participants | Cocoa# Dosage; Brand | Cocoa product | Total Flavanols (mg)
| Epi‐/ catechin (mg) | Theobromine (mg) | Sugar | Duration | Baseline SBP (mm Hg) | Baseline DBP (mm Hg) | Age; BMI |
| Cocoa / Control group | ||||||||||||
| Taubert 03 | C | 13/13 | 100g bar; Rittersport Halbbitter, D | 50% DC/WC | 500/0 | 89/0 | 560/0 | 49 | 2 weeks | 153.3/153.6 | 84.5/84.2 | 59.5 yrs; 24.1 |
| Murphy 03 | P | 13/15 | 6 tablets; Cocoapro Mars, US | HiFl/LoFl tablets | 234/6.4 | ‐ | ‐ | 0 | 4 weeks | 118/116 | 78/76 | 43.5 yrs; 26.0 |
| Engler 04 | P | 11/10 | 46g bar; Dove Mars, US | HiFl/LoFl DC | 213/0 | 46/0 | ‐ | 15 | 2 weeks | 121/112.8 | 68.1/66.1 | 32.1 yrs; 22.6 |
| Fraga 05 | C | 14/14 | 105g M&M confectionary Mars, US | 16% MC/WC | 168/0 | 39/0 | 179/0 | 57 | 2 weeks | 123/123 | 72/71 | 18.0 yrs; 24.1 |
| Grassi 05a | C | 15/15 | 100g bar; Rittersport, D | 50% DC/WC | 500/0 | 89/0 | 560/0 | 49 | 2 weeks | 112.9/113.2 | 74/73.8 | 33.9 yrs; 22.6 |
| Grassi 05b | C | 20/20 | 100g bar; Rittersport, D | 50% DC/WC | 500/0 | 89/0 | 560/0 | 49 | 2 weeks | 141.3/141.1 | 92.4/91.8 | 43.7 yrs; 25.4 |
| Taubert 07 | P | 22/22 | 6.3g bar; Rittersport, D | 50% DC/WC | 30/0 | 7.1/0 | 26.4/0 | 3 | 18 weeks | 147.7/147.5 | 86.4/86.7 | 63.6 yrs; 24.0 |
| Crews 08 | P | 45/45 | 37g bar + 12g powder; Hershey, US | HiFl/LoFl bar & drink | 755/41 | ‐ | ‐ | 15 | 6 weeks | 126.8/128.6 | 74.2/75 | 68.8 yrs; 25.3 |
| Grassi 08 | C | 19/19 | 100g bar; Cuorenero, Ital | 90% DC/WC | 1080/0 | 150/0 | 170/0 | 0 | 2 weeks | 141.1/140.9 | 91.2/91.1 | 44.8 yrs; 26.5 |
| Muniyappa 08 | C | 20/20 | 62g powder; CocoaPro Mars, US | HiFl/LoFl drink | 902/28 | 236/10 | 674/654 | 17 | 2 weeks | 141/141 | 91/91 | 51.0 yrs; 33.2 |
| Davison 08a | P | 12/11 | powder; Mars, US | HiFl/LoFl drink | 902/36 | ‐ | 337/327 | 9.4 | 12 weeks | 124/124 | 76/77 | 44.9 yrs; 33.6 |
| Davison 08b | P | 13/13 | powder; Mars, US | HiFl/LoFl drink | 902/36 | ‐ | 337/327 | 9.4 | 12 weeks | 126/121 | 78/74 | 45.4 yrs; 33.3 |
| Al‐Faris 08 | P | 30/29 | 100g bar; Galaxy/Dove Mars, US
| 50% DC/WC | 500/0 | 10.6/0 | ‐ | 59 | 2 weeks | 115.9/115.2 | 73/72.8 | 21.3 yrs; 22 |
| Shiina 09 | P | 20/19 | 45g bar; Meiji, Jpn | 80% DC/WC | 550/0 | ‐ | ‐ | 9 | 2 weeks | 116.4/121.6 | 64.7/72.2 | 29.8 yrs; 22.6
|
| Ried 09 | P | 11/10 | 50g bar Haighs, AUS | 70% DC/placebo pill | 750/0 | ‐ | ‐ | 15 | 8 weeks | 135/135.7 | 83.6/77.8 | 53.1 yrs; 26.6 |
| Monagas 09 | C | 42/42 | 40g powder; Nutrexpa, Spain | HiFl/0 in milk | 495/0 | 56.5/0 | 440/0 | 26 | 4 weeks | 138/138 | 84/84 | 69.7 yrs; 27.6 |
| Bogaard 10 | C | 41/41 | 3.6 g powder; Aticoa, Barry Callebaut, Belg | HiFl/LoFl drink
| 529/0 | 38/0 | 543/0
| 1 | 3 weeks | 141.7/141.7 | 84.2/84.2 | 62.0 yrs; 25.9 |
| Heiss 10 | C | 16/16 | powder Cocoapro, Mars, US | HiFl/LoFl drink in milk or water | 750/18 | 130/6 | 186/192 | 8.6 | 4 weeks | 132/131 | ‐ | 64.0 yrs; 27.8 |
| Desch 10 | P | 43/48 | 25g/6g bar; Rittersport, D | 50% DC/DC | 125/30 | 29.5/7.1 | 110/26.4 | 13 | 12 weeks | 135.7/134.3 | 79.3/75.8 | 66.0 yrs; 28.1 |
| Davison 10 | p | 13/14 | 174g powder; Mars, US | HiFl/LoFl drink | 1052/33 | 266/12 | 460.5/ 402.2 | 17.7 | 6 weeks | 143/145.4 | 83.2/88 | 56.6 yrs; 29.3 |
| Njike 11 | C | 38/38 | 22g powder; Hershey, US | HiFl/LoFl drink | 805/9 | 69/0 | 436/0 | 46 | 6 weeks | 123.3/123.6 | 68.5/67.3 | 52.2 yrs; 30.3 |
|
| Variable | Number of studies | Regression coefficient | P‐value |
| SBP | Blinded or non‐blinded control group | 20 | 3.9952 | 0.031 |
|
| Sugar dosage (continuous) | 20 | ‐0.0794 | 0.079 |
|
| Duration: 2 weeks or >2 weeks | 20 | 4.4342 | 0.016 |
|
|
|
|
|
|
| DBP | Blinded or non‐blinded control group | 19 | 3.272 | 0.005 |
|
| Sugar dosage (continuous) | 19 | ‐0.0569 | 0.052 |
|
| Duration: 2 weeks or >2 weeks | 19 | 2.3324 | 0.055 |
|
| Age (continuous) | 19 | 0.0870 | 0.029 |
| Sensitivity analyses
| Comparison | Mean difference (95% CI) | p‐value | I2 | I2 before sensitivity analysis |
| Excluding Grassi 2005b | SBP all | ‐2.33 (‐3.83,‐0.83) | 0.002 | 63% | 83% |
|
| DBP all | ‐1.90 (‐2.88, ‐0.92) | 0.0001 | 44% | 70% |
|
| SBP flavanol‐free subgroup | ‐3.20 (‐4.84, ‐1.56) | 0.0001 | 62% | 86% |
|
| DBP flavanol‐free subgroup | ‐2.29 (‐3.49, ‐1.09) | 0.0002 | 54% | 77% |
|
| SBP hypertensive subgroup | ‐2.84 (‐4.61, ‐1.07) | 0.002 | 63% | 91% |
|
| DBP hypertensive subgroup | ‐1.76 (‐3.09, ‐0.44) | 0.009 | 50% | 85% |
|
| SBP sugar > 10g, BMI > 25 subgroup | 0.95 (‐0.95, 2.85) | 0.33 | 0% | 93% |
|
| DBP sugar > 10g, BMI > 25 subgroup | 0.04 (‐1.42, 1.50) | 0.96 | 0% | 86% |
|
| SBP 2 weeks subgroup | ‐4.12 (‐5.53, ‐2.70) | <0.0001 | 48% | 86% |
|
| DBP 2 weeks subgroup | ‐2.68 (‐4.14, ‐1.22) | 0.0003 | 56% | 77% |
|
| SBP <50 yrs age subgroup | ‐4.33 (‐5.87, ‐2.79) | <0.0001 | 23% | 84% |
|
| DBP <50 yrs age subgroup | ‐3.72 (‐4.70, ‐2.74) | <0.0001 | 0% | 60% |
| Excluding Taubert 2007 | SBP all | ‐2.75 (‐4.79, ‐0.72) | 0.008 | 83% | 83% |
| DBP all | ‐2.20 (‐3.55, ‐0.85) | 0.001 | 71% | 70% | |
| SBP flavanol‐free subgroup | ‐3.76 (‐6.22, ‐1.30) | 0.003 | 87% | 86% | |
| DBP flavanol‐free subgroup | ‐2.77 (‐4.47, ‐1.06) | 0.001 | 78% | 77% | |
| SBP hypertensive subgroup | ‐4.16 (‐7.48, ‐0.84) | 0.01 | 92% | 91% | |
| DBP hypertensive subgroup | ‐2.11 (‐3.58, ‐0.63) | 0.005 | 60% | 85% | |
| SBP >2 weeks subgroup | ‐0.20 (‐1.71, 2.12) | 0.83 | 15% | 19% | |
| DBP >2 weeks subgroup | ‐0.76 (‐1.90, 0.38) | 0.19 | 0% | 0% | |
| SBP >50 yrs age subgroup | ‐0.72 (‐3.48, 2.04) | 0.61 | 76% | 73% | |
| DBP >50 yrs age subgroup | ‐0.70 (‐1.69, 0.28) | 0.16 | 0% | 0% | |
|
|
|
|
|
|
|
| Excluding trials with loss‐of‐follow up/poor compliance > 20% (Muniyappa 2008, Davison 2008b) | SBP all | ‐3.03 (‐5.09, ‐0.97) | 0.004 | 83% | 83% |
|
| DBP all | ‐2.48 (‐3.78, ‐1.18) | 0.0002 | 70% | 70% |
|
| SBP low‐flavanol subgroup | ‐1.24 (‐4.59, 2.12) | 0.47 | 46% | 27% |
|
| DBP low‐flavanol subgroup | ‐1.39 (‐3.15, 0.37) | 0.12 | 0% | 0% |
|
| SBP hypertensive subgroup (–M8) | ‐4.52 (‐7.81, ‐1.22) | 0.007 | 92% | 91% |
|
| DBP hypertensive subgroup (‐M8) | ‐3.12 (‐5.31, ‐0.92) | 0.005 | 84% | 85% |
|
| SBP normotensive subgroup (–D8b) | ‐2.24 (‐4.95, 0.47) | 0.11 | 68% | 66% |
|
| DBP normotensive subgroup (‐D8b) | ‐2.32 (‐4.02, ‐0.62) | 0.007 | 52% | 47% |
|
| SBP sugar >10g, BMI > 25 subgroup (‐M8) | ‐1.07 (‐8.41, 6.26) | 0.77 | 94% | 93% |
|
| DBP sugar >10g, BMI > 25 subgroup (‐M8) | ‐1.74 (‐5.49, 2.00) | 0.36 | 86% | 86% |
|
| SBP sugar <10g, BMI > 25 subgroup (‐D8b) | ‐2.77 (‐5.07, ‐0.46) | 0.02 | 41% | 37% |
|
| DBP sugar <10g, BMI > 25 subgroup (‐D8b) | ‐2.55 (‐4.60, ‐0.49) | 0.02 | 55% | 45% |
|
| SBP 2 weeks subgroup (‐M8) | ‐5.35 (‐7.35, ‐2.85) | <0.0001 | 86% | 86% |
|
| DBP 2 weeks subgroup (‐M8) | ‐3.78 (‐5.50, ‐2.06) | <0.0001 | 73% | 77% |
|
| SBP >2 wks subgroup (‐D8b) | ‐0.35 (‐2.32, 1.63) | 0.73 | 26% | 19% |
|
| DBP >2 wks subgroup (‐D8b) | ‐1.01 (‐2.05, 0.02) | 0.06 | 0% | 0% |
|
| SBP <50 yrs age subgroup (‐D8b) | ‐5.46 (‐8.47, ‐2.45) | 0.0004 | 86% | 84% |
|
| DBP <50 yrs age subgroup (‐D8b) | ‐4.37 (‐5.94, ‐2.79) | <0.0001 | 60% | 60% |
|
| SBP >50 yrs age subgroup (‐M8) | ‐0.93 (‐3.79, 1.93) | 0.52 | 75% | 73% |
|
| DBP >50 yrs age subgroup (‐M8) | ‐1.06 (‐2.01, ‐0.12) | 0.03 | 0% | 0% |
| Using alternative correlation coefficients for cross‐over trials (main analysis: r=0.68) | SBP r=0.5 | ‐2.85 (‐4.76, ‐0.93) | 0.004 | 75% | 83% |
| SBP r=0.3 | ‐2.93 (‐4.82, ‐1.05) | 0.002 | 67.3% | 83% | |
| DBP r=0.5 | ‐2.23 (‐3.45, ‐1.00) | <0.0001 | 57.2% | 70% | |
| DBP r=0.3 | ‐2.24 (‐3.44, ‐1.05) | <0.0001 | 44.7% | 70% |
| Study | Study design
| Participants* Cocoa/ Control | Withdrawn Cocoa/Control | Adverse effects Cocoa/Control | Compliance rate
| Change in heart rate Mean (SD) |
| Taubert 03 | C | 13/13 | 0 | ‐ | 100% | Not significant |
| Murphy 03 | P | 13/15 | 3 | Family illness (2) Non‐compliance in final week (1) | 90% | ‐ |
| Engler 04 | P | 11/10 | 0 | ‐ | 100% | ‐ |
| Fraga 05 | C | 14/14 | 1 | no reason given | 96% | ‐ |
| Grassi 05a | C | 15/15 | 0 | ‐ | 100% | ‐ |
| Grassi 05b | C | 20/20 | 0 | ‐ | 100% | ‐ |
| Taubert 07 | P | 22/22 | 0 | ‐ | 100% | ‐ |
| Crews 08 | P | 45/45 | 6/5 | Gastrointestinal upset/headache/cold sweat (2/1) Bronchitis (1/0) Jitteriness/increased energy (1/0) Artrial arrhythmia/medication change (1/0) Distaste of study product (1/1) Family illness (0/1) Unspecified reason (0/1) No adherence to trial regimen (0/1) | 89% | Cocoa: 4.72 (7.93) Control: 0.33 (8.19) P= 0.007 |
| Grassi 08 | C | 19/19 | 0 | ‐ | 100% | ‐ |
| Muniyappa 08 | C | 20/20 | 5/4 | Loss‐to‐follow‐up (0/1) Discontinued intervention (4/2) due to intolerance to treatment, family emergencies, personal problems excluded from analysis (1/1) | 69% | ‐ |
| Davison 08a | P | 12/11 | 7 | Time restrictions, personal circumstances (14) Non‐compliance (exercise or diet) (2)
| 79% | Not significant |
| Davison 08b | P | 13/13 | 5 | 84% | Not significant | |
| Al‐Faris 08 | P | 30/29 | 0 | ‐ | 100% | Not significant |
| Shiina 09 | P | 20/19 | 0 | ‐ | 100% | Not significant |
| Ried 09 | P | 11/10 | 2/2 | Study product unpalatable (2/0) Gastrointestinal upset (0/1) Illness unrelated to study (0/1) | 84% | ‐ |
| Monagas 09 | C | 42/42 | 0 | Constipation (resolved with fibre intake) | 100% | Not significant |
| Bogaard 10 | C | 41/41 | 3 | Nausea (1) Headache (1) Arrythmia unrelated (1)
| 93% | ‐ |
| Heiss 10 | C | 16/16 | 3 | Did not come to first visit | 94% | Not significant |
| Davison 10 | P | 13/14 | 7 | Mild gastric symptoms (1) Non‐compliance to study protocol (1) Withdrew due to personal circumstances (5) | 88% | Not significant |
| Njike 11 | C | 38/38 | 7 | Non‐compliance to study protocol (1) Withdrew due to personal reasons (6)
| 84% | ‐ |
| Outcome or subgroup title | No. of studies | No. of participants | Statistical method | Effect size |
| 1 SBP Show forest plot | 20 | 856 | Mean Difference (Random, 95% CI) | ‐2.77 [‐4.72, ‐0.82] |
| 2 DBP Show forest plot | 19 | 824 | Mean Difference (Random, 95% CI) | ‐2.20 [‐3.46, ‐0.93] |
| Outcome or subgroup title | No. of studies | No. of participants | Statistical method | Effect size |
| 1 SBP Show forest plot | 20 | 856 | Mean Difference (Random, 95% CI) | ‐2.77 [‐4.72, ‐0.82] |
| 1.1 Flavanol free | 12 | 512 | Mean Difference (Random, 95% CI) | ‐3.70 [‐6.02, ‐1.38] |
| 1.2 Low flavanol | 8 | 344 | Mean Difference (Random, 95% CI) | ‐0.71 [‐2.99, 1.57] |
| 2 DBP Show forest plot | 19 | 824 | Mean Difference (Random, 95% CI) | ‐2.20 [‐3.46, ‐0.93] |
| 2.1 Flavanol free | 12 | 512 | Mean Difference (Random, 95% CI) | ‐2.71 [‐4.26, ‐1.15] |
| 2.2 Low flavanol | 7 | 312 | Mean Difference (Random, 95% CI) | ‐0.78 [‐2.26, 0.70] |
| Outcome or subgroup title | No. of studies | No. of participants | Statistical method | Effect size |
| 1 SBP Show forest plot | 19 | 817 | Mean Difference (Random, 95% CI) | ‐2.89 [‐4.88, ‐0.90] |
| 1.1 Hypertensive | 7 | 297 | Mean Difference (Random, 95% CI) | ‐3.99 [‐7.02, ‐0.97] |
| 1.2 Normotensive | 12 | 520 | Mean Difference (Random, 95% CI) | ‐2.04 [‐4.64, 0.57] |
| 2 DBP Show forest plot | 17 | 753 | Mean Difference (Random, 95% CI) | ‐2.20 [‐3.17, ‐1.23] |
| 2.1 Hypertensive | 7 | 287 | Mean Difference (Random, 95% CI) | ‐2.11 [‐3.35, ‐0.86] |
| 2.2 Normotensive | 10 | 466 | Mean Difference (Random, 95% CI) | ‐2.22 [‐3.83, ‐0.60] |
| Outcome or subgroup title | No. of studies | No. of participants | Statistical method | Effect size |
| 1 SBP Show forest plot | 13 | 609 | Mean Difference (Random, 95% CI) | ‐1.86 [‐4.95, 1.23] |
| 1.1 <10g sugar, BMI >25 | 6 | 229 | Mean Difference (Random, 95% CI) | ‐2.52 [‐4.74, ‐0.31] |
| 1.2 >10sugar, BMI >25 | 7 | 380 | Mean Difference (Random, 95% CI) | ‐1.12 [‐7.08, 4.85] |
| 2 DBP Show forest plot | 12 | 577 | Mean Difference (Random, 95% CI) | ‐1.79 [‐3.72, 0.13] |
| 2.1 <10g sugar, BMI >25 | 5 | 197 | Mean Difference (Random, 95% CI) | ‐2.34 [‐4.19, ‐0.50] |
| 2.2 >10g sugar, BMI >25 | 7 | 380 | Mean Difference (Random, 95% CI) | ‐1.32 [‐4.70, 2.06] |
| Outcome or subgroup title | No. of studies | No. of participants | Statistical method | Effect size |
| 1 SBP Show forest plot | 20 | 858 | Mean Difference (Random, 95% CI) | ‐2.77 [‐4.72, ‐0.82] |
| 1.1 2 week duration | 9 | 323 | Mean Difference (Random, 95% CI) | ‐4.81 [‐7.21, ‐2.41] |
| 1.2 >2 week duration | 11 | 535 | Mean Difference (Random, 95% CI) | ‐0.21 [‐2.04, 1.63] |
| 2 DBP Show forest plot | 19 | 823 | Mean Difference (Random, 95% CI) | ‐2.20 [‐3.46, ‐0.93] |
| 2.1 2 week duration | 9 | 321 | Mean Difference (Random, 95% CI) | ‐3.19 [‐3.00, ‐1.38] |
| 2.2 >2 week duration | 10 | 502 | Mean Difference (Random, 95% CI) | ‐0.99 [‐2.01, 0.03] |
| Outcome or subgroup title | No. of studies | No. of participants | Statistical method | Effect size |
| 1 SBP Show forest plot | 20 | 856 | Mean Difference (Random, 95% CI) | ‐2.77 [‐4.72, ‐0.82] |
| 1.1 <50 years | 10 | 332 | Mean Difference (Random, 95% CI) | ‐4.57 [‐7.41, ‐1.73] |
| 1.2 >50 years | 10 | 524 | Mean Difference (Random, 95% CI) | ‐0.96 [‐3.44, 1.52] |
| 2 DBP Show forest plot | 19 | 824 | Mean Difference (Random, 95% CI) | ‐2.20 [‐3.46, ‐0.93] |
| 2.1 <50 years | 10 | 332 | Mean Difference (Random, 95% CI) | ‐3.85 [‐5.45, ‐2.26] |
| 2.2 >50 years | 9 | 492 | Mean Difference (Random, 95% CI) | ‐0.89 [‐1.80, 0.01] |
| Outcome or subgroup title | No. of studies | No. of participants | Statistical method | Effect size |
| 1 SBP Show forest plot | 17 | 757 | Mean Difference (Random, 95% CI) | ‐1.66 [‐3.22, ‐0.09] |
| 1.1 Industry funded | 8 | 362 | Mean Difference (Random, 95% CI) | ‐1.58 [‐4.35, 1.19] |
| 1.2 Non industry funded | 9 | 395 | Mean Difference (Random, 95% CI) | ‐1.82 [‐3.71, 0.08] |
| 2 DBP Show forest plot | 16 | 695 | Mean Difference (Random, 95% CI) | ‐1.49 [‐2.42, ‐0.55] |
| 2.1 Industry funded | 7 | 300 | Mean Difference (Random, 95% CI) | ‐1.90 [‐3.38, ‐0.42] |
| 2.2 Non industry funded | 9 | 395 | Mean Difference (Random, 95% CI) | ‐1.14 [‐2.45, 0.16] |