Factor de crecimiento endotelial antivascular para la retinopatía diabética proliferativa
Información
- DOI:
- https://doi.org/10.1002/14651858.CD008721.pub2Copiar DOI

- Base de datos:
-
- Cochrane Database of Systematic Reviews
- Versión publicada:
-
- 24 noviembre 2014see what's new
- Tipo:
-
- Intervention
- Etapa:
-
- Review
- Grupo Editorial Cochrane:
-
Grupo Cochrane de Salud ocular y de la visión
- Copyright:
-
- Copyright © 2014 The Cochrane Collaboration. Published by John Wiley & Sons, Ltd.
Cifras del artículo
Altmetric:
Citado por:
Autores
Contributions of authors
Conceiving the review: MJM.
Designing the review: MJM, AM.
Co‐ordinating the review: MJM.
Designing electronic search strategy: Cochrane Eyes and Vision Group editorial base.
Screening search results: MJM, ChF, JAC, JRE.
Obtaining copies of trials: IS, MJM, ChF, JRE.
Appraising quality of papers: MJM, ChF, JAC, JRE.
Abstracting data from papers: MJM, JAC, JRE.
Data management for the review: MJM.
Entering data into Review Manager 5: MJM, JRE.
Analysis of data: MJM.
Interpretation of data: all authors.
Writing the review: MJM, JRE.
Draft the final review: all authors.
Guarantor for the review: MJM.
Sources of support
Internal sources
-
CIBER de Epidemiología y Salud Pública (CIBERESP), Spain.
External sources
-
Grant of the Spanish Ministry of Health (2006‐2008); PI0690322, Spain.
-
National Institute for Health Research (NIHR), UK.
-
Richard Wormald, Co‐ordinating Editor for the Cochrane Eyes and Vision Group (CEVG) acknowledges financial support for his CEVG research sessions from the Department of Health through the award made by the National Institute for Health Research to Moorfields Eye Hospital NHS Foundation Trust and UCL Institute of Ophthalmology for a Specialist Biomedical Research Centre for Ophthalmology.
-
The NIHR also funds the CEVG Editorial Base in London.
-
The Cochrane Review Incentive Scheme provided funding for Jennifer Evans to assist with completing this review.
The views expressed in this publication are those of the authors and not necessarily those of the NIHR, NHS, or the Department of Health.
-
Declarations of interest
None.
Acknowledgements
The Cochrane Eyes and Vision Group (CEVG) created the strategies and ran the searches on the electronic databases. We thank Satyamurthy Anuradha for her comments on the protocol, Nigel Davies for his comments on the review, Catey Bunce and Gianni Virgili for their comments on the protocol and review. We thank Anupa Shah, Managing Editor for CEVG her assistance throughout the editorial process.
We used Covidence (www.covidence.org) to screen the studies. We would like to thank Claire Irving and Clive Adams of the Cochrane Schizophrenia Group for their help in using RevmanHAL (szg.cochrane.org/revman‐hal) to prepare the "effects of interventions" section.
Version history
| Published | Title | Stage | Authors | Version |
| 2023 Mar 20 | Anti‐vascular endothelial growth factor for proliferative diabetic retinopathy | Review | Maria José Martinez-Zapata, Ignacio Salvador, Arturo J Martí-Carvajal, José I Pijoan, José A Cordero, Dmitry Ponomarev, Ashleigh Kernohan, Ivan Solà, Gianni Virgili | |
| 2014 Nov 24 | Anti‐vascular endothelial growth factor for proliferative diabetic retinopathy | Review | Maria José Martinez‐Zapata, Arturo J Martí‐Carvajal, Ivan Solà, José I Pijoán, José A Buil‐Calvo, Josep A Cordero, Jennifer R Evans | |
| 2010 Sep 08 | Anti‐vascular endothelial growth factor for proliferative diabetic retinopathy | Protocol | Maria José Martinez‐Zapata, Arturo J Martí‐Carvajal, Ivan Solà, José I Pijoán, José A Buil‐Calvo | |
Differences between protocol and review
We made the following amendments to the protocol (Martinez‐Zapata 2010).
-
In the protocol, we had not considered that anti‐VEGFs would be used in different patient groups with PDR (i.e. people eligible for laser treatment, people eligible for vitrectomy and people undergoing cataract surgery. We felt that clinically it did not make sense to combine these different patient groups and so have presented the results separately.
-
In the protocol, the primary outcome was regression of proliferative retinopathy and visual acuity was a secondary outcome. On reflection, we felt this was the wrong emphasis and considered that the effect on visual acuity was more relevant for the person than checking if anti‐VEGFs could produce regression of new vessels. We have changed visual acuity to the primary outcome and considered regression of proliferative retinopathy as a secondary outcome.
-
In the protocol, we planned to exclude from the analysis studies where the fellow eye was used as a control (i.e. the within‐person studies). However, some studies had a parallel group design but included a low percentage of participants with the fellow eye used as a control. We included these studies in the analysis.
-
We did not calculate the number needed to treat for an additional beneficial outcome (NNTB) and the number needed to treat for an additional harmful outcome (NNTH) due to the low quality of the evidence.
-
In the protocol, we planned to do a sensitivity analysis by intention‐to‐treat considering the "worst‐case scenario". In the event, we did not do this, partly due to the characteristics of the majority of studies and partly because, on reflection, we felt that this analysis was too extreme and unlikely to be informative.
-
We planned to do a sensitivity analysis excluding unpublished studies but did not have any data on unpublished studies to do this.
Keywords
MeSH
Medical Subject Headings (MeSH) Keywords
- Antibodies, Monoclonal, Humanized [therapeutic use];
- Aptamers, Nucleotide [therapeutic use];
- Bevacizumab;
- Diabetic Retinopathy [*drug therapy, surgery];
- Light Coagulation [methods];
- Randomized Controlled Trials as Topic;
- Ranibizumab;
- Vascular Endothelial Growth Factor A [*therapeutic use];
- Visual Acuity [drug effects];
- Vitrectomy;
- Vitreoretinopathy, Proliferative [*drug therapy, surgery];
Medical Subject Headings Check Words
Female; Humans; Male;
PICO

Results from searching for studies for inclusion in the review.

Risk of bias graph: review authors' judgements about each risk of bias item presented as percentages across all included studies.

Risk of bias summary: review authors' judgements about each risk of bias item for each included study.
![Forest plot of comparison: 1 Anti‐vascular endothelial growth factor (anti‐VEGF) versus photocoagulation, outcome: 1.3 Visual acuity [logMAR].](/es/cdsr/doi/10.1002/14651858.CD008721.pub2/media/CDSR/CD008721/rel0002/CD008721/image_n/nCD008721-AFig-FIG04.png)
Forest plot of comparison: 1 Anti‐vascular endothelial growth factor (anti‐VEGF) versus photocoagulation, outcome: 1.3 Visual acuity [logMAR].
![Forest plot of comparison: 2 Anti‐vascular endothelial growth factor (anti‐VEGF) plus surgery versus surgery alone or surgery plus sham or placebo, outcome: 2.3 Visual acuity [logMAR].](/es/cdsr/doi/10.1002/14651858.CD008721.pub2/media/CDSR/CD008721/rel0002/CD008721/image_n/nCD008721-AFig-FIG05.png)
Forest plot of comparison: 2 Anti‐vascular endothelial growth factor (anti‐VEGF) plus surgery versus surgery alone or surgery plus sham or placebo, outcome: 2.3 Visual acuity [logMAR].

Comparison 1 Anti‐vascular endothelial growth factor (anti‐VEGF) with or without panretinal photocoagulation (PRP) versus PRP alone, Outcome 1 Visual acuity.

Comparison 1 Anti‐vascular endothelial growth factor (anti‐VEGF) with or without panretinal photocoagulation (PRP) versus PRP alone, Outcome 2 Regression of proliferative diabetic retinopathy.

Comparison 1 Anti‐vascular endothelial growth factor (anti‐VEGF) with or without panretinal photocoagulation (PRP) versus PRP alone, Outcome 3 Presence of vitreous or pre‐retinal haemorrhage.
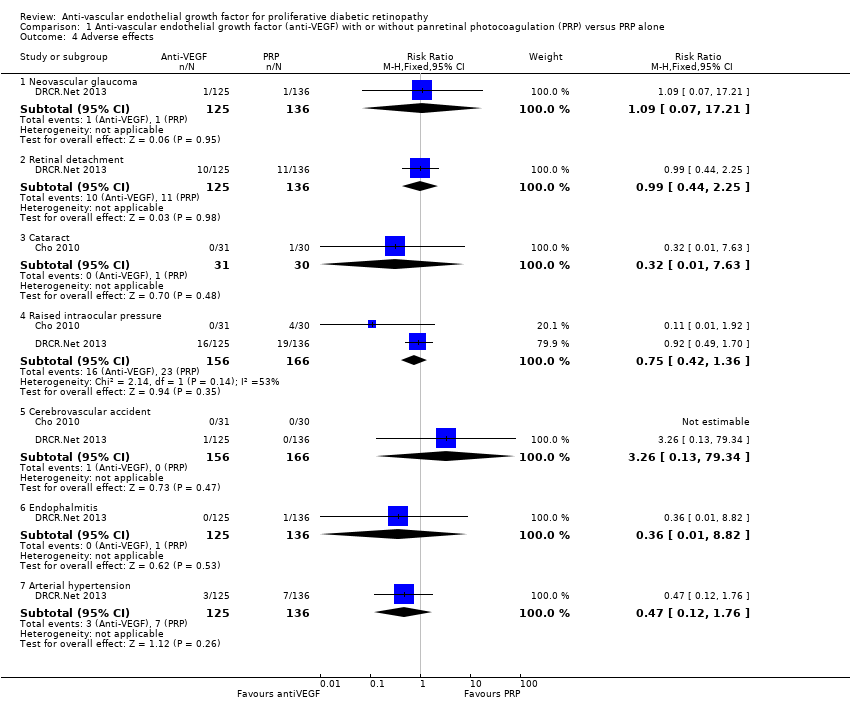
Comparison 1 Anti‐vascular endothelial growth factor (anti‐VEGF) with or without panretinal photocoagulation (PRP) versus PRP alone, Outcome 4 Adverse effects.

Comparison 2 Bevacizumab with vitrectomy compared with vitrectomy alone, Outcome 1 Loss of 3 or more lines of ETDRS visual acuity.

Comparison 2 Bevacizumab with vitrectomy compared with vitrectomy alone, Outcome 2 Gain of 3 or more lines of ETDRS visual acuity.

Comparison 2 Bevacizumab with vitrectomy compared with vitrectomy alone, Outcome 3 Visual acuity.
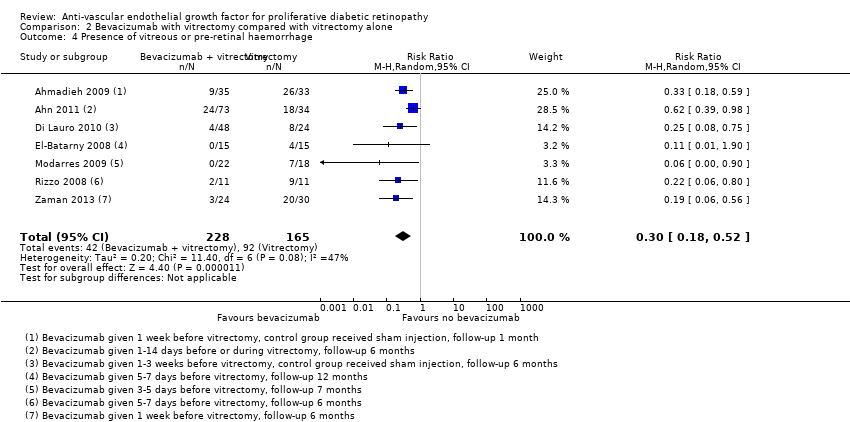
Comparison 2 Bevacizumab with vitrectomy compared with vitrectomy alone, Outcome 4 Presence of vitreous or pre‐retinal haemorrhage.

Comparison 2 Bevacizumab with vitrectomy compared with vitrectomy alone, Outcome 5 Adverse effects.
| Anti‐VEGF with or without laser (panretinal photocoagulation; PRP) compared with PRP alone for proliferative diabetic retinopathy | |||||
| Patient or population: people with PDR Settings: hospital Intervention: anti‐VEGF with or without PRP Comparison: PRP | |||||
| Outcomes | Illustrative comparative risks* (95% CI) | Relative effect | No of participants | Quality of the evidence | |
| Assumed risk | Corresponding risk | ||||
| PRP | Anti‐VEGF with or without PRP | ||||
| Loss of ≥ 3 lines of ETDRS visual acuity | 300 per 1000 | 57 per 1000 (15 to 243) | RR 0.19 (0.05 to 0.81) | 61 (1 study) | ⊕⊝⊝⊝ |
| Gain of ≥ 3 lines of ETDRS visual acuity | 10 per 1000 | 68 per 1000 (4 to 1260) | RR 6.78 (0.37 to 125.95) | 61 (1 study) | ⊕⊕⊝⊝ |
| Visual acuity (logMAR scale value of 0 = 6/6 vision, higher score = worse vision) Follow‐up: 12 months | The mean visual acuity ranged across control groups from | The mean visual acuity in the intervention groups was | ‐ | 373 (5 studies) | ⊕⊕⊝⊝ |
| Regression of proliferative diabetic retinopathy (as measured by area of fluorescein leakage) Follow‐up: 12 months | In 1 trial, people who received bevacizumab in addition to PRP had more regression of PDR, as measured by area of fluorescein leakage at 6 months compared with people who had PRP alone (MD ‐8.13 mm2, 95% CI ‐10.94 mm2 to ‐5.32 mm2, 19 participants). In another trial, people who received ranibizumab in addition to PRP had more regression of PDR, as measured by change in area of fluorescein leakage between baseline and 12 months compared with people who had PRP alone, however, the size of the effect was smaller and the CIs were compatible with no effect, or less regression (MD ‐1.0 mm2, 95% CI ‐5.3 mm2 to 3.3 mm2, 20 participants) | ||||
| Presence of vitreous/pre‐retinal haemorrhage Follow‐up: 12 months | 150 per 1000 | 48 per 1000 (24 to 98) | RR 0.32 (95% CI 0.16 to 0.65) | 342 (3 studies) | ⊕⊕⊝⊝ |
| Quality of life | No data reported on quality of life | ||||
| Adverse effects | Adverse effects were reported in 3 studies: 1 study of bevacizumab plus PRP compared with PRP alone and followed up to 3 months (61 participants); 1 study of ranibizumab compared with saline (both groups received PRP if indicated) and followed up to 4 months (261 participants); 1 study of ranibizumab plus PRP compared with PRP alone and followed up to 12 months (31 participants)
| ||||
| *The basis for the assumed risk (e.g. the median control group risk across studies) is provided in footnotes. The corresponding risk (and its 95% confidence interval) is based on the assumed risk in the comparison group and the relative effect of the intervention (and its 95% CI). GRADE Working Group grades of evidence | |||||
| 1 Downgraded for risk of bias (‐1) (study at high risk of selective reporting bias) imprecision (‐1) (wide CIs) and indirectness (‐1) (study reported gain/loss of ≥ 2 lines at 3 months only). 3 Downgraded for risk of bias (‐1) (2 studies at high risk of bias in ≥ 1 domain) and downgraded for indirectness (‐1) (no study reported at 12 months). | |||||
| Bevacizumab before or during vitrectomy compared with vitrectomy alone | |||||
| Patient or population: people undergoing vitrectomy for PDR Settings: hospital Intervention: bevacizumab before or during vitrectomy Comparison: vitrectomy alone or vitrectomy with sham injection | |||||
| Outcomes | Illustrative comparative risks* (95% CI) | Relative effect | No of participants | Quality of the evidence | |
| Assumed risk | Corresponding risk | ||||
| Surgery | Anti‐VEGF plus surgery | ||||
| Loss of ≥ 3 lines of ETDRS visual acuity Follow‐up: 12 months | 60 per 1000 | 29 per 1000 | RR 0.49 | 94 | ⊕⊕⊝⊝ |
| Gain of ≥ 3 lines of ETDRS visual acuity Follow‐up: 12 months | 500 per 1000 | 810 per 1000 | RR 1.62 | 94 | ⊕⊕⊝⊝ |
| Visual acuity logMAR Follow‐up: 12 months | The mean visual acuity ranged across control groups from | The mean visual acuity in the intervention groups was | ‐ | 335 | ⊕⊕⊝⊝ |
| Regression of PDR (as measured by area of fluorescein leakage) Follow‐up: 12 months | No data reported on regression of PDR | ||||
| Presence of vitreous/pre‐retinal haemorrhage Follow‐up: 12 months | 500 per 1000 | 150 per 1000 (90 to 260) | RR 0.30 (0.18 to 0.52) | 393 (7 studies) | ⊕⊕⊝⊝ |
| Quality of life | No data reported on quality of life | ||||
| Adverse effects | Neovascular glaucoma: RR 2.33 (95% CI 0.28 to 19.17; 1 RCT, 368 participants) Retinal detachment: RR 0.56 (95% CI 0.11 to 2.86; 3 RCTs, 182 participants) Cataract: RR 0.68 (95% CI 0.38 to 1.23; 2 RCTs, 137 participants) Raised intraocular pressure: RR 0.31 (95% CI 0.01 to 7.47; 1 RCT, 68 participants) Myocardial infarction: no events in 2 trials (175 participants) Cerebrovascular accident: no events in 2 trials (175 participants) Endophthalmitis: none of the studies reported endophthalmitis Arterial hypertension: none of the studies reported arterial hypertension Pain: none of the studies reported pain | ||||
| *The basis for the assumed risk (e.g. the median control group risk across studies) is provided in footnotes. The corresponding risk (and its 95% confidence interval) is based on the assumed risk in the comparison group and the relative effect of the intervention (and its 95% CI). | |||||
| GRADE Working Group grades of evidence | |||||
| 1 Downgraded for imprecision (‐1) (wide CIs) and downgraded for indirectness (‐1) (only 1 trial reported at 12 months and only 1 (other) trial reported loss of ≥ 3 lines). 3Downgraded for risk of bias (‐1) (2 studies at high risk of bias in ≥ 1 domains) and downgraded for inconsistency (‐1) (I2 = 66%). 4 Downgraded for risk of bias (‐1) (2 studies at high risk of bias in ≥ 1 domains, 3 studies at unclear risk of bias in ≥ 3 domains) and downgraded for indirectness (‐1) (only 1 study reported at 12 months). | |||||
| Mild | Presence of at least 1 microaneurysm |
| Moderate | Haemorrhages or microaneurysms (or both) more than standard photo 2A, presence of soft exudates, venous beading, IRMA definitively present |
| Severe | Haemorrhages or microaneurysms (or both) more than standard photo 2A in all 4 quadrants, or venous beading in ≥ 2 quadrants, or IRMA more than standard photo 8A in at least 1 quadrant |
| Very severe | Any ≥ 2 of the changes seen in severe NPDR |
| Early PDR | Presence of new vessels |
| High‐risk PDR | Any of the following: NVD more than one‐third to one‐quarter disc diameter, NVD less than one‐third to one‐quarter disc diameter with vitreous or pre‐retinal haemorrhage, new vessels elsewhere with vitreous or pre‐retinal haemorrhage |
| ETDRS: Early Treatment Diabetic Retinopathy Study; IRMA: intraretinal microaneurysm; NPDR: non‐proliferative diabetic retinopathy; NVD: new vessels at optic disc; PDR: proliferative diabetic retinopathy. | |
| Non‐apparent retinopathy | No abnormalities |
| Mild NPDR | Microaneurysms only |
| Moderate NPDR | More than just microaneurysms but less than severe NPDR |
| Severe NPDR | Any of the following: > 20 intraretinal haemorrhages in each of 4 quadrants; definite venous beading in 2 quadrants; prominent intraretinal microvascular abnormalities in 1 quadrant and no signs of proliferative retinopathy |
| Proliferative diabetic retinopathy | ≥ 1 of the following: neovascularisation, vitreous or pre‐retinal haemorrhage |
| ICDRDS: International Clinical Diabetic Retinopathy Disease Severity scale; NPDR: non‐proliferative diabetic retinopathy. | |
| Outcome or subgroup title | No. of studies | No. of participants | Statistical method | Effect size |
| 1 Visual acuity Show forest plot | 5 | 373 | Mean Difference (IV, Random, 95% CI) | ‐0.07 [‐0.12, ‐0.02] |
| 1.1 Pegaptanib | 1 | 16 | Mean Difference (IV, Random, 95% CI) | ‐0.06 [‐0.22, 0.10] |
| 1.2 Bevacizumab | 2 | 80 | Mean Difference (IV, Random, 95% CI) | ‐0.01 [‐0.11, 0.09] |
| 1.3 Ranibizumab | 2 | 277 | Mean Difference (IV, Random, 95% CI) | ‐0.10 [‐0.16, ‐0.03] |
| 2 Regression of proliferative diabetic retinopathy Show forest plot | 2 | Mean Difference (IV, Fixed, 95% CI) | Totals not selected | |
| 3 Presence of vitreous or pre‐retinal haemorrhage Show forest plot | 3 | 342 | Risk Ratio (M‐H, Fixed, 95% CI) | 0.32 [0.16, 0.65] |
| 3.1 Bevacizumab | 1 | 61 | Risk Ratio (M‐H, Fixed, 95% CI) | 0.11 [0.01, 1.92] |
| 3.2 Pegaptanib | 1 | 20 | Risk Ratio (M‐H, Fixed, 95% CI) | 0.2 [0.01, 3.70] |
| 3.3 Ranibizumab versus control | 1 | 261 | Risk Ratio (M‐H, Fixed, 95% CI) | 0.38 [0.18, 0.81] |
| 4 Adverse effects Show forest plot | 2 | Risk Ratio (M‐H, Fixed, 95% CI) | Subtotals only | |
| 4.1 Neovascular glaucoma | 1 | 261 | Risk Ratio (M‐H, Fixed, 95% CI) | 1.09 [0.07, 17.21] |
| 4.2 Retinal detachment | 1 | 261 | Risk Ratio (M‐H, Fixed, 95% CI) | 0.99 [0.44, 2.25] |
| 4.3 Cataract | 1 | 61 | Risk Ratio (M‐H, Fixed, 95% CI) | 0.32 [0.01, 7.63] |
| 4.4 Raised intraocular pressure | 2 | 322 | Risk Ratio (M‐H, Fixed, 95% CI) | 0.75 [0.42, 1.36] |
| 4.5 Cerebrovascular accident | 2 | 322 | Risk Ratio (M‐H, Fixed, 95% CI) | 3.26 [0.13, 79.34] |
| 4.6 Endophalmitis | 1 | 261 | Risk Ratio (M‐H, Fixed, 95% CI) | 0.36 [0.01, 8.82] |
| 4.7 Arterial hypertension | 1 | 261 | Risk Ratio (M‐H, Fixed, 95% CI) | 0.47 [0.12, 1.76] |
| Outcome or subgroup title | No. of studies | No. of participants | Statistical method | Effect size |
| 1 Loss of 3 or more lines of ETDRS visual acuity Show forest plot | 3 | 94 | Risk Ratio (M‐H, Fixed, 95% CI) | 0.49 [0.08, 3.14] |
| 2 Gain of 3 or more lines of ETDRS visual acuity Show forest plot | 3 | 94 | Risk Ratio (M‐H, Fixed, 95% CI) | 1.62 [1.20, 2.17] |
| 3 Visual acuity Show forest plot | 6 | 335 | Mean Difference (IV, Random, 95% CI) | ‐0.24 [‐0.50, 0.01] |
| 4 Presence of vitreous or pre‐retinal haemorrhage Show forest plot | 7 | 393 | Risk Ratio (M‐H, Random, 95% CI) | 0.30 [0.18, 0.52] |
| 5 Adverse effects Show forest plot | 5 | Risk Ratio (M‐H, Random, 95% CI) | Subtotals only | |
| 5.1 Neovascular glaucoma | 1 | 107 | Risk Ratio (M‐H, Random, 95% CI) | 2.33 [0.28, 19.17] |
| 5.2 Retinal detachment | 3 | 182 | Risk Ratio (M‐H, Random, 95% CI) | 0.56 [0.11, 2.86] |
| 5.3 Cataract | 2 | 137 | Risk Ratio (M‐H, Random, 95% CI) | 0.68 [0.38, 1.23] |
| 5.4 Raised intraocular pressure | 1 | 68 | Risk Ratio (M‐H, Random, 95% CI) | 0.31 [0.01, 7.47] |
| 5.5 Myocardial infarction | 2 | 175 | Risk Ratio (M‐H, Random, 95% CI) | 0.0 [0.0, 0.0] |
| 5.6 Cerebrovascular accident | 2 | 175 | Risk Ratio (M‐H, Random, 95% CI) | 0.0 [0.0, 0.0] |
| 5.7 Arterial hypertension | 0 | 0 | Risk Ratio (M‐H, Random, 95% CI) | 0.0 [0.0, 0.0] |