Factor de crecimiento endotelial antivascular para la retinopatía diabética proliferativa
Resumen
Antecedentes
La retinopatía diabética proliferativa (RDP) es una complicación de la retinopatía diabética que puede causar ceguera. Aunque la fotocoagulación panretinal (FPR) es el tratamiento de elección para la RDP, tiene efectos secundarios que pueden afectar la visión. Un tratamiento alternativo como el factor de crecimiento endotelial antivascular (anti‐VEGF, por sus siglas en inglés), que produce una inhibición de la proliferación vascular, podría mejorar la visión de los pacientes con RDP.
Objetivos
Evaluar la efectividad y la seguridad de los anti‐VEGF para la RDP.
Métodos de búsqueda
Se realizaron búsquedas en CENTRAL (que contiene el Registro de ensayos del Grupo Cochrane de Trastornos de los Ojos y la Visión [Cochrane Eyes and Vision Group]) (2014, número 3), Ovid MEDLINE, Ovid MEDLINE In‐Process and Other Non‐Indexed Citations, Ovid MEDLINE Daily, Ovid OLDMEDLINE (enero 1946 hasta abril 2014), EMBASE (enero 1980 hasta abril 2014), el metaRegister of Controlled Trials (mRCT) (www.controlled‐trials.com), ClinicalTrials.gov (www.clinicaltrials.gov) y en el World Health Organization (WHO) International Clinical Trials Registry Platform (ICTRP) (www.who.int/ictrp/search/en). No se aplicó ninguna restricción de fecha o idioma en las búsquedas electrónicas de ensayos. La última búsqueda en las bases de datos electrónicas se realizó el 28 de abril de 2014.
Criterios de selección
Se incluyeron los ensayos controlados aleatorios (ECA) que compararon los anti‐VEGF con otro tratamiento activo, tratamiento simulado o ningún tratamiento en pacientes con RDP. También se incluyeron los estudios que evaluaron la combinación de los anti‐VEGF con otros tratamientos.
Obtención y análisis de los datos
Dos autores de la revisión seleccionaron de forma independiente los ensayos para inclusión, extrajeron los datos y evaluaron el riesgo de sesgo de todos los ensayos incluidos. Se calculó el cociente de riesgos (CR) o la diferencia de medias (DM) y los intervalos de confianza (IC) del 95%.
Resultados principales
Se incluyeron 18 ECA con 1005 participantes (1131 ojos) de los cuales el 57% eran hombres. El número medio de participantes por ECA fue de 40 (rango de 15 a 261). Los estudios se realizaron en Asia (tres estudios), Europa (dos estudios), Oriente Medio (siete estudios), América del Norte (tres estudios) y América del Sur (tres estudios). Ocho ECA reclutaron a pacientes elegibles para FPR, nueve ECA reclutaron pacientes con diabetes que requerían vitrectomía y un ECA reclutó a pacientes a los que se les realizó cirugía por catarata. La mediana del seguimiento fue seis meses (intervalo de uno a 12 meses). Siete estudios tuvieron alto riesgo de sesgo y los estudios restantes tuvieron riesgo incierto de sesgo en uno o más dominios.
Pruebas de calidad muy baja de un estudio con 61 pacientes indicaron que los pacientes tratados con bevacizumab y FPR tuvieron menores probabilidades de perder tres o más líneas de agudeza visual a los 12 meses en comparación con los pacientes tratados con FPR sola (CR 0,19; IC del 95%: 0,05 a 0,81). Los pacientes tratados con anti‐VEGF tuvieron mayores probabilidades de ganar tres o más líneas de agudeza visual pero el efecto fue poco preciso y compatible con ningún efecto o con tener menores probabilidades de ganar visión (CR 6,78; IC del 95%: 0,37 a 125,95). Ningún otro estudio informó estos dos resultados. Como promedio, los pacientes tratados con anti‐VEGF (bevacizumab, pegaptanib o ranibizumab) tuvieron mejor agudeza visual a los 12 meses en comparación con los pacientes que no recibieron anti‐VEGF (DM ‐0,07 logMAR; IC del 95%: ‐0,12 a ‐0,02; 5 ECA, 373 participantes, baja calidad de las pruebas). Hubo algunas pruebas que indican una regresión de la RDP con una pérdida más pequeña en la angiografía fluoresceínica, pero fue difícil calcular un resultado agrupado de los dos ensayos que informaron este resultado. Los pacientes que recibieron anti‐VEGF tuvieron menores probabilidades de presentar hemorragia vítrea o prerretiniana a los 12 meses (CR 0,32; IC del 95%: 0,16 a 0,65; 3 ECA, 342 participantes, baja calidad de las pruebas). Ningún estudio informó sobre la pérdida de fluoresceína o la calidad de vida.
Los nueve ensayos de anti‐VEGF antes o durante la vitrectomía investigaron el bevacizumab; la mayoría de los estudios investigó el bevacizumab antes de la vitrectomía, un estudio investigó el bevacizumab durante la cirugía.
Los pacientes tratados con bevacizumab y vitrectomía tuvieron menores probabilidades de perder tres o más líneas de agudeza visual a los 12 meses en comparación con los pacientes que recibieron vitrectomía sola, pero el efecto fue poco preciso y compatible con ningún efecto o con tener mayores probabilidades de perder visión (CR 0,49; IC del 95%: 0,08 a 3,14; 3 ECA, 94 participantes, baja calidad de las pruebas). Los pacientes tratados con bevacizumab tuvieron mayores probabilidades de ganar tres o más líneas de agudeza visual (CR 1,62; IC del 95%: 1,20 a 2,17; 3 ECA, 94 participantes, baja calidad de las pruebas). Como promedio, los pacientes tratados con bevacizumab tuvieron mejor agudeza visual a los 12 meses en comparación con los pacientes no que recibieron bevacizumab, pero hubo incertidumbre en la estimación (el IC incluyó el 0; es decir, fue compatible con ningún efecto y hubo considerable inconsistencia entre los estudios; DM ‐0,24 logMAR; IC del 95%: ‐0,50 a 0,01; (6 ECA, 335 participantes, I2 = 67%; pruebas de baja calidad). Los pacientes que recibieron bevacizumab tuvieron menores probabilidades de presentar hemorragia vítrea o prerretiniana a los 12 meses (CR 0,30; IC del 95%: 0,18 a 0,52; 7 ECA, 393 participantes, baja calidad de las pruebas). Ningún estudio informó sobre la calidad de vida.
Los motivos para la disminución de la calidad de las pruebas incluyeron el riesgo de sesgo en los estudios incluidos, la poca precisión de las estimaciones, la inconsistencia en las estimaciones del efecto y la falta de direccionalidad (pocos estudios informaron resultados a los 12 meses).
Los efectos adversos se informaron con poca frecuencia y no hubo pruebas de algún aumento del riesgo con el anti‐VEGF, pero debido a los relativamente pocos estudios que informaron estos resultados y a la baja tasa de eventos, el poder del análisis para detectar cualquier diferencia fue bajo.
Conclusiones de los autores
Hubo pruebas de calidad muy baja o baja de ECA de la eficacia y la seguridad de los agentes anti‐VEGF cuando se administraron para tratar la RDP además de los tratamientos estándar actuales. Sin embargo, los resultados indican que los anti‐VEGF pueden reducir el riesgo de hemorragia intraocular en los pacientes con RDP. Ensayos clínicos adicionales cuidadosamente diseñados deben poder mejorar estas pruebas.
PICO
Resumen en términos sencillos
Inyecciones de factor de crecimiento endotelial antivascular para la retinopatía diabética avanzada
Pregunta de la revisión
¿Las inyecciones del factor de crecimiento endotelial antivascular (anti‐VEGF) ayudan a los pacientes con retinopatía diabética avanzada con respecto a la visión y la progresión de la enfermedad? ¿Este tratamiento es seguro?
Antecedentes
La retinopatía diabética es un problema de la parte posterior del ojo que se presenta en los pacientes con diabetes. En los estadios más tardíos de la enfermedad, vasos sanguíneos de neoformación crecen en la parte posterior del ojo y provocan problemas con la visión. Esta forma avanzada de la enfermedad se conoce como retinopatía diabética proliferativa. Los anti‐VEGF se han desarrollado para bloquear el crecimiento de estos nuevos vasos. Tienen que inyectarse en el ojo.
Fecha de la búsqueda
Se examinaron las investigaciones publicadas hasta al 28 de abril de 2014.
Características de los estudios
Se encontraron 18 ensayos. Se realizaron en Asia (tres ensayos), Europa (dos ensayos), Oriente Medio (siete ensayos), América del Norte (tres ensayos) y América del Sur (tres ensayos). Un total de 1005 personas participaron en estos ensayos y se estudiaron 1131 ojos. Ocho ensayos estudiaron el anti‐VEGF con otro tratamiento habitualmente administrado para la retinopatía diabética (láser), nueve estudios analizaron el anti‐VEGF en el momento de la cirugía del ojo diabético (vitrectomía) y un estudio investigó la administración de anti‐VEGF en pacientes con retinopatía diabética a los que se les realizó cirugía por catarata. La mayoría de los estudios siguió a los participantes durante seis meses, pero algunos estudios los siguieron por un año.
Fuentes de financiación de los estudios
Un estudio fue financiado por la industria, un estudio fue financiado por una combinación del gobierno y la industria, y tres estudios fueron financiados por el gobierno y organizaciones no gubernamentales. Los estudios restantes no informaron la fuente de financiamiento.
Resultados clave
En un estudio pequeño se encontró que los pacientes tratados con anti‐VEGF más láser tuvieron menores probabilidades de perder alguna visión en comparación con los pacientes tratados con láser solo, pero la estimación fue poco precisa: alrededor del 30% de los pacientes tratados con láser perdieron alguna visión en comparación con el 6% y el 24% de los pacientes tratados con anti‐VEGF más láser.
Como promedio, los pacientes tratados con anti‐VEGF tuvieron ligeramente mejor visión que los pacientes que no fueron tratados con anti‐VEGF. También tuvieron menores probabilidades de presentar hemorragia en el ojo. Ninguno de los estudios informó sobre la calidad de vida. Un estudio indicó que la inyección de anti‐VEGF fue menos dolorosa que el tratamiento láser.
Los pacientes tratados con anti‐VEGF antes o durante la cirugía del ojo diabético (vitrectomía) tuvieron menores probabilidades de perder alguna visión en comparación con los pacientes tratados con cirugía sola, pero la estimación fue incierta y podría haber sucedido que el anti‐VEGF no logró un cambio o aumentó el riesgo de perder visión. Como promedio, los pacientes que recibieron anti‐VEGF antes o durante la cirugía del ojo diabético tuvieron ligeramente mejor visión que los pacientes que no fueron tratados con anti‐VEGF, pero nuevamente la estimación fue incierta. También tuvieron menores probabilidades de presentar hemorragia en el ojo. Ninguno de los estudios informó sobre la calidad de vida.
Los efectos secundarios fueron poco frecuentes y no había suficientes datos para detectar una diferencia entre los dos grupos.
Calidad de la evidencia
La calidad de las pruebas fue baja o muy baja. Se consideró que algunos de los ensayos incluidos tuvieron riesgo de sesgo debido a la falta de enmascaramiento de los tratamientos y a problemas con el seguimiento. Algunos de los hallazgos se basaron en un número demasiado pequeño de participantes. Pocos estudios hicieron un seguimiento de los participantes durante más de seis meses.
Conclusiones de los autores
Summary of findings
| Anti‐VEGF with or without laser (panretinal photocoagulation; PRP) compared with PRP alone for proliferative diabetic retinopathy | |||||
| Patient or population: people with PDR Settings: hospital Intervention: anti‐VEGF with or without PRP Comparison: PRP | |||||
| Outcomes | Illustrative comparative risks* (95% CI) | Relative effect | No of participants | Quality of the evidence | |
| Assumed risk | Corresponding risk | ||||
| PRP | Anti‐VEGF with or without PRP | ||||
| Loss of ≥ 3 lines of ETDRS visual acuity | 300 per 1000 | 57 per 1000 (15 to 243) | RR 0.19 (0.05 to 0.81) | 61 (1 study) | ⊕⊝⊝⊝ |
| Gain of ≥ 3 lines of ETDRS visual acuity | 10 per 1000 | 68 per 1000 (4 to 1260) | RR 6.78 (0.37 to 125.95) | 61 (1 study) | ⊕⊕⊝⊝ |
| Visual acuity (logMAR scale value of 0 = 6/6 vision, higher score = worse vision) Follow‐up: 12 months | The mean visual acuity ranged across control groups from | The mean visual acuity in the intervention groups was | ‐ | 373 (5 studies) | ⊕⊕⊝⊝ |
| Regression of proliferative diabetic retinopathy (as measured by area of fluorescein leakage) Follow‐up: 12 months | In 1 trial, people who received bevacizumab in addition to PRP had more regression of PDR, as measured by area of fluorescein leakage at 6 months compared with people who had PRP alone (MD ‐8.13 mm2, 95% CI ‐10.94 mm2 to ‐5.32 mm2, 19 participants). In another trial, people who received ranibizumab in addition to PRP had more regression of PDR, as measured by change in area of fluorescein leakage between baseline and 12 months compared with people who had PRP alone, however, the size of the effect was smaller and the CIs were compatible with no effect, or less regression (MD ‐1.0 mm2, 95% CI ‐5.3 mm2 to 3.3 mm2, 20 participants) | ||||
| Presence of vitreous/pre‐retinal haemorrhage Follow‐up: 12 months | 150 per 1000 | 48 per 1000 (24 to 98) | RR 0.32 (95% CI 0.16 to 0.65) | 342 (3 studies) | ⊕⊕⊝⊝ |
| Quality of life | No data reported on quality of life | ||||
| Adverse effects | Adverse effects were reported in 3 studies: 1 study of bevacizumab plus PRP compared with PRP alone and followed up to 3 months (61 participants); 1 study of ranibizumab compared with saline (both groups received PRP if indicated) and followed up to 4 months (261 participants); 1 study of ranibizumab plus PRP compared with PRP alone and followed up to 12 months (31 participants)
| ||||
| *The basis for the assumed risk (e.g. the median control group risk across studies) is provided in footnotes. The corresponding risk (and its 95% confidence interval) is based on the assumed risk in the comparison group and the relative effect of the intervention (and its 95% CI). GRADE Working Group grades of evidence | |||||
| 1 Downgraded for risk of bias (‐1) (study at high risk of selective reporting bias) imprecision (‐1) (wide CIs) and indirectness (‐1) (study reported gain/loss of ≥ 2 lines at 3 months only). 3 Downgraded for risk of bias (‐1) (2 studies at high risk of bias in ≥ 1 domain) and downgraded for indirectness (‐1) (no study reported at 12 months). | |||||
| Bevacizumab before or during vitrectomy compared with vitrectomy alone | |||||
| Patient or population: people undergoing vitrectomy for PDR Settings: hospital Intervention: bevacizumab before or during vitrectomy Comparison: vitrectomy alone or vitrectomy with sham injection | |||||
| Outcomes | Illustrative comparative risks* (95% CI) | Relative effect | No of participants | Quality of the evidence | |
| Assumed risk | Corresponding risk | ||||
| Surgery | Anti‐VEGF plus surgery | ||||
| Loss of ≥ 3 lines of ETDRS visual acuity Follow‐up: 12 months | 60 per 1000 | 29 per 1000 | RR 0.49 | 94 | ⊕⊕⊝⊝ |
| Gain of ≥ 3 lines of ETDRS visual acuity Follow‐up: 12 months | 500 per 1000 | 810 per 1000 | RR 1.62 | 94 | ⊕⊕⊝⊝ |
| Visual acuity logMAR Follow‐up: 12 months | The mean visual acuity ranged across control groups from | The mean visual acuity in the intervention groups was | ‐ | 335 | ⊕⊕⊝⊝ |
| Regression of PDR (as measured by area of fluorescein leakage) Follow‐up: 12 months | No data reported on regression of PDR | ||||
| Presence of vitreous/pre‐retinal haemorrhage Follow‐up: 12 months | 500 per 1000 | 150 per 1000 (90 to 260) | RR 0.30 (0.18 to 0.52) | 393 (7 studies) | ⊕⊕⊝⊝ |
| Quality of life | No data reported on quality of life | ||||
| Adverse effects | Neovascular glaucoma: RR 2.33 (95% CI 0.28 to 19.17; 1 RCT, 368 participants) Retinal detachment: RR 0.56 (95% CI 0.11 to 2.86; 3 RCTs, 182 participants) Cataract: RR 0.68 (95% CI 0.38 to 1.23; 2 RCTs, 137 participants) Raised intraocular pressure: RR 0.31 (95% CI 0.01 to 7.47; 1 RCT, 68 participants) Myocardial infarction: no events in 2 trials (175 participants) Cerebrovascular accident: no events in 2 trials (175 participants) Endophthalmitis: none of the studies reported endophthalmitis Arterial hypertension: none of the studies reported arterial hypertension Pain: none of the studies reported pain | ||||
| *The basis for the assumed risk (e.g. the median control group risk across studies) is provided in footnotes. The corresponding risk (and its 95% confidence interval) is based on the assumed risk in the comparison group and the relative effect of the intervention (and its 95% CI). | |||||
| GRADE Working Group grades of evidence | |||||
| 1 Downgraded for imprecision (‐1) (wide CIs) and downgraded for indirectness (‐1) (only 1 trial reported at 12 months and only 1 (other) trial reported loss of ≥ 3 lines). 3Downgraded for risk of bias (‐1) (2 studies at high risk of bias in ≥ 1 domains) and downgraded for inconsistency (‐1) (I2 = 66%). 4 Downgraded for risk of bias (‐1) (2 studies at high risk of bias in ≥ 1 domains, 3 studies at unclear risk of bias in ≥ 3 domains) and downgraded for indirectness (‐1) (only 1 study reported at 12 months). | |||||
Antecedentes
Descripción de la afección
Introducción y epidemiología
La retinopatía diabética (RD) es un trastorno vascular que involucra la retina y se caracteriza por un aumento en la permeabilidad vascular, isquemia retiniana y edema, y la formación de los nuevos vasos (neovascularización) (Carmeliet 2004). La RD provoca deficiencia visual que puede progresar a la ceguera. Es una complicación de ambos tipos de diabetes mellitus (DM), tipo 1 y tipo 2. La RD se puede desarrollar antes de realizar un diagnóstico de diabetes, de tal manera que uno de cada cinco pacientes con DM tipo 2 presenta retinopatía en el momento del diagnóstico. Más del 60% de los pacientes con DM tipo 2 y casi todos los pacientes con DM tipo 1 desarrollan RD durante los primeros 20 años de la enfermedad (ADA 2006).
Un paciente con diabetes tiene un riesgo de ceguera tres veces mayor en comparación con la población general (Hayward 2002). En un estudio realizado por Moss y cols., la incidencia de ceguera a los diez años después de la aparición de la DM fue del 1,8% en los pacientes con DM tipo 1, del 4,0% en los pacientes con DM tipo 2 tratada con insulina y del 4,8% en los pacientes con DM tipo 2 no tratada con insulina (Moss 1994). En el mismo estudio, la incidencia de deficiencia visual a los diez años fue del 9,4% en los pacientes con DM tipo 1, del 37,2% en los pacientes con DM tipo 2 tratada con insulina y 23,9% en los pacientes con DM tipo 2 no tratada con insulina. En los EE.UU., en 2002, el 17% de la ceguera se atribuyó a la RD (Resnikoff 2004).
Los factores de riesgo principales de desarrollar RD son la duración de la DM y la gravedad de la hiperglucemia (Davis 1998; Klein 1988; UKPDSG 1998a; Van Leiden 2003). Otros factores de riesgo son edad (en la DM tipo 1) (Klein 1984), hipertensión (Klein 1989; Klein 2002a; UKPDSG 1998b), nefropatía (Mathiesen 1995), hipercolesterolemia (Chew 1996; Klein 2002b; Van Leiden 2002), obesidad abdominal e índice de masa corporal alto (Van Leiden 2003), anemia (Davis 1998), embarazo (Klein 1990), edad al comienzo (Kullberg 2002), tabaquismo y grupo étnico (Moss 1996).
Presentación y diagnóstico
La RD se caracteriza clínicamente por una pérdida progresiva de la agudeza visual (agudeza o claridad de la visión). El daño retiniano progresa secuencialmente de un estadio leve no proliferativo a un estadio grave proliferativo. Los signos de retinopatía diabética no proliferativa (RDNP) incluyen presencia de microaneurismas, hemorragias intrarretinales, exudados duros (depósitos de lípidos), cambios vasculares (como en rosario y en lazo o segmentación de las venas), exudados blandos o manchas de algodón (como resultado del cierre de las arteriolas retinianas pequeñas), anomalías microvasculares intrarretinales y edema retiniano.
Hay dos sistemas importantes de clasificación clínica de la RDNP: la clasificación del grupo de investigación del estudio Early Treatment Diabetic Retinopathy (ETDR) (ETDRSRG 1991a; ETDRSRG 1991b; Tabla 1) y la escala International Clinical Diabetic Retinopathy Disease Severity (ICDRDS; Wilkinson 2003; Tabla 2).
Aproximadamente el 50% de los pacientes con RDNP muy grave progresa a retinopatía diabética proliferativa (RDP) en el transcurso de un año (ETDRSRG 1991c). La RDP se caracteriza por neovascularización, que comienza en la retina pero puede aumentar y afectar al humor vítreo. Estos nuevos vasos son propensos a hemorragia, lo que da lugar a hemorragia vítrea y fibrosis, y puede provocar desprendimientos del humor vítreo o la retina.
Descripción de la intervención
Las estrategias de tratamiento para la RD incluyen 1. fotocoagulación láser (DRSRG 1978; DRSRG 1981a; DRSRG 1981b; ETDRSRG 1985), 2. vitrectomía (DRVSRG 1985), y 3. farmacoterapia para prevenir la neovascularización retiniana y las anomalías del flujo sanguíneo que afectan las vías metabólicas. En general, el fármaco se administra por inyección intravitreal.
Hay varias líneas de tratamiento que incluyen los inhibidores del factor de crecimiento endotelial vascular (VEGF) (anti‐VEGF). Algunos anti‐VEGF son no selectivos, como los corticosteroides (Jaffe 2006; Martidis 2002; Nauck 1997), los inhibidores de la clicooxigenasa(Sennlaub 2003), y los inhibidores de la enzima convertidora de angiotensina (ECA) (Gilbert 2000). Otros anti‐VEGF son selectivos, como el pegaptanib sódico (Adamis 2006; Cunningham 2005), y anticuerpos como bevacizumab (Arevalo 2007; Avery 2006a; Avery 2006b; Chen 2006; Haritoglou 2006; Mason 2006; Scott 2007; Spaide 2006),y ranibizumab (Chun 2006), que causan la regresión de la neovascularización, el edema macular, o ambos.
De qué manera podría funcionar la intervención
Los VEGF están presentes en el epitelio pigmentario retiniano, los pericitos y las células endoteliales de la retina. Los VEGF se liberan fisiológicamente cuando ocurre isquemia y estimulan la formación de vasos sanguíneos de neoformación. La hiperglucemia da lugar a hipoxia retiniana crónica y provoca la expresión excesiva de los VEGF que estimulan la formación de la neovascularización (Bussolati 2001), y causa vasculopatía en la retina.
Los fármacos anti‐VEGF selectivos inhiben solamente las isoformas VEGF específicas, el pegaptanib (un oligonucleótido modificado) inhibe solamente la isoforma VEGF 165. El bevacizumab y el ranibizumab (un fragmento del anticuerpo monoclonal humanizado murino) inhiben todas las isoformas de VEGF‐A. Algunos estudios mostraron que la administración intravitreal local de estos fármacos puede ser útil en el edema macular y la neovascularización aunque los anti‐VEGF pueden producir efectos adversos locales (en el 1,27% de los casos) como endoftalmitis (inflamación grave de las cavidades intraoculares generalmente causada por infección) (Shima 2008) y efectos adversos sistémicos (en el 1,5% de los casos) como elevación aguda de la presión arterial sistémica o accidente cerebrovascular (ACV) (Wu 2008).
Por qué es importante realizar esta revisión
A pesar del estándar de atención proporcionado para la prevención y el tratamiento de la RD, esta afección todavía es una causa importante de pérdida de la visión. Debido a lo anterior, se desarrollan líneas nuevas de tratamiento como los fármacos anti‐VEGF selectivos. Algunos de estos anti‐VEGF no tienen autorización para administrarse en la RD y se prescriben como fármacos sin prescripción o aún no aprobados, pero las pruebas que apoyan esta práctica no se han determinado de manera suficiente. Ha finalizado una revisión sistemática Cochrane sobre el edema macular diabético (EMD) (Virgili 2012). Es importante realizar una revisión sistemática que aclare la eficacia de los anti‐VEGF selectivos en la RDP. Además, se examinaron las pruebas de los ensayos controlados aleatorios (ECA) sobre los efectos perjudiciales de dicho tratamiento.
Objetivos
Evaluar la efectividad y la seguridad de los anti‐VEGF para la RDP.
Métodos
Criterios de inclusión de estudios para esta revisión
Tipos de estudios
Se incluyeron ECA sin ningún tipo de restricción de fecha o de idioma. Se excluyeron de la revisión los estudios que incluyeron el EMD como parte de la inclusión principal porque se evaluó en la revisión Cochrane Virgili 2012.
Tipos de participantes
Se incluyeron ensayos en adultos (18 años de edad o más) con RD proliferativa. Se incluyeron los participantes con RD al inicio, pero los criterios para ser seleccionado en los estudios no se basaron en presentar EMD.
Hubo dos grupos diferentes de pacientes con RD proliferativa: los pacientes que fueron elegibles para fotocoagulación láser y los pacientes elegibles para vitrectomía debido a hemorragia retiniana. Se consideró que estos dos grupos fueron suficientemente diferentes y que no tenía sentido desde el punto de vista clínico agrupar los resultados de estos estudios; por lo tanto, se consideraron por separado. Esta fue una decisión post hoc y no se planificó en el protocolo.
Tipos de intervenciones
Se incluyeron los estudios en los que los anti‐VEGF selectivos se compararon con otro tratamiento activo, tratamiento simulado o ningún tratamiento. También se incluyeron los estudios que evaluaron la combinación de los anti‐VEGF con otros tratamientos, por ejemplo, fotocoagulación.
Se hicieron dos comparaciones diferentes: anti‐VEGF en comparación con fotocoagulación panretinal (FPR) y anti‐VEGF como un complemento a la vitrectomía en comparación con vitrectomía sola.
Tipos de medida de resultado
Resultados primarios
Agudeza visual mejor corregida a los 12 meses.
Se utilizaron tres medidas:
-
pérdida de tres o más líneas de visión en los gráficos de agudeza visual del ETDRS;
-
ganancia de tres o más líneas de visión en los gráficos de agudeza visual del ETDRS.
Este cambio de tres líneas es equivalente a una duplicación del ángulo visual. En los estudios que no utilizaron el gráfico del ETDRS, se utilizó la medida de agudeza visual informada que se correspondió más estrechamente con una duplicación del ángulo visual.
También se consideró la agudeza visual media:
-
la agudeza visual corregida medida en una escala continua (agudeza visual logMAR o letras del ETDRS).
Resultados secundarios
-
La regresión de la RDP (es decir, la regresión de la neovascularización a un estadio inactivo como se definió por angiografía fluoresceínica [ausencia de pérdida] o examen clínico [nuevos vasos fibróticos y ausencia de hemorragia de los nuevos vasos] o cualquier el sistema de clasificación de la RD validado, como ETDRS o la escala ICRDS). Se midió la regresión mantenida al menos tres meses después de la última inyección.
-
Presencia de microaneurismas.
-
Presencia de hemorragia vítrea o prerretiniana.
-
Necesidad de fotocoagulación láser.
-
Necesidad de vitrectomía.
-
Pacientes con cualquier resultado adversos ocular o sistémico.
-
EMD.
-
Medidas de calidad de vida en cualquier escala validada.
-
Efectos adversos.
Results
Description of studies
See: Characteristics of included studies; Characteristics of excluded studies.
Results of the search
The electronic searches yielded 3400 references (Figure 1). After removing duplicates, we screened 2774 records and obtained the full‐text reports of 52 potentially relevant publications pertaining to 42 studies. We included 18 studies (Ahmadieh 2009; Ahn 2011; Cheema 2009; Cho 2010; Di Lauro 2010; DRCR.Net 2013; El‐Batarny 2008; Ergur 2009; Ernst 2012; Farahvash 2011; González 2009; Mirshahi 2008; Modarres 2009; Preti 2014; Ramos Filho 2011; Rizzo 2008; Sohn 2012; Zaman 2013), and excluded 19 studies (Arimura 2009; Fulda 2010; Genovesi‐Ebert 2007; Gonzalez 2006; Hattori 2010; Huang 2009; Ip 2012; Jiang 2009; Jorge 2006; Lanzagorta‐Aresti 2009; López‐López 2012; Michaelides 2010; Minnella 2008; Scott 2008; Shin 2009; Stergiou 2007; Tonello 2008; Yeh 2009; Zhou 2010). We have included five ongoing studies and will assess the data when results become available.

Results from searching for studies for inclusion in the review.
We contacted authors to obtain additional information (Cho 2010; Ernst 2012; Farahvash 2011; Ramos Filho 2011; Rizzo 2008). Three authors responded to our questions (Ernst 2012; Farahvash 2011; Ramos Filho 2011).
Included studies
Overall, we included data on 1005 participants from 18 RCTs in the review. Forty‐three per cent of participants were women and 57% were men, with a mean age of 56 years (range 44 to 71 years). The median number of participants per RCT was 40 (range 15 to 261).
Eight studies evaluated anti‐VEGF in people who needed PRP. In six of these studies, anti‐VEGF was combined with PRP and compared with PRP alone (Cho 2010; DRCR.Net 2013; Ergur 2009; Mirshahi 2008; Preti 2014; Ramos Filho 2011); two studies compared anti‐VEGF alone with PRP (Ernst 2012; González 2009). Five of these studies used bevacizumab (Cho 2010; Ergur 2009; Ernst 2012; Mirshahi 2008; Preti 2014); two studies used ranibizumab (DRCR.Net 2013; Ramos Filho 2011), and one study used pegaptanib (González 2009).
Nine studies evaluated anti‐VEGF as an adjunct to vitrectomy (Ahmadieh 2009; Ahn 2011; Di Lauro 2010; El‐Batarny 2008; Farahvash 2011; Modarres 2009; Rizzo 2008; Sohn 2012; Zaman 2013). All nine trials used bevacizumab.
One study evaluated bevacizumab applied during the course of cataract surgery to prevent progression of proliferative DR (Cheema 2009).
The primary outcome was visual acuity in five trials (Cho 2010; Ergur 2009; Ernst 2012; Preti 2014; Sohn 2012), incidence of vitreous haemorrhage in three trials (Ahmadieh 2009; Ahn 2011; Farahvash 2011), feasibility of the surgery in three trials (El‐Batarny 2008; Modarres 2009; Rizzo 2008), regression of PDR in two studies (González 2009; Mirshahi 2008), progression of DR and maculopathy in one trial (Cheema 2009), active neovascularisation in one trial (Ramos Filho 2011), cumulative probability of vitrectomy in one trial (DRCR.Net 2013), clearing of vitreous haemorrhage in one trial (Di Lauro 2010), severity of intraoperative bleeding in one trial (Farahvash 2011), and changes in contrast sensitivity in one trial (Preti 2014).
The median follow‐up of participants was six months (range 1 (Ahmadieh 2009) to 12 months (El‐Batarny 2008; Ernst 2012; Farahvash 2011)).
Only one trial specified the calculation of the sample size (DRCR.Net 2013). There was imbalance between groups at baseline in one trial (Sohn 2012). Participants in the control group were worse than the experimental group at baseline: two had visually significant cataract (one participant in each group), two had worsening ischaemia (control group), one had severe neovascular glaucoma (control group), and one had vitreous haemorrhage (control group).
Only five trials reported the sources of funding (DRCR.Net 2013; González 2009; Preti 2014; Ramos Filho 2011; Sohn 2012). One study was industry funded (González 2009), one study was funded by a mixture of government and industry (DRCR.Net 2013), and three studies were funded by government and non‐government organisations (Preti 2014; Ramos Filho 2011; Sohn 2012). The remaining studies did not report a funding source.
Excluded studies
We excluded 19 clinical trials (Arimura 2009; Fulda 2010; Genovesi‐Ebert 2007; Gonzalez 2006; Hattori 2010; Huang 2009; Ip 2012; Jiang 2009; Jorge 2006; Lanzagorta‐Aresti 2009; López‐López 2012; Michaelides 2010; Minnella 2008; Scott 2008; Shin 2009; Stergiou 2007; Tonello 2008; Yeh 2009; Zhou 2010). The Characteristics of excluded studies table shows the reasons for exclusion. Briefly, eight studies were prospective non‐randomised clinical trials (Fulda 2010; Genovesi‐Ebert 2007; Hattori 2010; Huang 2009; Jorge 2006; López‐López 2012; Minnella 2008; Yeh 2009), four studies were retrospective (Arimura 2009; Jiang 2009; Shin 2009; Stergiou 2007), four trials were in people with macular oedema (Gonzalez 2006; Ip 2012; Michaelides 2010; Zhou 2010), one study had methodological issues (Scott 2008), one trial was in non‐PDR (Lanzagorta‐Aresti 2009), and one trial was partially randomised (Tonello 2008).
Risk of bias in included studies
Figure 2 and Figure 3 show the risk of bias in included studies.
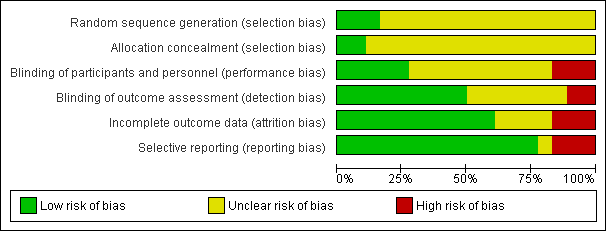
Risk of bias graph: review authors' judgements about each risk of bias item presented as percentages across all included studies.

Risk of bias summary: review authors' judgements about each risk of bias item for each included study.
Allocation
Three studies reported methods of sequence generation that we considered were low risk of bias with mention of computer‐generated random allocation lists (Ahmadieh 2009; González 2009), and use of random number tables (Rizzo 2008). The remaining studies did not report how they generated the allocation in enough detail to enable us to judge.
Only two studies reported adequate methods of allocation concealment. One study had a central online randomisation system (DRCR.Net 2013), and one study used sealed opaque envelopes (Ramos Filho 2011). The remainder of the studies did not report allocation.
Blinding
Five studies reported blinding of participants, personnel and outcome assessors, usually by means of a sham injection or procedure (Ahmadieh 2009; Di Lauro 2010; Mirshahi 2008; Sohn 2012), but in one study, both interventions were delivered by injection and these were identified by number only (DRCR.Net 2013). A further four studies reported blinding outcome assessors only (Cheema 2009; Farahvash 2011; Modarres 2009; Ramos Filho 2011). We judged three studies to be at high risk of bias for blinding because they were not blinded (open label) and the interventions were different (Ahn 2011; Ernst 2012; González 2009).
Incomplete outcome data
Most studies did not appear to have a problem with incomplete outcome data but, for some studies, it was not clearly reported (Di Lauro 2010; Modarres 2009; Preti 2014; Rizzo 2008), and three studies had relatively high loss to follow‐up so we judged them to be at high risk of attrition bias (Ahmadieh 2009; Ernst 2012; Ramos Filho 2011).
Selective reporting
For most studies, we considered selective outcome reporting was not a problem because they reported the main outcomes expected or mentioned them in the methods section of the paper. We judged three studies to be at high risk of bias for selective reporting because the outcomes were reported incompletely (Cho 2010), or differed to those stated in the protocol (Ernst 2012), or on the trials register (Preti 2014); for one study, this information was unclear (Rizzo 2008).
Effects of interventions
See: Summary of findings for the main comparison Anti‐VEGF with or without laser (panretinal photocoagulation; PRP) compared with PRP alone for proliferative diabetic retinopathy; Summary of findings 2 Bevacizumab before or during vitrectomy compared with vitrectomy alone
Comparison 1: anti‐vascular endothelial growth factor with or without panretinal photocoagulation versus panretinal photocoagulation alone
1.1 Loss of 3 or more lines of ETDRS visual acuity
One study reported loss of visual acuity measured as a dichotomous outcome (Cho 2010). The study reported a cut‐point of loss of 2 or more lines at three months and used intravitreal bevacizumab as an adjunct to PRP (injected one week before laser treatment) and compared with PRP alone.
Participants who received anti‐VEGF before PRP were less likely to lose visual acuity compared with participants who did not (RR 0.19, 95% CI 0.05 to 0.81; 61 participants).
1.2 Gain of 3 or more lines of ETDRS visual acuity
One study reported gain of visual acuity measured as a dichotomous outcome (Cho 2010). The study reported a cut‐point of loss of 2 or more lines at three months and used intravitreal bevacizumab as an adjunct to PRP (injected one week before laser treatment) and compared with PRP alone.
People who received anti‐VEGF were more likely to gain visual acuity but the CIs were wide and compatible with no effect (RR 6.78, 95% CI 0.37 to 125.95; 61 participants).
1.3 Mean visual acuity
Five trials contributed to the analyses of mean visual acuity. We planned to collect data on final visual acuity at follow‐up. Two studies reported change in visual acuity from baseline and we included this in the analysis (González 2009; Ramos Filho 2011).
Two of the trials used intravitreal bevacizumab (Cho 2010; Ergur 2009), one trial used intravitreal pegaptanib (González 2009), and two trials used ranibizumab (DRCR.Net 2013; Ramos Filho 2011). Three trials used bevacizumab as an adjunct to PRP (injected at the same time or up to three weeks before PRP) compared with PRP alone (Cho 2010; Ergur 2009; Ramos Filho 2011). One trial compared pegaptanib injected every six weeks for 30 weeks with treatment with PRP (González 2009). One trial compared three injections of ranibizumab at baseline, four and eight weeks with an injection of saline; both groups also received PRP (DRCR.Net 2013).
Mean visual acuity was reported at three months (Cho 2010), four months (DRCR.Net 2013), six months (Ergur 2009), nine months (González 2009), and 12 months (Ramos Filho 2011).
People who received anti‐VEGF on average had better visual acuity at follow‐up compared with people who received PRP alone (MD ‐0.07 logMAR, 95% CI ‐0.12 to ‐0.02; 373 participants; Analysis 1.1;Figure 4).
![Forest plot of comparison: 1 Anti‐vascular endothelial growth factor (anti‐VEGF) versus photocoagulation, outcome: 1.3 Visual acuity [logMAR].](/cdsr/doi/10.1002/14651858.CD008721.pub2/media/CDSR/CD008721/rel0002/CD008721/image_n/nCD008721-AFig-FIG04.png)
Forest plot of comparison: 1 Anti‐vascular endothelial growth factor (anti‐VEGF) versus photocoagulation, outcome: 1.3 Visual acuity [logMAR].
Overall, there was no evidence for heterogeneity (I2 = 0%) and no evidence for any difference according to type of anti‐VEGF (test for subgroup differences P value = 0.37).
1.4 Regression of proliferative diabetic retinopathy (dichotomous outcome)
None of the studies reported regression of PDR (dichotomous outcome).
1.5 Regression of proliferative diabetic retinopathy (mean area of fluorescein leakage)
People who received bevacizumab in addition to PRP had more regression of PDR, as measured by area of fluorescein leakage, at six months compared with people who had PRP alone (MD ‐8.13 mm2, 95% CI ‐10.94 to ‐5.32; 19 participants; Analysis 1.2; Ergur 2009).
People who received ranibizumab in addition to PRP had more regression of PDR, as measured by change in area of fluorescein leakage between baseline and 12 months, compared with people who had PRP alone; however, the size of the effect was smaller and the CIs were compatible with no effect or less regression (MD ‐1.0 mm2, 95% CI ‐5.3 to 3.3; 20 participants; Analysis 1.2; Ramos Filho 2011).
Overall, there was considerable heterogeneity (I2 = 86%) and we did not pool the data of the two studies. It was unclear whether or not the differences between the estimates reflected differences in the interventions or comparators, length of follow‐up or some other attributes of these studies. Intravitreal bevacizumab (1.25 mg) was injected 20 days before three sessions of PRP and compared with PRP alone (Ergur 2009). Ranibizumab 0.5 mg was injected 60 minutes before PRP and compared with PRP alone (Ramos Filho 2011).
1.6 Presence of microaneurysms
None of the studies reported presence of microaneurysms.
1.7 Presence of vitreous or pre‐retinal haemorrhage
Three trials reported on the presence of vitreous or pre‐retinal haemorrhage. One of these trials used intravitreal bevacizumab (Cho 2010), one trial used intravitreal pegaptanib (González 2009), and one trial used ranibizumab (DRCR.Net 2013). Bevacizumab was used as an adjunct to PRP (injected at the same time or up to one week before PRP) and compared with PRP alone (Cho 2010). Pegaptanib was injected every six weeks for 30 weeks and compared with treatment with PRP (González 2009). Three injections of ranibizumab at baseline, four and eight weeks were compared with an injection of saline; both groups also received PRP (DRCR.Net 2013).
People who received anti‐VEGF were less likely to present with vitreous or pre‐retinal haemorrhage compared with people that received PRP (overall pooled RR 0.32, 95% CI 0.16 to 0.65; 342 participants; Analysis 1.3).
Overall there was no evidence for heterogeneity (I2 = 0%) and no evidence of any difference according to type of anti‐VEGF (test for subgroup differences P value = 0.67).
1.8 Need for laser photocoagulation
None of the studies reported need for laser photocoagulation.
1.9 Need for vitrectomy
We only found one relevant trial that reported need for vitrectomy (DRCR.Net 2013). Eyes with vitreous haemorrhage due to PDR that received ranibizumab were less likely to need vitrectomy by four months compared with eyes that received saline but the CIs were wide and compatible with no effect or increased risk of need for vitrectomy (RR 0.74, 95% CI 0.40 to 1.36; 261 participants).
1.10 Diabetic macular oedema
One trial reported DMO at six months (Ergur 2009). People who received bevacizumab were less likely to develop DMO but the CIs were wide and compatible with no effect or reduced risk of developing DMO (RR 0.14, 95% CI 0.01 to 2.45; 30 participants).
1.11 Quality of life
No studies reported quality of life.
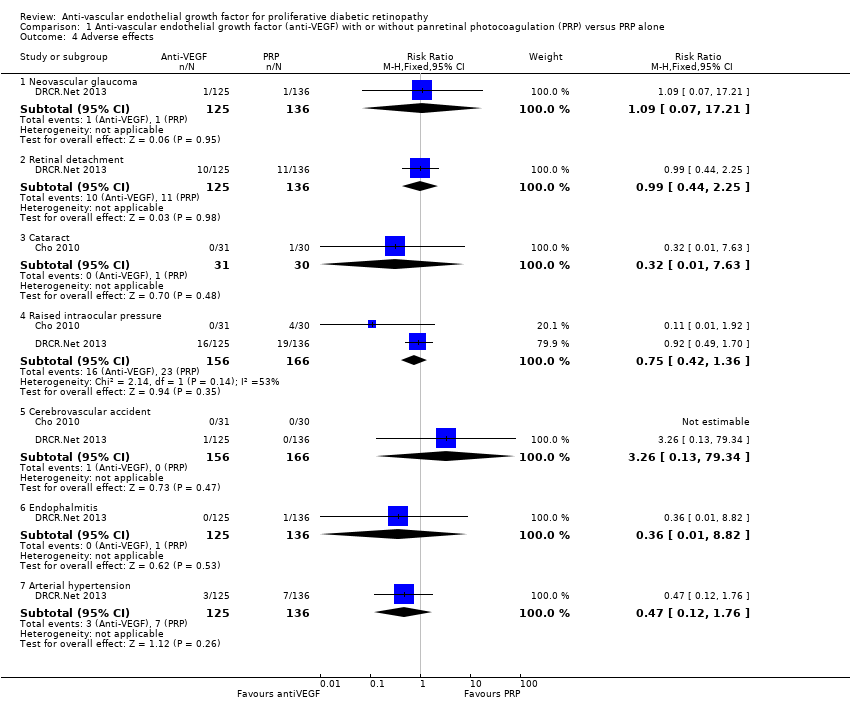
1.12 Adverse effects
One study of bevacizumab (Cho 2010), and two of ranibizumab (DRCR.Net 2013; Ramos Filho 2011) reported adverse events. See Analysis 1.4.
Neovascular glaucoma
One trial reported neovascular glaucoma (DRCR.Net 2013). One person in each arm of the study developed neovascular glaucoma (RR 1.09, 95% CI 0.07 to 17.21; 261 participants).
Retinal detachment
One trial reported retinal detachment (DRCR.Net 2013). Similar numbers of people developed retinal detachment in the ranibizumab and saline groups (10/125 with ranibizumab versus 11/136 with saline; RR 0.99, 95% CI 0.44 to 2.25; 261 participants).
Cataract
One trial reported cataract (Cho 2010). People who received anti‐VEGF were less likely to develop cataract compared with people who did not receive anti‐VEGF, but the CIs were wide and compatible with no effect or increased risk of cataract (RR 0.32, 95% CI 0.01 to 7.63; 61 participants).
Raised intraocular pressure
Two trials reported increase of intraocular pressure (IOP) (322 participants) (DRCR.Net 2013; Cho 2010).
People who received bevacizumab were less likely to have developed increased IOP at three months compared with people who did not receive anti‐VEGF, but the CIs were wide and compatible with no effect or increased risk of increased IOP (RR 0.11, 95% CI 0.01 to 1.92; 61 participants; Cho 2010).
The risk of raised IOP was similar between the eyes that received ranibizumab and eyes that received saline (RR 0.92, 95% CI 0.49 to 1.70; 261 participants; DRCR.Net 2013).
Cerebrovascular accident
Two trials reported CVA (DRCR.Net 2013; Cho 2010). The two trials reported only one case of CVA in the anti‐VEGF group in DRCR.Net 2013 (RR 3.26, 95% CI 0.13 to 79.34; 322 participants).
Endophthalmitis
One trial reported endophthalmitis (DRCR.Net 2013). There was only one case of endophthalmitis, which was in the saline group (RR 0.36, 95% CI 0.01 to 8.82; 261 participants).
Arterial hypertension
One trial reported arterial hypertension (DRCR.Net 2013). People who received anti‐VEGF were less likely to develop arterial hypertension compared with people who did not receive anti‐VEGF, but the CIs were wide and compatible with no effect or increased risk of arterial hypertension (RR 0.47, 95% CI 0.12 to 1.76; 261 participants).
Pain
One trial reported pain, which was measured on a 100‐mm visual analogue scale (Ramos Filho 2011). People receiving ranibizumab intravitreal injection reported a mean pain score of 4.7 (SD 8.4), which was much lower than people receiving PRP who reported a mean pain score of 60.8 (SD 29.2). This gave an MD of ‐56.1 (95% CI ‐71.9 to ‐40.3; 31 participants) in favour of ranibizumab intravitreal injection.
Comparison 2: anti‐vascular endothelial growth factor with vitrectomy compared with vitrectomy alone
Nine trials investigated the use of anti‐VEGF with vitrectomy. All of these studies used bevacizumab.
Three of these studies used a sham injection in addition to vitrectomy in the control group (Ahmadieh 2009; Di Lauro 2010; Sohn 2012), in the other six trials the control intervention was vitrectomy alone.
2.1 Loss of 3 or more lines of ETDRS visual acuity
Three studies reported loss of visual acuity measured as a dichotomous outcome. One of the studies used the cut‐point loss of 3 or more lines (Sohn 2012); but the other two studies reported a "deterioration", which was not defined (El‐Batarny 2008; Zaman 2013). All studies used intravitreal bevacizumab as an adjunct to vitrectomy (injected three to seven days before) and compared it with vitrectomy alone or vitrectomy plus sham injection.
People receiving bevacizumab before vitrectomy were less likely to lose vision, but the CIs were wide and compatible with no effect or increased risk of losing vision (RR 0.49, 95% CI 0.08 to 3.14; 94 participants; I2 = 0%) (Analysis 2.1).
2.2 Gain of 3 or more lines of ETDRS visual acuity
Three studies reported gain of visual acuity measured as a dichotomous outcome. One of the studies used the cut‐point gain of 3 or more lines (Sohn 2012); but the other two studies reported "improvement", which was not defined (El‐Batarny 2008; Zaman 2013). All studies used intravitreal bevacizumab as an adjunct to vitrectomy (injected three to seven days before) and compared it with vitrectomy alone or vitrectomy plus sham injection.
People who received bevacizumab before vitrectomy were more likely to gain visual acuity compared with people that received vitrectomy alone (RR 1.62, 95% CI 1.20 to 2.17; 94 participants; Analysis 2.2). There was inconsistency in the results of the individual trials (I2 = 73%) with the RR varying from 1.08 to 3.0, but as all effects were in the same direction we presented a pooled estimate.
2.3 Mean visual acuity
Six trials reported mean visual acuity (Ahmadieh 2009; Ahn 2011; Di Lauro 2010; El‐Batarny 2008; Modarres 2009; Sohn 2012).
On average, people receiving bevacizumab before or during vitrectomy had better vision at follow‐up (between 2 and 3 lines better), but the CIs were wide and compatible with no effect of treatment (MD ‐0.24 logMAR, 95% CI ‐0.50 to 0.01; 335 participants; 6 studies; Analysis 2.3; Figure 5).
![Forest plot of comparison: 2 Anti‐vascular endothelial growth factor (anti‐VEGF) plus surgery versus surgery alone or surgery plus sham or placebo, outcome: 2.3 Visual acuity [logMAR].](/cdsr/doi/10.1002/14651858.CD008721.pub2/media/CDSR/CD008721/rel0002/CD008721/image_n/nCD008721-AFig-FIG05.png)
Forest plot of comparison: 2 Anti‐vascular endothelial growth factor (anti‐VEGF) plus surgery versus surgery alone or surgery plus sham or placebo, outcome: 2.3 Visual acuity [logMAR].
Overall there was substantial heterogeneity (I2 = 67%) but most of the studies found in favour of bevacizumab.
2.4 Regression of proliferative diabetic retinopathy
None of the studies reported regression of PDR.
2.5 Regression of proliferative diabetic retinopathy (mean area of fluorescein leakage)
None of the studies reported regression of PDR (mean area of fluorescein leakage).
2.6 Presence of microaneurysms
None of the studies reported presence of microaneurysms.
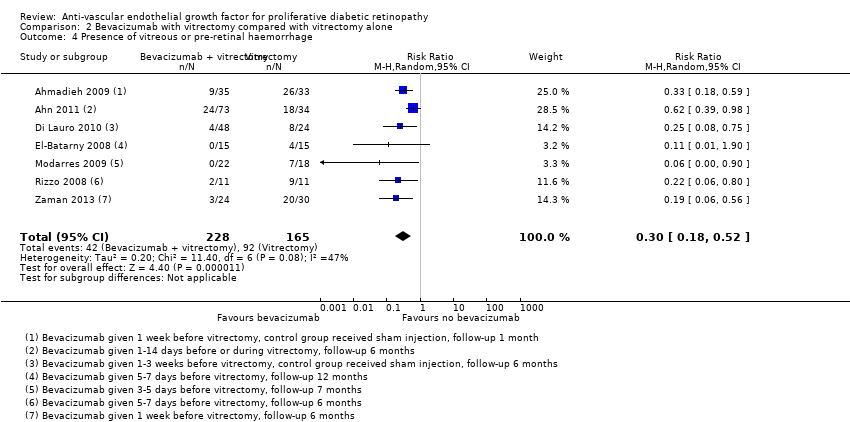
2.7 Presence of vitreous or pre‐retinal haemorrhage
Seven trials reported presence of vitreous or pre‐retinal haemorrhage (Ahmadieh 2009; Ahn 2011; Di Lauro 2010; El‐Batarny 2008; Modarres 2009; Rizzo 2008; Zaman 2013). All trials used intravitreal bevacizumab as an adjunct to vitrectomy (injected perioperatively or up to three weeks before, or both) and compared it with vitrectomy alone or vitrectomy plus sham injection.
People who received bevacizumab before or during vitrectomy were less likely to have vitreous or pre‐retinal haemorrhage at follow‐up compared with people who had vitrectomy alone (overall pooled RR 0.30, 95% CI 0.18 to 0.52; 393 participants; Analysis 2.4). Overall there was some heterogeneity (I2 = 47%).
2.8 Need for laser photocoagulation
None of the studies reported need for laser photocoagulation.
2.9 Need for vitrectomy
Need for vitrectomy was not relevant, as participants had vitrectomy.
2.10 Diabetic macular oedema
None of the studies reported DMO.
2.11 Quality of life
None of the studies reported quality of life.
2.13 Adverse effects
See Analysis 2.5.
Neovascular glaucoma
One trial reported neovascular glaucoma (Ahn 2011). People who received anti‐VEGF were more likely to develop neovascular glaucoma compared with people who did not receive anti‐VEGF, but the CIs were wide and compatible with no effect or reduced risk of neovascular glaucoma (RR 2.33, 95% CI 0.28 to 19.17; 107 participants).
Retinal detachment
Three trials reported retinal detachment (Ahn 2011; Farahvash 2011; Modarres 2009). People who received anti‐VEGF were less likely to develop retinal detachment compared with people who did not receive anti‐VEGF, but the CIs were wide and compatible with no effect or reduced risk of retinal detachment (RR 0.56, 95% CI 0.11 to 2.86; 182 participants; I2 = 0%).
Cataract
Two trials reported cataract (Ahn 2011; El‐Batarny 2008). People who received anti‐VEGF were less likely to develop cataract compared with people who did not receive anti‐VEGF, but the CIs were wide and compatible with no effect or increased risk of cataract (RR 0.68, 95% CI 0.38 to 1.23; 137 participants; I2 = 0%).
Raised intraocular pressure
One trial reported IOP (Ahmadieh 2009). People who received anti‐VEGF were less likely to develop increased IOP compared with people who did not receive anti‐VEGF, but the CIs were wide and compatible with no effect or increased risk of increased IOP (RR 0.31, 95% CI 0.01 to 7.47; 68 participants).
Myocardial infarction
Two trials reported myocardial infarction (MI) (Ahmadieh 2009; Ahn 2011). There were no events in these trials (175 participants).
Cerebrovascular accident
Two trials reported CVA (Ahmadieh 2009; Ahn 2011). There were no events (175 participants).
Endophthalmitis
None of the studies reported endophthalmitis.
Arterial hypertension
None of the studies reported arterial hypertension.
Pain
None of the studies reported pain.
Comparison 3: anti‐vascular endothelial growth factor with cataract surgery compared with cataract surgery alone
Only one trial considered the use of anti‐VEGF (bevacizumab) for PDR at the time of cataract surgery in 88 eyes with DR (Cheema 2009).
At six months after surgery, there was little difference in visual acuity. The mean logMAR acuity in the bevacizumab group was 0.57 (SD 0.47) compared with a mean visual acuity in the non‐bevacizumab group of 0.56 (SD 0.48) (MD 0.01, 95% CI ‐0.22 to 0.24). Twenty of 35 people in the bevacizumab group required further laser treatment compared with 16/33 people of the non‐bevacizumab group (RR 1.18, 95% CI 0.75 to 1.86).
None of the other outcomes was reported.
Sensitivity analysis: random‐effects models versus fixed‐effect models
Choice of model did not affect the conclusions with the exception of analysis 2.3 (mean visual acuity in trials of bevacizumab with vitrectomy). The 95% CIs of the pooled effect estimate from the fixed‐effect model did not include zero (null value).
| Analysis | Measure of effect in random‐effects models (95% CI) | Measure of effect in fixed‐effect models |
| MD ‐0.07 logMAR (‐0.12 to ‐0.02) | MD ‐0.07 logMAR (‐0.12 to ‐0.02) | |
| MD ‐0.24 logMAR (‐0.50 to 0.01) | MD ‐0.19 logMAR (‐0.32 to ‐0.06) | |
| RR 0.30 (0.18 to 0.52) | RR 0.32 (0.24 to 0.45) |
CI: confidence intervals; MD: mean difference; RR: risk ratio.
Sensitivity analysis: low risk of bias versus high risk of bias
For Analysis 1.1 and Analysis 2.3 (mean visual acuity) there was little difference between the estimates according to risk of bias in studies. For Analysis 1.3, it was difficult to interpret, as there was only one low risk of bias trial and there may be other differences between this study and the other studies. For Analysis 2.4, there was a difference between the low risk of bias and high risk of bias trials but it was not in the anticipated direction (i.e. the low risk of bias trials appeared to demonstrate a larger effect). However, with only two RCTs in the high risk of bias group, this result must be interpreted cautiously.
| Analysis | Measure of effect in studies at low or unclear risk of bias in all domains (95% CI) | Measure of effect in studies at high risk of bias in ≥ 1 domains (95% CI) |
| MD ‐0.10 logMAR (‐0.24 to 0.05); 2 RCTs | MD ‐0.06 logMAR (‐0.12 to ‐0.01); 3 RCTs | |
| RR 0.38 (0.18 to 0.81); 1 RCT | RR 0.14 (0.02 to 1.08); 2 RCTs | |
| MD ‐0.29 logMAR (‐0.47 to ‐0.11); 4 RCTs | MD ‐0.20 logMAR (‐0.87 to 0.48); 2 RCTs | |
| RR 0.20 (0.10 to 0.37); 5 RCTs | RR 0.46 (0.25 to 0.87); 2 RCTs |
CI: confidence intervals; MD: mean difference; RCT: randomised controlled trial; RR: risk ratio.
Discusión
Resumen de los resultados principales
El objetivo de esta revisión fue evaluar la efectividad y la seguridad del anti‐VEGF en la RDP. Se incluyeron 18 ECA con 1005 participantes que necesitaban tratamiento láser o quirúrgico para la RDP o las complicaciones de la RDP.
Los pacientes que recibieron anti‐VEGF en conjunto con tratamiento láser o quirúrgico (vitrectomía) para la RDP tuvieron menores probabilidades de perder visión y más probabilidades de ganar visión y, como promedio, tuvieron mejor agudeza visual al seguimiento. Tuvieron menores probabilidades de progresión de la RD y fue menos probable que presentaran hemorragia vítrea o prerretiniana. El tamaño de los efectos fue de la misma magnitud para la administración de anti‐VEGF en conjunto con tratamiento láser y quirúrgico. Solamente hubo un ensayo relativamente pequeño y no concluyente de la administración de anti‐VEGF en el momento de la cirugía por catarata en los pacientes con RD.
Compleción y aplicabilidad general de las pruebas
Los participantes incluidos en la revisión presentaron RDP que necesitó FPR (ocho de 18 ECA) o complicaciones como hemorragia vítrea (nueve de 18 ECA) o cataratas que necesitaron cirugía (uno de 18 ECA). La mediana del seguimiento fue de seis meses.
Se incluyeron algunos estudios que evaluaron el resultado primario (ganancia o pérdida de tres o más líneas del ETDRS). Los efectos de la regresión de la proliferación vascular se informaron de manera deficiente y no se mencionó la calidad de vida. Además, la monitorización de los participantes fue menor de un año en la mayoría de los estudios. Sin embargo, hubo un número suficiente de estudios que calcularon la agudeza visual en logMAR (13 ECA y 811 ojos) y presentaron datos acerca de la hemorragia vítrea o prerretiniana (10 ECA y 735 ojos).
El número de ECA fue variable entre los anti‐VEGF y bevacizumab (15 ECA) fue el más evaluado, seguido de ranibizumab (dos ECA) y pegaptanib (un ECA). Aunque el nivel de la evaluación de estos fármacos no fue el mismo, en el análisis general no hubo diferencias significativas entre los subgrupos en la agudeza visual y la hemorragia vítrea o prerretiniana.
Los resultados preespecificados en esta revisión fueron para el seguimiento de 12 meses. Sólo dos de los 18 estudios incluidos tuvieron un seguimiento de hasta 12 meses. No se encontraron pruebas de que el tamaño del efecto estuviera relacionado con la duración del seguimiento (no se mostraron datos) pero, de manera ideal, habría estado disponible el seguimiento más largo.
Se encontraron cinco ECA en curso que en el futuro pueden resolver las dudas acerca de la eficacia y la seguridad de estos fármacos para la RDP ("Características de los estudios en curso").
Calidad de la evidencia
La calidad general de las pruebas era baja o muy baja en esta revisión. Para el resultado principal de agudeza visual mejor corregida a los 12 meses, la calidad de las pruebas se disminuyó a "muy baja" debido a que fue una evaluación indirecta. En realidad, ningún estudio informó la pérdida / ganancia de tres o más líneas a los 12 meses. Dos estudios la informaron a los tres meses, uno de estos estudios informó la pérdida / ganancia de dos o más líneas y un estudio informó la pérdida / ganancia de tres o más líneas; dos estudios informaron "deterioro", que no se definió, uno a los seis meses y uno a los 12 meses. Las estimaciones poco precisas del beneficio visual también fueron una razón para la disminución de las pruebas en las presentaciones de los resultados primarios.
Para otros resultados se disminuyó la calidad de las pruebas porque siete ECA tuvieron alto riesgo de sesgo. El alto riesgo de sesgo se debió a la falta de enmascaramiento de las intervenciones (Ahn 2011; Ernst 2012; González 2009), el sesgo de desgaste (Ahmadieh 2009; Ernst 2012; Ramos Filho 2011), y el informe selectivo (Ahmadieh 2009; Cho 2010; Preti 2014). Además, sólo un ensayo especificó el cálculo del tamaño de la muestra (DRCR.Net 2013), y hubo desequilibrio entre los grupos al inicio en un ensayo (Sohn 2012), y los participantes del grupo control estaban peor que los participantes del grupo experimental al inicio.
Finalmente, para algunos resultados, los resultados de los estudios individuales fueron heterogéneos y, aunque se proporcionó una estimación agrupada, se disminuyó por la inconsistencia.
Sesgos potenciales en el proceso de revisión
Esta revisión tiene fortalezas metodológicas, ya que logró con éxito obtener información de los investigadores de los ensayos. Aunque no todos respondieron, la mayoría de los investigadores lo hizo. También se realizó una búsqueda exhaustiva de los ensayos clínicos (incluidos los ensayos en progreso) y se evaluó el riesgo de sesgo y se extrajeron los datos de forma duplicada.
Sin embargo, esta revisión está limitada por la calidad de los ECA, que incluyeron un escaso número de participantes y tuvieron riesgo de sesgo incierto o alto. Además, tres estudios no se incluyeron en el análisis de eficacia porque el otro ojo se utilizó como grupo control (Ernst 2012; Mirshahi 2008; Preti 2014).
Se hicieron algunas modificaciones al protocolo ("Diferencias entre el protocolo y la revisión"), pero no se considera que estos cambios hayan introducido sesgo.
Acuerdos y desacuerdos con otros estudios o revisiones
Hasta donde se sabe, no hay otra revisión sistemática que haya evaluado los anti‐VEGF generales para la RDP. Se encontraron dos revisiones sistemáticas que evaluaron anti‐VEGF como complemento a la vitrectomía para la RDP (Zhang 2013; Smith 2011). Zhang 2013 incluyó ocho ECA que evaluaron la eficacia y la seguridad de bevacizumab a corto plazo (menos de un mes). Los resultados agrupados mostraron efectos beneficiosos significativos de bevacizumab en el tiempo quirúrgico general, menos hemorragia intraoperatoria y menos hemorragia recurrente en el transcurso del primer mes. La revisión sistemática Cochrane, Smith 2011, incluyó cuatro ECA, pero los resultados de los estudios no se agruparon debido a problemas metodológicos. Sin embargo, los autores concluyeron que bevacizumab puede reducir la incidencia de hemorragia postoperatoria temprana de la cavidad vítrea.
La presente revisión incluyó no solamente los estudios sobre las complicaciones de la RD que necesitaron cirugía, sino también los que intentaron tratar la proliferación vascular. Por estas razones, esta revisión sistemática presentó un mayor número de estudios y de participantes incluidos. Los resultados señalan en la misma dirección de Zhang 2013. Sin embargo, la calidad de las pruebas fue baja o muy baja y estos resultados deben ser tratados con precaución.

Results from searching for studies for inclusion in the review.

Risk of bias graph: review authors' judgements about each risk of bias item presented as percentages across all included studies.

Risk of bias summary: review authors' judgements about each risk of bias item for each included study.
![Forest plot of comparison: 1 Anti‐vascular endothelial growth factor (anti‐VEGF) versus photocoagulation, outcome: 1.3 Visual acuity [logMAR].](/es/cdsr/doi/10.1002/14651858.CD008721.pub2/media/CDSR/CD008721/rel0002/CD008721/image_n/nCD008721-AFig-FIG04.png)
Forest plot of comparison: 1 Anti‐vascular endothelial growth factor (anti‐VEGF) versus photocoagulation, outcome: 1.3 Visual acuity [logMAR].
![Forest plot of comparison: 2 Anti‐vascular endothelial growth factor (anti‐VEGF) plus surgery versus surgery alone or surgery plus sham or placebo, outcome: 2.3 Visual acuity [logMAR].](/es/cdsr/doi/10.1002/14651858.CD008721.pub2/media/CDSR/CD008721/rel0002/CD008721/image_n/nCD008721-AFig-FIG05.png)
Forest plot of comparison: 2 Anti‐vascular endothelial growth factor (anti‐VEGF) plus surgery versus surgery alone or surgery plus sham or placebo, outcome: 2.3 Visual acuity [logMAR].

Comparison 1 Anti‐vascular endothelial growth factor (anti‐VEGF) with or without panretinal photocoagulation (PRP) versus PRP alone, Outcome 1 Visual acuity.

Comparison 1 Anti‐vascular endothelial growth factor (anti‐VEGF) with or without panretinal photocoagulation (PRP) versus PRP alone, Outcome 2 Regression of proliferative diabetic retinopathy.

Comparison 1 Anti‐vascular endothelial growth factor (anti‐VEGF) with or without panretinal photocoagulation (PRP) versus PRP alone, Outcome 3 Presence of vitreous or pre‐retinal haemorrhage.
Comparison 1 Anti‐vascular endothelial growth factor (anti‐VEGF) with or without panretinal photocoagulation (PRP) versus PRP alone, Outcome 4 Adverse effects.

Comparison 2 Bevacizumab with vitrectomy compared with vitrectomy alone, Outcome 1 Loss of 3 or more lines of ETDRS visual acuity.

Comparison 2 Bevacizumab with vitrectomy compared with vitrectomy alone, Outcome 2 Gain of 3 or more lines of ETDRS visual acuity.

Comparison 2 Bevacizumab with vitrectomy compared with vitrectomy alone, Outcome 3 Visual acuity.
Comparison 2 Bevacizumab with vitrectomy compared with vitrectomy alone, Outcome 4 Presence of vitreous or pre‐retinal haemorrhage.

Comparison 2 Bevacizumab with vitrectomy compared with vitrectomy alone, Outcome 5 Adverse effects.
| Anti‐VEGF with or without laser (panretinal photocoagulation; PRP) compared with PRP alone for proliferative diabetic retinopathy | |||||
| Patient or population: people with PDR Settings: hospital Intervention: anti‐VEGF with or without PRP Comparison: PRP | |||||
| Outcomes | Illustrative comparative risks* (95% CI) | Relative effect | No of participants | Quality of the evidence | |
| Assumed risk | Corresponding risk | ||||
| PRP | Anti‐VEGF with or without PRP | ||||
| Loss of ≥ 3 lines of ETDRS visual acuity | 300 per 1000 | 57 per 1000 (15 to 243) | RR 0.19 (0.05 to 0.81) | 61 (1 study) | ⊕⊝⊝⊝ |
| Gain of ≥ 3 lines of ETDRS visual acuity | 10 per 1000 | 68 per 1000 (4 to 1260) | RR 6.78 (0.37 to 125.95) | 61 (1 study) | ⊕⊕⊝⊝ |
| Visual acuity (logMAR scale value of 0 = 6/6 vision, higher score = worse vision) Follow‐up: 12 months | The mean visual acuity ranged across control groups from | The mean visual acuity in the intervention groups was | ‐ | 373 (5 studies) | ⊕⊕⊝⊝ |
| Regression of proliferative diabetic retinopathy (as measured by area of fluorescein leakage) Follow‐up: 12 months | In 1 trial, people who received bevacizumab in addition to PRP had more regression of PDR, as measured by area of fluorescein leakage at 6 months compared with people who had PRP alone (MD ‐8.13 mm2, 95% CI ‐10.94 mm2 to ‐5.32 mm2, 19 participants). In another trial, people who received ranibizumab in addition to PRP had more regression of PDR, as measured by change in area of fluorescein leakage between baseline and 12 months compared with people who had PRP alone, however, the size of the effect was smaller and the CIs were compatible with no effect, or less regression (MD ‐1.0 mm2, 95% CI ‐5.3 mm2 to 3.3 mm2, 20 participants) | ||||
| Presence of vitreous/pre‐retinal haemorrhage Follow‐up: 12 months | 150 per 1000 | 48 per 1000 (24 to 98) | RR 0.32 (95% CI 0.16 to 0.65) | 342 (3 studies) | ⊕⊕⊝⊝ |
| Quality of life | No data reported on quality of life | ||||
| Adverse effects | Adverse effects were reported in 3 studies: 1 study of bevacizumab plus PRP compared with PRP alone and followed up to 3 months (61 participants); 1 study of ranibizumab compared with saline (both groups received PRP if indicated) and followed up to 4 months (261 participants); 1 study of ranibizumab plus PRP compared with PRP alone and followed up to 12 months (31 participants)
| ||||
| *The basis for the assumed risk (e.g. the median control group risk across studies) is provided in footnotes. The corresponding risk (and its 95% confidence interval) is based on the assumed risk in the comparison group and the relative effect of the intervention (and its 95% CI). GRADE Working Group grades of evidence | |||||
| 1 Downgraded for risk of bias (‐1) (study at high risk of selective reporting bias) imprecision (‐1) (wide CIs) and indirectness (‐1) (study reported gain/loss of ≥ 2 lines at 3 months only). 3 Downgraded for risk of bias (‐1) (2 studies at high risk of bias in ≥ 1 domain) and downgraded for indirectness (‐1) (no study reported at 12 months). | |||||
| Bevacizumab before or during vitrectomy compared with vitrectomy alone | |||||
| Patient or population: people undergoing vitrectomy for PDR Settings: hospital Intervention: bevacizumab before or during vitrectomy Comparison: vitrectomy alone or vitrectomy with sham injection | |||||
| Outcomes | Illustrative comparative risks* (95% CI) | Relative effect | No of participants | Quality of the evidence | |
| Assumed risk | Corresponding risk | ||||
| Surgery | Anti‐VEGF plus surgery | ||||
| Loss of ≥ 3 lines of ETDRS visual acuity Follow‐up: 12 months | 60 per 1000 | 29 per 1000 | RR 0.49 | 94 | ⊕⊕⊝⊝ |
| Gain of ≥ 3 lines of ETDRS visual acuity Follow‐up: 12 months | 500 per 1000 | 810 per 1000 | RR 1.62 | 94 | ⊕⊕⊝⊝ |
| Visual acuity logMAR Follow‐up: 12 months | The mean visual acuity ranged across control groups from | The mean visual acuity in the intervention groups was | ‐ | 335 | ⊕⊕⊝⊝ |
| Regression of PDR (as measured by area of fluorescein leakage) Follow‐up: 12 months | No data reported on regression of PDR | ||||
| Presence of vitreous/pre‐retinal haemorrhage Follow‐up: 12 months | 500 per 1000 | 150 per 1000 (90 to 260) | RR 0.30 (0.18 to 0.52) | 393 (7 studies) | ⊕⊕⊝⊝ |
| Quality of life | No data reported on quality of life | ||||
| Adverse effects | Neovascular glaucoma: RR 2.33 (95% CI 0.28 to 19.17; 1 RCT, 368 participants) Retinal detachment: RR 0.56 (95% CI 0.11 to 2.86; 3 RCTs, 182 participants) Cataract: RR 0.68 (95% CI 0.38 to 1.23; 2 RCTs, 137 participants) Raised intraocular pressure: RR 0.31 (95% CI 0.01 to 7.47; 1 RCT, 68 participants) Myocardial infarction: no events in 2 trials (175 participants) Cerebrovascular accident: no events in 2 trials (175 participants) Endophthalmitis: none of the studies reported endophthalmitis Arterial hypertension: none of the studies reported arterial hypertension Pain: none of the studies reported pain | ||||
| *The basis for the assumed risk (e.g. the median control group risk across studies) is provided in footnotes. The corresponding risk (and its 95% confidence interval) is based on the assumed risk in the comparison group and the relative effect of the intervention (and its 95% CI). | |||||
| GRADE Working Group grades of evidence | |||||
| 1 Downgraded for imprecision (‐1) (wide CIs) and downgraded for indirectness (‐1) (only 1 trial reported at 12 months and only 1 (other) trial reported loss of ≥ 3 lines). 3Downgraded for risk of bias (‐1) (2 studies at high risk of bias in ≥ 1 domains) and downgraded for inconsistency (‐1) (I2 = 66%). 4 Downgraded for risk of bias (‐1) (2 studies at high risk of bias in ≥ 1 domains, 3 studies at unclear risk of bias in ≥ 3 domains) and downgraded for indirectness (‐1) (only 1 study reported at 12 months). | |||||
| Mild | Presence of at least 1 microaneurysm |
| Moderate | Haemorrhages or microaneurysms (or both) more than standard photo 2A, presence of soft exudates, venous beading, IRMA definitively present |
| Severe | Haemorrhages or microaneurysms (or both) more than standard photo 2A in all 4 quadrants, or venous beading in ≥ 2 quadrants, or IRMA more than standard photo 8A in at least 1 quadrant |
| Very severe | Any ≥ 2 of the changes seen in severe NPDR |
| Early PDR | Presence of new vessels |
| High‐risk PDR | Any of the following: NVD more than one‐third to one‐quarter disc diameter, NVD less than one‐third to one‐quarter disc diameter with vitreous or pre‐retinal haemorrhage, new vessels elsewhere with vitreous or pre‐retinal haemorrhage |
| ETDRS: Early Treatment Diabetic Retinopathy Study; IRMA: intraretinal microaneurysm; NPDR: non‐proliferative diabetic retinopathy; NVD: new vessels at optic disc; PDR: proliferative diabetic retinopathy. | |
| Non‐apparent retinopathy | No abnormalities |
| Mild NPDR | Microaneurysms only |
| Moderate NPDR | More than just microaneurysms but less than severe NPDR |
| Severe NPDR | Any of the following: > 20 intraretinal haemorrhages in each of 4 quadrants; definite venous beading in 2 quadrants; prominent intraretinal microvascular abnormalities in 1 quadrant and no signs of proliferative retinopathy |
| Proliferative diabetic retinopathy | ≥ 1 of the following: neovascularisation, vitreous or pre‐retinal haemorrhage |
| ICDRDS: International Clinical Diabetic Retinopathy Disease Severity scale; NPDR: non‐proliferative diabetic retinopathy. | |
| Outcome or subgroup title | No. of studies | No. of participants | Statistical method | Effect size |
| 1 Visual acuity Show forest plot | 5 | 373 | Mean Difference (IV, Random, 95% CI) | ‐0.07 [‐0.12, ‐0.02] |
| 1.1 Pegaptanib | 1 | 16 | Mean Difference (IV, Random, 95% CI) | ‐0.06 [‐0.22, 0.10] |
| 1.2 Bevacizumab | 2 | 80 | Mean Difference (IV, Random, 95% CI) | ‐0.01 [‐0.11, 0.09] |
| 1.3 Ranibizumab | 2 | 277 | Mean Difference (IV, Random, 95% CI) | ‐0.10 [‐0.16, ‐0.03] |
| 2 Regression of proliferative diabetic retinopathy Show forest plot | 2 | Mean Difference (IV, Fixed, 95% CI) | Totals not selected | |
| 3 Presence of vitreous or pre‐retinal haemorrhage Show forest plot | 3 | 342 | Risk Ratio (M‐H, Fixed, 95% CI) | 0.32 [0.16, 0.65] |
| 3.1 Bevacizumab | 1 | 61 | Risk Ratio (M‐H, Fixed, 95% CI) | 0.11 [0.01, 1.92] |
| 3.2 Pegaptanib | 1 | 20 | Risk Ratio (M‐H, Fixed, 95% CI) | 0.2 [0.01, 3.70] |
| 3.3 Ranibizumab versus control | 1 | 261 | Risk Ratio (M‐H, Fixed, 95% CI) | 0.38 [0.18, 0.81] |
| 4 Adverse effects Show forest plot | 2 | Risk Ratio (M‐H, Fixed, 95% CI) | Subtotals only | |
| 4.1 Neovascular glaucoma | 1 | 261 | Risk Ratio (M‐H, Fixed, 95% CI) | 1.09 [0.07, 17.21] |
| 4.2 Retinal detachment | 1 | 261 | Risk Ratio (M‐H, Fixed, 95% CI) | 0.99 [0.44, 2.25] |
| 4.3 Cataract | 1 | 61 | Risk Ratio (M‐H, Fixed, 95% CI) | 0.32 [0.01, 7.63] |
| 4.4 Raised intraocular pressure | 2 | 322 | Risk Ratio (M‐H, Fixed, 95% CI) | 0.75 [0.42, 1.36] |
| 4.5 Cerebrovascular accident | 2 | 322 | Risk Ratio (M‐H, Fixed, 95% CI) | 3.26 [0.13, 79.34] |
| 4.6 Endophalmitis | 1 | 261 | Risk Ratio (M‐H, Fixed, 95% CI) | 0.36 [0.01, 8.82] |
| 4.7 Arterial hypertension | 1 | 261 | Risk Ratio (M‐H, Fixed, 95% CI) | 0.47 [0.12, 1.76] |
| Outcome or subgroup title | No. of studies | No. of participants | Statistical method | Effect size |
| 1 Loss of 3 or more lines of ETDRS visual acuity Show forest plot | 3 | 94 | Risk Ratio (M‐H, Fixed, 95% CI) | 0.49 [0.08, 3.14] |
| 2 Gain of 3 or more lines of ETDRS visual acuity Show forest plot | 3 | 94 | Risk Ratio (M‐H, Fixed, 95% CI) | 1.62 [1.20, 2.17] |
| 3 Visual acuity Show forest plot | 6 | 335 | Mean Difference (IV, Random, 95% CI) | ‐0.24 [‐0.50, 0.01] |
| 4 Presence of vitreous or pre‐retinal haemorrhage Show forest plot | 7 | 393 | Risk Ratio (M‐H, Random, 95% CI) | 0.30 [0.18, 0.52] |
| 5 Adverse effects Show forest plot | 5 | Risk Ratio (M‐H, Random, 95% CI) | Subtotals only | |
| 5.1 Neovascular glaucoma | 1 | 107 | Risk Ratio (M‐H, Random, 95% CI) | 2.33 [0.28, 19.17] |
| 5.2 Retinal detachment | 3 | 182 | Risk Ratio (M‐H, Random, 95% CI) | 0.56 [0.11, 2.86] |
| 5.3 Cataract | 2 | 137 | Risk Ratio (M‐H, Random, 95% CI) | 0.68 [0.38, 1.23] |
| 5.4 Raised intraocular pressure | 1 | 68 | Risk Ratio (M‐H, Random, 95% CI) | 0.31 [0.01, 7.47] |
| 5.5 Myocardial infarction | 2 | 175 | Risk Ratio (M‐H, Random, 95% CI) | 0.0 [0.0, 0.0] |
| 5.6 Cerebrovascular accident | 2 | 175 | Risk Ratio (M‐H, Random, 95% CI) | 0.0 [0.0, 0.0] |
| 5.7 Arterial hypertension | 0 | 0 | Risk Ratio (M‐H, Random, 95% CI) | 0.0 [0.0, 0.0] |