Contenido relacionado
Revisiones y protocolos relacionados
Sharon D Solomon, Kristina Lindsley, Satyanarayana S Vedula, Magdalena G Krzystolik, Barbara S Hawkins | 4 marzo 2019
Hemal Mehta, Charles Hennings, Mark C Gillies, Vuong Nguyen, Anna Campain, Samantha Fraser‐Bell | 18 abril 2018
Tasanee Braithwaite, Afshan A Nanji, Kristina Lindsley, Paul B Greenberg | 1 mayo 2014
Zaid Shalchi, Omar Mahroo, Catey Bunce, Danny Mitry | 7 julio 2020
Maria José Martinez-Zapata, Ignacio Salvador, Arturo J Martí-Carvajal, José I Pijoan, José A Cordero, Dmitry Ponomarev, Ashleigh Kernohan, Ivan Solà, Gianni Virgili | 20 marzo 2023
Gianni Virgilia, Katie Currana, Ersilia Lucenteforte, Tunde Peto, Mariacristina Parravano | 27 junio 2023
Ying Zhu, Ting Zhang, Gezhi Xu, Lijun Peng | 15 diciembre 2016
Fook Chang Lam, Seen N Chia, Richard MH Lee | 11 mayo 2015
Jin‐Wei Cheng, Shi‐Wei Cheng, Rui‐Li Wei, Guo‐Cai Lu | 15 enero 2016
Jennifer R Evans, Manuele Michelessi, Gianni Virgili | 24 noviembre 2014


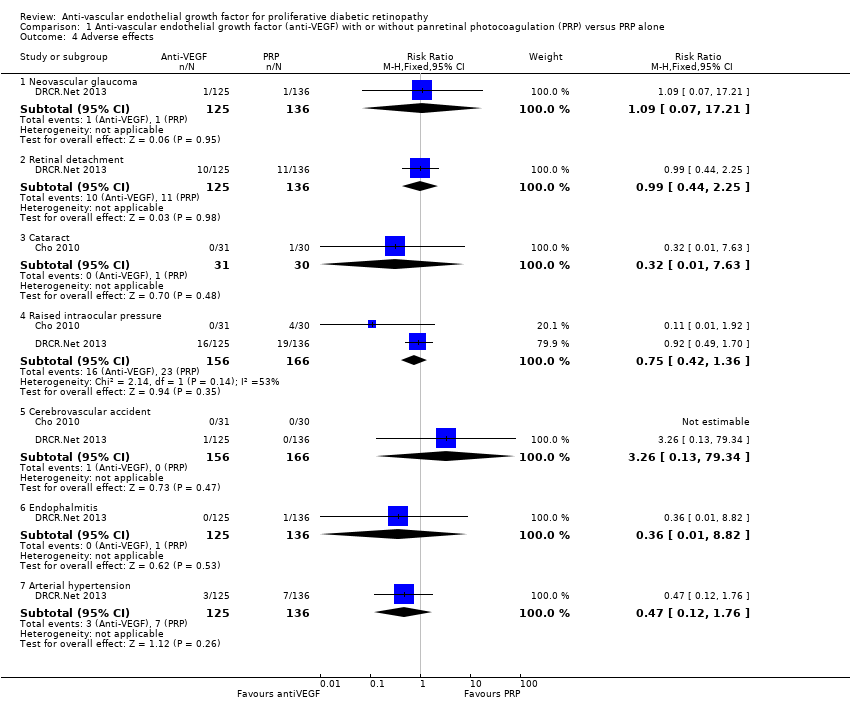
![Forest plot of comparison: 1 Anti‐vascular endothelial growth factor (anti‐VEGF) versus photocoagulation, outcome: 1.3 Visual acuity [logMAR].](/es/cdsr/doi/10.1002/14651858.CD008721.pub2/media/CDSR/CD008721/rel0002/CD008721/image_n/nCD008721-AFig-FIG04.png)
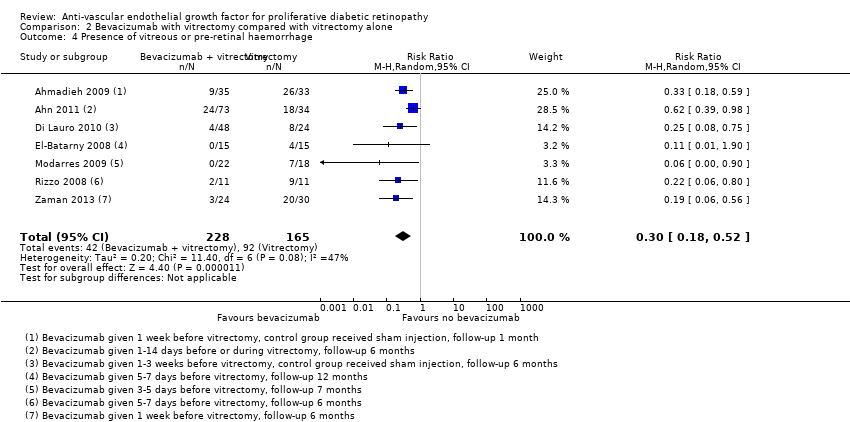
![Forest plot of comparison: 2 Anti‐vascular endothelial growth factor (anti‐VEGF) plus surgery versus surgery alone or surgery plus sham or placebo, outcome: 2.3 Visual acuity [logMAR].](/es/cdsr/doi/10.1002/14651858.CD008721.pub2/media/CDSR/CD008721/rel0002/CD008721/image_n/nCD008721-AFig-FIG05.png)