Intervenciones para la prevención de la hemorragia digestiva alta en pacientes ingresados a la unidad de cuidados intensivos
Appendices
Appendix 1. Glossary of medical terms
Antimicrobial – active against microbes.
Aspiration – action or process of drawing breath.
Bicarbonate ions ‐ bicarbonate serves a crucial biochemical role in the physiological pHbuffering system.
Bronchial ‐ related to the bronchi or bronchioles.
Creatinine – compound that is produced by metabolism of creatine and is excreted in the urine.
Cytoprotective – providing protection to cells against harmful agents.
Enteral nutrition – nutrition passing through the intestine, either naturally via the mouth and oesophagus, or through an artificial opening.
Flora ‐ population of microbes inhabiting the outside or inside surfaces of the body.
Gastric – concerning the stomach.
Gram stain – method used to distinguish different types of bacteria by staining them.
Haemoglobin ‐ red protein responsible for transporting oxygen into the blood of vertebrates.
Hyperaemia ‐ excess of blood in the vessels supplying an organ or another part of the body.
Hypermagnesaemia ‐ high level of magnesium in the blood.
Hypomagnesaemia ‐ low level of magnesium in the blood.
Hypoperfusion ‐ decreased flow of blood through an organ.
Hypophosphataemia ‐ abnormally low level of phosphate in the blood.
Infiltrate ‐ substance denser than air such as pus, blood, or protein that lingers within the parenchyma of the lungs.
Interstitial nephritis – type of bacterial infection of the kidneys.
Ischaemia ‐ inadequate blood supply to an organ or part of the body.
Lesion ‐ region in an organ or tissue that has suffered damage through injury or disease.
Leucocytosis ‐ increase in the number of white cells in the blood.
Leucopaenia ‐ reduction in the number of white cells in the blood.
Luminal ‐ concerning the interior of the gastrointestinal tract.
Microcirculation ‐ circulation of the blood in the smallest blood vessels.
Morbidity ‐ the condition of being diseased.
Mortality ‐ the number of deaths in a given area or period, or from a particular cause.
Mucosal ‐ concerning the mucosa.
Neutropaenia ‐ presence of abnormally few neutrophils in the blood.
Nosocomial – originating in a hospital.
Occult bleeding – bleeding that is detectable only chemically or microscopically.
Cytochrome P‐450 mediated drug interaction ‐ a drug interaction mediated via the cytochrome P‐450, a family of isozymes responsible for biotransformation of many drugs via oxidation.
Pathogenic – causing disease.
Pathophysiology ‐ disordered physiological processes associated with disease or injury.
Pancreatitis ‐ inflammation of the pancreas.
Peptic ‐ related to digestion.
pH ‐ figure expressing the acidity or alkalinity of a solution.
Pharmacological ‐ concerned with uses, effects, and modes of action of drugs.
Pleural – concerning the serous membranes lining the thorax and enveloping the lungs.
Pneumonia ‐ lung inflammation caused by bacterial or viral infection.
Postural – concerning the position in which someone holds his or her body when standing or sitting.
Prophylaxis ‐ preventive treatment.
Prostaglandin ‐ group of compounds with varying hormone‐like effects.
Pulmonary – related to the lungs.
Purulent ‐ consisting of, containing, or discharging pus.
Pyaemia ‐ blood poisoning caused by spread in the bloodstream of pus‐forming bacteria.
Quinolones ‐ antibiotic derived from quinoline.
Rales ‐ abnormal rattling sounds heard when unhealthy lungs are examined with a stethoscope.
Renal – related to the kidneys.
Reperfusion ‐ action of restoring the flow of blood to an organ or tissue.
Sepsis ‐ presence in tissues of harmful bacteria and their toxins.
Splanchnic ‐ related to the viscera or internal organs.
Tetracyclines ‐ any of a large group of antibiotics with a molecular structure containing four rings.
Thrombocytopaenia ‐ condition characterised by abnormally low levels of thrombocytes in the blood.
Tracheo‐bronchial colonisation ‐ colonisation of the lower airways by bacteria.
Ulceration – development of or affected by an ulcer.
Ventilator ‐ appliance for artificial respiration.
Appendix 2. CENTRAL search strategy
-
(stomach or antrum or antral or pyloric or pylorus or gastri$ or epigastr$ or duodenal or duodenum or gastro‐duodenal or gastroduodenal or oeso*ag* or esp*ag* or "upper GI" or UGI).mp. [mp=title, abstract, subject headings, heading word, drug trade name, original title, device manufacturer, drug manufacturer name]
-
(h*emorrhag$ or bleed$ or re‐bleed$ or rebleed$).mp. [mp=title, abstract, subject headings, heading word, drug trade name, original title, device manufacturer, drug manufacturer name]
-
1 and 2
-
exp Gastrointestinal Hemorrhage/
-
(gastr$ adj3 mucosal adj3 injur$).mp. [mp=title, abstract, subject headings, heading word, drug trade name, original title, device manufacturer, drug manufacturer name]
-
exp injury/ and exp gastric mucosa/
-
or/3‐6
-
(stress adj3 ulcer$).mp. [mp=title, abstract, subject headings, heading word, drug trade name, original title, device manufacturer, drug manufacturer name]
-
(h*emorrhag$ or bleed$ or re‐bleed$ or rebleed$).mp. [mp=title, abstract, subject headings, heading word, drug trade name, original title, device manufacturer, drug manufacturer name]
-
(ulcer$ or lesion$).mp.
-
exp Peptic Ulcer/
-
9 and (10 or 11)
-
8 or 12
-
h*ematemesis.mp. [mp=title, abstract, subject headings, heading word, drug trade name, original title, device manufacturer, drug manufacturer name]
-
(melena or melaena).mp.
-
(coffee adj1 ground).mp. [mp=title, abstract, subject headings, heading word, drug trade name, original title, device manufacturer, drug manufacturer name]
-
or/14‐16
-
7 or 13 or 17
-
exp Intensive Care/ or exp Critical Illness/ or exp Critical care/ or exp Intensive care units/ or exp Monitoring, Physiologic/
-
exp Enteral nutrition/
-
(Nasogastric adj2 (intubat* or tube*)).mp. [mp=title, abstract, subject headings, heading word, drug trade name, original title, device manufacturer, drug manufacturer name]
-
exp Intubation, Gastrointestinal/
-
exp Feeding Apparatus/ or exp Nutritional Support/ or exp Enteric Feeding/ or exp Tube Feeding/
-
nasoduodenal tube*.mp.
-
force feeding$.mp.
-
or/19‐25
-
exp Histamine H2 Antagonists/
-
H2 receptor Antagonist*.mp. [mp=title, abstract, subject headings, heading word, drug trade name, original title, device manufacturer, drug manufacturer name]
-
H2 blocker*.mp.
-
(ranitidine or azanplus or biotidin or pylorid or raciran or raniberl or ranisen or ranitidin or rantec or sostril or taladine or tritec or wal‐zan or zantac).mp.
-
(cimetidine or acitak or altramet or biomet or dyspamet or eureceptor or galenamet or histodil or peptimax or phimetin or tagamet or ultec or zita).mp.
-
(famotidine or fluxid or leader acid reducer or mylanta or pepcid).mp.
-
(roxatidine or Roxit).mp.
-
(Nizatidine or axid or zinga).mp.
-
exp proton pump inhibitors/
-
(omeprazole or losec or nexium or prilosec or rapinex or zegerid).mp.
-
(Esomeprazole or Sompraz or Zoleri or Nexium or Lucen or Esopral or Axagon or Nexiam).mp.
-
(Rabeprazole or aciphex or dexrabeprazole or pariet or rablet).mp.
-
(pantoprazole or protium or protonix).mp.
-
(lansoprazole or agopton or bamalite or lanzoprazole or lanzor or monolitum or ogast or ogastro or opiren or prevacid or prezal or pro ulco or promeco or takepron or ulpax or zoton).mp.
-
prostaglandins e, synthetic/
-
(misoprostol or cytotec or glefos).mp.
-
enprostil.mp. [mp=title, abstract, subject headings, heading word, drug trade name, original title, device manufacturer, drug manufacturer name]
-
rioprostil.mp. [mp=title, abstract, subject headings, heading word, drug trade name, original title, device manufacturer, drug manufacturer name]
-
Cholinergic Antagonists/
-
(Pirenzepine or Gastrozepin or Bisvanil or Gasteril or Leblon or Pirenzepin or Pirenzepina or Pirenzepine Gastrozepin or Pirenzepinum or Tabe or Ulcosan).mp.
-
(Propantheline or Pro‐Banthine).mp.
-
(Oxyphenonium or Antrenyl or Argicillin or Methacin or Methocidin or Methocidine or Methocidinum or Metocidina or Hydroxymethylgramicidin or Oxiphenonum).mp.
-
(Doxepin or adapin or apodoxepin or aponal or deptran or desidox or doneurin or doxepia or doxepinbiomo or espadox or mareen or prudoxin or quitaxon or silenor or sinequan or xepin or zonalon).mp.
-
(Trimipramine or rhotrimine or stangyl or surmontil).mp.
-
exp antacids/
-
(sodium bicarbonate or baking soda or bicarb or bicarbonate of soda or carbonic acid monosodium salt or citrocarbonate or monosodium carbonate or neut or neutra caine or soda bic or sodium acid carbonate or sodium hydrogen carbonate).mp.
-
(sodium citrate or 2‐hydroxypropanetricarboxylic acid or albright's solution or bicitra or citra or citrate or citric acid or cystemme or cystoleve or cytra‐2 or liqui‐dualcitra or oracit or shohl's solution or uralyt).mp.
-
(magnesium hydroxide or antacids magnesium oh or brucite or magnesium hydrate or mil‐par or milk of magnesia).mp.
-
(aluminium hydroxide gel or aldrox or algeldrate or alhydrogel or aloh‐gel or alternagel or alu‐cap or alu‐tab or alugel or aluminium hydroxide mixture bp or aluminium hydroxide oral suspension bp or aluminum hydroxide or aluminum hydroxide gel or amphojel or andursil or basalgel or brasivil or brimos or dialume or hydrated alumina or pepsamer or rocgel).mp.
-
(magnesium trisilicate or sepiolite or Alenic Alka or Gaviscon or Genaton).mp.
-
(Magaldrate or Gadral or Magaltop or Magralibi or Riopan).mp. [mp=title, abstract, subject headings, heading word, drug trade name, original title, device manufacturer, drug manufacturer name]
-
(calcium carbonate or alka‐mints or alkets or alkums or amilac or amitone or antacid extra strength or aragonite or cacit or caco or cal oys or cal‐gest or calcarb or calceos or calci mix or calcichew or calcidrink or calcitab or calcite or calcium antacid or calcium concentrate or calcium liquid softgel or calcium milk or calcium oyster or calcium‐based antacid or calmicid or caltrate or caltro or chalk or chewable calcium or chooz or dicarbosil or equilet or extra strength mylanta calci tabs or limestone or maalox antacid barrier or maalox children or maalox quick dissolve or marble or milk of calcium or mor‐cal or mylanta child or nephro calci or o‐calcium or os‐cal or oscal or oysco or oyst cal or oyster calcium or oyster shell or pepto‐bismol children or rolaids calcium rich or rolaids sodium free or rolaids softchews or super calcium or surpass or titralac or tums or ultra mylanta calci tabs or uni‐cal or uni‐mint or vaterite).mp.
-
(sucralfate or aluminum sucrose sulfate or antepsin or carafate or ulcerban or ulcogant or ulsanic or xactdose).mp.
-
(colloidal bismuth subcitrate or bi‐citrate or biselic or bismofarma or bismuth citrate or bismuth subcitrate or bismuth tripotassium dicitrate or bissubcit or de‐nol or de‐noltab or gastrodenol or sucrato or tripotassium dicitratobismuthate or ventrisol‐polfa).mp.
-
(carbenoxolone sodium or bioplex or bioral or carbenoxalone or carbosan or disodium enoxolone or duogastrone or pharmaxolon or sanodin).mp. [mp=title, abstract, subject headings, heading word, drug trade name, original title, device manufacturer, drug manufacturer name]
-
Deglycyrrhizinised Liquorice.mp.
-
or/27‐62
-
18 and 26 and 63
Update search on 15 June 2016 and 22 August 2017:
-
exp Upper Gastrointestinal Tract/
-
(stomach or antrum or antral or pyloric or pylorus or gastri* or gastro* or duoden* or epigastr* or gastritis or duodenitis).tw,kw.
-
(esophag* or oesophag* or gastroduoden* or gastrointestinal).tw,kw.
-
exp Peptic Ulcer/
-
(peptic or ulcer* or upper GI or UGI or PUD).tw,kw.
-
or/1‐5
-
(hemorrhag* or haemorrhag* or bleed* or rebleed* or re‐bleed* or bled or rebled).tw,kw.
-
(mucosa* adj2 (injur* or damage* or lesion*)).tw,kw.
-
exp Hemorrhage/
-
or/7‐9
-
6 and 10
-
exp Gastrointestinal Hemorrhage/
-
exp melena/
-
(melena or melaena).tw,kw.
-
exp hematemesis/
-
(haematemesis or hematemesis).tw,kw.
-
((coffee adj ground) or "UGIB").tw,kw.
-
or/11‐17
-
exp Intensive Care Units/
-
exp Critical Illness/
-
exp Critical care/
-
(intensive care or critical care or respiratory care or recovery room or close attention unit* or special care unit* or coronary care or burn unit* or ICU or RCU or CCU).tw,kw.
-
((critical or critically or severe or serious*) adj2 (ill or illness)).tw,kw.
-
((head or brain or severe or multiple) adj2 (injur* or trauma*)).tw,kw.
-
exp Respiration, Artificial/
-
(((mechanical* or artificial or controlled) adj2 (ventilat* or respiration)) or on ventilator or ventilated patients).tw,kw.
-
((prophylaxis or prophylactic or prevent*) and (((after or post) adj2 (surgery or operat*)) or postoperat* or sepsis or hepatic failure* or respiratory failure* or renal failure* or burns or transplantation or stroke or incubated or acute pancreatitis or intracerebral h*morrhag* or intracerebral bleed*)).ti,ab.
-
or/19‐27
-
18 and 28
-
(stress adj2 (ulcer* or gastritis or bleed* or hemorrhage* or haemorrhage*)).tw,kw.
-
29 or 30
-
limit 31 to yr="2012 ‐Current"
-
remove duplicates from 32
Appendix 3. MEDLINE search strategy
-
randomized controlled trial.pt.
-
controlled clinical trial.pt.
-
randomized.ab.
-
placebo.ab.
-
drug therapy.fs.
-
randomly.ab.
-
trial.ab.
-
groups.ab.
-
or/1‐8
-
exp animals/ not humans.sh.
-
9 not 10
-
(stomach or antrum or antral or pyloric or pylorus or gastri$ or epigastr$ or duodenal or duodenum or gastro‐duodenal or gastroduodenal or oeso*ag* or esp*ag* or "upper GI" or UGI).mp. [mp=title, abstract, subject headings, heading word, drug trade name, original title, device manufacturer, drug manufacturer name]
-
(h*emorrhag$ or bleed$ or re‐bleed$ or rebleed$).mp. [mp=title, abstract, subject headings, heading word, drug trade name, original title, device manufacturer, drug manufacturer name]
-
12 and 13
-
exp Gastrointestinal Hemorrhage/
-
(gastr$ adj3 mucosal adj3 injur$).mp. [mp=title, abstract, subject headings, heading word, drug trade name, original title, device manufacturer, drug manufacturer name]
-
exp injury/ and exp gastric mucosa/
-
or/14‐17
-
(stress adj3 ulcer$).mp. [mp=title, abstract, subject headings, heading word, drug trade name, original title, device manufacturer, drug manufacturer name]
-
(h*emorrhag$ or bleed$ or re‐bleed$ or rebleed$).mp. [mp=title, abstract, subject headings, heading word, drug trade name, original title, device manufacturer, drug manufacturer name]
-
(ulcer$ or lesion$).mp.
-
exp Peptic Ulcer/
-
20 and (21 or 22)
-
19 or 23
-
h*ematemesis.mp. [mp=title, abstract, subject headings, heading word, drug trade name, original title, device manufacturer, drug manufacturer name]
-
(melena or melaena).mp.
-
(coffee adj1 ground).mp. [mp=title, abstract, subject headings, heading word, drug trade name, original title, device manufacturer, drug manufacturer name]
-
or/25‐27
-
18 or 24 or 28
-
exp Intensive Care/ or exp Critical Illness/ or exp Critical care/ or exp Intensive care units/ or exp Monitoring, Physiologic/
-
exp Enteral nutrition/
-
(Nasogastric adj2 (intubat* or tube*)).mp. [mp=title, abstract, subject headings, heading word, drug trade name, original title, device manufacturer, drug manufacturer name]
-
exp Intubation, Gastrointestinal/
-
exp Feeding Apparatus/ or exp Nutritional Support/ or exp Enteric Feeding/ or exp Tube Feeding/
-
nasoduodenal tube*.mp.
-
force feeding$.mp.
-
or/30‐36
-
exp Histamine H2 Antagonists/
-
H2 receptor Antagonist*.mp. [mp=title, abstract, subject headings, heading word, drug trade name, original title, device manufacturer, drug manufacturer name]
-
H2 blocker*.mp.
-
(ranitidine or azanplus or biotidin or pylorid or raciran or raniberl or ranisen or ranitidin or rantec or sostril or taladine or tritec or wal‐zan or zantac).mp.
-
(cimetidine or acitak or altramet or biomet or dyspamet or eureceptor or galenamet or histodil or peptimax or phimetin or tagamet or ultec or zita).mp.
-
(famotidine or fluxid or leader acid reducer or mylanta or pepcid).mp.
-
(roxatidine or Roxit).mp.
-
(Nizatidine or axid or zinga).mp.
-
exp proton pump inhibitors/
-
(omeprazole or losec or nexium or prilosec or rapinex or zegerid).mp.
-
(Esomeprazole or Sompraz or Zoleri or Nexium or Lucen or Esopral or Axagon or Nexiam).mp.
-
(Rabeprazole or aciphex or dexrabeprazole or pariet or rablet).mp.
-
(pantoprazole or protium or protonix).mp.
-
(lansoprazole or agopton or bamalite or lanzoprazole or lanzor or monolitum or ogast or ogastro or opiren or prevacid or prezal or pro ulco or promeco or takepron or ulpax or zoton).mp.
-
prostaglandins e, synthetic/
-
(misoprostol or cytotec or glefos).mp.
-
enprostil.mp. [mp=title, abstract, subject headings, heading word, drug trade name, original title, device manufacturer, drug manufacturer name]
-
rioprostil.mp. [mp=title, abstract, subject headings, heading word, drug trade name, original title, device manufacturer, drug manufacturer name]
-
Cholinergic Antagonists/
-
(Pirenzepine or Gastrozepin or Bisvanil or Gasteril or Leblon or Pirenzepin or Pirenzepina or Pirenzepine Gastrozepin or Pirenzepinum or Tabe or Ulcosan).mp.
-
(Propantheline or Pro‐Banthine).mp.
-
(Oxyphenonium or Antrenyl or Argicillin or Methacin or Methocidin or Methocidine or Methocidinum or Metocidina or Hydroxymethylgramicidin or Oxiphenonum).mp.
-
(Doxepin or adapin or apodoxepin or aponal or deptran or desidox or doneurin or doxepia or doxepinbiomo or espadox or mareen or prudoxin or quitaxon or silenor or sinequan or xepin or zonalon).mp.
-
(Trimipramine or rhotrimine or stangyl or surmontil).mp.
-
exp antacids/
-
(sodium bicarbonate or baking soda or bicarb or bicarbonate of soda or carbonic acid monosodium salt or citrocarbonate or monosodium carbonate or neut or neutra caine or soda bic or sodium acid carbonate or sodium hydrogen carbonate).mp.
-
(sodium citrate or 2‐hydroxypropanetricarboxylic acid or albright's solution or bicitra or citra or citrate or citric acid or cystemme or cystoleve or cytra‐2 or liqui‐dualcitra or oracit or shohl's solution or uralyt).mp.
-
(magnesium hydroxide or antacids magnesium oh or brucite or magnesium hydrate or mil‐par or milk of magnesia).mp.
-
(aluminium hydroxide gel or aldrox or algeldrate or alhydrogel or aloh‐gel or alternagel or alu‐cap or alu‐tab or alugel or aluminium hydroxide mixture bp or aluminium hydroxide oral suspension bp or aluminum hydroxide or aluminum hydroxide gel or amphojel or andursil or basalgel or brasivil or brimos or dialume or hydrated alumina or pepsamer or rocgel).mp.
-
(magnesium trisilicate or sepiolite or Alenic Alka or Gaviscon or Genaton).mp.
-
(Magaldrate or Gadral or Magaltop or Magralibi or Riopan).mp. [mp=title, abstract, subject headings, heading word, drug trade name, original title, device manufacturer, drug manufacturer name]
-
(calcium carbonate or alka‐mints or alkets or alkums or amilac or amitone or antacid extra strength or aragonite or cacit or caco or cal oys or cal‐gest or calcarb or calceos or calci mix or calcichew or calcidrink or calcitab or calcite or calcium antacid or calcium concentrate or calcium liquid softgel or calcium milk or calcium oyster or calcium‐based antacid or calmicid or caltrate or caltro or chalk or chewable calcium or chooz or dicarbosil or equilet or extra strength mylanta calci tabs or limestone or maalox antacid barrier or maalox children or maalox quick dissolve or marble or milk of calcium or mor‐cal or mylanta child or nephro calci or o‐calcium or os‐cal or oscal or oysco or oyst cal or oyster calcium or oyster shell or pepto‐bismol children or rolaids calcium rich or rolaids sodium free or rolaids softchews or super calcium or surpass or titralac or tums or ultra mylanta calci tabs or uni‐cal or uni‐mint or vaterite).mp.
-
(sucralfate or aluminum sucrose sulfate or antepsin or carafate or ulcerban or ulcogant or ulsanic or xactdose).mp.
-
(colloidal bismuth subcitrate or bi‐citrate or biselic or bismofarma or bismuth citrate or bismuth subcitrate or bismuth tripotassium dicitrate or bissubcit or de‐nol or de‐noltab or gastrodenol or sucrato or tripotassium dicitratobismuthate or ventrisol‐polfa).mp.
-
(carbenoxolone sodium or bioplex or bioral or carbenoxalone or carbosan or disodium enoxolone or duogastrone or pharmaxolon or sanodin).mp. [mp=title, abstract, subject headings, heading word, drug trade name, original title, device manufacturer, drug manufacturer name]
-
Deglycyrrhizinised Liquorice.mp.
-
or/38‐73
-
29 and 37 and 74
-
11 and 75
Update search on 15 June 2016 and 22 August 2017:
-
exp Upper Gastrointestinal Tract/
-
(stomach or antrum or antral or pyloric or pylorus or gastri* or gastro* or duoden* or epigastr* or gastritis or duodenitis).tw,kw.
-
(esophag* or oesophag* or gastroduoden* or gastrointestinal).tw,kw.
-
exp Peptic Ulcer/
-
(peptic or ulcer* or upper GI or UGI or PUD).tw,kw.
-
or/1‐5
-
(hemorrhag* or haemorrhag* or bleed* or rebleed* or re‐bleed* or bled or rebled).tw,kw.
-
(mucosa* adj2 (injur* or damage* or lesion*)).tw,kw.
-
exp Hemorrhage/
-
or/7‐9
-
6 and 10
-
exp Gastrointestinal Hemorrhage/
-
exp melena/
-
(melena or melaena).tw,kw.
-
exp hematemesis/
-
(haematemesis or hematemesis).tw,kw.
-
((coffee adj ground) or "UGIB").tw,kw.
-
or/11‐17
-
exp Intensive Care Units/
-
exp Critical Illness/
-
exp Critical care/
-
(intensive care or critical care or respiratory care or recovery room or close attention unit* or special care unit* or coronary care or burn unit* or ICU or RCU or CCU).tw,kw.
-
((critical or critically or severe or serious*) adj2 (ill or illness)).tw,kw.
-
((head or brain or severe or multiple) adj2 (injur* or trauma*)).tw,kw.
-
exp Respiration, Artificial/
-
(((mechanical* or artificial or controlled) adj2 (ventilat* or respiration)) or on ventilator or ventilated patients).tw,kw.
-
((prophylaxis or prophylactic or prevent*) and (((after or post) adj2 (surgery or operat*)) or postoperat* or sepsis or hepatic failure* or respiratory failure* or renal failure* or burns or transplantation or stroke or incubated or acute pancreatitis or intracerebral h*morrhag* or intracerebral bleed*)).ti,ab.
-
or/19‐27
-
18 and 28
-
(stress adj2 (ulcer* or gastritis or bleed* or hemorrhage* or haemorrhage*)).tw,kw.
-
29 or 30
-
randomized controlled trial.pt.
-
controlled clinical trial.pt.
-
random*.ab.
-
placebo.ab.
-
drug therapy.fs.
-
trial.ab.
-
groups.ab.
-
or/32‐38
-
exp animals/ not humans.sh.
-
39 not 40
-
31 and 41
-
limit 42 to yr="2012 ‐Current"
Appendix 4. Embase search strategy
-
Clinical trial/
-
Randomized controlled trial/
-
Randomization/
-
Single‐Blind Method/
-
Double‐Blind Method/
-
Cross‐Over Studies/
-
Random Allocation/
-
Placebo/
-
Randomi?ed controlled trial$.tw.
-
Rct.tw.
-
Random allocation.tw.
-
Randomly allocated.tw.
-
Allocated randomly.tw.
-
(allocated adj2 random).tw.
-
Single blind$.tw.
-
Double blind$.tw.
-
((treble or triple) adj blind$).tw.
-
Placebo$.tw.
-
Prospective study/
-
or/1‐19
-
Case study/
-
Case report.tw.
-
Abstract report/ or letter/
-
or/21‐23
-
20 not 24
-
(stomach or antrum or antral or pyloric or pylorus or gastri$ or epigastr$ or duodenal or duodenum or gastro‐duodenal or gastroduodenal or oeso*ag* or esp*ag* or "upper GI" or UGI).mp. [mp=title, abstract, subject headings, heading word, drug trade name, original title, device manufacturer, drug manufacturer name]
-
(h*emorrhag$ or bleed$ or re‐bleed$ or rebleed$).mp. [mp=title, abstract, subject headings, heading word, drug trade name, original title, device manufacturer, drug manufacturer name]
-
26 and 27
-
gastrointestinal hemorrhage/ or duodenum bleeding/ or peptic ulcer bleeding/ or stomach hemorrhage/ or upper gastrointestinal bleeding/
-
(gastr$ adj3 mucosal adj3 injur$).mp. [mp=title, abstract, subject headings, heading word, drug trade name, original title, device manufacturer, drug manufacturer name]
-
or/28‐30
-
(stress adj3 ulcer$).mp. [mp=title, abstract, subject headings, heading word, drug trade name, original title, device manufacturer, drug manufacturer name]
-
(h*emorrhag$ or bleed$ or re‐bleed$ or rebleed$).mp. [mp=title, abstract, subject headings, heading word, drug trade name, original title, device manufacturer, drug manufacturer name]
-
(ulcer$ or lesion$).mp.
-
exp Peptic Ulcer/
-
33 and (34 or 35)
-
32 or 36
-
h*ematemesis.mp. [mp=title, abstract, subject headings, heading word, drug trade name, original title, device manufacturer, drug manufacturer name]
-
(melena or melaena).mp.
-
(coffee adj1 ground).mp. [mp=title, abstract, subject headings, heading word, drug trade name, original title, device manufacturer, drug manufacturer name]
-
or/38‐40
-
31 or 37 or 41
-
intensive care/ or exp artificial feeding/ or artificial ventilation/ or exp Critical Illness/ or exp Intensive care units/ or patient monitoring/
-
(Nasogastric adj2 (intubat* or tube*)).mp. [mp=title, abstract, subject headings, heading word, drug trade name, original title, device manufacturer, drug manufacturer name]
-
exp digestive tract intubation/
-
exp Feeding Apparatus/ or exp Nutritional Support/
-
nasoduodenal tube*.mp.
-
force feeding$.mp. [mp=title, abstract, subject headings, heading word, drug trade name, original title, device manufacturer, drug manufacturer name]
-
or/43‐48
-
exp histamine H2 receptor antagonist/
-
H2 receptor Antagonist*.mp. [mp=title, abstract, subject headings, heading word, drug trade name, original title, device manufacturer, drug manufacturer name]
-
H2 blocker*.mp. [mp=title, abstract, subject headings, heading word, drug trade name, original title, device manufacturer, drug manufacturer name]
-
(ranitidine or azanplus or biotidin or pylorid or raciran or raniberl or ranisen or ranitidin or rantec or sostril or taladine or tritec or wal‐zan or zantac).mp.
-
(cimetidine or acitak or altramet or biomet or dyspamet or eureceptor or galenamet or histodil or peptimax or phimetin or tagamet or ultec or zita).mp.
-
(famotidine or fluxid or leader acid reducer or mylanta or pepcid).mp.
-
(roxatidine or Roxit).mp.
-
(Nizatidine or axid or zinga).mp.
-
exp proton pump inhibitors/
-
(omeprazole or losec or nexium or prilosec or rapinex or zegerid).mp.
-
(Esomeprazole or Sompraz or Zoleri or Nexium or Lucen or Esopral or Axagon or Nexiam).mp.
-
(Rabeprazole or aciphex or dexrabeprazole or pariet or rablet).mp.
-
(pantoprazole or protium or protonix).mp.
-
(lansoprazole or agopton or bamalite or lanzoprazole or lanzor or monolitum or ogast or ogastro or opiren or prevacid or prezal or pro ulco or promeco or takepron or ulpax or zoton).mp.
-
prostaglandin E/
-
(misoprostol or cytotec or glefos).mp.
-
enprostil.mp. [mp=title, abstract, subject headings, heading word, drug trade name, original title, device manufacturer, drug manufacturer name]
-
rioprostil.mp. [mp=title, abstract, subject headings, heading word, drug trade name, original title, device manufacturer, drug manufacturer name]
-
cholinergic receptor blocking agent/
-
(Pirenzepine or Gastrozepin or Bisvanil or Gasteril or Leblon or Pirenzepin or Pirenzepina or Pirenzepine Gastrozepin or Pirenzepinum or Tabe or Ulcosan).mp.
-
(Propantheline or Pro‐Banthine).mp.
-
(Oxyphenonium or Antrenyl or Argicillin or Methacin or Methocidin or Methocidine or Methocidinum or Metocidina or Hydroxymethylgramicidin or Oxiphenonum).mp.
-
(Doxepin or adapin or apodoxepin or aponal or deptran or desidox or doneurin or doxepia or doxepinbiomo or espadox or mareen or prudoxin or quitaxon or silenor or sinequan or xepin or zonalon).mp.
-
(Trimipramine or rhotrimine or stangyl or surmontil).mp.
-
antacid agent/
-
(sodium bicarbonate or baking soda or bicarb or bicarbonate of soda or carbonic acid monosodium salt or citrocarbonate or monosodium carbonate or neut or neutra caine or soda bic or sodium acid carbonate or sodium hydrogen carbonate).mp.
-
(sodium citrate or 2‐hydroxypropanetricarboxylic acid or albright's solution or bicitra or citra or citrate or citric acid or cystemme or cystoleve or cytra‐2 or liqui‐dualcitra or oracit or shohl's solution or uralyt).mp.
-
(magnesium hydroxide or antacids magnesium oh or brucite or magnesium hydrate or mil‐par or milk of magnesia).mp.
-
(aluminium hydroxide gel or aldrox or algeldrate or alhydrogel or aloh‐gel or alternagel or alu‐cap or alu‐tab or alugel or aluminium hydroxide mixture bp or aluminium hydroxide oral suspension bp or aluminum hydroxide or aluminum hydroxide gel or amphojel or andursil or basalgel or brasivil or brimos or dialume or hydrated alumina or pepsamer or rocgel).mp.
-
(magnesium trisilicate or sepiolite or Alenic Alka or Gaviscon or Genaton).mp.
-
(Magaldrate or Gadral or Magaltop or Magralibi or Riopan).mp. [mp=title, abstract, subject headings, heading word, drug trade name, original title, device manufacturer, drug manufacturer name]
-
(calcium carbonate or alka‐mints or alkets or alkums or amilac or amitone or antacid extra strength or aragonite or cacit or caco or cal oys or cal‐gest or calcarb or calceos or calci mix or calcichew or calcidrink or calcitab or calcite or calcium antacid or calcium concentrate or calcium liquid softgel or calcium milk or calcium oyster or calcium‐based antacid or calmicid or caltrate or caltro or chalk or chewable calcium or chooz or dicarbosil or equilet or extra strength mylanta calci tabs or limestone or maalox antacid barrier or maalox children or maalox quick dissolve or marble or milk of calcium or mor‐cal or mylanta child or nephro calci or o‐calcium or os‐cal or oscal or oysco or oyst cal or oyster calcium or oyster shell or pepto‐bismol children or rolaids calcium rich or rolaids sodium free or rolaids softchews or super calcium or surpass or titralac or tums or ultra mylanta calci tabs or uni‐cal or uni‐mint or vaterite).mp.
-
(sucralfate or aluminum sucrose sulfate or antepsin or carafate or ulcerban or ulcogant or ulsanic or xactdose).mp.
-
(colloidal bismuth subcitrate or bi‐citrate or biselic or bismofarma or bismuth citrate or bismuth subcitrate or bismuth tripotassium dicitrate or bissubcit or de‐nol or de‐noltab or gastrodenol or sucrato or tripotassium dicitratobismuthate or ventrisol‐polfa).mp.
-
(carbenoxolone sodium or bioplex or bioral or carbenoxalone or carbosan or disodium enoxolone or duogastrone or pharmaxolon or sanodin).mp. [mp=title, abstract, subject headings, heading word, drug trade name, original title, device manufacturer, drug manufacturer name]
-
Deglycyrrhizinised Liquorice.mp.
-
or/50‐85
-
42 and 49 and 86
-
25 and 87
Update search on 15 June 2016 and 22 August 2017:
-
exp upper gastrointestinal tract/
-
(stomach or antrum or antral or pyloric or pylorus or gastri* or gastro* or duoden* or epigastr* or gastritis or duodenitis).tw,kw.
-
(esophag* or oesophag* or gastroduoden* or gastrointestinal).tw,kw.
-
exp peptic ulcer/
-
(peptic or ulcer* or upper GI or UGI or PUD).tw,kw.
-
or/1‐5
-
(hemorrhag* or haemorrhag* or bleed* or rebleed* or re‐bleed* or bled or rebled).tw,kw.
-
(mucosa* adj2 (injur* or damage* or lesion*)).tw,kw.
-
exp bleeding/
-
or/7‐9
-
6 and 10
-
exp gastrointestinal hemorrhage/
-
exp melena/
-
(melena or melaena).tw,kw.
-
exp hematemesis/
-
(haematemesis or hematemesis).tw,kw.
-
((coffee adj ground) or "UGIB").tw,kw.
-
or/11‐17
-
exp intensive care unit/
-
exp critical illness/
-
exp intensive care/
-
(intensive care or critical care or respiratory care or recovery room or close attention unit* or special care unit* or coronary care or burn unit* or ICU or RCU or CCU).tw,kw.
-
((critical or critically or severe or serious*) adj2 (ill or illness)).tw,kw.
-
((head or brain or severe or multiple) adj2 (injur* or trauma*)).tw,kw.
-
exp artificial ventilation/
-
(((mechanical* or artificial or controlled) adj2 (ventilat* or respiration)) or on ventilator or ventilated patients).tw,kw.
-
((prophylaxis or prophylactic or prevent*) and (((after or post) adj2 (surgery or operat*)) or postoperat* or sepsis or hepatic failure* or respiratory failure* or renal failure* or burns or transplantation or stroke or incubated or acute pancreatitis or intracerebral h*morrhag* or intracerebral bleed*)).ti,ab.
-
or/19‐27
-
18 and 28
-
(stress adj2 (ulcer* or gastritis or bleed* or hemorrhage* or haemorrhage*)).tw,kw.
-
29 or 30
-
random:.tw.
-
placebo:.mp.
-
double‐blind:.tw.
-
32 or 33 or 34
-
31 and 35
-
limit 36 to yr="2012 ‐Current"
Appendix 5. LILACS search strategy
Descriptors in Health Sciences (DeCS) were used to account for Portuguese, Spanish and English terms in LILACS.
(E02.760.190.400 or N02.278.388.493 or E02.760.190) [DeCS Category] and (C06.405.227 or C06.405.227.400 or A12.459.764 or C06.405.227.700) [DeCS Category]
Update search on 15 June 2016 and 22 August 2017:
(((tw:(ulcer OR stomach OR antrum OR antral OR gastri* OR gastro* OR duoden* OR epigastr* OR gastritis OR duodenitis OR esophageal* OR oesophageal*)) AND (tw:(hemorrhag* OR haemorrhag* OR bleed* OR rebleed* OR re‐bleed* OR bled OR rebled))) OR (tw: (stress ulcer*)) OR (mh: (c06.405.227)) ) AND ( (mh: (e02.760.190)) OR (tw: (intensive care OR critical care OR critically ill OR mechanical* ventilat*))) AND (instance:"regional") AND ( db:("LILACS") AND type_of_study:("clinical_trials"))

PRISMA flow chart of included studies.

Risk of bias graph: review authors' judgements about each risk of bias item presented as percentages across all included studies.

Risk of bias summary: review authors' judgements about each risk of bias item for each included study.
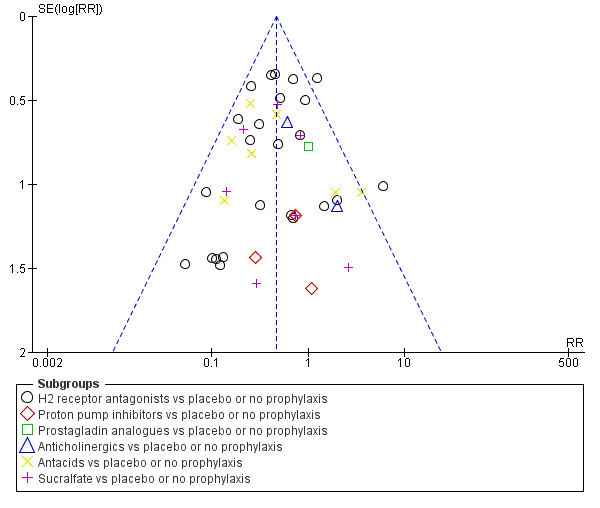
Funnel plot of comparison: 1 Interventions versus placebo or no prophylaxis, outcome: 1.1 Clinically important upper GI bleeding.
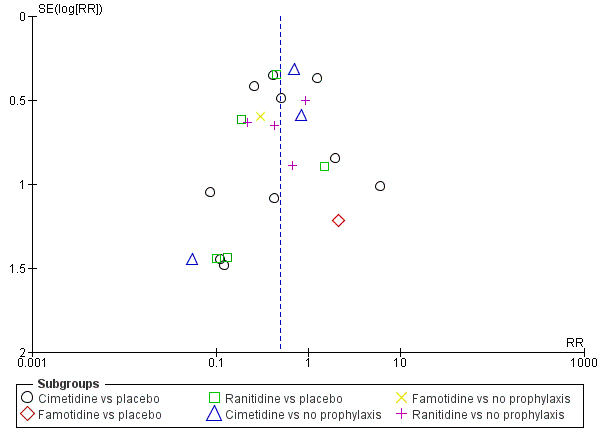
Funnel plot of comparison: 2 H2 receptor antagonists versus placebo or no prophylaxis, outcome: 2.1 Clinically important upper GI bleeding.

Funnel plot of comparison: 9 H2 receptor antagonists versus proton pump inhibitors, outcome: 9.1 Clinically important upper GI bleeding.
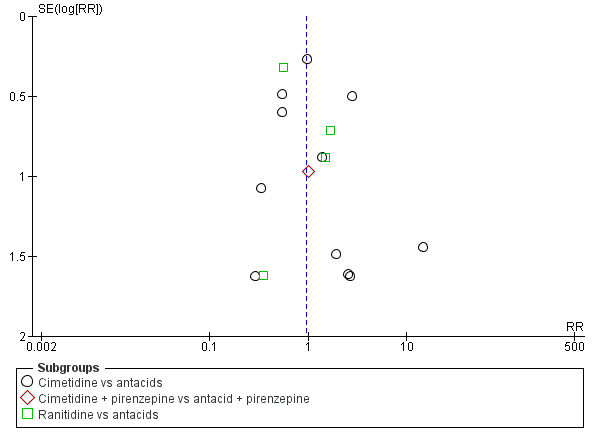
Funnel plot of comparison: 10 H2 receptor antagonists versus antacids, outcome: 10.1 Clinically important upper GI bleeding.
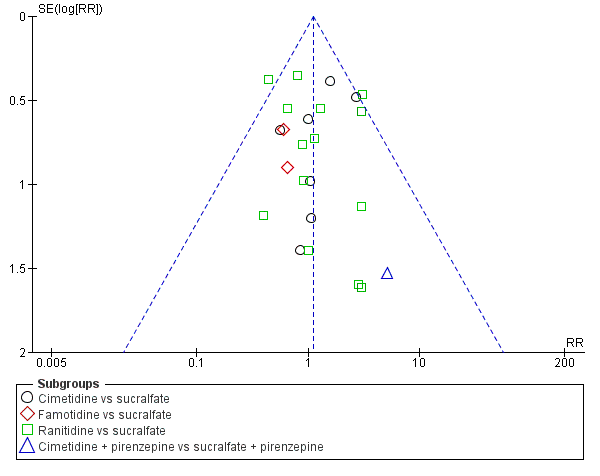
Funnel plot of comparison: 11 H2 receptor antagonists versus sucralfate, outcome: 11.1 Clinically important upper GI bleeding.

Funnel plot of comparison: 19 Antacids versus sucralfate, outcome: 19.1 Clinically important upper GI bleeding.

Comparison 1 Interventions versus placebo or no prophylaxis, Outcome 1 Clinically important upper GI bleeding.

Comparison 1 Interventions versus placebo or no prophylaxis, Outcome 2 Nosocomial pneumonia.

Comparison 1 Interventions versus placebo or no prophylaxis, Outcome 3 All‐cause mortality in ICU.

Comparison 1 Interventions versus placebo or no prophylaxis, Outcome 4 All‐cause mortality in hospital.

Comparison 1 Interventions versus placebo or no prophylaxis, Outcome 5 Duration of ICU stay.
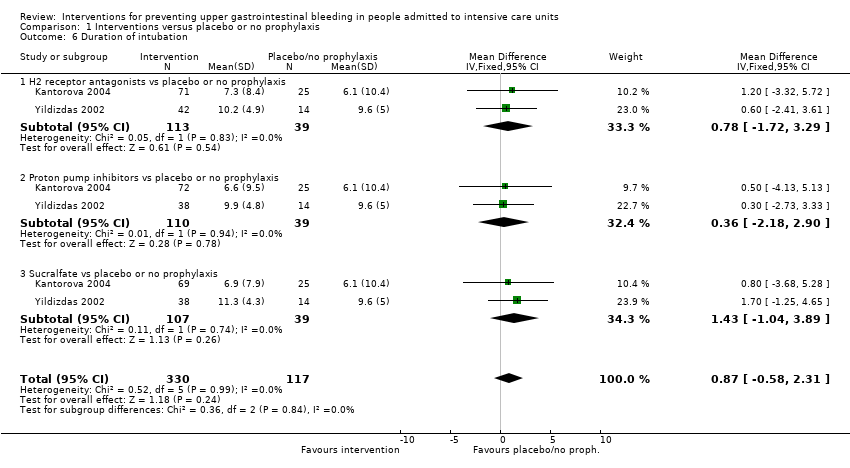
Comparison 1 Interventions versus placebo or no prophylaxis, Outcome 6 Duration of intubation.

Comparison 1 Interventions versus placebo or no prophylaxis, Outcome 7 Number of participants requiring blood transfusions.
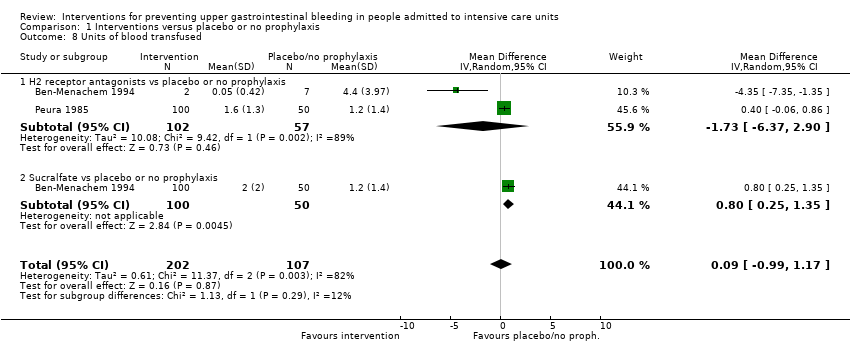
Comparison 1 Interventions versus placebo or no prophylaxis, Outcome 8 Units of blood transfused.

Comparison 2 H2 receptor antagonists versus placebo or no prophylaxis, Outcome 1 Clinically important upper GI bleeding.

Comparison 2 H2 receptor antagonists versus placebo or no prophylaxis, Outcome 2 Nosocomial pneumonia.
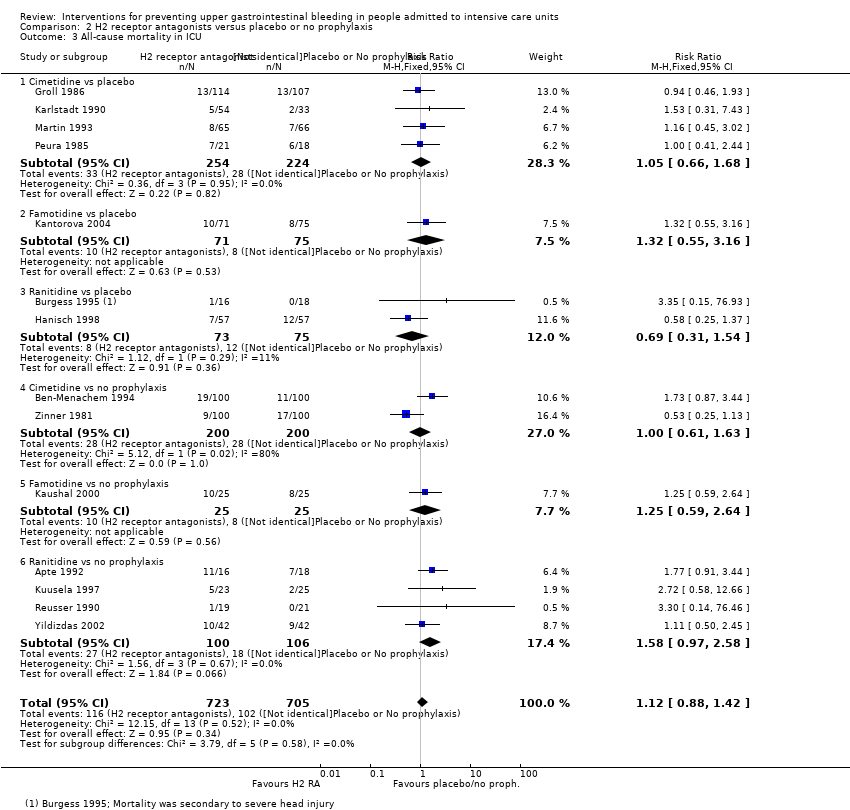
Comparison 2 H2 receptor antagonists versus placebo or no prophylaxis, Outcome 3 All‐cause mortality in ICU.
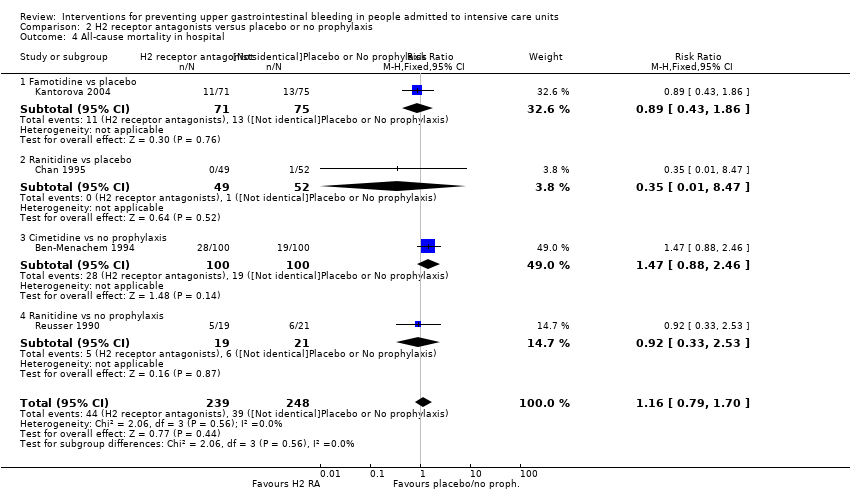
Comparison 2 H2 receptor antagonists versus placebo or no prophylaxis, Outcome 4 All‐cause mortality in hospital.

Comparison 2 H2 receptor antagonists versus placebo or no prophylaxis, Outcome 5 Duration of ICU stay.

Comparison 2 H2 receptor antagonists versus placebo or no prophylaxis, Outcome 6 Duration of intubation.
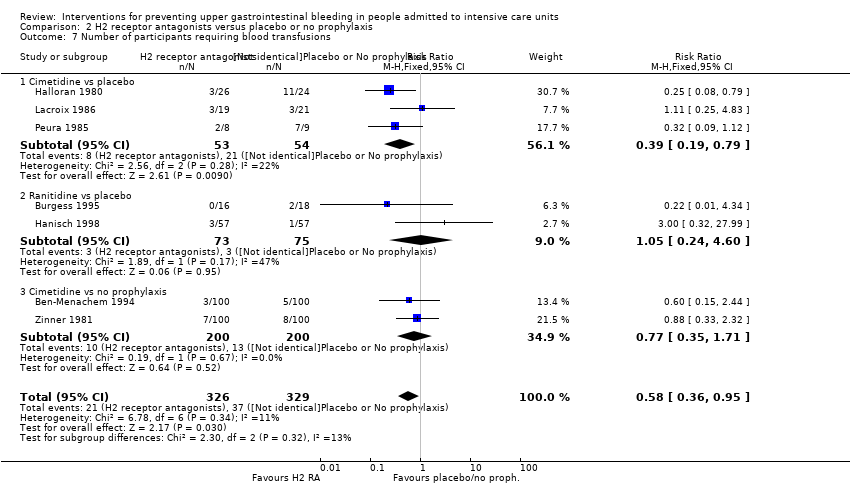
Comparison 2 H2 receptor antagonists versus placebo or no prophylaxis, Outcome 7 Number of participants requiring blood transfusions.

Comparison 2 H2 receptor antagonists versus placebo or no prophylaxis, Outcome 8 Units of blood transfused.

Comparison 2 H2 receptor antagonists versus placebo or no prophylaxis, Outcome 9 Adverse events of interventions.

Comparison 3 Proton pump inhibitors versus placebo or no prophylaxis, Outcome 1 Clinically important upper GI bleeding.
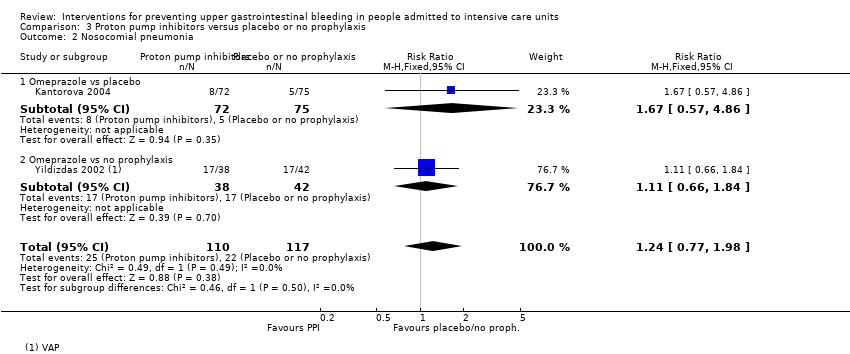
Comparison 3 Proton pump inhibitors versus placebo or no prophylaxis, Outcome 2 Nosocomial pneumonia.

Comparison 3 Proton pump inhibitors versus placebo or no prophylaxis, Outcome 3 All‐cause mortality in ICU.

Comparison 3 Proton pump inhibitors versus placebo or no prophylaxis, Outcome 4 All‐cause mortality in hospital.

Comparison 3 Proton pump inhibitors versus placebo or no prophylaxis, Outcome 5 Duration of ICU stay.
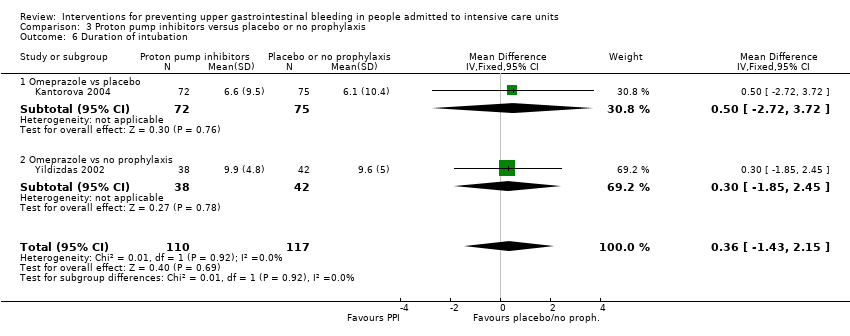
Comparison 3 Proton pump inhibitors versus placebo or no prophylaxis, Outcome 6 Duration of intubation.

Comparison 4 Proton pump inhibitors + sucralfate versus no prophylaxis, Outcome 1 Clinically important upper GI bleeding.

Comparison 5 Prostaglandin analogues versus placebo or no prophylaxis, Outcome 1 Clinically important upper GI bleeding.
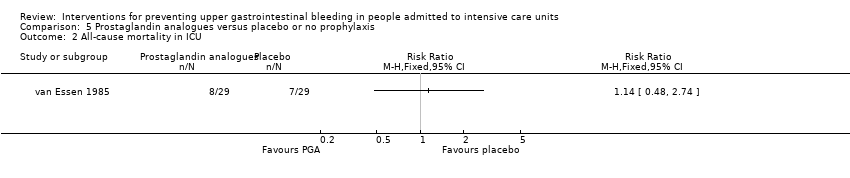
Comparison 5 Prostaglandin analogues versus placebo or no prophylaxis, Outcome 2 All‐cause mortality in ICU.

Comparison 6 Anticholinergics versus placebo or no prophylaxis, Outcome 1 Clinically important upper GI bleeding.

Comparison 6 Anticholinergics versus placebo or no prophylaxis, Outcome 2 Nosocomial pneumonia.

Comparison 6 Anticholinergics versus placebo or no prophylaxis, Outcome 3 All‐cause mortality in ICU.
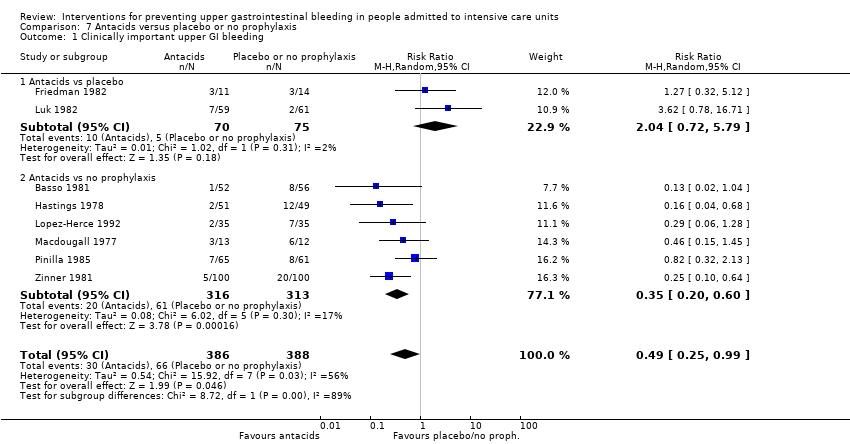
Comparison 7 Antacids versus placebo or no prophylaxis, Outcome 1 Clinically important upper GI bleeding.
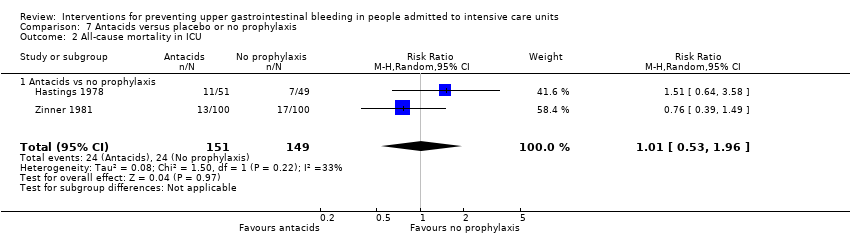
Comparison 7 Antacids versus placebo or no prophylaxis, Outcome 2 All‐cause mortality in ICU.

Comparison 7 Antacids versus placebo or no prophylaxis, Outcome 3 All‐cause mortality in hospital.

Comparison 7 Antacids versus placebo or no prophylaxis, Outcome 4 Number of participants requiring blood transfusions.

Comparison 7 Antacids versus placebo or no prophylaxis, Outcome 5 Adverse events of interventions.

Comparison 8 Sucralfate versus placebo or no prophylaxis, Outcome 1 Clinically important upper GI bleeding.
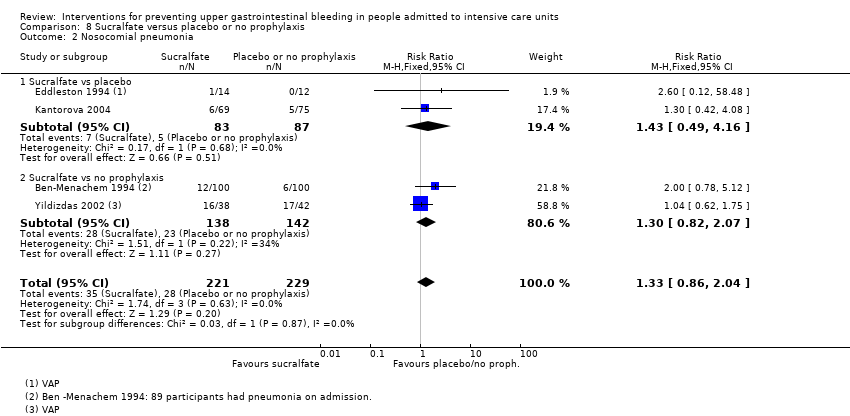
Comparison 8 Sucralfate versus placebo or no prophylaxis, Outcome 2 Nosocomial pneumonia.

Comparison 8 Sucralfate versus placebo or no prophylaxis, Outcome 3 All‐cause mortality in ICU.

Comparison 8 Sucralfate versus placebo or no prophylaxis, Outcome 4 All‐cause mortality in hospital.

Comparison 8 Sucralfate versus placebo or no prophylaxis, Outcome 5 Duration of ICU stay.

Comparison 8 Sucralfate versus placebo or no prophylaxis, Outcome 6 Duration of intubation.
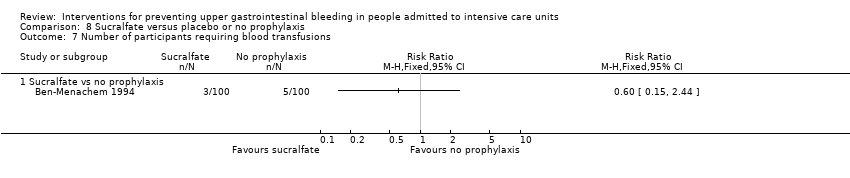
Comparison 8 Sucralfate versus placebo or no prophylaxis, Outcome 7 Number of participants requiring blood transfusions.
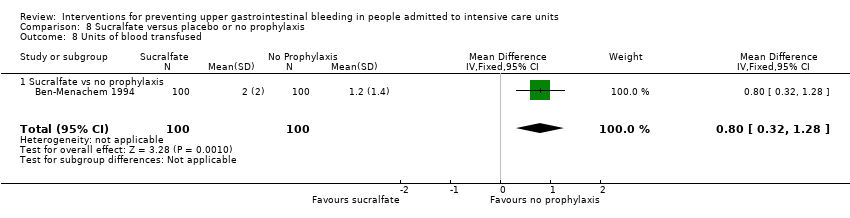
Comparison 8 Sucralfate versus placebo or no prophylaxis, Outcome 8 Units of blood transfused.

Comparison 8 Sucralfate versus placebo or no prophylaxis, Outcome 9 Adverse events of interventions.

Comparison 9 H2 receptor antagonists versus proton pump inhibitors, Outcome 1 Clinically important upper GI bleeding.

Comparison 9 H2 receptor antagonists versus proton pump inhibitors, Outcome 2 Nosocomial pneumonia.
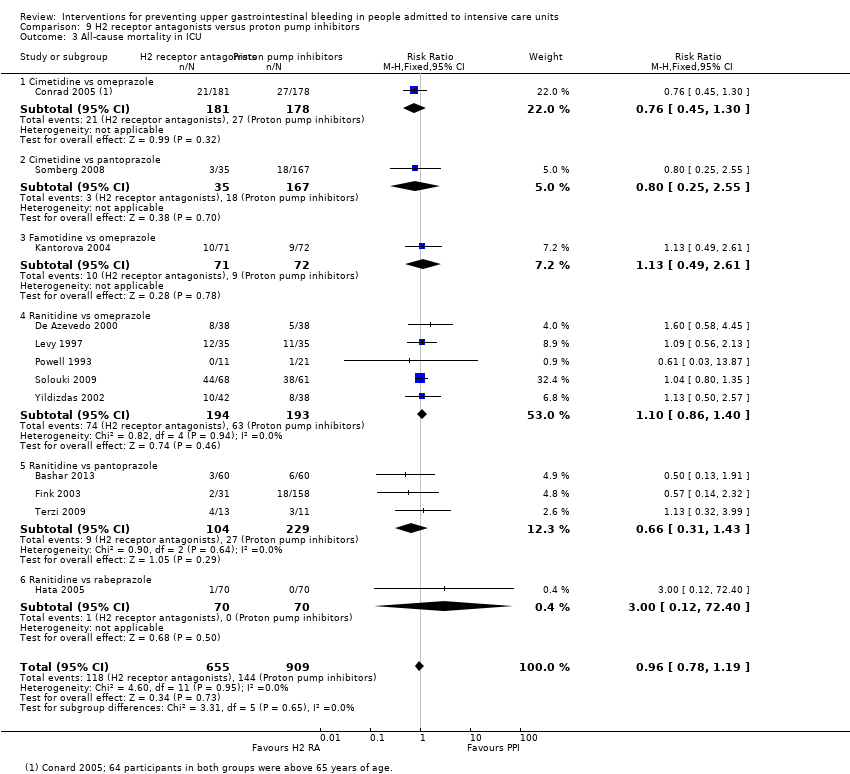
Comparison 9 H2 receptor antagonists versus proton pump inhibitors, Outcome 3 All‐cause mortality in ICU.

Comparison 9 H2 receptor antagonists versus proton pump inhibitors, Outcome 4 All‐cause mortality in hospital.

Comparison 9 H2 receptor antagonists versus proton pump inhibitors, Outcome 5 Duration of ICU stay.
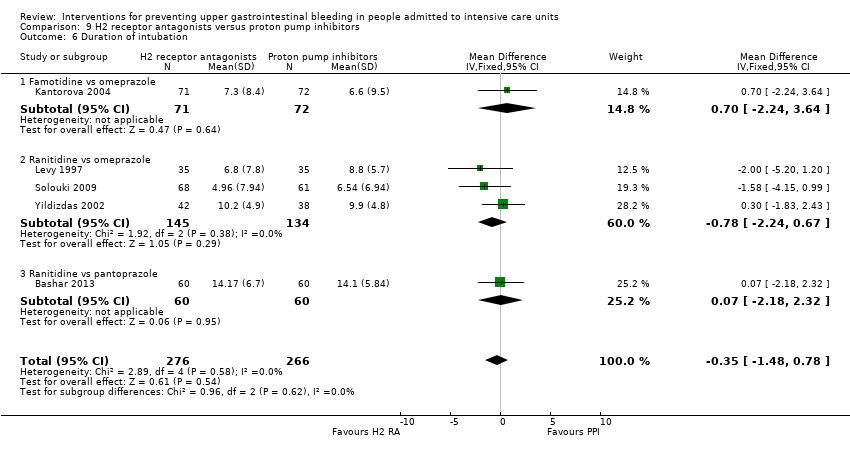
Comparison 9 H2 receptor antagonists versus proton pump inhibitors, Outcome 6 Duration of intubation.
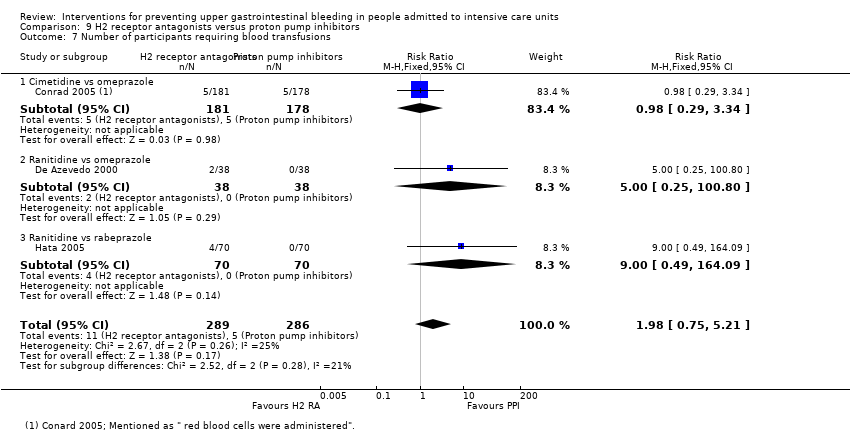
Comparison 9 H2 receptor antagonists versus proton pump inhibitors, Outcome 7 Number of participants requiring blood transfusions.

Comparison 9 H2 receptor antagonists versus proton pump inhibitors, Outcome 8 Adverse events of interventions.

Comparison 10 H2 receptor antagonists versus antacids, Outcome 1 Clinically important upper GI bleeding.

Comparison 10 H2 receptor antagonists versus antacids, Outcome 2 Nosocomial pneumonia.

Comparison 10 H2 receptor antagonists versus antacids, Outcome 3 All‐cause mortality in ICU.
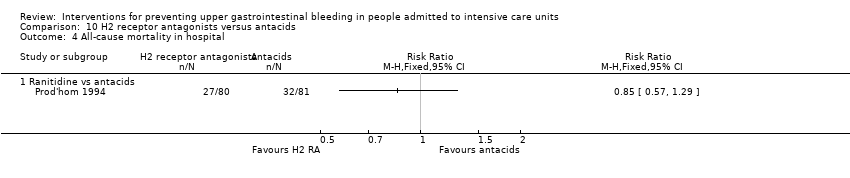
Comparison 10 H2 receptor antagonists versus antacids, Outcome 4 All‐cause mortality in hospital.

Comparison 10 H2 receptor antagonists versus antacids, Outcome 5 Duration of intubation.

Comparison 10 H2 receptor antagonists versus antacids, Outcome 6 Number of participants requiring blood transfusions.

Comparison 10 H2 receptor antagonists versus antacids, Outcome 7 Adverse events of interventions.
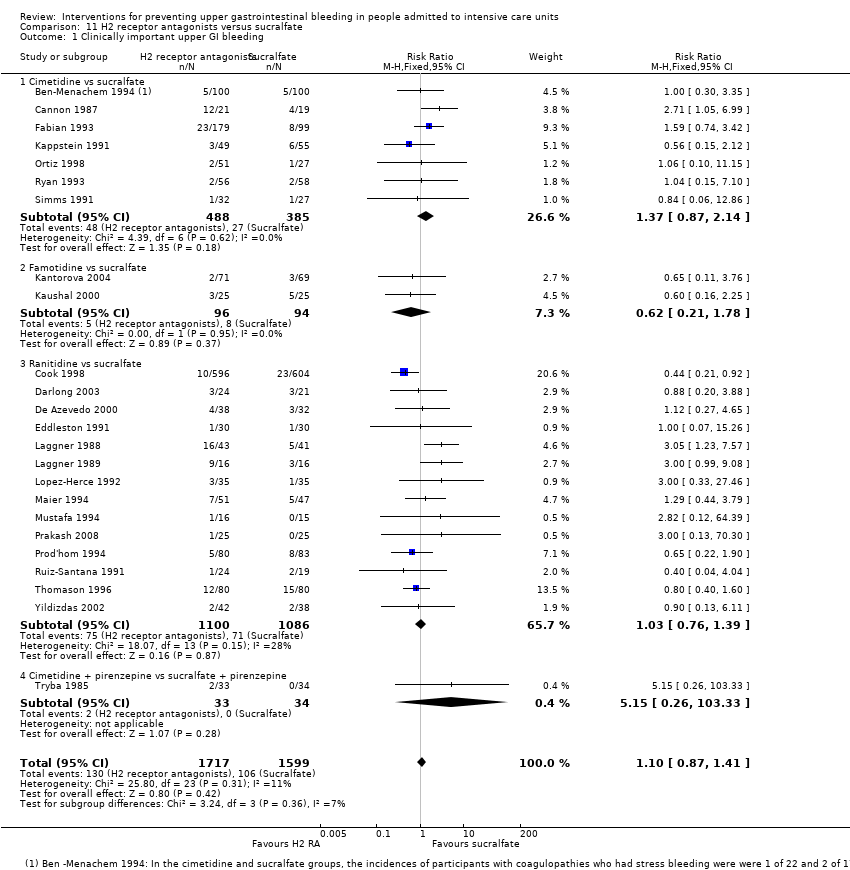
Comparison 11 H2 receptor antagonists versus sucralfate, Outcome 1 Clinically important upper GI bleeding.
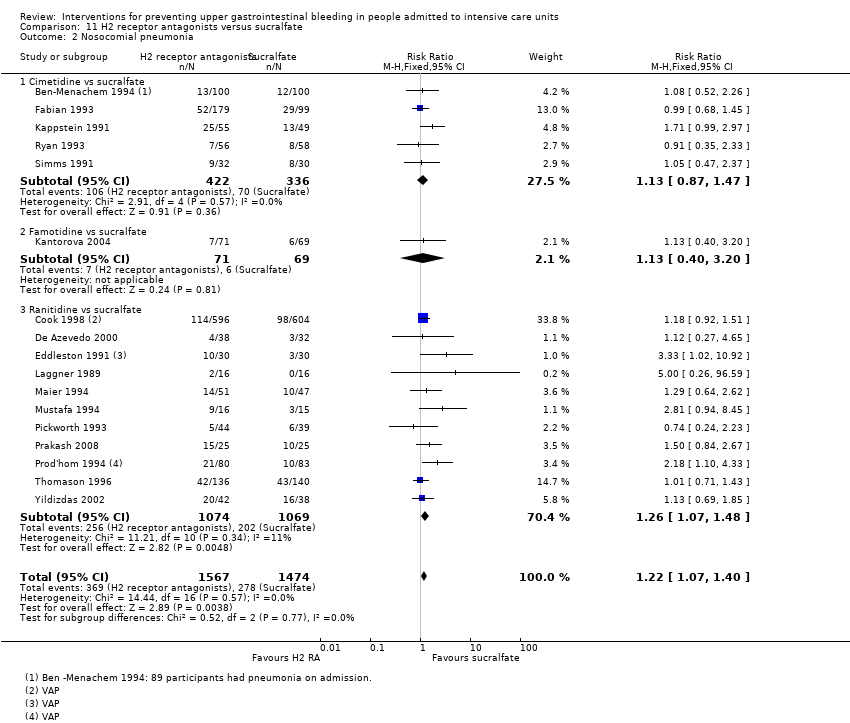
Comparison 11 H2 receptor antagonists versus sucralfate, Outcome 2 Nosocomial pneumonia.

Comparison 11 H2 receptor antagonists versus sucralfate, Outcome 3 All‐cause mortality in ICU.

Comparison 11 H2 receptor antagonists versus sucralfate, Outcome 4 All‐cause mortality in hospital.

Comparison 11 H2 receptor antagonists versus sucralfate, Outcome 5 Duration of intubation.

Comparison 11 H2 receptor antagonists versus sucralfate, Outcome 6 Duration of ICU stay.

Comparison 11 H2 receptor antagonists versus sucralfate, Outcome 7 Number of participants requiring blood transfusion.

Comparison 11 H2 receptor antagonists versus sucralfate, Outcome 8 Units of blood transfused.

Comparison 11 H2 receptor antagonists versus sucralfate, Outcome 9 Adverse events of interventions.

Comparison 12 H2 receptor antagonists versus anticholinergics, Outcome 1 Clinically important upper GI bleeding.
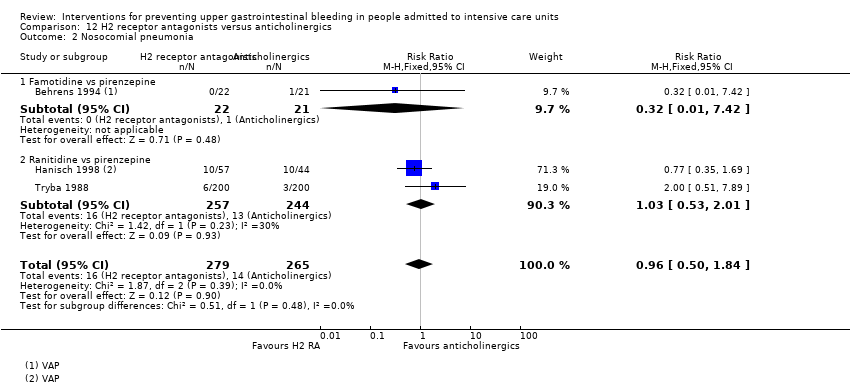
Comparison 12 H2 receptor antagonists versus anticholinergics, Outcome 2 Nosocomial pneumonia.

Comparison 12 H2 receptor antagonists versus anticholinergics, Outcome 3 All‐cause mortality in ICU.

Comparison 12 H2 receptor antagonists versus anticholinergics, Outcome 4 Number of participants requiring blood transfusion.
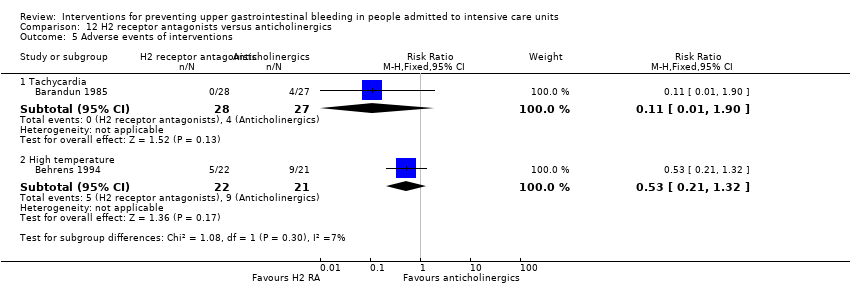
Comparison 12 H2 receptor antagonists versus anticholinergics, Outcome 5 Adverse events of interventions.

Comparison 13 H2 receptor antagonists versus prostaglandin analogues, Outcome 1 Clinically important upper GI bleeding.

Comparison 13 H2 receptor antagonists versus prostaglandin analogues, Outcome 2 All‐cause mortality in ICU.

Comparison 14 H2 receptor antagonists versus teprenone, Outcome 1 Clinically important upper GI bleeding.

Comparison 14 H2 receptor antagonists versus teprenone, Outcome 2 All‐cause mortality in ICU.

Comparison 14 H2 receptor antagonists versus teprenone, Outcome 3 Number of participants requiring blood transfusion.

Comparison 15 H2 receptor antagonist + antacids versus sucralfate, Outcome 1 Clinically important upper GI bleeding.

Comparison 15 H2 receptor antagonist + antacids versus sucralfate, Outcome 2 Nosocomial pneumonia.

Comparison 15 H2 receptor antagonist + antacids versus sucralfate, Outcome 3 All‐cause mortality in ICU.

Comparison 15 H2 receptor antagonist + antacids versus sucralfate, Outcome 4 Duration of ICU stay.

Comparison 15 H2 receptor antagonist + antacids versus sucralfate, Outcome 5 Duration of intubation.

Comparison 15 H2 receptor antagonist + antacids versus sucralfate, Outcome 6 Number of participants requiring blood transfusion.

Comparison 16 Proton pump inhibitors versus teprenone, Outcome 1 Clinically important upper GI bleeding.

Comparison 16 Proton pump inhibitors versus teprenone, Outcome 2 All‐cause mortality in ICU.

Comparison 16 Proton pump inhibitors versus teprenone, Outcome 3 Number of participants requiring blood transfusion.
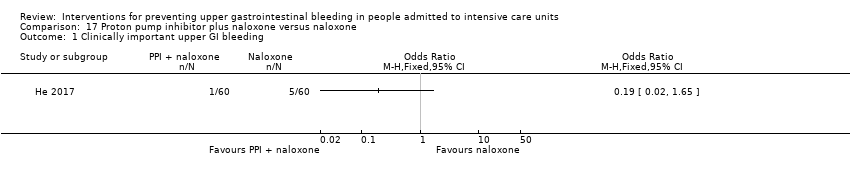
Comparison 17 Proton pump inhibitor plus naloxone versus naloxone, Outcome 1 Clinically important upper GI bleeding.
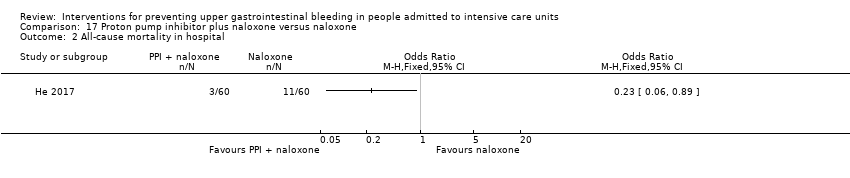
Comparison 17 Proton pump inhibitor plus naloxone versus naloxone, Outcome 2 All‐cause mortality in hospital.

Comparison 17 Proton pump inhibitor plus naloxone versus naloxone, Outcome 3 Adverse events ‐ gastrointestinal discomfort.
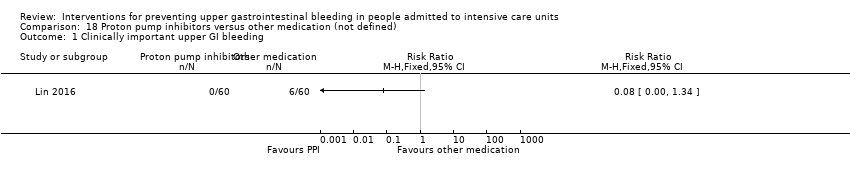
Comparison 18 Proton pump inhibitors versus other medication (not defined), Outcome 1 Clinically important upper GI bleeding.

Comparison 18 Proton pump inhibitors versus other medication (not defined), Outcome 2 Nosocomial pneumonia.

Comparison 18 Proton pump inhibitors versus other medication (not defined), Outcome 3 All‐cause mortality in hospital.

Comparison 19 Antacids versus sucralfate, Outcome 1 Clinically important upper GI bleeding.
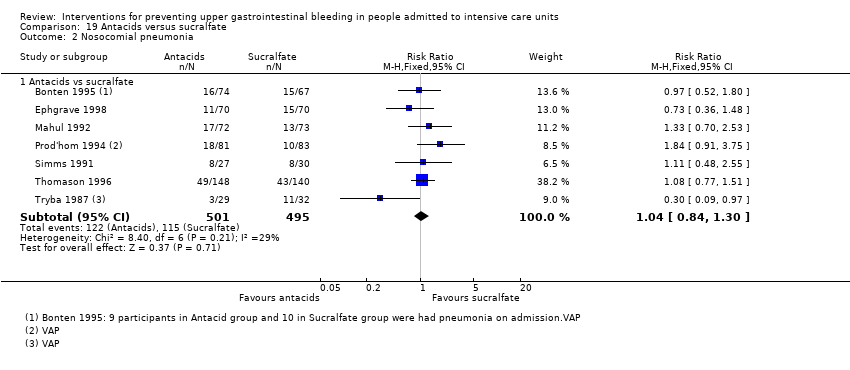
Comparison 19 Antacids versus sucralfate, Outcome 2 Nosocomial pneumonia.

Comparison 19 Antacids versus sucralfate, Outcome 3 All‐cause mortality in ICU.

Comparison 19 Antacids versus sucralfate, Outcome 4 All‐cause mortality in hospital.

Comparison 19 Antacids versus sucralfate, Outcome 5 Duration of ICU stay.

Comparison 19 Antacids versus sucralfate, Outcome 6 Duration of intubation.

Comparison 19 Antacids versus sucralfate, Outcome 7 Number of participants requiring blood transfusion.

Comparison 19 Antacids versus sucralfate, Outcome 8 Adverse events of interventions.

Comparison 20 Antacids versus prostaglandin analogues, Outcome 1 Clinically important upper GI bleeding.

Comparison 20 Antacids versus prostaglandin analogues, Outcome 2 All‐cause mortality in ICU.

Comparison 20 Antacids versus prostaglandin analogues, Outcome 3 Adverse events of interventions.
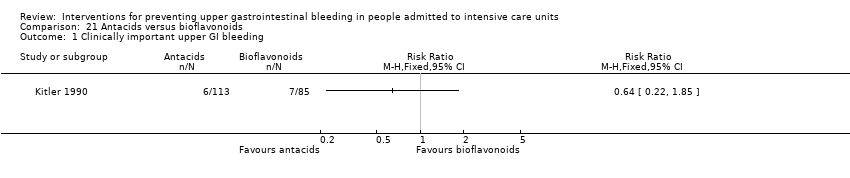
Comparison 21 Antacids versus bioflavonoids, Outcome 1 Clinically important upper GI bleeding.
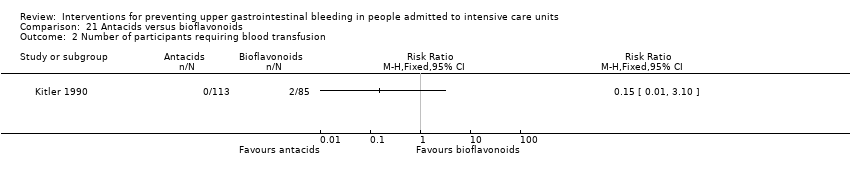
Comparison 21 Antacids versus bioflavonoids, Outcome 2 Number of participants requiring blood transfusion.

Comparison 22 Sucralfate versus proton pump inhibitors, Outcome 1 Clinically important upper GI bleeding.
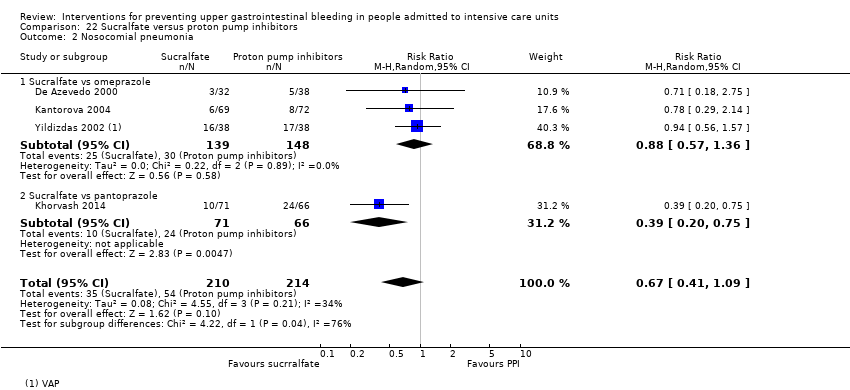
Comparison 22 Sucralfate versus proton pump inhibitors, Outcome 2 Nosocomial pneumonia.
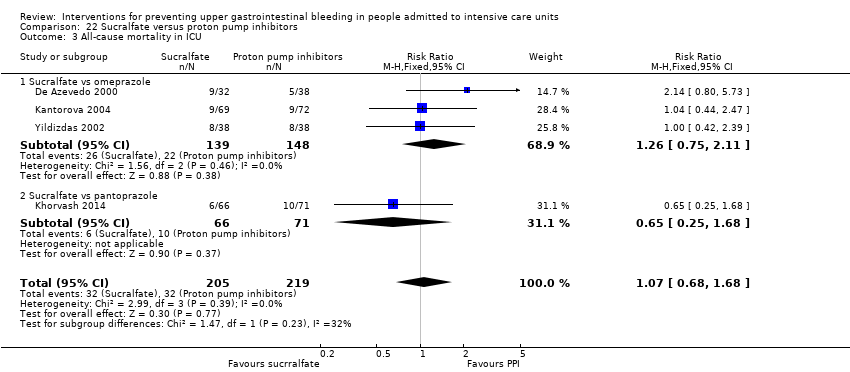
Comparison 22 Sucralfate versus proton pump inhibitors, Outcome 3 All‐cause mortality in ICU.
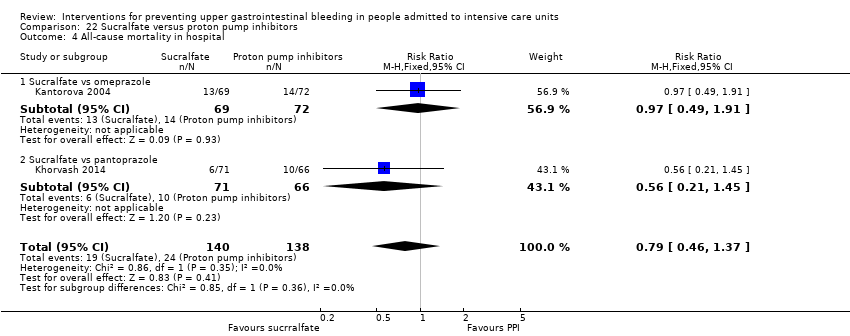
Comparison 22 Sucralfate versus proton pump inhibitors, Outcome 4 All‐cause mortality in hospital.

Comparison 22 Sucralfate versus proton pump inhibitors, Outcome 5 Duration of ICU stay.

Comparison 22 Sucralfate versus proton pump inhibitors, Outcome 6 Duration of intubation.
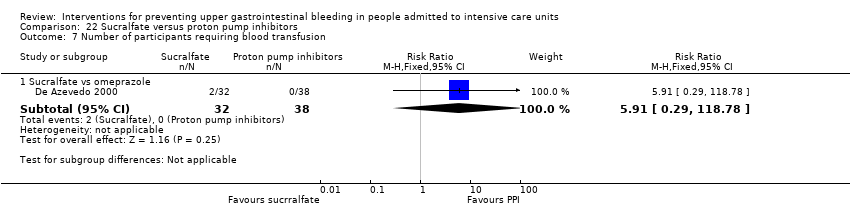
Comparison 22 Sucralfate versus proton pump inhibitors, Outcome 7 Number of participants requiring blood transfusion.

Comparison 22 Sucralfate versus proton pump inhibitors, Outcome 8 Adverse events of interventions.

Comparison 23 Sucralfate versus bioflavonoids, Outcome 1 Clinically important upper GI bleeding.

Comparison 23 Sucralfate versus bioflavonoids, Outcome 2 Number of participants requiring blood transfusion.

Comparison 24 Total parenteral nutrition (TPN) versus any other intervention + TPN, Outcome 1 Clinically important upper GI bleeding.

Comparison 24 Total parenteral nutrition (TPN) versus any other intervention + TPN, Outcome 2 All‐cause mortality in ICU.

Comparison 24 Total parenteral nutrition (TPN) versus any other intervention + TPN, Outcome 3 Duration of intubation.

Comparison 25 Bowel stimulation versus no prophylaxis, Outcome 1 Clinically important upper GI bleeding.

Comparison 26 Nasojejunal nutrition versus nasogastric nutrition, Outcome 1 Clinically important upper GI bleeding.

Comparison 26 Nasojejunal nutrition versus nasogastric nutrition, Outcome 2 Nosocomial pneumonia.
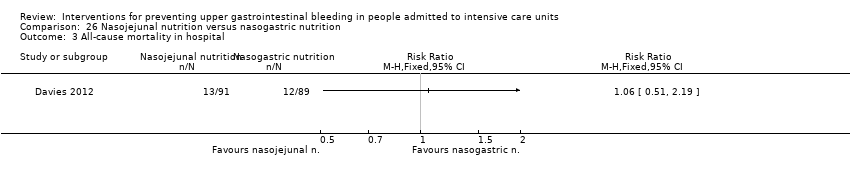
Comparison 26 Nasojejunal nutrition versus nasogastric nutrition, Outcome 3 All‐cause mortality in hospital.

Comparison 26 Nasojejunal nutrition versus nasogastric nutrition, Outcome 4 Adverse events of interventions.
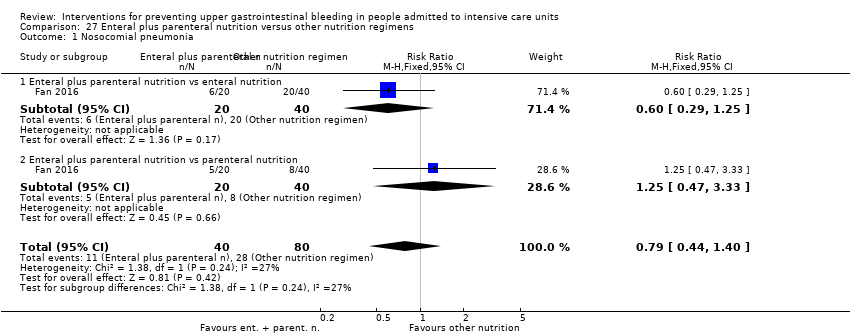
Comparison 27 Enteral plus parenteral nutrition versus other nutrition regimens, Outcome 1 Nosocomial pneumonia.

Comparison 27 Enteral plus parenteral nutrition versus other nutrition regimens, Outcome 2 All‐cause mortality in hospital.
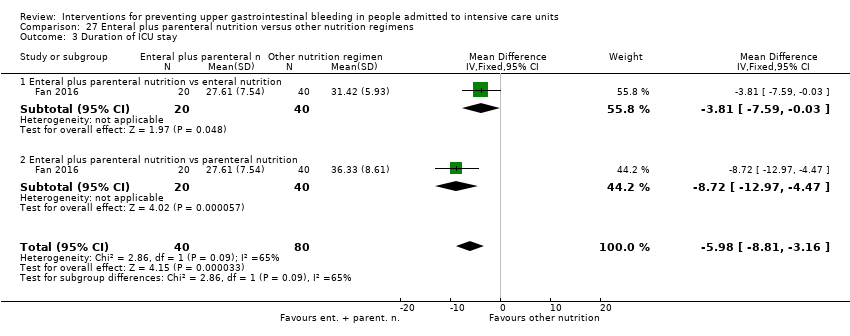
Comparison 27 Enteral plus parenteral nutrition versus other nutrition regimens, Outcome 3 Duration of ICU stay.

Comparison 27 Enteral plus parenteral nutrition versus other nutrition regimens, Outcome 4 Duration of intubation.

Comparison 27 Enteral plus parenteral nutrition versus other nutrition regimens, Outcome 5 Adverse events ‐ stress ulcer.

Comparison 27 Enteral plus parenteral nutrition versus other nutrition regimens, Outcome 6 Adverse events ‐ diarrhoea.

Comparison 27 Enteral plus parenteral nutrition versus other nutrition regimens, Outcome 7 Adverse events ‐ pyaemia.
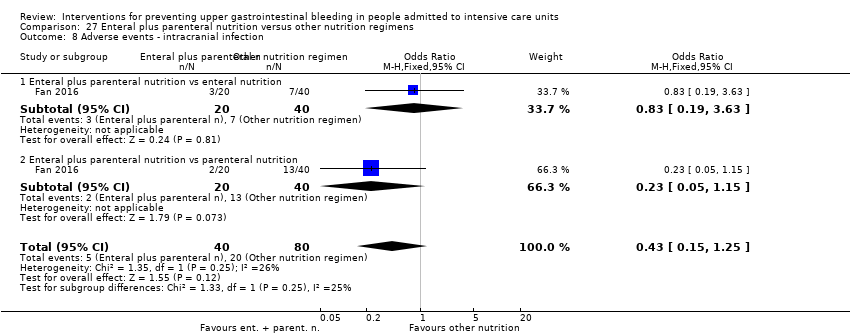
Comparison 27 Enteral plus parenteral nutrition versus other nutrition regimens, Outcome 8 Adverse events ‐ intracranial infection.

Comparison 27 Enteral plus parenteral nutrition versus other nutrition regimens, Outcome 9 Adverse events ‐ hypoproteinaemia.
| Any intervention compared with placebo or no prophylaxis for preventing upper gastrointestinal bleeding in people admitted to intensive care units | ||||||
| Patient or population: people admitted to intensive care units | ||||||
| Outcomes | Anticipated absolute effects* (95% CI) | Relative effect | № of participants | Certainty of the evidence | Comments | |
| Risk with placebo or no prophylaxis | Risk with Interventions | |||||
| Clinically important upper GI bleeding Follow‐up: 15 days† | Study population | RR 0.47 | 3207 | ⊕⊕⊕⊝ | ||
| 188 per 1000 | 88 per 1000 | |||||
| Nosocomial pneumonia Follow‐up: 48 hours after extubation‡ | Study population | RR 1.15 | 1331 | ⊕⊕⊝⊝ | ||
| 143 per 1000 | 164 per 1000 | |||||
| All‐cause mortality in ICU Follow‐up: 4 weeks§ | Study population | RR 1.10 | 2159 | ⊕⊕⊝⊝ | ||
| 152 per 1000 | 168 per 1000 | |||||
| Duration of ICU stay Follow‐up: not reported | Mean duration of ICU stay ranged from 8.6 to 11.1 days | MD 0.24 days higher | ‐ | 447 | ⊕⊕⊝⊝ | |
| Number of participants requiring blood transfusion Follow‐up: 48 hours after discharge‡ | Study population | RR 0.63 | 981 | ⊕⊕⊕⊝ | ||
| 96 per 1000 | 60 per 1000 | |||||
| Serious adverse events | Not reported | |||||
| *The risk in the intervention group (and its 95% confidence interval) is based on the assumed risk in the comparison group and the relative effect of the intervention (and its 95% CI). †Duration of follow‐up reported in four studies. §Duration of follow‐up reported in five studies. | ||||||
| GRADE Working Group grades of evidence. | ||||||
| aDowngraded by one level for risk of bias because of high risk of selection bias in one study, high risk of performance bias in nine studies, high risk of detection bias in five studies, high risk of attrition bias in four studies, high risk of reporting bias in five studies, and high risk of other biases in four studies. bDowngraded by one level for imprecision because effect estimate and 95% CI were compatible with benefit and harm. cDowngraded by one level for risk of bias because of high risk of performance bias in three studies, high risk of detection bias in one study, and high risk of attrition bias in two studies. dDowngraded by one level for risk of bias because of high risk of performance bias in seven studies and high risk of attrition bias in two studies. eDowngraded by one level for risk of bias because of high risk of performance bias in one study. fDowngraded by one level for risk of bias because of high risk of selection bias in one study, high risk of performance bias in two studies, high risk of attrition bias in one study, high risk of reporting bias in one study, and high risk of other biases in one study. | ||||||
| H2 receptor antagonists compared with placebo or no prophylaxis for preventing upper gastrointestinal bleeding in people admitted to intensive care units | ||||||
| Patient or population: people admitted to intensive care units | ||||||
| Outcomes | Anticipated absolute effects* (95% CI) | Relative effect | № of participants | Certainty of the evidence | Comments | |
| Risk with placebo or no prophylaxis | Risk with H2 receptor antagonists | |||||
| Clinically important upper GI bleeding Follow‐up: 15 days/weeks† | Study population | RR 0.50 | 2149 | ⊕⊕⊕⊝ | ||
| 182 per 1000 | 91 per 1000 | |||||
| Nosocomial pneumonia Follow‐up: 48 hours after extubation‡ | Study population | RR 1.12 | 945 | ⊕⊕⊝⊝ | ||
| 146 per 1000 | 164 per 1000 | |||||
| All‐cause mortality in ICU Follow‐up: 4 weeks§ | Study population | RR 1.12 | 1428 | ⊕⊕⊝⊝ | ||
| 145 per 1000 | 162 per 1000 | |||||
| Duration of ICU stay Follow‐up: not reported | Mean duration of ICU stay ranged from 8.6 to 11.1 days | MD 0.73 days higher | ‐ | 230 | ⊕⊕⊝⊝ | |
| Number of participants requiring blood transfusions Follow‐up: 48 hours after extubationǁ | Study population | RR 0.58 | 655 | ⊕⊕⊕⊝ | ||
| 112 per 1000 | 65 per 1000 | |||||
| Serious adverse events | Not reported | |||||
| *The risk in the intervention group (and its 95% confidence interval) is based on the assumed risk in the comparison group and the relative effect of the intervention (and its 95% CI). ‡Duration of follow‐up reported in two studies. §Duration of follow‐up reported in five studies. ǁDuration of follow‐up reported in one study. | ||||||
| GRADE Working Group grades of evidence. | ||||||
| aDowngraded by one level for risk of bias because of high risk of selection bias in one study, high risk of performance bias in eight studies, high risk of attrition bias in two studies, high risk of reporting bias in four studies, and high risk of other biases in three studies. bDowngraded by one level for imprecision because 95% CI was compatible with benefit and harm. cDowngraded by one level for risk of bias because of high risk performance bias in three studies and high risk of attrition bias in one study. dDowngraded by one level for risk of bias because of high risk of performance bias in three studies and high risk of attrition bias in one study. eDowngraded by one level for risk of bias because of high risk of performance bias in one study. fDowngraded by one level for risk of bias because of high risk of selection bias in one study, high risk of performance bias in two studies, high risk of attrition bias in one study, and high risk of other biases in one study. | ||||||
| Proton pump inhibitors compared with placebo or no prophylaxis for preventing upper gastrointestinal bleeding in people admitted to intensive care units | ||||||
| Patient or population: people admitted to intensive care units | ||||||
| Outcomes | Anticipated absolute effects* (95% CI) | Relative effect | № of participants | Certainty of the evidence | Comments | |
| Risk with placebo or no prophylaxis | Risk with proton pump inhibitors | |||||
| Clinically important upper GI bleeding Follow‐up: not reported | Study population | RR 0.63 | 237 | ⊕⊕⊝⊝ | ||
| 49 per 1000 | 31 per 1000 | |||||
| Nosocomial pneumonia Follow‐up: not reported | Study population | RR 1.24 | 227 | ⊕⊕⊝⊝ | ||
| 188 per 1000 | 233 per 1000 | |||||
| All‐cause mortality in ICU Follow‐up: not reported | Study population | RR 1.09 | 258 | ⊕⊕⊝⊝ | ||
| 134 per 1000 | 146 per 1000 | |||||
| Duration of ICU stay Follow‐up: not reported | Mean duration of ICU stay ranged from 8.6 to 11.1 days | MD 0.03 days lower | ‐ | 227 | ⊕⊕⊝⊝ | |
| Number of participants requiring blood transfusion | Not reported | |||||
| Serious adverse events | Not reported | |||||
| *The risk in the intervention group (and its 95% confidence interval) is based on the assumed risk in the comparison group and the relative effect of the intervention (and its 95% CI). | ||||||
| GRADE Working Group grades of evidence. | ||||||
| aDowngraded by one level for imprecision because 95% CI was compatible with benefit and harm. bDowngraded by one level for risk of bias because of high risk of performance bias in one study and high risk of attrition bias in one study. cDowngraded by one level for risk of bias because of high risk of performance bias in one study. | ||||||
| Antacids compared with placebo or no prophylaxis for preventing upper gastrointestinal bleeding in people admitted to intensive care units | ||||||
| Patient or population: people admitted to intensive care units | ||||||
| Outcomes | Anticipated absolute effects* (95% CI) | Relative effect | № of participants | Certainty of the evidence | Comments | |
| Risk with placebo or no prophylaxis | Risk with antacids | |||||
| Clinically important upper GI bleeding Follow‐up: not reported | Study population | RR 0.49 | 774 | ⊕⊕⊝⊝ | ||
| 170 per 1000 | 83 per 1000 | |||||
| Nosocomial pneumonia | Not reported | |||||
| All‐cause mortality in ICU Follow‐up: not reported | Study population | RR 1.01 | 300 | ⊕⊕⊝⊝ | ||
| 161 per 1000 | 163 per 1000 | |||||
| Duration of ICU stay | Not reported | |||||
| Number of participants requiring blood transfusions Follow‐up: not reported | Study population | RR 0.94 | 226 | ⊕⊕⊝⊝ | ||
| 45 per 1000 | 43 per 1000 | |||||
| Serious adverse events | Not reported | |||||
| *The risk in the intervention group (and its 95% confidence interval) is based on the assumed risk in the comparison group and the relative effect of the intervention (and its 95% CI). | ||||||
| GRADE Working Group grades of evidence. | ||||||
| aDowngraded by one level for inconsistency because of moderate heterogeneity; I² = 56%. bDowngraded by one level for risk of bias because of high risk of performance bias in five studies, high risk of detection bias in one study, high risk of reporting bias in two studies, and high risk of other biases in one study. cDowngraded by one level for imprecision because 95% CI was compatible with benefit and harm. dDowngraded by one level for risk of bias because of high risk of performance bias in two studies. eDowngraded by one level for risk of bias because of high risk of performance bias in one study. | ||||||
| Sucralfate compared with placebo or no prophylaxis for preventing upper gastrointestinal bleeding in people admitted to intensive care units | ||||||
| Patient or population: people admitted to intensive care units | ||||||
| Outcomes | Anticipated absolute effects* (95% CI) | Relative effect | № of participants | Certainty of the evidence | Comments | |
| Risk with placebo or no prophylaxis | Risk with sucralfate | |||||
| Clinically important upper GI bleeding Follow‐up: 15 days† | Study population | RR 0.53 | 598 | ⊕⊕⊕⊝ | ||
| 108 per 1000 | 57 per 1000 | |||||
| Nosocomial pneumonia Follow‐up: not reported | Study population | RR 1.33 | 450 | ⊕⊕⊝⊝ | ||
| 122 per 1000 | 163 per 1000 | |||||
| All‐cause mortality in ICU Follow‐up: 15 days† | Study population | RR 0.97 | 500 | ⊕⊕⊝⊝ | ||
| 165 per 1000 | 160 per 1000 | |||||
| Duration of ICU stay Follow‐up: not reported | Mean duration of ICU stay ranged from 8.6 to 11.1 days | MD 0.02 days lower | ‐ | 224 | ⊕⊕⊝⊝ | |
| Number of participants requiring blood transfusion Follow‐up: not reported | Study population | RR 0.60 | 200 | ⊕⊕⊝⊝ | ||
| 50 per 1000 | 30 per 1000 | |||||
| Serious adverse events | Not reported | |||||
| *The risk in the intervention group (and its 95% confidence interval) is based on the assumed risk in the comparison group and the relative effect of the intervention (and its 95% CI). | ||||||
| GRADE Working Group grades of evidence. | ||||||
| aDowngraded by one level for risk of bias because of high risk of performance bias in five studies, high risk of reporting bias in one study, and high risk of other biases in one study. bDowngraded by one level for imprecision because 95% CI was compatible with benefit and harm. cDowngraded by one level for risk of bias because of high risk of performance bias in two studies. dDowngraded by one level for risk of bias because of high risk of performance bias in three studies. eDowngraded by one level for risk of bias because of high risk of performance bias in one study. | ||||||
| H2 receptor antagonists compared with proton pump inhibitors for preventing upper gastrointestinal bleeding in people admitted to intensive care units | ||||||
| Patient or population: people admitted to intensive care units | ||||||
| Outcomes | Anticipated absolute effects* (95% CI) | Relative effect | № of participants | Certainty of the evidence | Comments | |
| Risk with proton pump inhibitors | Risk with H2 receptor antagonists | |||||
| Clinically important upper GI bleeding Follow‐up: not reported | Study population | RR 2.90 | 1636 | ⊕⊕⊝⊝ | ||
| 25 per 1000 | 73 per 1000 | |||||
| Nosocomial pneumonia Follow‐up: 30 days† | Study population | RR 1.02 | 1256 | ⊕⊕⊝⊝ | ||
| 123 per 1000 | 126 per 1000 | |||||
| All‐cause mortality in ICU Follow‐up: 30 days† | Study population | RR 0.96 | 1564 | ⊕⊕⊝⊝ | ||
| 158 per 1000 | 152 per 1000 | |||||
| Duration of ICU stay Follow‐up: not reported | Mean duration of ICU stay ranged from 7.7 to 23.6 days | MD 0.14 days higher | ‐ | 482 | ⊕⊕⊝⊝ | |
| Number of participants requiring blood transfusion Follow‐up: not reported | Study population | RR 1.98 | 575 | ⊕⊕⊕⊝ | ||
| 17 per 1000 | 35 per 1000 | |||||
| Serious adverse events | Not reported | |||||
| *The risk in the intervention group (and its 95% confidence interval) is based on the assumed risk in the comparison group and the relative effect of the intervention (and its 95% CI). | ||||||
| GRADE Working Group grades of evidence. | ||||||
| aDowngraded by one level for inconsistency because of substantial heterogeneity; I² = 59%. bDowngraded by one level for risk of bias because of high risk of selection bias in one study, high risk of performance bias in five studies, high risk of detection bias in two studies, and high risk of other biases in one study. cDowngraded by one level for imprecision because 95% CI was compatible with benefit and harm. dDowngraded by one level for risk of bias because of high risk of performance bias in four studies, high risk of detection bias in two studies, and high risk of other biases in one study. eDowngraded by one level for risk of bias because of high risk of performance bias in five studies, high risk of attrition bias in one study, and high risk of other biases in one study. fDowngraded by one level for risk of bias because of high risk of performance bias in three studies, high risk of attrition bias in one study, and high risk of other biases in one study. | ||||||
| H2 receptor antagonists compared with antacids for preventing upper gastrointestinal bleeding in people admitted to intensive care units | ||||||
| Patient or population: people admitted to intensive care units | ||||||
| Outcomes | Anticipated absolute effects* (95% CI) | Relative effect | № of participants | Certainty of the evidence | Comments | |
| Risk with antacids | Risk with H2 receptor antagonists | |||||
| Clinically important upper GI bleeding Follow‐up: 25 days† | Study population | RR 0.96 | 1700 | ⊕⊕⊝⊝ | ||
| 86 per 1000 | 82 per 1000 | |||||
| Nosocomial pneumonia Follow‐up: 25 days‡ | Study population | RR 1.05 | 581 | ⊕⊕⊝⊝ | ||
| 280 per 1000 | 294 per 1000 | |||||
| All‐cause mortality in ICU Follow‐up: 25 days§ | Study population | RR 1.01 | 1321 | ⊕⊝⊝⊝ | ||
| 163 per 1000 | 165 per 1000 | |||||
| Duration of ICU stay | Not reported | |||||
| Number of participants requiring blood transfusion Follow‐up: not reported | Study population | RR 2.49 | 744 | ⊕⊕⊕⊝ | ||
| 30 per 1000 | 75 per 1000 | |||||
| Serious adverse events | Not reported | |||||
| *The risk in the intervention group (and its 95% confidence interval) is based on the assumed risk in the comparison group and the relative effect of the intervention (and its 95% CI). ‡Duration of follow‐up reported in one study. §Duration of follow‐up reported in three studies. | ||||||
| GRADE Working Group grades of evidence. | ||||||
| aDowngraded by one level for imprecision because 95% CI was compatible with benefit and harm. bDowngraded by one level for risk of bias because of high risk of selection bias in two studies, high risk of performance bias in 12 studies, high risk of detection bias in two studies, and high risk of reporting bias in two studies. cDowngraded by one level for risk of bias because of high risk of selection bias in one study, high risk of performance bias in four studies, high risk of detection bias in one study, and high risk of reporting bias in one study. dDowngraded by one level for inconsistency because of moderate heterogeneity; I² = 53%. eDowngraded by one level for risk of bias because of high risk of selection bias in two studies, high risk of performance bias in nine studies, and high risk of reporting bias in one study. fDowngraded by one level for risk of bias because of high risk of selection bias in one study and high risk of performance bias in four studies. | ||||||
| H2 receptor antagonists compared with sucralfate for preventing upper gastrointestinal bleeding in people admitted to intensive care units | ||||||
| Patient or population: people admitted to intensive care units | ||||||
| Outcomes | Anticipated absolute effects* (95% CI) | Relative effect | № of participants | Certainty of the evidence | Comments | |
| Risk with sucralfate | Risk with H2 receptor antagonists | |||||
| Clinically important upper GI bleeding Follow‐up: 15 days† | Study population | RR 1.10 | 3316 | ⊕⊕⊝⊝ | ||
| 66 per 1000 | 73 per 1000 | |||||
| Nosocomial pneumonia Follow‐up: 25 days‡ | Study population | RR 1.22 | 3041 | ⊕⊕⊕⊝ | ||
| 189 per 1000 | 230 per 1000 | |||||
| All‐cause mortality in ICU Follow‐up: 25 days§ | Study population | RR 1.09 | 3178 | ⊕⊕⊝⊝ | ||
| 204 per 1000 | 222 per 1000 | |||||
| Duration of ICU stay Follow‐up: 2 weeks | Mean duration of ICU stay ranged from 7.9 to 13.7 days | MD 0.01 days higher | ‐ | 1791 | ⊕⊝⊝⊝ | |
| Number of participants requiring blood transfusion Follow‐up: until death or dischargeǁ | Study population | RR 1.25 | 1095 | ⊕⊕⊝⊝ | ||
| 35 per 1000 | 43 per 1000 | |||||
| Serious adverse events | Not reported | |||||
| *The risk in the intervention group (and its 95% confidence interval) is based on the assumed risk in the comparison group and the relative effect of the intervention (and its 95% CI). †Duration of follow‐up reported in five studies. ‡Duration of follow‐up reported in three studies. §Duration of follow‐up reported in six studies. ǁDuration of follow‐up reported in one study. | ||||||
| GRADE Working Group grades of evidence. | ||||||
| aDowngraded by one level for imprecision because 95% CI was compatible with benefit and harm. bDowngraded by one level for risk of bias because of high risk of selection bias in one study, high risk of performance bias in 20 studies, high risk of detection bias in two studies, high risk of attrition bias in two studies, high risk of reporting bias in four studies, and high risk of other biases in two studies. cDowngraded by one level for risk of bias because of high risk of selection bias in two studies, high risk of performance bias in 12 studies, high risk of detection bias in one study, high risk of attrition bias in one study, and high risk of reporting bias in two studies. dDowngraded by one level for risk of bias because of high risk of selection bias in two studies, high risk of performance bias in 16 studies, high risk of detection bias in one study, high risk of attrition bias in two studies, high risk of reporting bias in three studies, and high risk of other biases in one study. eDowngraded by one level for inconsistency because of considerable heterogeneity; I² = 82%. fDowngraded by one level for risk of bias because of high risk of performance bias in four studies and high risk of attrition bias in one study. gDowngraded by one level for risk of bias because of high risk of performance bias in eight studies, high risk of attrition bias in one study, high risk of reporting bias in one study, and high risk of other biases in one study. | ||||||
| Antacids compared with sucralfate for preventing upper gastrointestinal bleeding in people admitted to intensive care units | ||||||
| Patient or population: people admitted to intensive care units | ||||||
| Outcomes | Anticipated absolute effects* (95% CI) | Relative effect | № of participants | Certainty of the evidence | Comments | |
| Risk with sucralfate | Risk with antacids | |||||
| Clinically important upper GI bleeding Follow‐up: 21 days† | Study population | RR 1.00 | 1772 | ⊕⊕⊝⊝ | ||
| 66 per 1000 | 66 per 1000 | |||||
| Nosocomial pneumonia Follow‐up: 25 days‡ | Study population | RR 1.04 | 996 | ⊕⊕⊝⊝ | ||
| 232 per 1000 | 242 per 1000 | |||||
| All‐cause mortality in ICU Follow‐up: 25 days† | Study population | RR 1.15 | 1249 | ⊕⊕⊝⊝ | ||
| 206 per 1000 | 237 per 1000 | |||||
| Duration of ICU stay Follow‐up: not reported | Mean duration of ICU stay ranged from 10.4 to 16.8 days | MD 2.5 days lower | ‐ | 227 | ⊕⊕⊝⊝ | |
| Number of participants requiring blood transfusion Follow‐up: until discharge or onset of GI bleeding§ | Study population | RR 0.73 | 667 | ⊕⊕⊝⊝ | ||
| 52 per 1000 | 38 per 1000 | |||||
| Serious adverse events | Not reported | |||||
| *The risk in the intervention group (and its 95% confidence interval) is based on the assumed risk in the comparison group and the relative effect of the intervention (and its 95% CI). ‡Duration of follow‐up reported in two studies. §Duration of follow‐up reported in one study. | ||||||
| GRADE Working Group grades of evidence. | ||||||
| aDowngraded by one level for imprecision because 95% CI was compatible with benefit and harm. bDowngraded by one level for risk of bias because of high risk of selection bias in three studies, high risk of performance bias in 12 studies, high risk of detection bias in one study, high risk of attrition bias in one study, high risk of reporting bias in two studies, and high risk of other biases in two studies. cDowngraded by one level for risk of bias because of high risk of performance bias in four studies, high risk of detection bias in one study, high risk of reporting bias in one study, and high risk of other biases in one study. dDowngraded by one level for risk of bias because of high risk of selection bias in three studies, high risk of performance bias in eight studies, high risk of attrition bias in one study, high risk of reporting bias in one study, and high risk of other biases in one study. eDowngraded by one level for risk of bias because of high risk of attrition bias in one study. fDowngraded by one level for risk of bias because of high risk of selection bias in one study, high risk of performance bias in six studies, and high risk of other biases in one study. | ||||||
| Outcome or subgroup title | No. of studies | No. of participants | Statistical method | Effect size |
| 1 Clinically important upper GI bleeding Show forest plot | 30 | 3132 | Risk Ratio (M‐H, Fixed, 95% CI) | 0.47 [0.39, 0.57] |
| 1.1 H2 receptor antagonists vs placebo or no prophylaxis | 24 | 1844 | Risk Ratio (M‐H, Fixed, 95% CI) | 0.46 [0.37, 0.59] |
| 1.2 Proton pump inhibitors vs placebo or no prophylaxis | 3 | 159 | Risk Ratio (M‐H, Fixed, 95% CI) | 0.57 [0.13, 2.59] |
| 1.3 Prostagladin analogues vs placebo or no prophylaxis | 1 | 58 | Risk Ratio (M‐H, Fixed, 95% CI) | 1.0 [0.22, 4.55] |
| 1.4 Anticholinergics vs placebo or no prophylaxis | 2 | 103 | Risk Ratio (M‐H, Fixed, 95% CI) | 0.87 [0.30, 2.49] |
| 1.5 Antacids vs placebo or no prophylaxis | 7 | 515 | Risk Ratio (M‐H, Fixed, 95% CI) | 0.39 [0.23, 0.63] |
| 1.6 Sucralfate vs placebo or no prophylaxis | 7 | 453 | Risk Ratio (M‐H, Fixed, 95% CI) | 0.47 [0.25, 0.87] |
| 2 Nosocomial pneumonia Show forest plot | 9 | 1331 | Risk Ratio (M‐H, Fixed, 95% CI) | 1.15 [0.90, 1.48] |
| 2.1 H2 receptor antagonists vs placebo or no prophylaxis | 8 | 788 | Risk Ratio (M‐H, Fixed, 95% CI) | 1.06 [0.77, 1.46] |
| 2.2 Proton pump inhibitors vs placebo or no prophylaxis | 2 | 149 | Risk Ratio (M‐H, Fixed, 95% CI) | 1.13 [0.59, 2.17] |
| 2.3 Anticholinergics vs placebo or no prophylaxis | 1 | 72 | Risk Ratio (M‐H, Fixed, 95% CI) | 1.06 [0.43, 2.59] |
| 2.4 Sucralfate vs placebo or no prophylaxis | 4 | 322 | Risk Ratio (M‐H, Fixed, 95% CI) | 1.59 [0.84, 3.01] |
| 3 All‐cause mortality in ICU Show forest plot | 19 | 2159 | Risk Ratio (M‐H, Fixed, 95% CI) | 1.10 [0.90, 1.34] |
| 3.1 H2 receptor antagonists vs placebo or no prophylaxis | 14 | 1209 | Risk Ratio (M‐H, Fixed, 95% CI) | 1.16 [0.89, 1.53] |
| 3.2 Proton pump inhibitors vs placebo or no prophylaxis | 3 | 180 | Risk Ratio (M‐H, Fixed, 95% CI) | 1.05 [0.46, 2.38] |
| 3.3 Prostagladin analogues vs placebo or no prophylaxis | 1 | 58 | Risk Ratio (M‐H, Fixed, 95% CI) | 1.14 [0.48, 2.74] |
| 3.4 Anticholinergics vs placebo or no prophylaxis | 2 | 103 | Risk Ratio (M‐H, Fixed, 95% CI) | 1.22 [0.59, 2.56] |
| 3.5 Antacids vs placebo or no prophylaxis | 2 | 250 | Risk Ratio (M‐H, Fixed, 95% CI) | 1.02 [0.58, 1.79] |
| 3.6 Sucralfate vs placebo or no prophylaxis | 5 | 359 | Risk Ratio (M‐H, Fixed, 95% CI) | 0.93 [0.58, 1.51] |
| 4 All‐cause mortality in hospital Show forest plot | 5 | 857 | Risk Ratio (M‐H, Fixed, 95% CI) | 1.15 [0.85, 1.55] |
| 4.1 H2 receptor antagonists vs placebo or no prophylaxis | 4 | 387 | Risk Ratio (M‐H, Fixed, 95% CI) | 1.14 [0.71, 1.83] |
| 4.2 Proton pump inhibitors vs placebo or no prophylaxis | 1 | 100 | Risk Ratio (M‐H, Fixed, 95% CI) | 1.17 [0.42, 3.22] |
| 4.3 Antacids vs placebo or no prophylaxis | 1 | 126 | Risk Ratio (M‐H, Fixed, 95% CI) | 1.44 [0.79, 2.64] |
| 4.4 Sucralfate vs placebo or no prophylaxis | 2 | 244 | Risk Ratio (M‐H, Fixed, 95% CI) | 0.94 [0.53, 1.68] |
| 5 Duration of ICU stay Show forest plot | 2 | 447 | Mean Difference (IV, Fixed, 95% CI) | 0.24 [‐1.13, 1.61] |
| 5.1 H2 receptor antagonists vs placebo or no prophylaxis | 2 | 152 | Mean Difference (IV, Fixed, 95% CI) | 0.73 [‐1.64, 3.09] |
| 5.2 Proton pump inhibitors vs placebo or no prophylaxis | 2 | 149 | Mean Difference (IV, Fixed, 95% CI) | 0.01 [‐2.33, 2.35] |
| 5.3 Sucralfate vs placebo or no prophylaxis | 2 | 146 | Mean Difference (IV, Fixed, 95% CI) | ‐0.01 [‐2.40, 2.38] |
| 6 Duration of intubation Show forest plot | 2 | 447 | Mean Difference (IV, Fixed, 95% CI) | 0.87 [‐0.58, 2.31] |
| 6.1 H2 receptor antagonists vs placebo or no prophylaxis | 2 | 152 | Mean Difference (IV, Fixed, 95% CI) | 0.78 [‐1.72, 3.29] |
| 6.2 Proton pump inhibitors vs placebo or no prophylaxis | 2 | 149 | Mean Difference (IV, Fixed, 95% CI) | 0.36 [‐2.18, 2.90] |
| 6.3 Sucralfate vs placebo or no prophylaxis | 2 | 146 | Mean Difference (IV, Fixed, 95% CI) | 1.43 [‐1.04, 3.89] |
| 7 Number of participants requiring blood transfusions Show forest plot | 9 | 981 | Risk Ratio (M‐H, Fixed, 95% CI) | 0.63 [0.41, 0.97] |
| 7.1 H2 receptor antagonists vs placebo or no prophylaxis | 7 | 605 | Risk Ratio (M‐H, Fixed, 95% CI) | 0.57 [0.35, 0.94] |
| 7.2 Antacids vs placebo or no prophylaxis | 2 | 226 | Risk Ratio (M‐H, Fixed, 95% CI) | 0.94 [0.30, 2.96] |
| 7.3 Sucralfate vs placebo or no prophylaxis | 1 | 150 | Risk Ratio (M‐H, Fixed, 95% CI) | 0.75 [0.13, 4.34] |
| 8 Units of blood transfused Show forest plot | 2 | 309 | Mean Difference (IV, Random, 95% CI) | 0.09 [‐0.99, 1.17] |
| 8.1 H2 receptor antagonists vs placebo or no prophylaxis | 2 | 159 | Mean Difference (IV, Random, 95% CI) | ‐1.73 [‐6.37, 2.90] |
| 8.2 Sucralfate vs placebo or no prophylaxis | 1 | 150 | Mean Difference (IV, Random, 95% CI) | 0.80 [0.25, 1.35] |
| Outcome or subgroup title | No. of studies | No. of participants | Statistical method | Effect size |
| 1 Clinically important upper GI bleeding Show forest plot | 24 | 2149 | Risk Ratio (M‐H, Random, 95% CI) | 0.50 [0.36, 0.70] |
| 1.1 Cimetidine vs placebo | 10 | 772 | Risk Ratio (M‐H, Random, 95% CI) | 0.53 [0.28, 1.02] |
| 1.2 Famotidine vs placebo | 1 | 146 | Risk Ratio (M‐H, Random, 95% CI) | 2.11 [0.20, 22.79] |
| 1.3 Ranitidine vs placebo | 5 | 446 | Risk Ratio (M‐H, Random, 95% CI) | 0.36 [0.17, 0.77] |
| 1.4 Cimetidine vs no prophylaxis | 3 | 516 | Risk Ratio (M‐H, Random, 95% CI) | 0.59 [0.23, 1.48] |
| 1.5 Famotidine vs no prophylaxis | 1 | 50 | Risk Ratio (M‐H, Random, 95% CI) | 0.3 [0.09, 0.96] |
| 1.6 Ranitidine vs no prophylaxis | 4 | 219 | Risk Ratio (M‐H, Random, 95% CI) | 0.51 [0.26, 1.00] |
| 2 Nosocomial pneumonia Show forest plot | 8 | 945 | Risk Ratio (M‐H, Fixed, 95% CI) | 1.12 [0.85, 1.48] |
| 2.1 Cimetidine vs placebo | 2 | 204 | Risk Ratio (M‐H, Fixed, 95% CI) | 0.34 [0.06, 2.00] |
| 2.2 Famotidine vs placebo | 1 | 146 | Risk Ratio (M‐H, Fixed, 95% CI) | 1.48 [0.49, 4.45] |
| 2.3 Ranitidine vs placebo | 2 | 277 | Risk Ratio (M‐H, Fixed, 95% CI) | 0.79 [0.47, 1.31] |
| 2.4 Cimetidine vs no prophylaxis | 1 | 200 | Risk Ratio (M‐H, Fixed, 95% CI) | 2.17 [0.86, 5.47] |
| 2.5 Ranitidine vs no prophylaxis | 2 | 118 | Risk Ratio (M‐H, Fixed, 95% CI) | 1.33 [0.93, 1.90] |
| 3 All‐cause mortality in ICU Show forest plot | 14 | 1428 | Risk Ratio (M‐H, Fixed, 95% CI) | 1.12 [0.88, 1.42] |
| 3.1 Cimetidine vs placebo | 4 | 478 | Risk Ratio (M‐H, Fixed, 95% CI) | 1.05 [0.66, 1.68] |
| 3.2 Famotidine vs placebo | 1 | 146 | Risk Ratio (M‐H, Fixed, 95% CI) | 1.32 [0.55, 3.16] |
| 3.3 Ranitidine vs placebo | 2 | 148 | Risk Ratio (M‐H, Fixed, 95% CI) | 0.69 [0.31, 1.54] |
| 3.4 Cimetidine vs no prophylaxis | 2 | 400 | Risk Ratio (M‐H, Fixed, 95% CI) | 1.0 [0.61, 1.63] |
| 3.5 Famotidine vs no prophylaxis | 1 | 50 | Risk Ratio (M‐H, Fixed, 95% CI) | 1.25 [0.59, 2.64] |
| 3.6 Ranitidine vs no prophylaxis | 4 | 206 | Risk Ratio (M‐H, Fixed, 95% CI) | 1.58 [0.97, 2.58] |
| 4 All‐cause mortality in hospital Show forest plot | 4 | 487 | Risk Ratio (M‐H, Fixed, 95% CI) | 1.16 [0.79, 1.70] |
| 4.1 Famotidine vs placebo | 1 | 146 | Risk Ratio (M‐H, Fixed, 95% CI) | 0.89 [0.43, 1.86] |
| 4.2 Ranitidine vs placebo | 1 | 101 | Risk Ratio (M‐H, Fixed, 95% CI) | 0.35 [0.01, 8.47] |
| 4.3 Cimetidine vs no prophylaxis | 1 | 200 | Risk Ratio (M‐H, Fixed, 95% CI) | 1.47 [0.88, 2.46] |
| 4.4 Ranitidine vs no prophylaxis | 1 | 40 | Risk Ratio (M‐H, Fixed, 95% CI) | 0.92 [0.33, 2.53] |
| 5 Duration of ICU stay Show forest plot | 2 | 230 | Mean Difference (IV, Fixed, 95% CI) | 0.73 [‐0.92, 2.38] |
| 5.1 Famotidine vs placebo | 1 | 146 | Mean Difference (IV, Fixed, 95% CI) | 1.5 [‐1.93, 4.93] |
| 5.2 Ranitidine vs no prophylaxis | 1 | 84 | Mean Difference (IV, Fixed, 95% CI) | 0.5 [‐1.38, 2.38] |
| 6 Duration of intubation Show forest plot | 2 | 230 | Mean Difference (IV, Fixed, 95% CI) | 0.79 [‐0.95, 2.54] |
| 6.1 Famotidine vs placebo | 1 | 146 | Mean Difference (IV, Fixed, 95% CI) | 1.20 [‐1.86, 4.26] |
| 6.2 Ranitidine vs no prophylaxis | 1 | 84 | Mean Difference (IV, Fixed, 95% CI) | 0.60 [‐1.52, 2.72] |
| 7 Number of participants requiring blood transfusions Show forest plot | 7 | 655 | Risk Ratio (M‐H, Fixed, 95% CI) | 0.58 [0.36, 0.95] |
| 7.1 Cimetidine vs placebo | 3 | 107 | Risk Ratio (M‐H, Fixed, 95% CI) | 0.39 [0.19, 0.79] |
| 7.2 Ranitidine vs placebo | 2 | 148 | Risk Ratio (M‐H, Fixed, 95% CI) | 1.05 [0.24, 4.60] |
| 7.3 Cimetidine vs no prophylaxis | 2 | 400 | Risk Ratio (M‐H, Fixed, 95% CI) | 0.77 [0.35, 1.71] |
| 8 Units of blood transfused Show forest plot | 2 | 209 | Mean Difference (IV, Fixed, 95% CI) | 0.33 [‐0.04, 0.70] |
| 8.1 Cimetidine vs placebo | 1 | 9 | Mean Difference (IV, Fixed, 95% CI) | ‐4.35 [‐7.35, ‐1.35] |
| 8.2 Cimetidine vs no prophylaxis | 1 | 200 | Mean Difference (IV, Fixed, 95% CI) | 0.40 [0.03, 0.77] |
| 9 Adverse events of interventions Show forest plot | 8 | Risk Ratio (M‐H, Fixed, 95% CI) | Subtotals only | |
| 9.1 Diarrhoea | 2 | 225 | Risk Ratio (M‐H, Fixed, 95% CI) | 1.30 [0.57, 2.96] |
| 9.2 Thrombocytopenia | 1 | 200 | Risk Ratio (M‐H, Fixed, 95% CI) | 3.0 [0.12, 72.77] |
| 9.3 Hypophosphatemia | 1 | 25 | Risk Ratio (M‐H, Fixed, 95% CI) | 3.75 [0.17, 84.02] |
| 9.4 Mental confusion | 5 | 657 | Risk Ratio (M‐H, Fixed, 95% CI) | 2.01 [1.10, 3.65] |
| 9.5 Nausea and vomiting | 2 | 287 | Risk Ratio (M‐H, Fixed, 95% CI) | 0.46 [0.09, 2.35] |
| 9.6 Increased creatinine levels | 1 | 200 | Risk Ratio (M‐H, Fixed, 95% CI) | 1.04 [0.64, 1.69] |
| 9.7 Erythema | 1 | 70 | Risk Ratio (M‐H, Fixed, 95% CI) | 3.0 [0.13, 71.22] |
| 9.8 Pancreatitis | 1 | 39 | Risk Ratio (M‐H, Fixed, 95% CI) | 0.29 [0.01, 6.66] |
| 9.9 Chest infection | 1 | 101 | Risk Ratio (M‐H, Fixed, 95% CI) | 1.74 [0.92, 3.30] |
| 9.10 Delirium | 1 | 39 | Risk Ratio (M‐H, Fixed, 95% CI) | 2.59 [0.11, 59.93] |
| 9.11 Hallucinations | 1 | 39 | Risk Ratio (M‐H, Fixed, 95% CI) | 2.59 [0.11, 59.93] |
| 9.12 Severe bleeding | 1 | 101 | Risk Ratio (M‐H, Fixed, 95% CI) | 0.35 [0.01, 8.47] |
| Outcome or subgroup title | No. of studies | No. of participants | Statistical method | Effect size |
| 1 Clinically important upper GI bleeding Show forest plot | 3 | 237 | Risk Ratio (M‐H, Fixed, 95% CI) | 0.63 [0.18, 2.22] |
| 1.1 Omeprazole vs placebo | 1 | 147 | Risk Ratio (M‐H, Fixed, 95% CI) | 1.04 [0.07, 16.34] |
| 1.2 Omeprazole vs no prophylaxis | 1 | 80 | Risk Ratio (M‐H, Fixed, 95% CI) | 0.74 [0.13, 4.18] |
| 1.3 Pantoprazole vs placebo | 1 | 10 | Risk Ratio (M‐H, Fixed, 95% CI) | 0.28 [0.02, 4.66] |
| 2 Nosocomial pneumonia Show forest plot | 2 | 227 | Risk Ratio (M‐H, Fixed, 95% CI) | 1.24 [0.77, 1.98] |
| 2.1 Omeprazole vs placebo | 1 | 147 | Risk Ratio (M‐H, Fixed, 95% CI) | 1.67 [0.57, 4.86] |
| 2.2 Omeprazole vs no prophylaxis | 1 | 80 | Risk Ratio (M‐H, Fixed, 95% CI) | 1.11 [0.66, 1.84] |
| 3 All‐cause mortality in ICU Show forest plot | 3 | 258 | Risk Ratio (M‐H, Fixed, 95% CI) | 1.09 [0.60, 1.99] |
| 3.1 Omeprazole vs placebo | 2 | 178 | Risk Ratio (M‐H, Fixed, 95% CI) | 1.20 [0.51, 2.83] |
| 3.2 Omeprazole vs no prophylaxis | 1 | 80 | Risk Ratio (M‐H, Fixed, 95% CI) | 0.98 [0.42, 2.29] |
| 4 All‐cause mortality in hospital Show forest plot | 1 | 150 | Risk Ratio (M‐H, Fixed, 95% CI) | 1.08 [0.54, 2.13] |
| 4.1 Omeprazole vs placebo | 1 | 150 | Risk Ratio (M‐H, Fixed, 95% CI) | 1.08 [0.54, 2.13] |
| 5 Duration of ICU stay Show forest plot | 2 | 227 | Mean Difference (IV, Fixed, 95% CI) | ‐0.03 [‐1.63, 1.58] |
| 5.1 Omeprazole vs placebo | 1 | 147 | Mean Difference (IV, Fixed, 95% CI) | ‐0.90 [‐3.96, 2.16] |
| 5.2 Omeprazole vs no prophylaxis | 1 | 80 | Mean Difference (IV, Fixed, 95% CI) | 0.30 [‐1.58, 2.18] |
| 6 Duration of intubation Show forest plot | 2 | 227 | Mean Difference (IV, Fixed, 95% CI) | 0.36 [‐1.43, 2.15] |
| 6.1 Omeprazole vs placebo | 1 | 147 | Mean Difference (IV, Fixed, 95% CI) | 0.5 [‐2.72, 3.72] |
| 6.2 Omeprazole vs no prophylaxis | 1 | 80 | Mean Difference (IV, Fixed, 95% CI) | 0.30 [‐1.85, 2.45] |
| Outcome or subgroup title | No. of studies | No. of participants | Statistical method | Effect size |
| 1 Clinically important upper GI bleeding Show forest plot | 1 | Risk Ratio (M‐H, Fixed, 95% CI) | Totals not selected | |
| Outcome or subgroup title | No. of studies | No. of participants | Statistical method | Effect size |
| 1 Clinically important upper GI bleeding Show forest plot | 1 | Risk Ratio (M‐H, Fixed, 95% CI) | Totals not selected | |
| 1.1 Prostaglandin analogues vs placebo | 1 | Risk Ratio (M‐H, Fixed, 95% CI) | 0.0 [0.0, 0.0] | |
| 2 All‐cause mortality in ICU Show forest plot | 1 | Risk Ratio (M‐H, Fixed, 95% CI) | Totals not selected | |
| Outcome or subgroup title | No. of studies | No. of participants | Statistical method | Effect size |
| 1 Clinically important upper GI bleeding Show forest plot | 2 | 131 | Risk Ratio (M‐H, Fixed, 95% CI) | 0.95 [0.36, 2.51] |
| 1.1 Pirenzepine vs placebo | 1 | 101 | Risk Ratio (M‐H, Fixed, 95% CI) | 1.94 [0.34, 11.13] |
| 1.2 Pirenzepin + ranitidine vs placebo + ranitidine | 1 | 30 | Risk Ratio (M‐H, Fixed, 95% CI) | 0.6 [0.17, 2.07] |
| 2 Nosocomial pneumonia Show forest plot | 1 | Risk Ratio (M‐H, Fixed, 95% CI) | Totals not selected | |
| 2.1 Pirenzepine vs placebo | 1 | Risk Ratio (M‐H, Fixed, 95% CI) | 0.0 [0.0, 0.0] | |
| 3 All‐cause mortality in ICU Show forest plot | 2 | 131 | Risk Ratio (M‐H, Fixed, 95% CI) | 1.23 [0.66, 2.30] |
| 3.1 Pirenzepine vs placebo | 1 | 101 | Risk Ratio (M‐H, Fixed, 95% CI) | 1.30 [0.65, 2.60] |
| 3.2 Pirenzepine + ranitidine vs placebo + ranitidine | 1 | 30 | Risk Ratio (M‐H, Fixed, 95% CI) | 1.0 [0.24, 4.18] |
| Outcome or subgroup title | No. of studies | No. of participants | Statistical method | Effect size |
| 1 Clinically important upper GI bleeding Show forest plot | 8 | 774 | Risk Ratio (M‐H, Random, 95% CI) | 0.49 [0.25, 0.99] |
| 1.1 Antacids vs placebo | 2 | 145 | Risk Ratio (M‐H, Random, 95% CI) | 2.04 [0.72, 5.79] |
| 1.2 Antacids vs no prophylaxis | 6 | 629 | Risk Ratio (M‐H, Random, 95% CI) | 0.35 [0.20, 0.60] |
| 2 All‐cause mortality in ICU Show forest plot | 2 | 300 | Risk Ratio (M‐H, Random, 95% CI) | 1.01 [0.53, 1.96] |
| 2.1 Antacids vs no prophylaxis | 2 | 300 | Risk Ratio (M‐H, Random, 95% CI) | 1.01 [0.53, 1.96] |
| 3 All‐cause mortality in hospital Show forest plot | 1 | Risk Ratio (M‐H, Fixed, 95% CI) | Totals not selected | |
| 3.1 Antacids vs no prophylaxis | 1 | Risk Ratio (M‐H, Fixed, 95% CI) | 0.0 [0.0, 0.0] | |
| 4 Number of participants requiring blood transfusions Show forest plot | 2 | Risk Ratio (M‐H, Fixed, 95% CI) | Subtotals only | |
| 4.1 Antacids vs no prophylaxis | 2 | 226 | Risk Ratio (M‐H, Fixed, 95% CI) | 0.94 [0.30, 2.96] |
| 5 Adverse events of interventions Show forest plot | 4 | Risk Ratio (M‐H, Fixed, 95% CI) | Subtotals only | |
| 5.1 Diarrhoea | 4 | 395 | Risk Ratio (M‐H, Fixed, 95% CI) | 3.56 [1.83, 6.94] |
| 5.2 Hypomagnesaemia | 1 | 25 | Risk Ratio (M‐H, Fixed, 95% CI) | 3.75 [0.17, 84.02] |
| 5.3 Hypophosphataemia | 2 | 225 | Risk Ratio (M‐H, Fixed, 95% CI) | 5.48 [1.81, 16.61] |
| 5.4 Hypermagnesaemia | 1 | 100 | Risk Ratio (M‐H, Fixed, 95% CI) | 6.73 [0.36, 127.02] |
| 5.5 Nausea and vomiting | 3 | 370 | Risk Ratio (M‐H, Fixed, 95% CI) | 2.39 [0.86, 6.64] |
| 5.6 Mental confusion | 1 | 200 | Risk Ratio (M‐H, Fixed, 95% CI) | 1.27 [0.61, 2.67] |
| 5.7 Creatinine increase | 1 | 200 | Risk Ratio (M‐H, Fixed, 95% CI) | 1.17 [0.73, 1.87] |
| Outcome or subgroup title | No. of studies | No. of participants | Statistical method | Effect size |
| 1 Clinically important upper GI bleeding Show forest plot | 7 | 598 | Risk Ratio (M‐H, Fixed, 95% CI) | 0.53 [0.32, 0.88] |
| 1.1 Sucralfate vs placebo | 2 | 170 | Risk Ratio (M‐H, Fixed, 95% CI) | 1.40 [0.30, 6.62] |
| 1.2 Sucralfate vs no prophylaxis | 5 | 428 | Risk Ratio (M‐H, Fixed, 95% CI) | 0.46 [0.26, 0.80] |
| 2 Nosocomial pneumonia Show forest plot | 4 | 450 | Risk Ratio (M‐H, Fixed, 95% CI) | 1.33 [0.86, 2.04] |
| 2.1 Sucralfate vs placebo | 2 | 170 | Risk Ratio (M‐H, Fixed, 95% CI) | 1.43 [0.49, 4.16] |
| 2.2 Sucralfate vs no prophylaxis | 2 | 280 | Risk Ratio (M‐H, Fixed, 95% CI) | 1.30 [0.82, 2.07] |
| 3 All‐cause mortality in ICU Show forest plot | 5 | 500 | Risk Ratio (M‐H, Fixed, 95% CI) | 0.97 [0.66, 1.43] |
| 3.1 Sucralfate vs placebo | 2 | 170 | Risk Ratio (M‐H, Fixed, 95% CI) | 0.92 [0.48, 1.80] |
| 3.2 Sucralfate vs no prophylaxis | 3 | 330 | Risk Ratio (M‐H, Fixed, 95% CI) | 0.99 [0.62, 1.60] |
| 4 All‐cause mortality in hospital Show forest plot | 2 | 344 | Risk Ratio (M‐H, Fixed, 95% CI) | 0.97 [0.62, 1.52] |
| 4.1 Sucralfate vs placebo | 1 | 144 | Risk Ratio (M‐H, Fixed, 95% CI) | 1.09 [0.54, 2.18] |
| 4.2 Sucralfate vs no prophylaxis | 1 | 200 | Risk Ratio (M‐H, Fixed, 95% CI) | 0.89 [0.49, 1.62] |
| 5 Duration of ICU stay Show forest plot | 2 | 224 | Mean Difference (IV, Fixed, 95% CI) | ‐0.02 [‐1.70, 1.65] |
| 5.1 Sucralfate vs placebo | 1 | 144 | Mean Difference (IV, Fixed, 95% CI) | ‐0.70 [‐4.07, 2.67] |
| 5.2 Sucralfate vs no prophylaxis | 1 | 80 | Mean Difference (IV, Fixed, 95% CI) | 0.20 [‐1.73, 2.13] |
| 6 Duration of intubation Show forest plot | 2 | 224 | Mean Difference (IV, Fixed, 95% CI) | 1.42 [‐0.27, 3.10] |
| 6.1 Sucralfate vs placebo | 1 | 144 | Mean Difference (IV, Fixed, 95% CI) | 0.80 [‐2.20, 3.80] |
| 6.2 Sucralfate vs no prophylaxis | 1 | 80 | Mean Difference (IV, Fixed, 95% CI) | 1.70 [‐0.34, 3.74] |
| 7 Number of participants requiring blood transfusions Show forest plot | 1 | Risk Ratio (M‐H, Fixed, 95% CI) | Totals not selected | |
| 7.1 Sucralfate vs no prophylaxis | 1 | Risk Ratio (M‐H, Fixed, 95% CI) | 0.0 [0.0, 0.0] | |
| 8 Units of blood transfused Show forest plot | 1 | 200 | Mean Difference (IV, Fixed, 95% CI) | 0.8 [0.32, 1.28] |
| 8.1 Sucralfate vs no prophylaxis | 1 | 200 | Mean Difference (IV, Fixed, 95% CI) | 0.8 [0.32, 1.28] |
| 9 Adverse events of interventions Show forest plot | 1 | 70 | Risk Ratio (M‐H, Fixed, 95% CI) | 9.0 [0.50, 161.13] |
| 9.1 Nausea / Vomiting | 1 | 70 | Risk Ratio (M‐H, Fixed, 95% CI) | 9.0 [0.50, 161.13] |
| Outcome or subgroup title | No. of studies | No. of participants | Statistical method | Effect size |
| 1 Clinically important upper GI bleeding Show forest plot | 13 | 1636 | Risk Ratio (M‐H, Fixed, 95% CI) | 2.90 [1.83, 4.58] |
| 1.1 Cimetidine vs omeprazole | 1 | 359 | Risk Ratio (M‐H, Fixed, 95% CI) | 1.40 [0.55, 3.61] |
| 1.2 Famotidine vs lansoprazole | 1 | 51 | Risk Ratio (M‐H, Fixed, 95% CI) | 3.63 [0.15, 84.98] |
| 1.3 Famotidine vs omeprazole | 1 | 143 | Risk Ratio (M‐H, Fixed, 95% CI) | 2.03 [0.19, 21.87] |
| 1.4 Famotidine vs pantoprazole | 2 | 159 | Risk Ratio (M‐H, Fixed, 95% CI) | 0.73 [0.18, 3.04] |
| 1.5 Famotidine vs esomeprazole | 2 | 371 | Risk Ratio (M‐H, Fixed, 95% CI) | 7.53 [1.39, 40.85] |
| 1.6 Ranitidine vs omeprazole | 5 | 413 | Risk Ratio (M‐H, Fixed, 95% CI) | 4.08 [1.99, 8.36] |
| 1.7 Ranitidine vs rabeprazole | 1 | 140 | Risk Ratio (M‐H, Fixed, 95% CI) | 9.0 [0.49, 164.09] |
| 2 Nosocomial pneumonia Show forest plot | 10 | 1256 | Risk Ratio (M‐H, Fixed, 95% CI) | 1.02 [0.77, 1.35] |
| 2.1 Cimetidine vs omeprazole | 1 | 359 | Risk Ratio (M‐H, Fixed, 95% CI) | 0.84 [0.45, 1.54] |
| 2.2 Cimetidine vs pantoprazole | 1 | 202 | Risk Ratio (M‐H, Fixed, 95% CI) | 0.89 [0.28, 2.91] |
| 2.3 Famotidine vs esomeprazole | 1 | 60 | Risk Ratio (M‐H, Fixed, 95% CI) | 1.0 [0.07, 15.26] |
| 2.4 Famotidine vs omeprazole | 1 | 143 | Risk Ratio (M‐H, Fixed, 95% CI) | 0.89 [0.34, 2.32] |
| 2.5 Ranitidine vs omeprazole | 5 | 413 | Risk Ratio (M‐H, Fixed, 95% CI) | 1.19 [0.80, 1.75] |
| 2.6 H2 receptor antagonists (not defined) vs proton pump inhibitors (not defined) | 1 | 79 | Risk Ratio (M‐H, Fixed, 95% CI) | 1.03 [0.47, 2.26] |
| 3 All‐cause mortality in ICU Show forest plot | 12 | 1564 | Risk Ratio (M‐H, Fixed, 95% CI) | 0.96 [0.78, 1.19] |
| 3.1 Cimetidine vs omeprazole | 1 | 359 | Risk Ratio (M‐H, Fixed, 95% CI) | 0.76 [0.45, 1.30] |
| 3.2 Cimetidine vs pantoprazole | 1 | 202 | Risk Ratio (M‐H, Fixed, 95% CI) | 0.80 [0.25, 2.55] |
| 3.3 Famotidine vs omeprazole | 1 | 143 | Risk Ratio (M‐H, Fixed, 95% CI) | 1.13 [0.49, 2.61] |
| 3.4 Ranitidine vs omeprazole | 5 | 387 | Risk Ratio (M‐H, Fixed, 95% CI) | 1.10 [0.86, 1.40] |
| 3.5 Ranitidine vs pantoprazole | 3 | 333 | Risk Ratio (M‐H, Fixed, 95% CI) | 0.66 [0.31, 1.43] |
| 3.6 Ranitidine vs rabeprazole | 1 | 140 | Risk Ratio (M‐H, Fixed, 95% CI) | 3.0 [0.12, 72.40] |
| 4 All‐cause mortality in hospital Show forest plot | 2 | 454 | Risk Ratio (M‐H, Fixed, 95% CI) | 0.72 [0.37, 1.43] |
| 4.1 Famotidine vs esomeprazole | 1 | 311 | Risk Ratio (M‐H, Fixed, 95% CI) | 0.37 [0.04, 3.49] |
| 4.2 Famotidine vs omeprazole | 1 | 143 | Risk Ratio (M‐H, Fixed, 95% CI) | 0.80 [0.39, 1.63] |
| 5 Duration of ICU stay Show forest plot | 5 | 482 | Mean Difference (IV, Fixed, 95% CI) | 0.14 [‐1.14, 1.41] |
| 5.1 Famotidine vs esomeprazole | 1 | 60 | Mean Difference (IV, Fixed, 95% CI) | ‐0.30 [‐6.51, 5.91] |
| 5.2 Famotidine vs omeprazole | 1 | 143 | Mean Difference (IV, Fixed, 95% CI) | 2.40 [‐0.44, 5.24] |
| 5.3 Ranitidine vs omeprazole | 3 | 279 | Mean Difference (IV, Fixed, 95% CI) | ‐0.44 [‐1.90, 1.02] |
| 6 Duration of intubation Show forest plot | 5 | 542 | Mean Difference (IV, Fixed, 95% CI) | ‐0.35 [‐1.48, 0.78] |
| 6.1 Famotidine vs omeprazole | 1 | 143 | Mean Difference (IV, Fixed, 95% CI) | 0.70 [‐2.24, 3.64] |
| 6.2 Ranitidine vs omeprazole | 3 | 279 | Mean Difference (IV, Fixed, 95% CI) | ‐0.78 [‐2.24, 0.67] |
| 6.3 Ranitidine vs pantoprazole | 1 | 120 | Mean Difference (IV, Fixed, 95% CI) | 0.07 [‐2.18, 2.32] |
| 7 Number of participants requiring blood transfusions Show forest plot | 3 | 575 | Risk Ratio (M‐H, Fixed, 95% CI) | 1.98 [0.75, 5.21] |
| 7.1 Cimetidine vs omeprazole | 1 | 359 | Risk Ratio (M‐H, Fixed, 95% CI) | 0.98 [0.29, 3.34] |
| 7.2 Ranitidine vs omeprazole | 1 | 76 | Risk Ratio (M‐H, Fixed, 95% CI) | 5.0 [0.25, 100.80] |
| 7.3 Ranitidine vs rabeprazole | 1 | 140 | Risk Ratio (M‐H, Fixed, 95% CI) | 9.0 [0.49, 164.09] |
| 8 Adverse events of interventions Show forest plot | 5 | Risk Ratio (M‐H, Fixed, 95% CI) | Subtotals only | |
| 8.1 Pyrexia | 1 | 202 | Risk Ratio (M‐H, Fixed, 95% CI) | 0.93 [0.05, 19.03] |
| 8.2 Thrombocytopaenia | 2 | 253 | Risk Ratio (M‐H, Fixed, 95% CI) | 3.64 [0.65, 20.46] |
| 8.3 Neuroleptic malignant syndrome | 1 | 202 | Risk Ratio (M‐H, Fixed, 95% CI) | 1.56 [0.06, 37.42] |
| 8.4 Cholestatic jaundice | 1 | 202 | Risk Ratio (M‐H, Fixed, 95% CI) | 1.56 [0.06, 37.42] |
| 8.5 Abnormal liver function test | 1 | 202 | Risk Ratio (M‐H, Fixed, 95% CI) | 1.56 [0.06, 37.42] |
| 8.6 Pruritus | 1 | 202 | Risk Ratio (M‐H, Fixed, 95% CI) | 1.56 [0.06, 37.42] |
| 8.7 Phlebitis | 1 | 202 | Risk Ratio (M‐H, Fixed, 95% CI) | 1.56 [0.06, 37.42] |
| 8.8 Major CV events | 1 | 311 | Risk Ratio (M‐H, Fixed, 95% CI) | 0.79 [0.26, 2.43] |
| 8.9 Abdominal distension and vomiting | 1 | 90 | Risk Ratio (M‐H, Fixed, 95% CI) | 1.15 [0.62, 2.14] |
| 8.10 Hypomagnesaemia | 1 | 129 | Risk Ratio (M‐H, Fixed, 95% CI) | 0.43 [0.16, 1.13] |
| 8.11 Nausea and vomiting | 1 | 129 | Risk Ratio (M‐H, Fixed, 95% CI) | 0.48 [0.13, 1.77] |
| 8.12 Diarrhoea | 1 | 129 | Risk Ratio (M‐H, Fixed, 95% CI) | 1.11 [0.16, 7.67] |
| Outcome or subgroup title | No. of studies | No. of participants | Statistical method | Effect size |
| 1 Clinically important upper GI bleeding Show forest plot | 16 | 1700 | Risk Ratio (M‐H, Random, 95% CI) | 0.96 [0.67, 1.36] |
| 1.1 Cimetidine vs antacids | 11 | 1155 | Risk Ratio (M‐H, Random, 95% CI) | 1.07 [0.65, 1.78] |
| 1.2 Cimetidine + pirenzepine vs antacid + pirenzepine | 1 | 66 | Risk Ratio (M‐H, Random, 95% CI) | 1.0 [0.15, 6.68] |
| 1.3 Ranitidine vs antacids | 4 | 479 | Risk Ratio (M‐H, Random, 95% CI) | 0.72 [0.42, 1.23] |
| 2 Nosocomial pneumonia Show forest plot | 4 | 581 | Risk Ratio (M‐H, Fixed, 95% CI) | 1.05 [0.81, 1.36] |
| 2.1 Cimetidine vs antacids | 2 | 136 | Risk Ratio (M‐H, Fixed, 95% CI) | 1.24 [0.70, 2.19] |
| 2.2 Ranitidine vs antacids | 2 | 445 | Risk Ratio (M‐H, Fixed, 95% CI) | 1.00 [0.75, 1.34] |
| 3 All‐cause mortality in ICU Show forest plot | 11 | 1321 | Risk Ratio (M‐H, Random, 95% CI) | 1.01 [0.66, 1.55] |
| 3.1 Cimetidine vs antacids | 8 | 885 | Risk Ratio (M‐H, Random, 95% CI) | 1.05 [0.69, 1.59] |
| 3.2 Cimetidine + pirenzepine vs antacid + pirenzepine | 1 | 66 | Risk Ratio (M‐H, Random, 95% CI) | 1.25 [0.37, 4.25] |
| 3.3 Ranitidine vs antacids | 2 | 370 | Risk Ratio (M‐H, Random, 95% CI) | 1.13 [0.14, 8.97] |
| 4 All‐cause mortality in hospital Show forest plot | 1 | Risk Ratio (M‐H, Fixed, 95% CI) | Totals not selected | |
| 4.1 Ranitidine vs antacids | 1 | Risk Ratio (M‐H, Fixed, 95% CI) | 0.0 [0.0, 0.0] | |
| 5 Duration of intubation Show forest plot | 3 | 121 | Mean Difference (IV, Random, 95% CI) | ‐0.81 [‐3.85, 2.23] |
| 5.1 Cimetidine vs antacids | 3 | 121 | Mean Difference (IV, Random, 95% CI) | ‐0.81 [‐3.85, 2.23] |
| 6 Number of participants requiring blood transfusions Show forest plot | 6 | 744 | Risk Ratio (M‐H, Fixed, 95% CI) | 2.49 [1.35, 4.62] |
| 6.1 Cimetidine vs antacids | 5 | 583 | Risk Ratio (M‐H, Fixed, 95% CI) | 2.47 [1.32, 4.63] |
| 6.2 Ranitidine vs antacids | 1 | 161 | Risk Ratio (M‐H, Fixed, 95% CI) | 3.04 [0.13, 73.46] |
| 7 Adverse events of interventions Show forest plot | 12 | Risk Ratio (M‐H, Fixed, 95% CI) | Subtotals only | |
| 7.1 Diarrhoea | 6 | 777 | Risk Ratio (M‐H, Fixed, 95% CI) | 0.23 [0.13, 0.43] |
| 7.2 Thrombocytopaenia | 4 | 452 | Risk Ratio (M‐H, Fixed, 95% CI) | 1.40 [0.93, 2.09] |
| 7.3 Nausea and vomiting | 4 | 380 | Risk Ratio (M‐H, Fixed, 95% CI) | 0.46 [0.19, 1.10] |
| 7.4 Hypophosphataemia | 2 | 108 | Risk Ratio (M‐H, Fixed, 95% CI) | 0.24 [0.04, 1.30] |
| 7.5 Hypomagnesaemia | 1 | 22 | Risk Ratio (M‐H, Fixed, 95% CI) | 0.33 [0.02, 7.39] |
| 7.6 Increase in creatinine | 2 | 286 | Risk Ratio (M‐H, Fixed, 95% CI) | 0.85 [0.56, 1.28] |
| 7.7 Mental confusion | 4 | 476 | Risk Ratio (M‐H, Fixed, 95% CI) | 1.26 [0.77, 2.07] |
| 7.8 Hypermagnesaemia | 2 | 115 | Risk Ratio (M‐H, Fixed, 95% CI) | 0.58 [0.17, 2.03] |
| 7.9 Rash/Erythema | 2 | 231 | Risk Ratio (M‐H, Fixed, 95% CI) | 3.02 [0.32, 28.53] |
| 7.10 Alkalosis | 1 | 75 | Risk Ratio (M‐H, Fixed, 95% CI) | 0.32 [0.01, 7.73] |
| 7.11 Dryness of mouth | 1 | 67 | Risk Ratio (M‐H, Fixed, 95% CI) | 5.15 [0.26, 103.33] |
| 7.12 Leucopaenia | 1 | 161 | Risk Ratio (M‐H, Fixed, 95% CI) | 3.04 [0.13, 73.46] |
| Outcome or subgroup title | No. of studies | No. of participants | Statistical method | Effect size |
| 1 Clinically important upper GI bleeding Show forest plot | 24 | 3316 | Risk Ratio (M‐H, Fixed, 95% CI) | 1.10 [0.87, 1.41] |
| 1.1 Cimetidine vs sucralfate | 7 | 873 | Risk Ratio (M‐H, Fixed, 95% CI) | 1.37 [0.87, 2.14] |
| 1.2 Famotidine vs sucralfate | 2 | 190 | Risk Ratio (M‐H, Fixed, 95% CI) | 0.62 [0.21, 1.78] |
| 1.3 Ranitidine vs sucralfate | 14 | 2186 | Risk Ratio (M‐H, Fixed, 95% CI) | 1.03 [0.76, 1.39] |
| 1.4 Cimetidine + pirenzepine vs sucralfate + pirenzepine | 1 | 67 | Risk Ratio (M‐H, Fixed, 95% CI) | 5.15 [0.26, 103.33] |
| 2 Nosocomial pneumonia Show forest plot | 17 | 3041 | Risk Ratio (M‐H, Fixed, 95% CI) | 1.22 [1.07, 1.40] |
| 2.1 Cimetidine vs sucralfate | 5 | 758 | Risk Ratio (M‐H, Fixed, 95% CI) | 1.13 [0.87, 1.47] |
| 2.2 Famotidine vs sucralfate | 1 | 140 | Risk Ratio (M‐H, Fixed, 95% CI) | 1.13 [0.40, 3.20] |
| 2.3 Ranitidine vs sucralfate | 11 | 2143 | Risk Ratio (M‐H, Fixed, 95% CI) | 1.26 [1.07, 1.48] |
| 3 All‐cause mortality in ICU Show forest plot | 21 | 3178 | Risk Ratio (M‐H, Fixed, 95% CI) | 1.09 [0.95, 1.24] |
| 3.1 Cimetidine vs sucralfate | 6 | 814 | Risk Ratio (M‐H, Fixed, 95% CI) | 1.18 [0.91, 1.54] |
| 3.2 Famotidine vs sucralfate | 2 | 190 | Risk Ratio (M‐H, Fixed, 95% CI) | 1.23 [0.69, 2.19] |
| 3.3 Ranitidine vs sucralfate | 12 | 2107 | Risk Ratio (M‐H, Fixed, 95% CI) | 1.04 [0.88, 1.22] |
| 3.4 Cimetidine + pirenzepine vs sucralfate + pirenzepine | 1 | 67 | Risk Ratio (M‐H, Fixed, 95% CI) | 1.29 [0.38, 4.38] |
| 4 All‐cause mortality in hospital Show forest plot | 4 | 717 | Risk Ratio (M‐H, Fixed, 95% CI) | 1.14 [0.86, 1.50] |
| 4.1 Cimetidine vs sucralfate | 2 | 413 | Risk Ratio (M‐H, Fixed, 95% CI) | 1.28 [0.86, 1.92] |
| 4.2 Ranitidine vs sucralfate | 1 | 164 | Risk Ratio (M‐H, Fixed, 95% CI) | 1.11 [0.71, 1.74] |
| 4.3 Famotidine vs sucralfate | 1 | 140 | Risk Ratio (M‐H, Fixed, 95% CI) | 0.82 [0.40, 1.71] |
| 5 Duration of intubation Show forest plot | 10 | 1751 | Mean Difference (IV, Random, 95% CI) | 0.22 [‐1.55, 2.00] |
| 5.1 Cimetidine vs sucralfate | 2 | 97 | Mean Difference (IV, Random, 95% CI) | 0.58 [‐1.71, 2.87] |
| 5.2 Famotidine vs sucralfate | 1 | 140 | Mean Difference (IV, Random, 95% CI) | 0.40 [‐2.30, 3.10] |
| 5.3 Ranitidine vs sucralfate | 7 | 1514 | Mean Difference (IV, Random, 95% CI) | 0.15 [‐2.12, 2.43] |
| 6 Duration of ICU stay Show forest plot | 6 | 1791 | Mean Difference (IV, Random, 95% CI) | 0.01 [‐1.92, 1.95] |
| 6.1 Cimetidine vs sucralfate | 1 | 213 | Mean Difference (IV, Random, 95% CI) | 0.0 [‐3.05, 3.05] |
| 6.2 Famotidine vs sucralfate | 1 | 140 | Mean Difference (IV, Random, 95% CI) | 2.20 [‐0.96, 5.36] |
| 6.3 Ranitidine vs sucralfate | 4 | 1438 | Mean Difference (IV, Random, 95% CI) | ‐0.43 [‐2.70, 1.84] |
| 7 Number of participants requiring blood transfusion Show forest plot | 9 | 1095 | Risk Ratio (M‐H, Fixed, 95% CI) | 1.25 [0.70, 2.23] |
| 7.1 Cimetidine vs sucralfate | 5 | 732 | Risk Ratio (M‐H, Fixed, 95% CI) | 1.00 [0.47, 2.16] |
| 7.2 Ranitidine vs sucralfate | 4 | 363 | Risk Ratio (M‐H, Fixed, 95% CI) | 1.77 [0.71, 4.39] |
| 8 Units of blood transfused Show forest plot | 1 | Mean Difference (IV, Fixed, 95% CI) | Totals not selected | |
| 8.1 Cimetidine vs sucralfate | 1 | Mean Difference (IV, Fixed, 95% CI) | 0.0 [0.0, 0.0] | |
| 9 Adverse events of interventions Show forest plot | 6 | Risk Ratio (M‐H, Fixed, 95% CI) | Subtotals only | |
| 9.1 Thrombocytopaenia | 2 | 240 | Risk Ratio (M‐H, Fixed, 95% CI) | 4.72 [0.56, 39.47] |
| 9.2 Nausea and vomiting | 2 | 137 | Risk Ratio (M‐H, Fixed, 95% CI) | 0.07 [0.01, 0.54] |
| 9.3 Hypermagnesaemia | 1 | 40 | Risk Ratio (M‐H, Fixed, 95% CI) | 2.71 [0.31, 23.93] |
| 9.4 Rash/Erythema | 2 | 233 | Risk Ratio (M‐H, Fixed, 95% CI) | 3.06 [0.32, 28.87] |
| 9.5 Confusion | 3 | 382 | Risk Ratio (M‐H, Fixed, 95% CI) | 4.48 [0.77, 26.00] |
| 9.6 Neutropaenia | 1 | 114 | Risk Ratio (M‐H, Fixed, 95% CI) | 5.18 [0.25, 105.47] |
| 9.7 Dryness of mouth | 1 | 67 | Risk Ratio (M‐H, Fixed, 95% CI) | 5.15 [0.26, 103.33] |
| 9.8 Leucopaenia | 1 | 163 | Risk Ratio (M‐H, Fixed, 95% CI) | 3.11 [0.13, 75.26] |
| Outcome or subgroup title | No. of studies | No. of participants | Statistical method | Effect size |
| 1 Clinically important upper GI bleeding Show forest plot | 3 | 556 | Risk Ratio (M‐H, Fixed, 95% CI) | 1.37 [0.58, 3.26] |
| 1.1 Cimetidine vs pirenzepine | 1 | 55 | Risk Ratio (M‐H, Fixed, 95% CI) | 1.45 [0.26, 7.99] |
| 1.2 Ranitidine vs pirenzepine | 2 | 501 | Risk Ratio (M‐H, Fixed, 95% CI) | 1.35 [0.50, 3.67] |
| 2 Nosocomial pneumonia Show forest plot | 3 | 544 | Risk Ratio (M‐H, Fixed, 95% CI) | 0.96 [0.50, 1.84] |
| 2.1 Famotidine vs pirenzepine | 1 | 43 | Risk Ratio (M‐H, Fixed, 95% CI) | 0.32 [0.01, 7.42] |
| 2.2 Ranitidine vs pirenzepine | 2 | 501 | Risk Ratio (M‐H, Fixed, 95% CI) | 1.03 [0.53, 2.01] |
| 3 All‐cause mortality in ICU Show forest plot | 2 | 501 | Risk Ratio (M‐H, Random, 95% CI) | 0.89 [0.21, 3.87] |
| 3.1 Ranitidine vs pirenzepine | 2 | 501 | Risk Ratio (M‐H, Random, 95% CI) | 0.89 [0.21, 3.87] |
| 4 Number of participants requiring blood transfusion Show forest plot | 1 | Risk Ratio (M‐H, Fixed, 95% CI) | Totals not selected | |
| 4.1 Ranitidine vs pirenzepine | 1 | Risk Ratio (M‐H, Fixed, 95% CI) | 0.0 [0.0, 0.0] | |
| 5 Adverse events of interventions Show forest plot | 2 | Risk Ratio (M‐H, Fixed, 95% CI) | Subtotals only | |
| 5.1 Tachycardia | 1 | 55 | Risk Ratio (M‐H, Fixed, 95% CI) | 0.11 [0.01, 1.90] |
| 5.2 High temperature | 1 | 43 | Risk Ratio (M‐H, Fixed, 95% CI) | 0.53 [0.21, 1.32] |
| Outcome or subgroup title | No. of studies | No. of participants | Statistical method | Effect size |
| 1 Clinically important upper GI bleeding Show forest plot | 1 | Risk Ratio (M‐H, Fixed, 95% CI) | Totals not selected | |
| 1.1 Cimetidine vs misoprostol | 1 | Risk Ratio (M‐H, Fixed, 95% CI) | 0.0 [0.0, 0.0] | |
| 2 All‐cause mortality in ICU Show forest plot | 1 | Risk Ratio (M‐H, Fixed, 95% CI) | Totals not selected | |
| 2.1 Cimetidine vs misoprostol | 1 | Risk Ratio (M‐H, Fixed, 95% CI) | 0.0 [0.0, 0.0] | |
| Outcome or subgroup title | No. of studies | No. of participants | Statistical method | Effect size |
| 1 Clinically important upper GI bleeding Show forest plot | 1 | Risk Ratio (M‐H, Fixed, 95% CI) | Totals not selected | |
| 1.1 Ranitidine vs teprenone | 1 | Risk Ratio (M‐H, Fixed, 95% CI) | 0.0 [0.0, 0.0] | |
| 2 All‐cause mortality in ICU Show forest plot | 1 | Risk Ratio (M‐H, Fixed, 95% CI) | Totals not selected | |
| 2.1 Ranitidine vs teprenone | 1 | Risk Ratio (M‐H, Fixed, 95% CI) | 0.0 [0.0, 0.0] | |
| 3 Number of participants requiring blood transfusion Show forest plot | 1 | Risk Ratio (M‐H, Fixed, 95% CI) | Totals not selected | |
| 3.1 Ranitidine vs teprenone | 1 | Risk Ratio (M‐H, Fixed, 95% CI) | 0.0 [0.0, 0.0] | |
| Outcome or subgroup title | No. of studies | No. of participants | Statistical method | Effect size |
| 1 Clinically important upper GI bleeding Show forest plot | 2 | 230 | Risk Ratio (M‐H, Fixed, 95% CI) | 0.24 [0.06, 0.95] |
| 1.1 Cimetidine + antacids vs sucralfate | 1 | 100 | Risk Ratio (M‐H, Fixed, 95% CI) | 0.14 [0.01, 2.70] |
| 1.2 Cimetidine or ranitidine + antacids vs sucralfate | 1 | 130 | Risk Ratio (M‐H, Fixed, 95% CI) | 0.29 [0.06, 1.41] |
| 2 Nosocomial pneumonia Show forest plot | 3 | 281 | Risk Ratio (M‐H, Random, 95% CI) | 1.09 [0.51, 2.32] |
| 2.1 Cimetidine + antacids vs sucralfate | 1 | 100 | Risk Ratio (M‐H, Random, 95% CI) | 0.53 [0.26, 1.07] |
| 2.2 Ranitidine + antacids vs sucralfate | 1 | 51 | Risk Ratio (M‐H, Random, 95% CI) | 1.27 [0.64, 2.53] |
| 2.3 Cimetidine or ranitidine + antacids vs sucralfate | 1 | 130 | Risk Ratio (M‐H, Random, 95% CI) | 2.02 [0.89, 4.58] |
| 3 All‐cause mortality in ICU Show forest plot | 2 | 230 | Risk Ratio (M‐H, Fixed, 95% CI) | 1.38 [0.92, 2.05] |
| 3.1 Cimetidine + antacids vs sucralfate | 1 | 100 | Risk Ratio (M‐H, Fixed, 95% CI) | 1.0 [0.46, 2.19] |
| 3.2 Cimetidine or ranitidine + antacids vs sucralfate | 1 | 130 | Risk Ratio (M‐H, Fixed, 95% CI) | 1.57 [0.99, 2.50] |
| 4 Duration of ICU stay Show forest plot | 1 | Mean Difference (IV, Fixed, 95% CI) | Totals not selected | |
| 5 Duration of intubation Show forest plot | 2 | 230 | Mean Difference (IV, Random, 95% CI) | ‐1.24 [‐13.82, 11.33] |
| 5.1 Cimetidine + antacids vs sucralfate | 1 | 100 | Mean Difference (IV, Random, 95% CI) | ‐8.8 [‐20.11, 2.51] |
| 5.2 Cimetidine or ranitidine + antacids vs sucralfate | 1 | 130 | Mean Difference (IV, Random, 95% CI) | 4.20 [‐0.54, 8.94] |
| 6 Number of participants requiring blood transfusion Show forest plot | 1 | Risk Ratio (M‐H, Fixed, 95% CI) | Totals not selected | |
| Outcome or subgroup title | No. of studies | No. of participants | Statistical method | Effect size |
| 1 Clinically important upper GI bleeding Show forest plot | 1 | Risk Ratio (M‐H, Fixed, 95% CI) | Totals not selected | |
| 1.1 Proton pump inhibitors vs teprenone | 1 | Risk Ratio (M‐H, Fixed, 95% CI) | 0.0 [0.0, 0.0] | |
| 2 All‐cause mortality in ICU Show forest plot | 1 | Risk Ratio (M‐H, Fixed, 95% CI) | Totals not selected | |
| 2.1 Proton pump inhibitors vs teprenone | 1 | Risk Ratio (M‐H, Fixed, 95% CI) | 0.0 [0.0, 0.0] | |
| 3 Number of participants requiring blood transfusion Show forest plot | 1 | Risk Ratio (M‐H, Fixed, 95% CI) | Totals not selected | |
| 3.1 Proton pump inhibitors vs teprenone | 1 | Risk Ratio (M‐H, Fixed, 95% CI) | 0.0 [0.0, 0.0] | |
| Outcome or subgroup title | No. of studies | No. of participants | Statistical method | Effect size |
| 1 Clinically important upper GI bleeding Show forest plot | 1 | Odds Ratio (M‐H, Fixed, 95% CI) | Totals not selected | |
| 2 All‐cause mortality in hospital Show forest plot | 1 | Odds Ratio (M‐H, Fixed, 95% CI) | Totals not selected | |
| 3 Adverse events ‐ gastrointestinal discomfort Show forest plot | 1 | Odds Ratio (M‐H, Fixed, 95% CI) | Totals not selected | |
| Outcome or subgroup title | No. of studies | No. of participants | Statistical method | Effect size |
| 1 Clinically important upper GI bleeding Show forest plot | 1 | Risk Ratio (M‐H, Fixed, 95% CI) | Totals not selected | |
| 2 Nosocomial pneumonia Show forest plot | 1 | Risk Ratio (M‐H, Fixed, 95% CI) | Totals not selected | |
| 3 All‐cause mortality in hospital Show forest plot | 1 | Risk Ratio (M‐H, Fixed, 95% CI) | Totals not selected | |
| Outcome or subgroup title | No. of studies | No. of participants | Statistical method | Effect size |
| 1 Clinically important upper GI bleeding Show forest plot | 16 | 1772 | Risk Ratio (M‐H, Fixed, 95% CI) | 1.00 [0.72, 1.39] |
| 1.1 Antacids vs sucralfate | 15 | 1705 | Risk Ratio (M‐H, Fixed, 95% CI) | 0.96 [0.69, 1.35] |
| 1.2 Antacid + pirenzepine vs sucralfate + pirenzepine | 1 | 67 | Risk Ratio (M‐H, Fixed, 95% CI) | 5.15 [0.26, 103.33] |
| 2 Nosocomial pneumonia Show forest plot | 7 | Risk Ratio (M‐H, Fixed, 95% CI) | Subtotals only | |
| 2.1 Antacids vs sucralfate | 7 | 996 | Risk Ratio (M‐H, Fixed, 95% CI) | 1.04 [0.84, 1.30] |
| 3 All‐cause mortality in ICU Show forest plot | 11 | 1249 | Risk Ratio (M‐H, Fixed, 95% CI) | 1.15 [0.93, 1.40] |
| 3.1 Antacid vs sucralfate | 10 | 1182 | Risk Ratio (M‐H, Fixed, 95% CI) | 1.15 [0.94, 1.41] |
| 3.2 Antacid + pirenzepine vs sucralfate + pirenzepine | 1 | 67 | Risk Ratio (M‐H, Fixed, 95% CI) | 1.03 [0.28, 3.78] |
| 4 All‐cause mortality in hospital Show forest plot | 3 | 450 | Risk Ratio (M‐H, Random, 95% CI) | 0.98 [0.69, 1.39] |
| 5 Duration of ICU stay Show forest plot | 2 | Mean Difference (IV, Fixed, 95% CI) | Subtotals only | |
| 5.1 Antacids vs sucralfate | 2 | 227 | Mean Difference (IV, Fixed, 95% CI) | ‐2.50 [‐6.61, 1.61] |
| 6 Duration of intubation Show forest plot | 4 | Std. Mean Difference (IV, Fixed, 95% CI) | Subtotals only | |
| 6.1 Antacids vs sucralfate | 4 | 281 | Std. Mean Difference (IV, Fixed, 95% CI) | ‐0.18 [‐0.41, 0.06] |
| 7 Number of participants requiring blood transfusion Show forest plot | 6 | 667 | Risk Ratio (M‐H, Fixed, 95% CI) | 0.73 [0.40, 1.34] |
| 8 Adverse events of interventions Show forest plot | 9 | Risk Ratio (M‐H, Fixed, 95% CI) | Subtotals only | |
| 8.1 Diarrhoea | 6 | 599 | Risk Ratio (M‐H, Fixed, 95% CI) | 12.40 [3.88, 39.64] |
| 8.2 Hypermagnesaemia | 4 | 317 | Risk Ratio (M‐H, Fixed, 95% CI) | 4.72 [1.24, 17.95] |
| 8.3 Nausea and vomiting | 3 | 223 | Risk Ratio (M‐H, Fixed, 95% CI) | 0.63 [0.28, 1.41] |
| 8.4 Thrombocytopaenia | 1 | 38 | Risk Ratio (M‐H, Fixed, 95% CI) | 5.0 [0.26, 97.70] |
| 8.5 Severe alkalosis | 1 | 100 | Risk Ratio (M‐H, Fixed, 95% CI) | 3.0 [0.13, 71.92] |
| 8.6 Allergic reactions | 1 | 100 | Risk Ratio (M‐H, Fixed, 95% CI) | 0.2 [0.01, 4.06] |
| Outcome or subgroup title | No. of studies | No. of participants | Statistical method | Effect size |
| 1 Clinically important upper GI bleeding Show forest plot | 2 | 329 | Risk Ratio (M‐H, Fixed, 95% CI) | 0.33 [0.12, 0.91] |
| 2 All‐cause mortality in ICU Show forest plot | 2 | 417 | Risk Ratio (M‐H, Fixed, 95% CI) | 0.84 [0.42, 1.67] |
| 3 Adverse events of interventions Show forest plot | 1 | Risk Ratio (M‐H, Fixed, 95% CI) | Subtotals only | |
| 3.1 Diarrhoea | 1 | 368 | Risk Ratio (M‐H, Fixed, 95% CI) | 0.92 [0.64, 1.33] |
| 3.2 Elevated serum bicarbonate | 1 | 338 | Risk Ratio (M‐H, Fixed, 95% CI) | 2.21 [1.27, 3.87] |
| 3.3 Phospate levels < 2.5 mg/dL | 1 | 276 | Risk Ratio (M‐H, Fixed, 95% CI) | 1.66 [1.01, 2.73] |
| Outcome or subgroup title | No. of studies | No. of participants | Statistical method | Effect size |
| 1 Clinically important upper GI bleeding Show forest plot | 1 | Risk Ratio (M‐H, Fixed, 95% CI) | Totals not selected | |
| 2 Number of participants requiring blood transfusion Show forest plot | 1 | Risk Ratio (M‐H, Fixed, 95% CI) | Totals not selected | |
| Outcome or subgroup title | No. of studies | No. of participants | Statistical method | Effect size |
| 1 Clinically important upper GI bleeding Show forest plot | 3 | Risk Ratio (M‐H, Fixed, 95% CI) | Subtotals only | |
| 1.1 Sucralfate vs omeprazole | 3 | 287 | Risk Ratio (M‐H, Fixed, 95% CI) | 2.58 [0.77, 8.63] |
| 2 Nosocomial pneumonia Show forest plot | 4 | 424 | Risk Ratio (M‐H, Random, 95% CI) | 0.67 [0.41, 1.09] |
| 2.1 Sucralfate vs omeprazole | 3 | 287 | Risk Ratio (M‐H, Random, 95% CI) | 0.88 [0.57, 1.36] |
| 2.2 Sucralfate vs pantoprazole | 1 | 137 | Risk Ratio (M‐H, Random, 95% CI) | 0.39 [0.20, 0.75] |
| 3 All‐cause mortality in ICU Show forest plot | 4 | 424 | Risk Ratio (M‐H, Fixed, 95% CI) | 1.07 [0.68, 1.68] |
| 3.1 Sucralfate vs omeprazole | 3 | 287 | Risk Ratio (M‐H, Fixed, 95% CI) | 1.26 [0.75, 2.11] |
| 3.2 Sucralfate vs pantoprazole | 1 | 137 | Risk Ratio (M‐H, Fixed, 95% CI) | 0.65 [0.25, 1.68] |
| 4 All‐cause mortality in hospital Show forest plot | 2 | 278 | Risk Ratio (M‐H, Fixed, 95% CI) | 0.79 [0.46, 1.37] |
| 4.1 Sucralfate vs omeprazole | 1 | 141 | Risk Ratio (M‐H, Fixed, 95% CI) | 0.97 [0.49, 1.91] |
| 4.2 Sucralfate vs pantoprazole | 1 | 137 | Risk Ratio (M‐H, Fixed, 95% CI) | 0.56 [0.21, 1.45] |
| 5 Duration of ICU stay Show forest plot | 2 | Mean Difference (IV, Fixed, 95% CI) | Subtotals only | |
| 5.1 Sucralfate vs omeprazole | 2 | 217 | Mean Difference (IV, Fixed, 95% CI) | 0.01 [‐1.68, 1.70] |
| 6 Duration of intubation Show forest plot | 3 | 354 | Mean Difference (IV, Fixed, 95% CI) | ‐0.16 [‐1.61, 1.28] |
| 6.1 Sucralfate vs omeprazole | 2 | 217 | Mean Difference (IV, Fixed, 95% CI) | 0.02 [‐1.56, 1.60] |
| 6.2 Sucralfate vs pantoprazole | 1 | 137 | Mean Difference (IV, Fixed, 95% CI) | ‐1.10 [‐4.69, 2.49] |
| 7 Number of participants requiring blood transfusion Show forest plot | 1 | Risk Ratio (M‐H, Fixed, 95% CI) | Subtotals only | |
| 7.1 Sucralfate vs omeprazole | 1 | 70 | Risk Ratio (M‐H, Fixed, 95% CI) | 5.91 [0.29, 118.78] |
| 8 Adverse events of interventions Show forest plot | 1 | Risk Ratio (M‐H, Random, 95% CI) | Subtotals only | |
| 8.1 Fever | 1 | 137 | Risk Ratio (M‐H, Random, 95% CI) | 0.81 [0.70, 0.94] |
| 8.2 Leucocytosis | 1 | 137 | Risk Ratio (M‐H, Random, 95% CI) | 0.66 [0.55, 0.80] |
| 8.3 Sudden purulent sputum | 1 | 137 | Risk Ratio (M‐H, Random, 95% CI) | 0.85 [0.38, 1.86] |
| 8.4 Sudden cough or aggravation of coughing | 1 | 137 | Risk Ratio (M‐H, Random, 95% CI) | 0.23 [0.07, 0.79] |
| 8.5 Dyspnoea | 1 | 137 | Risk Ratio (M‐H, Random, 95% CI) | 0.68 [0.54, 0.87] |
| 8.6 Rales or bronchial sounds | 1 | 137 | Risk Ratio (M‐H, Random, 95% CI) | 0.31 [0.19, 0.51] |
| 8.7 Aggravation of blood gas exchange | 1 | 137 | Risk Ratio (M‐H, Random, 95% CI) | 0.76 [0.49, 1.18] |
| 8.8 Change in sputum quality | 1 | 137 | Risk Ratio (M‐H, Random, 95% CI) | 0.23 [0.13, 0.40] |
| Outcome or subgroup title | No. of studies | No. of participants | Statistical method | Effect size |
| 1 Clinically important upper GI bleeding Show forest plot | 1 | Risk Ratio (M‐H, Fixed, 95% CI) | Totals not selected | |
| 2 Number of participants requiring blood transfusion Show forest plot | 1 | Risk Ratio (M‐H, Fixed, 95% CI) | Totals not selected | |
| Outcome or subgroup title | No. of studies | No. of participants | Statistical method | Effect size |
| 1 Clinically important upper GI bleeding Show forest plot | 1 | Risk Ratio (M‐H, Fixed, 95% CI) | Subtotals only | |
| 1.1 TPN vs ranitidine + TPN | 1 | 54 | Risk Ratio (M‐H, Fixed, 95% CI) | 0.8 [0.05, 12.14] |
| 1.2 TPN vs sucralfate + TPN | 1 | 49 | Risk Ratio (M‐H, Fixed, 95% CI) | 0.32 [0.03, 3.26] |
| 2 All‐cause mortality in ICU Show forest plot | 1 | Risk Ratio (M‐H, Fixed, 95% CI) | Subtotals only | |
| 2.1 TPN vs ranitidine + TPN | 1 | 54 | Risk Ratio (M‐H, Fixed, 95% CI) | 1.12 [0.41, 3.09] |
| 2.2 TPN vs sucralfate + TPN | 1 | 49 | Risk Ratio (M‐H, Fixed, 95% CI) | 0.63 [0.26, 1.52] |
| 3 Duration of intubation Show forest plot | 1 | Mean Difference (IV, Fixed, 95% CI) | Subtotals only | |
| 3.1 TPN vs ranitidine + TPN | 1 | 54 | Mean Difference (IV, Fixed, 95% CI) | ‐2.0 [‐9.53, 5.53] |
| 3.2 TPN vs sucralfate + TPN | 1 | 49 | Mean Difference (IV, Fixed, 95% CI) | 3.0 [‐1.50, 7.50] |
| Outcome or subgroup title | No. of studies | No. of participants | Statistical method | Effect size |
| 1 Clinically important upper GI bleeding Show forest plot | 1 | Risk Ratio (M‐H, Fixed, 95% CI) | Totals not selected | |
| Outcome or subgroup title | No. of studies | No. of participants | Statistical method | Effect size |
| 1 Clinically important upper GI bleeding Show forest plot | 1 | Risk Ratio (M‐H, Fixed, 95% CI) | Totals not selected | |
| 2 Nosocomial pneumonia Show forest plot | 1 | Risk Ratio (M‐H, Fixed, 95% CI) | Totals not selected | |
| 3 All‐cause mortality in hospital Show forest plot | 1 | Risk Ratio (M‐H, Fixed, 95% CI) | Totals not selected | |
| 4 Adverse events of interventions Show forest plot | 1 | Risk Ratio (M‐H, Fixed, 95% CI) | Totals not selected | |
| Outcome or subgroup title | No. of studies | No. of participants | Statistical method | Effect size |
| 1 Nosocomial pneumonia Show forest plot | 1 | 120 | Risk Ratio (M‐H, Fixed, 95% CI) | 0.79 [0.44, 1.40] |
| 1.1 Enteral plus parenteral nutrition vs enteral nutrition | 1 | 60 | Risk Ratio (M‐H, Fixed, 95% CI) | 0.6 [0.29, 1.25] |
| 1.2 Enteral plus parenteral nutrition vs parenteral nutrition | 1 | 60 | Risk Ratio (M‐H, Fixed, 95% CI) | 1.25 [0.47, 3.33] |
| 2 All‐cause mortality in hospital Show forest plot | 1 | 120 | Odds Ratio (M‐H, Fixed, 95% CI) | 0.20 [0.06, 0.60] |
| 2.1 Enteral plus parenteral nutrition vs enteral nutrition | 1 | 60 | Odds Ratio (M‐H, Fixed, 95% CI) | 0.26 [0.05, 1.30] |
| 2.2 Enteral plus parenteral nutrition vs parenteral nutrition | 1 | 60 | Odds Ratio (M‐H, Fixed, 95% CI) | 0.15 [0.03, 0.74] |
| 3 Duration of ICU stay Show forest plot | 1 | 120 | Mean Difference (IV, Fixed, 95% CI) | ‐5.98 [‐8.81, ‐3.16] |
| 3.1 Enteral plus parenteral nutrition vs enteral nutrition | 1 | 60 | Mean Difference (IV, Fixed, 95% CI) | ‐3.81 [‐7.59, ‐0.03] |
| 3.2 Enteral plus parenteral nutrition vs parenteral nutrition | 1 | 60 | Mean Difference (IV, Fixed, 95% CI) | ‐8.72 [‐12.97, ‐4.47] |
| 4 Duration of intubation Show forest plot | 1 | 120 | Mean Difference (IV, Fixed, 95% CI) | ‐7.37 [‐9.29, ‐5.45] |
| 4.1 Enteral plus parenteral nutrition vs enteral nutrition | 1 | 60 | Mean Difference (IV, Fixed, 95% CI) | ‐4.17 [‐6.96, ‐1.38] |
| 4.2 Enteral plus parenteral nutrition vs parenteral nutrition | 1 | 60 | Mean Difference (IV, Fixed, 95% CI) | ‐10.24 [‐12.88, ‐7.60] |
| 5 Adverse events ‐ stress ulcer Show forest plot | 1 | 120 | Risk Ratio (M‐H, Fixed, 95% CI) | 0.69 [0.36, 1.33] |
| 5.1 Enteral plus parenteral nutrition vs enteral nutrition | 1 | 60 | Risk Ratio (M‐H, Fixed, 95% CI) | 1.14 [0.38, 3.45] |
| 5.2 Enteral plus parenteral nutrition vs parenteral nutrition | 1 | 60 | Risk Ratio (M‐H, Fixed, 95% CI) | 0.53 [0.23, 1.20] |
| 6 Adverse events ‐ diarrhoea Show forest plot | 1 | 120 | Odds Ratio (M‐H, Fixed, 95% CI) | 0.42 [0.17, 1.02] |
| 6.1 Enteral plus parenteral nutrition vs enteral nutrition | 1 | 60 | Odds Ratio (M‐H, Fixed, 95% CI) | 0.17 [0.05, 0.59] |
| 6.2 Enteral plus parenteral nutrition vs parenteral nutrition | 1 | 60 | Odds Ratio (M‐H, Fixed, 95% CI) | 1.42 [0.35, 5.73] |
| 7 Adverse events ‐ pyaemia Show forest plot | 1 | 120 | Odds Ratio (M‐H, Fixed, 95% CI) | 0.88 [0.37, 2.09] |
| 7.1 Enteral plus parenteral nutrition vs enteral nutrition | 1 | 60 | Odds Ratio (M‐H, Fixed, 95% CI) | 4.11 [0.87, 19.41] |
| 7.2 Enteral plus parenteral nutrition vs parenteral nutrition | 1 | 60 | Odds Ratio (M‐H, Fixed, 95% CI) | 0.37 [0.11, 1.21] |
| 8 Adverse events ‐ intracranial infection Show forest plot | 1 | 120 | Odds Ratio (M‐H, Fixed, 95% CI) | 0.43 [0.15, 1.25] |
| 8.1 Enteral plus parenteral nutrition vs enteral nutrition | 1 | 60 | Odds Ratio (M‐H, Fixed, 95% CI) | 0.83 [0.19, 3.63] |
| 8.2 Enteral plus parenteral nutrition vs parenteral nutrition | 1 | 60 | Odds Ratio (M‐H, Fixed, 95% CI) | 0.23 [0.05, 1.15] |
| 9 Adverse events ‐ hypoproteinaemia Show forest plot | 1 | 120 | Odds Ratio (M‐H, Fixed, 95% CI) | 0.11 [0.04, 0.27] |
| 9.1 Enteral plus parenteral nutrition vs enteral nutrition | 1 | 60 | Odds Ratio (M‐H, Fixed, 95% CI) | 0.20 [0.06, 0.72] |
| 9.2 Enteral plus parenteral nutrition vs parenteral nutrition | 1 | 60 | Odds Ratio (M‐H, Fixed, 95% CI) | 0.04 [0.01, 0.19] |