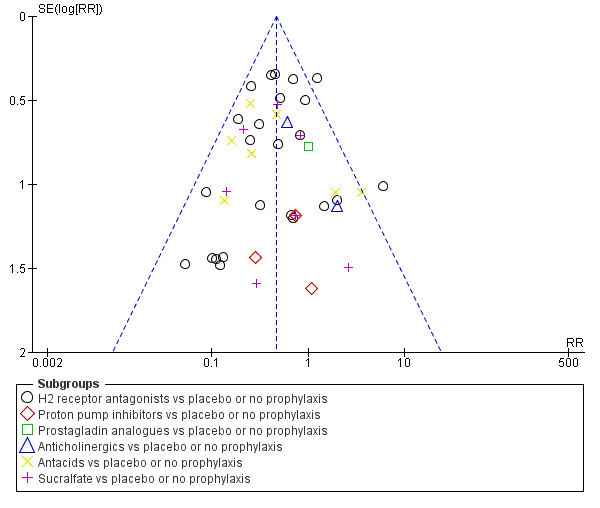
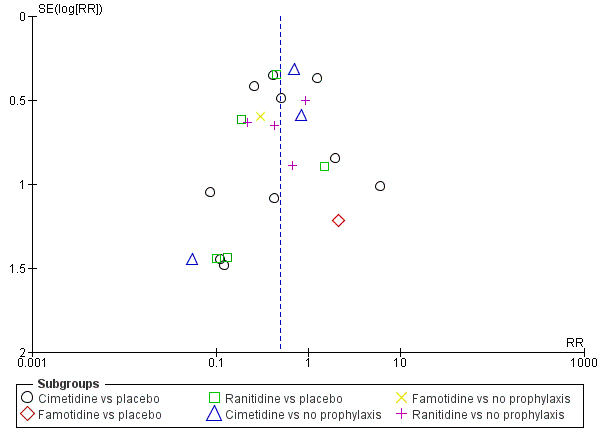
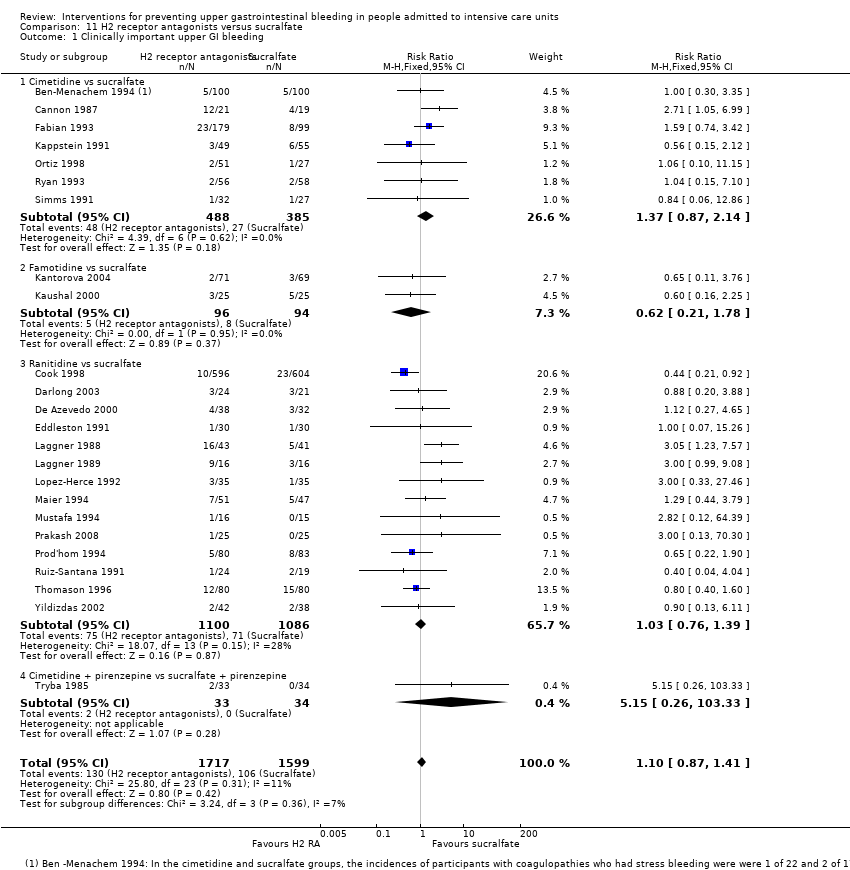
| 1 Clinically important upper GI bleeding Show forest plot | 24 | 2149 | Risk Ratio (M‐H, Random, 95% CI) | 0.50 [0.36, 0.70] |
|
| 1.1 Cimetidine vs placebo | 10 | 772 | Risk Ratio (M‐H, Random, 95% CI) | 0.53 [0.28, 1.02] |
| 1.2 Famotidine vs placebo | 1 | 146 | Risk Ratio (M‐H, Random, 95% CI) | 2.11 [0.20, 22.79] |
| 1.3 Ranitidine vs placebo | 5 | 446 | Risk Ratio (M‐H, Random, 95% CI) | 0.36 [0.17, 0.77] |
| 1.4 Cimetidine vs no prophylaxis | 3 | 516 | Risk Ratio (M‐H, Random, 95% CI) | 0.59 [0.23, 1.48] |
| 1.5 Famotidine vs no prophylaxis | 1 | 50 | Risk Ratio (M‐H, Random, 95% CI) | 0.3 [0.09, 0.96] |
| 1.6 Ranitidine vs no prophylaxis | 4 | 219 | Risk Ratio (M‐H, Random, 95% CI) | 0.51 [0.26, 1.00] |
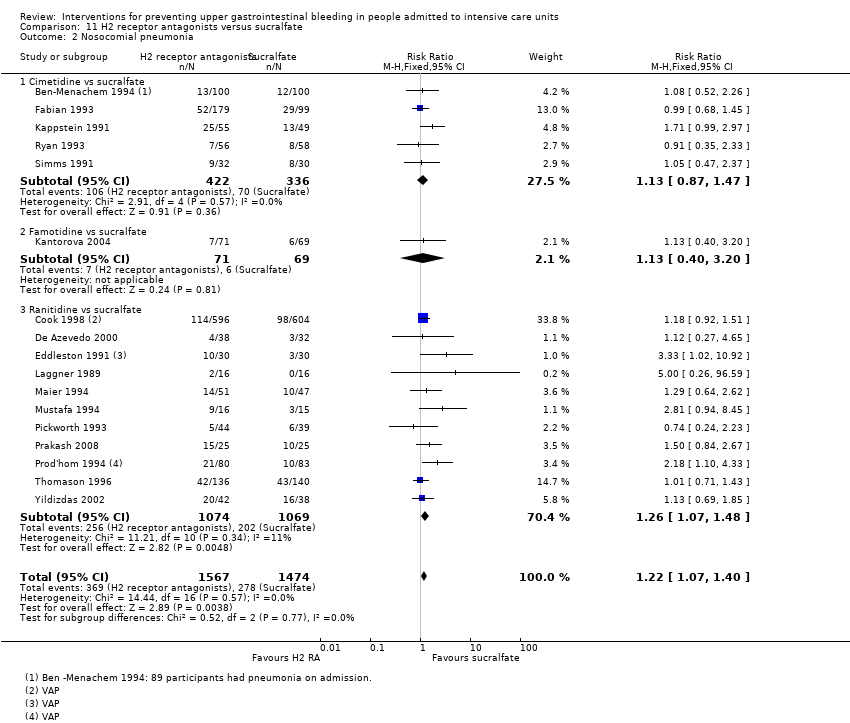
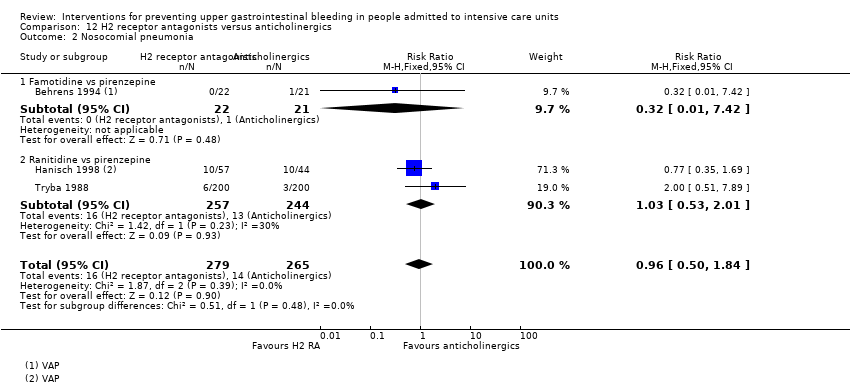
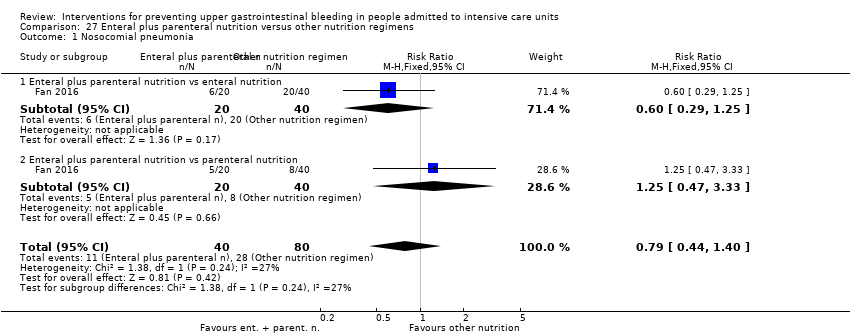
| 2 Nosocomial pneumonia Show forest plot | 8 | 945 | Risk Ratio (M‐H, Fixed, 95% CI) | 1.12 [0.85, 1.48] |
|
| 2.1 Cimetidine vs placebo | 2 | 204 | Risk Ratio (M‐H, Fixed, 95% CI) | 0.34 [0.06, 2.00] |
| 2.2 Famotidine vs placebo | 1 | 146 | Risk Ratio (M‐H, Fixed, 95% CI) | 1.48 [0.49, 4.45] |
| 2.3 Ranitidine vs placebo | 2 | 277 | Risk Ratio (M‐H, Fixed, 95% CI) | 0.79 [0.47, 1.31] |
| 2.4 Cimetidine vs no prophylaxis | 1 | 200 | Risk Ratio (M‐H, Fixed, 95% CI) | 2.17 [0.86, 5.47] |
| 2.5 Ranitidine vs no prophylaxis | 2 | 118 | Risk Ratio (M‐H, Fixed, 95% CI) | 1.33 [0.93, 1.90] |
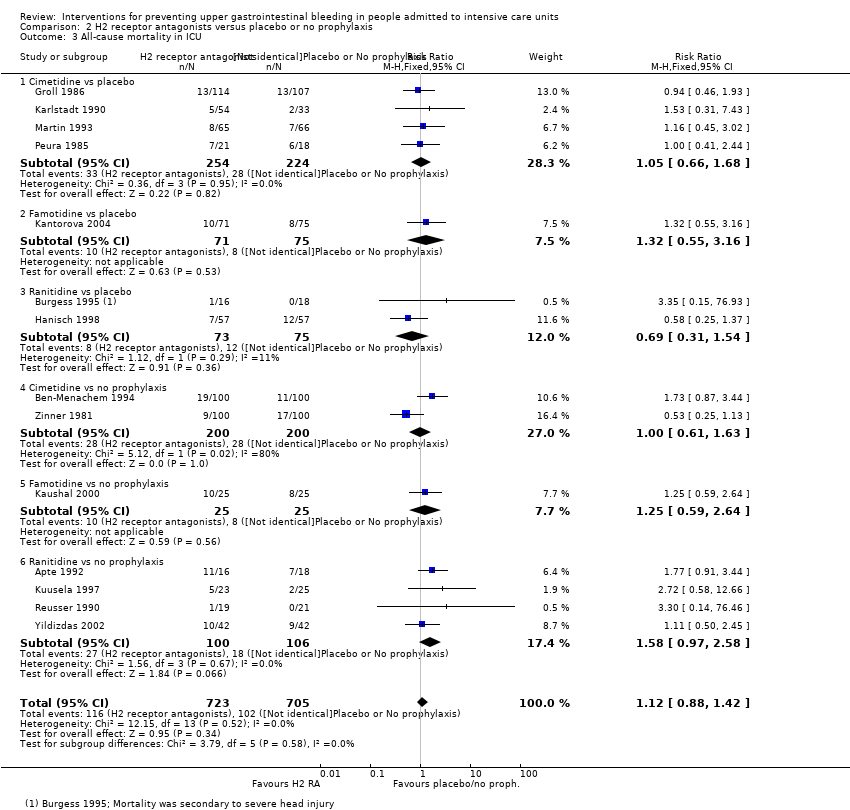
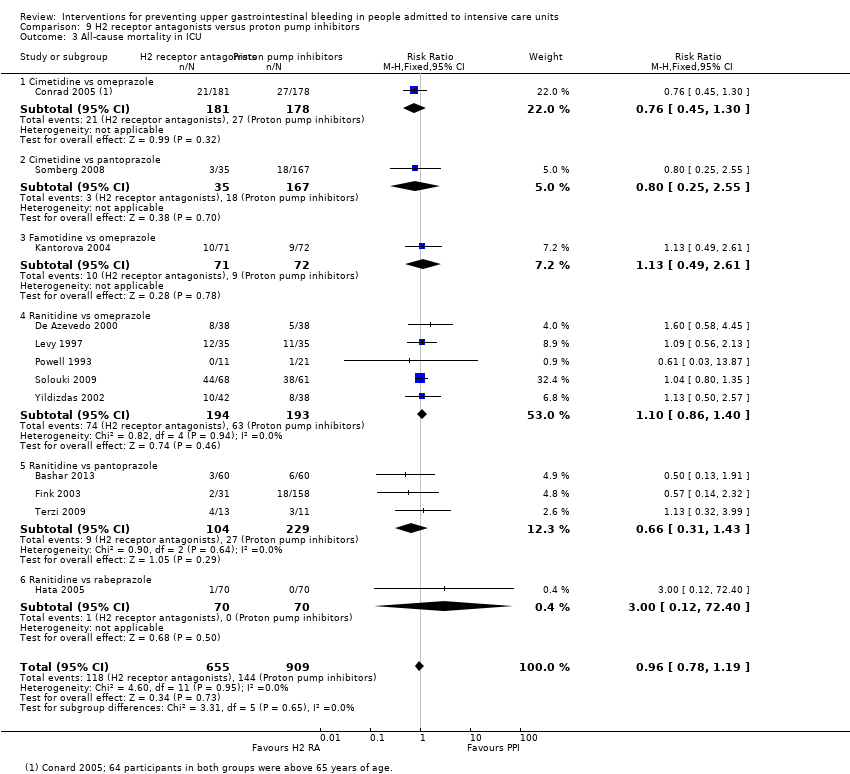
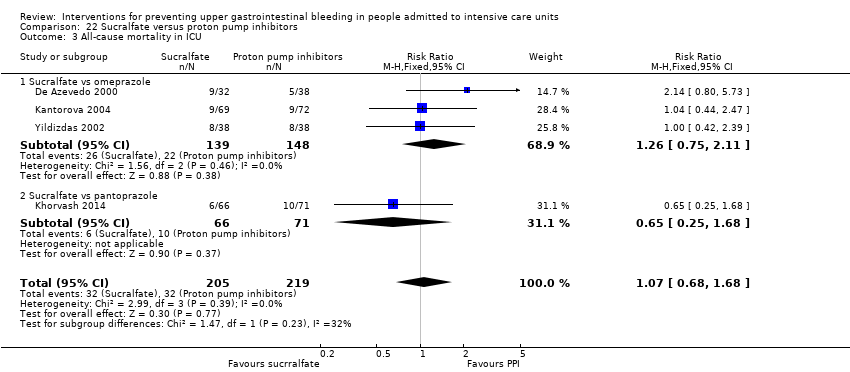
| 3 All‐cause mortality in ICU Show forest plot | 14 | 1428 | Risk Ratio (M‐H, Fixed, 95% CI) | 1.12 [0.88, 1.42] |
|
| 3.1 Cimetidine vs placebo | 4 | 478 | Risk Ratio (M‐H, Fixed, 95% CI) | 1.05 [0.66, 1.68] |
| 3.2 Famotidine vs placebo | 1 | 146 | Risk Ratio (M‐H, Fixed, 95% CI) | 1.32 [0.55, 3.16] |
| 3.3 Ranitidine vs placebo | 2 | 148 | Risk Ratio (M‐H, Fixed, 95% CI) | 0.69 [0.31, 1.54] |
| 3.4 Cimetidine vs no prophylaxis | 2 | 400 | Risk Ratio (M‐H, Fixed, 95% CI) | 1.0 [0.61, 1.63] |
| 3.5 Famotidine vs no prophylaxis | 1 | 50 | Risk Ratio (M‐H, Fixed, 95% CI) | 1.25 [0.59, 2.64] |
| 3.6 Ranitidine vs no prophylaxis | 4 | 206 | Risk Ratio (M‐H, Fixed, 95% CI) | 1.58 [0.97, 2.58] |
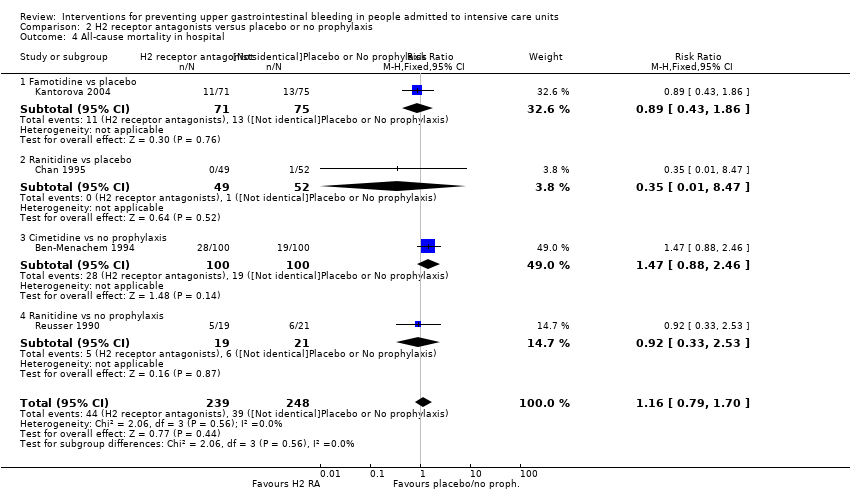
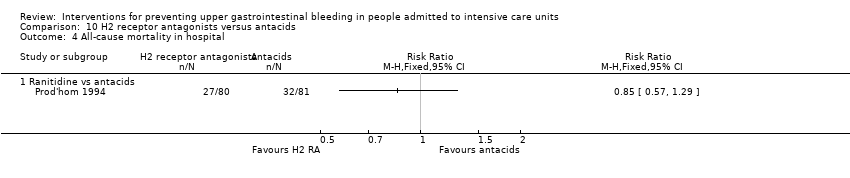
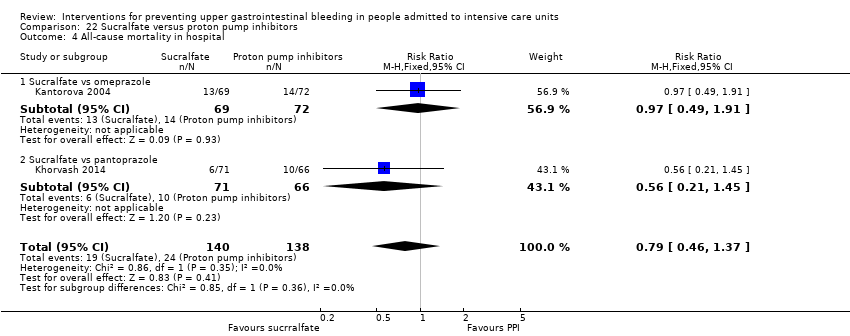
| 4 All‐cause mortality in hospital Show forest plot | 4 | 487 | Risk Ratio (M‐H, Fixed, 95% CI) | 1.16 [0.79, 1.70] |
|
| 4.1 Famotidine vs placebo | 1 | 146 | Risk Ratio (M‐H, Fixed, 95% CI) | 0.89 [0.43, 1.86] |
| 4.2 Ranitidine vs placebo | 1 | 101 | Risk Ratio (M‐H, Fixed, 95% CI) | 0.35 [0.01, 8.47] |
| 4.3 Cimetidine vs no prophylaxis | 1 | 200 | Risk Ratio (M‐H, Fixed, 95% CI) | 1.47 [0.88, 2.46] |
| 4.4 Ranitidine vs no prophylaxis | 1 | 40 | Risk Ratio (M‐H, Fixed, 95% CI) | 0.92 [0.33, 2.53] |
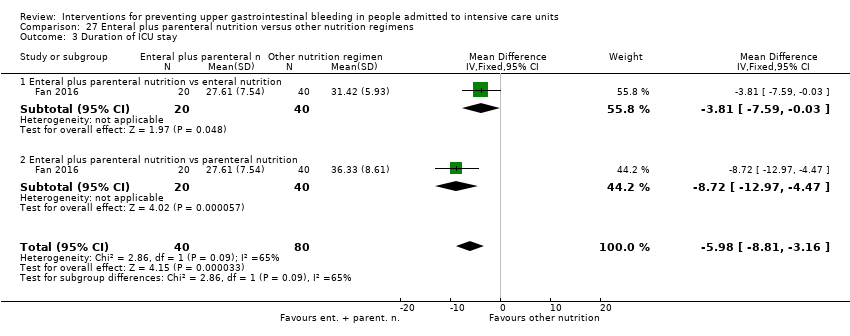
| 5 Duration of ICU stay Show forest plot | 2 | 230 | Mean Difference (IV, Fixed, 95% CI) | 0.73 [‐0.92, 2.38] |
|
| 5.1 Famotidine vs placebo | 1 | 146 | Mean Difference (IV, Fixed, 95% CI) | 1.5 [‐1.93, 4.93] |
| 5.2 Ranitidine vs no prophylaxis | 1 | 84 | Mean Difference (IV, Fixed, 95% CI) | 0.5 [‐1.38, 2.38] |
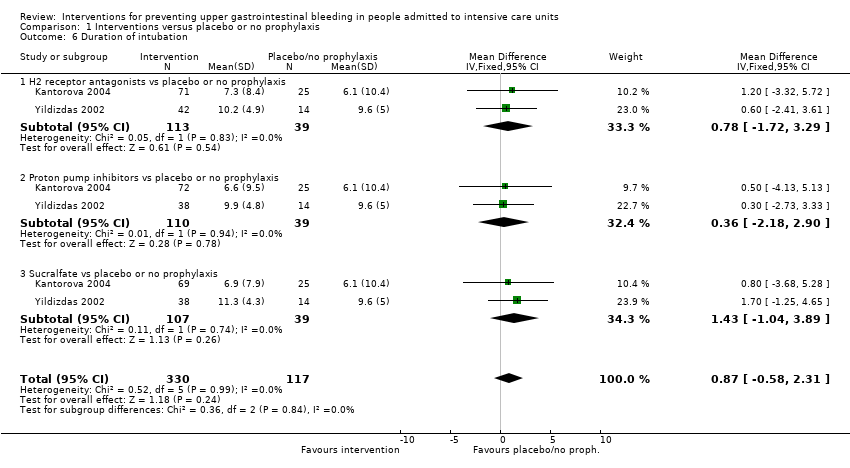
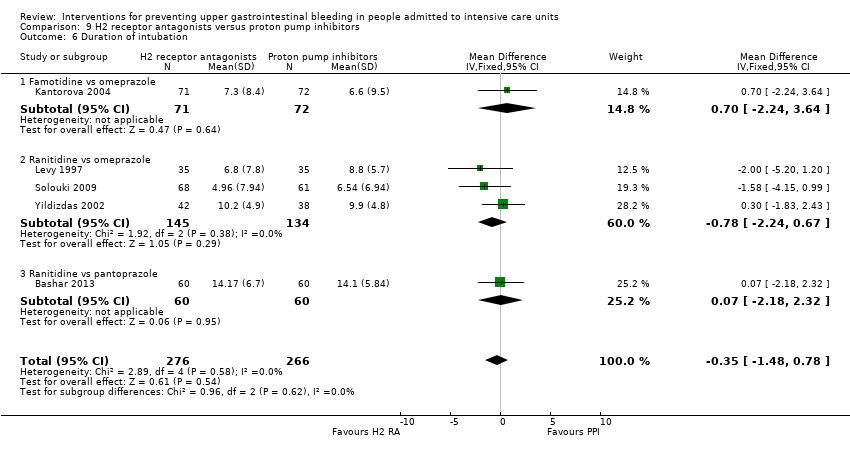
| 6 Duration of intubation Show forest plot | 2 | 230 | Mean Difference (IV, Fixed, 95% CI) | 0.79 [‐0.95, 2.54] |
|
| 6.1 Famotidine vs placebo | 1 | 146 | Mean Difference (IV, Fixed, 95% CI) | 1.20 [‐1.86, 4.26] |
| 6.2 Ranitidine vs no prophylaxis | 1 | 84 | Mean Difference (IV, Fixed, 95% CI) | 0.60 [‐1.52, 2.72] |
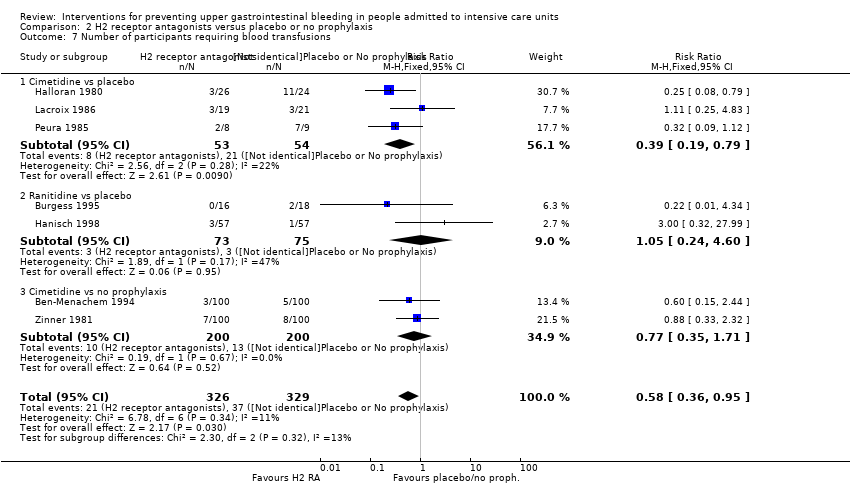
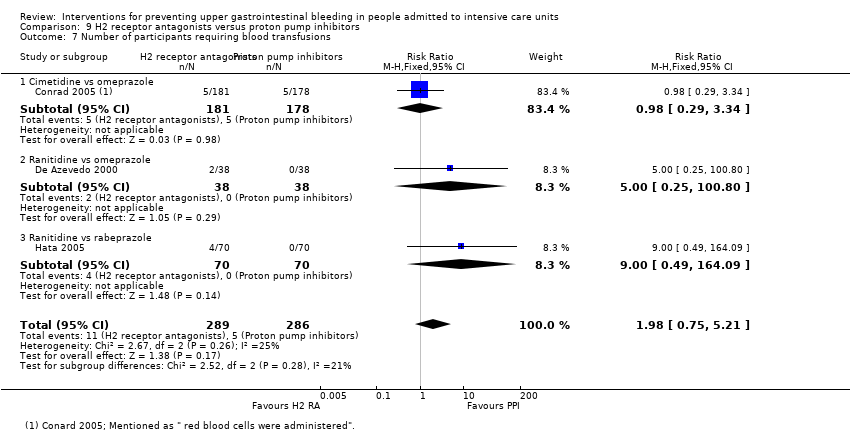
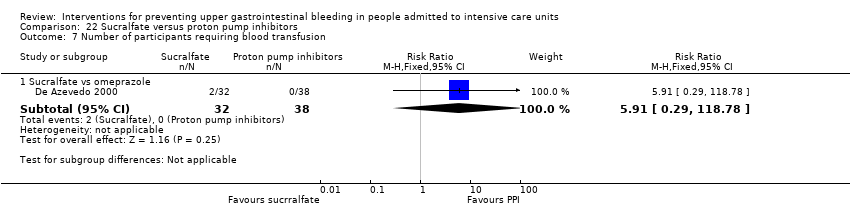
| 7 Number of participants requiring blood transfusions Show forest plot | 7 | 655 | Risk Ratio (M‐H, Fixed, 95% CI) | 0.58 [0.36, 0.95] |
|
| 7.1 Cimetidine vs placebo | 3 | 107 | Risk Ratio (M‐H, Fixed, 95% CI) | 0.39 [0.19, 0.79] |
| 7.2 Ranitidine vs placebo | 2 | 148 | Risk Ratio (M‐H, Fixed, 95% CI) | 1.05 [0.24, 4.60] |
| 7.3 Cimetidine vs no prophylaxis | 2 | 400 | Risk Ratio (M‐H, Fixed, 95% CI) | 0.77 [0.35, 1.71] |
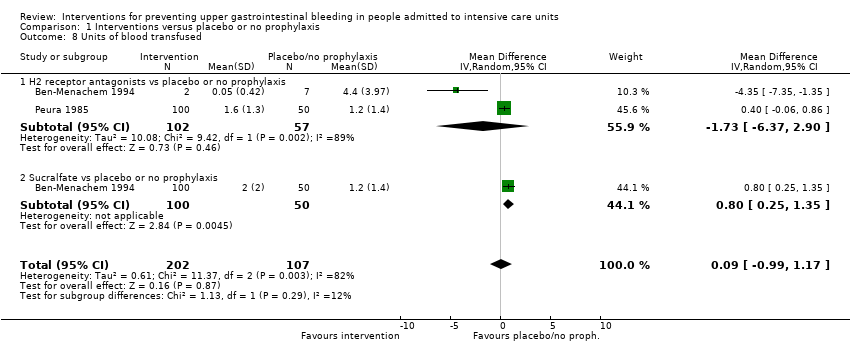
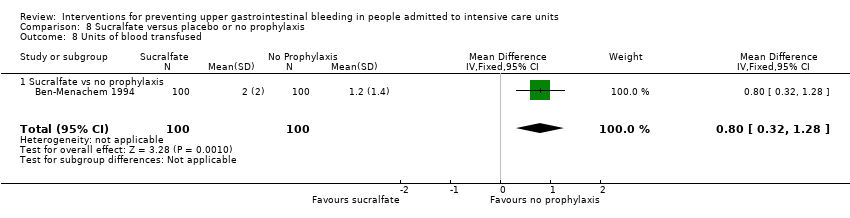
| 8 Units of blood transfused Show forest plot | 2 | 209 | Mean Difference (IV, Fixed, 95% CI) | 0.33 [‐0.04, 0.70] |
|
| 8.1 Cimetidine vs placebo | 1 | 9 | Mean Difference (IV, Fixed, 95% CI) | ‐4.35 [‐7.35, ‐1.35] |
| 8.2 Cimetidine vs no prophylaxis | 1 | 200 | Mean Difference (IV, Fixed, 95% CI) | 0.40 [0.03, 0.77] |
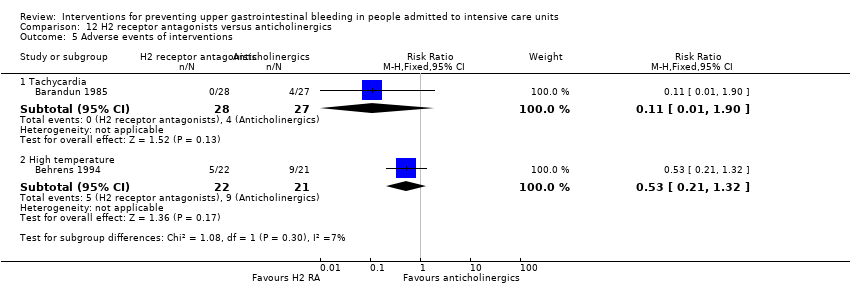
| 9 Adverse events of interventions Show forest plot | 8 | | Risk Ratio (M‐H, Fixed, 95% CI) | Subtotals only |
|
| 9.1 Diarrhoea | 2 | 225 | Risk Ratio (M‐H, Fixed, 95% CI) | 1.30 [0.57, 2.96] |
| 9.2 Thrombocytopenia | 1 | 200 | Risk Ratio (M‐H, Fixed, 95% CI) | 3.0 [0.12, 72.77] |
| 9.3 Hypophosphatemia | 1 | 25 | Risk Ratio (M‐H, Fixed, 95% CI) | 3.75 [0.17, 84.02] |
| 9.4 Mental confusion | 5 | 657 | Risk Ratio (M‐H, Fixed, 95% CI) | 2.01 [1.10, 3.65] |
| 9.5 Nausea and vomiting | 2 | 287 | Risk Ratio (M‐H, Fixed, 95% CI) | 0.46 [0.09, 2.35] |
| 9.6 Increased creatinine levels | 1 | 200 | Risk Ratio (M‐H, Fixed, 95% CI) | 1.04 [0.64, 1.69] |
| 9.7 Erythema | 1 | 70 | Risk Ratio (M‐H, Fixed, 95% CI) | 3.0 [0.13, 71.22] |
| 9.8 Pancreatitis | 1 | 39 | Risk Ratio (M‐H, Fixed, 95% CI) | 0.29 [0.01, 6.66] |
| 9.9 Chest infection | 1 | 101 | Risk Ratio (M‐H, Fixed, 95% CI) | 1.74 [0.92, 3.30] |
| 9.10 Delirium | 1 | 39 | Risk Ratio (M‐H, Fixed, 95% CI) | 2.59 [0.11, 59.93] |
| 9.11 Hallucinations | 1 | 39 | Risk Ratio (M‐H, Fixed, 95% CI) | 2.59 [0.11, 59.93] |
| 9.12 Severe bleeding | 1 | 101 | Risk Ratio (M‐H, Fixed, 95% CI) | 0.35 [0.01, 8.47] |