نقش مصرف مکمل ویتامین A در پیشگیری از بروز مرگومیر (mortality) و بیماری (morbidity) در کودکان سنین شش ماه تا پنج سال
چکیده
پیشینه
کمبود ویتامین A؛ (vitamin A deficiency; VAD) یک مشکل عمده سلامت عمومی در کشورهایی با سطح درآمد پائین و متوسط است، که 190 میلیون کودک در سن کمتر از پنج سال به آن مبتلا هستند و این مساله باعث بروز عواقب بسیار نامطلوبی، از جمله مرگومیر، میشود. بر اساس شواهد گذشته و نسخه قبلی این مطالعه مروری، سازمان جهانی بهداشت همچنان توصیه به مصرف مکمل ویتامین A برای کودکان در سنین 6 تا 59 ماه میکند. از زمان انتشار قبلی این مرور در سال 2010، دادههای جدیدی از کارآزماییهای تصادفیسازی شده به دست آمدهاند، و این بهروزرسانی، دادهها را باهم یکی و شواهد را مرور خواهد کرد.
اهداف
بررسی اثرات مصرف مکمل ویتامین A؛ (vitamin A supplementation; VAS) در پیشگیری از بروز موربیدیتی و مورتالیتی در کودکان سنین شش ماه تا پنج سال.
روشهای جستوجو
در مارچ 2016 به جستوجو در CENTRAL؛ Ovid MEDLINE؛ Embase؛ شش بانک اطلاعاتی دیگر، و دو پایگاه ثبت کارآزمایی پرداختیم. همچنین، به منظور شناسایی مطالعات بیشتر، فهرست منابع را بررسی کرده و با سازمانها و پژوهشگران مرتبط تماس برقرار کردیم.
معیارهای انتخاب
کارآزماییهای تصادفیسازی و کنترل شده (randomised controlled trials; RCTs) و RCTهای خوشهای که تاثیر تجویز VAS صناعی را بر کودکان شش ماه تا پنج سال در سطح جامعه ارزیابی کردند. مطالعات دربرگیرنده کودکان بستری در بیمارستان یا مبتلا به بیماری یا عفونت را کنار گذاشتیم. همچنین، مطالعاتی کنار گذاشته شدند که اثرات غنیسازی غذا، مصرف غذاهای غنی از ویتامین A، یا مصرف مکملهای بتا‐کاروتن را ارزیابی کردند.
گردآوری و تجزیهوتحلیل دادهها
برای این بهروزرسانی، دو نویسنده مرور مستقلا مطالعات را برای ورود بررسی و دادهها را خلاصه کرده، و اختلافهای موجود را با بحث حل کردند. متاآنالیزها را برای پیامدها، شامل مورتالیتی به هر علتی و مورتالیتی به یک علت خاص، بیماری، بینایی، و عوارض جانبی، انجام دادیم. از رویکرد درجهبندی توصیه، ارزیابی، توسعه و ارزشیابی (GRADE) برای بررسی کیفیت شواهد استفاده کردیم.
نتایج اصلی
47 مطالعه (که 4 مورد برای این مرور جدید هستند) را با مجموع تقریبا 1,223,856 کودک شناسایی کردیم. مطالعات در 19 کشور انجام شدند: 30 مطالعه (63%) در آسیا (16 مطالعه در هند)؛ 8 مطالعه (17%) در آفریقا؛ 7 مطالعه (15%) در آمریکای لاتین، و 2 مطالعه (4%) در استرالیا. حدود یک‐سوم از مطالعات در مناطق شهری/حاشیه شهر، و نیمی در مناطق روستایی انجام شدند؛ مابقی، منطقه انجام مطالعه را گزارش نکردند. در اکثر مطالعات تعداد دختران و پسران برابر و طول دوره آنها حدود یک سال بود. مطالعات وارد شده خطر سوگیری (bias) کلی متفاوتی داشتند؛ اما، شواهد برای پیامد اولیه در معرض خطر پائین سوگیری قرار گرفت. متاآنالیز مورتالیتی به هر علتی، شامل 19 کارآزمایی (1,202,382 کودک) شد. در طولانیترین دوره پیگیری، کاهشی به میزان 12% در خطر مورتالیتی به هر علتی برای ویتامین A در مقایسه با کنترل با استفاده از یک مدل اثر‐ثابت دیده شد (خطر نسبی (RR): 0.88؛ 95% فاصله اطمینان (CI): 0.83 تا 0.93؛ شواهد با کیفیت بالا). این نتیجه نسبت به انتخاب مدل حساس بود، و یک متاآنالیز اثرات‐تصادفی، تخمین خلاصه (summary estimate) متفاوتی را نشان داد (24% کاهش: RR: 0.76؛ 95% CI؛ 0.66 تا 0.88)؛ با این حال، فواصل اطمینان با فواصل مدل اثر‐ثابت همپوشانی داشتند. نه کارآزمایی مورتالیتی ناشی از اسهال را گزارش کرده و کاهش کلی را به میزان 12% برای VAS نشان دادند (RR: 0.88؛ 95% CI؛ 0.79 تا 0.98؛ 1,098,538 شرکتکننده؛ شواهد با کیفیت بالا). هیچ تاثیر مهمی از مصرف VAS بر مورتالیتی ناشی از سرخک، بیماری تنفسی، و مننژیت گزارش نشد. VAS توانست نرخ بروز اسهال (RR: 0.85؛ 95% CI؛ 0.82 تا 0.87؛ 15 مطالعه؛ 77,946 شرکتکننده؛ شواهد با کیفیت پائین) و سرخک (RR: 0.50؛ 95% CI؛ 0.37 تا 0.67؛ 6 مطالعه؛ 19,566 شرکتکننده؛ شواهد با کیفیت متوسط) را کاهش دهد. هر چند، هیچ تاثیر مهمی بر بروز بیماری تنفسی یا بستری در بیمارستان به دلیل اسهال یا پنومونی دیده نشد. خطر بروز استفراغ طی 48 ساعت نخست از زمان مصرف VAS افزایش یافت (RR: 1.97؛ 95% CI؛ 1.44 تا 2.69؛ 4 مطالعه؛ 10,541 شرکتکننده؛ شواهد با کیفیت متوسط).
نتیجهگیریهای نویسندگان
مصرف مکمل ویتامین A با کاهش معنادار از نظر بالینی در مورتالیتی و موربیدیتی در کودکان همراه است. بنابراین، توصیه به حفظ سیاست تجویز جهانی مکمل برای کودکان زیر پنج سال در جمعیتهای در معرض خطر VAD میشود. انجام کارآزماییهای کنترل شده با دارونمای (placebo) بیشتری از VAS در کودکان بین شش ماه و پنج سال، نتیجهگیریهای این مطالعه مروری را تغییر نخواهند داد، اگرچه به مطالعاتی که دوزهای مختلف و روشهای مختلف تجویز مکمل را بررسی کنند، نیاز است. در جمعیتهایی که کمبود ویتامین A در آنها اثبات شده، انجام کارآزماییهای کنترل شده با دارونما غیر‐اخلاقی خواهد بود.
PICO
خلاصه به زبان ساده
نقش مصرف مکمل ویتامین A برای پیشگیری از بروز بیماری و مرگومیر در کودکان سنین شش ماه تا پنج سال
پیشینه
کمبود ویتامین A؛ (vitamin A deficiency; VAD) یک مشکل عمده سلامت عمومی در کشورهایی با سطح درآمد پائین و متوسط است، که 190 میلیون کودک را در سنین کمتر از پنج سال درگیر میکند. VAD کودکان را مستعد افزایش خطر ابتلا به طیفی از بیماریها میکند، مثل بیماریهای تنفسی، اسهال، سرخک، و مشکلات چشمی، که میتوانند باعث مرگ کودک شوند. مطالعات گذشته نشان میدهند که تجویز ویتامین A صناعی برای کودکان در سنین شش ماه تا پنج سال که در معرض خطر ابتلا به VAD قرار دارند، میتواند خطر مرگومیر و برخی از بیماریها را کاهش دهد.
سوال مطالعه مروری
هدف این مطالعه مروری ارزیابی تاثیر مصرف مکمل ویتامین A؛ (vitamin A supplementation; VAS) صناعی در مقایسه با دارونما (placebo) (قرصهای ساختگی) یا عدم‐مداخله در پیشگیری از بروز بیماری و مرگومیر در کودکان سنین شش ماه تا پنج سال بود.
روشهای انجام
بانکهای اطلاعاتی مختلفی را جستوجو کردیم که شامل نتایج منتشر شده و منتشر نشده از مطالعات پزشکی بودند. فقط کارآزماییهای تصادفیسازی و کنترل شده (RCT: مطالعهای که در آن شرکتکنندگان به صورت تصادفی به یک یا چند گروه درمانی اختصاص مییابند) را وارد کردیم؛ این موارد بهترین نوع مطالعات تجربی در منابع پژوهشی هستند. برای به دست آوردن تخمینهای کلی از اثربخشی VAS بر بیماری و مرگومیر، نتایج را از نظر ریاضی با هم ترکیب کردیم. جستوجوی منابع تا تاریخ مارچ 2016 بهروز است.
ویژگیهای مطالعه
این مرور شامل 47 RCT با مجموع 1,223,856 کودک است. مطالعات در 19 کشور انجام شدند: 30 مطالعه (63%) در آسیا (16 مطالعه در هند)؛ 8 مطالعه (17%) در آفریقا؛ 7 مطالعه (15%) در آمریکای لاتین، و 2 مطالعه (4%) در استرالیا. متوسط سن کودکان حدود 33 ماه بود. در اکثر مطالعات تعداد دختران و پسران برابر و طول دوره مطالعه حدود یک سال بود. کیفیت مطالعات وارد شده متغیر بود؛ با این حال، بعید بود که نرخ مرگومیر تحت تاثیر خطاهای بالقوه در انجام مطالعات قرار نگرفته باشد.
نتایج کلیدی
از 19 مطالعه وارد شده، دادههایی در مورد تاثیر تجویز VAS در پیشگیری از بروز مرگومیر به دست آمدند، و نتایج ترکیب شده نشان میدهند که تجویز ویتامین A خطر کلی مرگومیر و مرگومیر در اثر اسهال را تا 12% کاهش میدهد. ویتامین A بهطور اختصاصی مرگومیر ناشی از سرخک، عفونتهای تنفسی، یا مننژیت را کاهش نمیدهد، اما میتواند رخدادهای جدید اسهال و سرخک را کم کند. تجویز ویتامین A صناعی برای کودکان در معرض خطر ابتلا به VAD، خطر شبکوری را کاهش میدهد. همچنین سطوح ویتامین A را در خون آنها بیشتر میکند. تنها عارضه جانبی گزارش شده، خطر استفراغ طی 48 ساعت اول تجویز ویتامین A با دوزهای زیاد (بر اساس توصیه سازمان جهانی بهداشت) بود.
کیفیت شواهد
کیفیت کلی شواهد را با استفاده از رویکرد GRADE رتبهبندی کردیم، که نواقص روششناسی را درون مطالعات، ثبات گزارشدهی نتایج را در طول مطالعات، میزان بهکارگیری نتایج را در دیگر موقعیتها، و اثربخشی درمانها را در نظر میگیرد. بر اساس این معیارها، کیفیت کلی شواهد را برای منفعت VAS در مقابل خطر کلی مرگومیر و مرگومیر ناشی از اسهال، در سطح بالا در نظر گرفتیم. برای پیامدهای دیگر، سطح کیفیت شواهد پائین تا متوسط بود. یک مطالعه بزرگ که به تازگی انجام شده، و شامل حدود 1 میلیون کودک است، هیچ تاثیری را از VAS نشان نداد؛ با این حال، وقتی این مطالعه با دیگر مطالعات (مطالعاتی که به خوبی انجام شدهبودند) ترکیب شد، VAS همچنان منفعتی را برای پیشگیری از بروز مرگومیر و بیماری نشان داد. بهطور خلاصه، VAS میتواند خطر بروز بیماری و مرگومیر را در کودکان سنین 6 تا 59 ماه که در معرض خطر ابتلا به VAD قرار دارند، کاهش دهد.
Authors' conclusions
Summary of findings
| Vitamin A supplementation for preventing morbidity and mortality in children from 6 months to 5 years of age | ||||||
| Patient or population: children aged between 6 months and 5 years Intervention: vitamin A supplementation Comparison: placebo or usual care | ||||||
| Outcomes | Illustrative comparative risks* (95% CI) | Relative effect | Number of participants | Quality of the evidence | Comments | |
| Assumed risk | Corresponding risk | |||||
| Control | Vitamin A | |||||
| All‐cause mortality Follow‐up: 12‐96 weeks | Study population | RR 0.88 (0.83 to 0.93) | 1,202,382 (19 studies) | ++++ | Random‐effects RR 0.76 (95% CI 0.66 to 0.88) | |
| 26 per 1000a | 23 per 1000 (22 to 24) | |||||
| Mortality due to diarrhoea Follow‐up: 48‐104 weeks | Study population | RR 0.88, (0.79 to 0.98) | 1,098,538 | ++++ | Total number of participants reflects number randomised to studies. The analysis combined cumulative risk and risk per 1000 years follow‐up | |
| 8 per 1000a | 7 per 1000 (6 to 8) | |||||
| Mortality due to measles Follow‐up: 52 to 104 weeks | Study population | RR 0.88, (0.69 to 1.11) | 1,088,261 | ++OO Lowc,d | Total number of participants reflects number randomised to studies. The analysis combined cumulative risk and risk per 1000 years follow‐up | |
| 2 per 10,000a | 2 per 1000 (1 to 2) | |||||
| Mortality due to LRTI Follow‐up: 48‐104 weeks | Study population | RR 0.98, (0.86 to 1.12) | 1,098,538 | ++OO | Total number of participants reflects number randomised to studies. The analysis combined cumulative risk and risk per 1000 years follow‐up | |
| 4 per 10,000a | 4 per 1000 (3 to 5) | |||||
| Diarrhoea incidence Mean episodes per child per year | Study population | Rate ratio 0.85, 95% CI 0.82 to 0.87 | 77,946 | ++OO | — | |
| Mean episodes of diarrhoea in control group: 4.0 per child per yeare | VAS led to 3 fewer episodes of diarrhoea per child per year (3 to 4 fewer episodes) | |||||
| Measles incidence Mean episodes of measles per child per year | Study population | Rate ratio 0.50, 95% CI 0.37 to 0.67 | 19,566 | ++O Moderatec | — | |
| Mean episodes of measles in control group: 0.2 per child per yeare | VAS led to 0.015 fewer episodes per child per year (0.019 events fewer per child to 0.01 events fewer per child) | |||||
| LRTI incidence Mean episodes per child per year | Study population | Rate ratio 0.99, 95% CI 0.92 to 1.06 | 27, 540 | ++OO Lowc,d | — | |
| Mean episodes of LRTI in control group: 0.1 episodes per child per yeare | VAS led to 0.1 more episodes of LRTI per child per year (0.1 fewer episodes to 0.1 more episodes) | |||||
| Bitot's spots incidence Follow‐up: mean 80.72 weeks | Study population | RR 0.42, 95% CI 0.33 to 0.53 | 1,063,278 | +++O Moderatec | — | |
| 35 per 1000a | 15 per 1000 (12 to 19) | |||||
| Night blindness incidence Follow‐up: 52 to 68 weeks | Study population | RR 0.32, 95% CI 0.21 to 0.50 | 22,972 (2 studies) | +++O Moderatec | — | |
| 4 per 1000g | 1 per 1000 (1 to 2) | |||||
| Vitamin A deficiency Follow‐up: mean 54.5 weeks | Study population | RR 0.71, 95% CI 0.65 to 0.78 | 2262 | +++O | — | |
| 509 per 1000g | 361 per 1000 (331 to 397) | |||||
| Vomiting Follow‐up: 0.14 to 52 weeks | Study population | RR 1.97, 95% CI 1.44 to 2.69 | 10541 | +++O | — | |
| 31 per 1000g | 61 per 1000 (45 to 83) | |||||
| *The basis for the assumed risk (for example, the median control group risk across studies) is provided in footnotes. The corresponding risk (and its 95% CI) is based on the assumed risk in the comparison group and the relative effect of the intervention (and its 95% CI). | ||||||
| GRADE Working Group grades of evidence | ||||||
| aBased on control group mortality risk in DEVTA trial 2013. | ||||||
Background
Description of the condition
Vitamin A is required for normal functioning of the visual system, maintenance of cell function for growth, epithelial integrity, red blood cell production, immunity, and reproduction (Sommer 1996). Vitamin A deficiency (VAD) impairs body functions and may cause death. Adverse health consequences may also include xerophthalmia (dry eyes), susceptibility to infection, stunting, and anaemia (Sommer 1996; Rice 2004). Chronic VAD may develop when animal sources and fortified foods are limited, for example in diets that rely heavily on vegetables and fruits (Ramakrishnan 2002). In poor societies, especially in low‐income countries, dietary deficiency can begin very early in life, when colostrum is discarded or when breastfeeding is inadequate (Haskell 1999).
VAD is interconnected with a deprived ecological, social, and economic environment. People with VAD may be exposed to measles, diarrhoea, and respiratory diseases (Sommer 2002; Rice 2004). When these problems are comorbid, depressed appetite and poor absorption may lower intake of vitamin A, while excessive metabolism and excretion may deplete body stores (Alvarez 1995; Mitra 1998). This combination of poor diet and infection leads to a vicious cycle that particularly affects young children and pregnant or lactating mothers (Sommer 2002; West 2003).
VAD is common in low‐ and middle‐income countries. About 19.1 million pregnant women and 190 million children under five years of age are vitamin A deficient (i.e. serum retinol less than 0.70 µmol/L), representing about 33% of children under five years of age in populations at risk of VAD (WHO 2009). Based on biochemical VAD in young children, 122 countries have a moderate to severe public health problem (WHO 2009).
Recent data on global trends in VAD suggest that it remains widely prevalent in South Asia and Sub‐Saharan Africa (Stevens 2015), while rates have significantly fallen in Southeast Asia and Latin America (Stevens 2015). Deaths attributable to VAD have almost disappeared in many regions of the world, suggesting the need to revisit supplementation strategies according to population needs (Stevens 2015).
Description of the intervention
Vitamin A is a term used for a subclass of retinoic acids, a family of lipid‐soluble compounds (Bates 1995). Vitamin A is found in two main forms: provitamin A carotenoids and preformed vitamin A. Provitamin A carotenoids are found in plants; beta‐carotene is the only one that is metabolised by mammals into vitamin A. Though fruits and vegetables are nutritious in other ways, normal dietary intake of plants may not deliver adequate amounts of vitamin A because the intestinal carotenoid‐to‐retinol conversion ratio varies with type of food, ranging from 6:1 to 26:1 (US Institute of Medicine, Food and Nutrition Board; Van Lieshout 2005). Consequently, VAD can exist in places with high vegetable and fruit consumption (West 2002). Preformed vitamin A (retinol, retinal, retinoic acid, and retinyl esters), is the most active form of vitamin A and is found in animal sources. Supplements usually use preformed vitamin A (Shenai 1993; Bates 1995).
How the intervention might work
Vitamin A is an essential nutrient; it cannot be synthesised by the human body and must therefore come from dietary sources (Bates 1995). Oral vitamin A supplementation (VAS) and food fortification are the most direct methods for providing vitamin A to people whose diets are deficient.
Vitamin A has been described as an anti‐infectious vitamin because of its role in regulating human immune function (Green 1928). Early studies in animals and humans revealed an association between VAD and increased susceptibility to infections (Semba 1999). In addition to its preventive and therapeutic effect against xerophthalmia (Sommer 1996), prophylactic VAS in apparently healthy children (over six months of age) residing in developing countries may reduce childhood mortality by as much as 30% (Beaton 1993; Fawzi 1993; Glasziou 1993), particularly by reducing diarrhoea and measles mortality.
Side effects of VAS are rare in children aged six months or older; however, vitamin A toxicity can develop if large amounts of vitamin A are used over a prolonged period of time. Symptoms of toxicity include liver damage, headaches, vomiting, skin desquamation, bone abnormalities, joint pain, and alopecia (Smith 1976). A very high single dose can also cause transient acute toxic symptoms that may include a bulging fontanelle in children under one year, headaches, vomiting, diarrhoea, loss of appetite, and irritability. Toxicity from ingestion of food sources with preformed vitamin A is rare (Hathcock 1997).
Why it is important to do this review
This update considers new evidence that has become available since the publication of the original review (Imdad 2010a). Given the changes in global epidemiology and mortality related to VAD (Stevens 2015), this update with newer studies is necessary to evaluate the need for continued VAS programmes. A separate Cochrane Review has evaluated the therapeutic role of vitamin A for measles (Yang 2005), while another has focused on non‐measles pneumonia (Ni 2005). Different Cochrane Reviews in a variety of subpopulations of children and mothers are also evaluating the prophylactic role of vitamin A (Van den Broek 2002; Chen 2008; Bello 2009; Darlow 2011; Gogia 2011; Wiysonge 2011; Imdad 2016; Haider 2017).
Objectives
To assess the effects of vitamin A supplementation (VAS) for preventing morbidity and mortality in children aged six months to five years.
Methods
Criteria for considering studies for this review
Types of studies
We included randomised controlled trials (RCTs) and cluster‐RCTs evaluating the effect of synthetic VAS in children aged six months to five years. We included data from the first period of cross‐over studies only. We considered studies for inclusion irrespective of publication status or language of publication.
We excluded quasi‐RCTs with the exception of Herrera 1992 and Stansfield 1993; we made this decision post hoc (Differences between protocol and review). Given the design of the interventions and the placebos as well as steps to blind those administering the sequence, we do not think these studies are meaningfully different from RCTs. Herrera 1992 assigned participants alternately by household, while Stansfield 1993 used a random starting point and alternating distribution of red or green pills. Lack of a truly random sequence was not related to other sources of bias (for example, performance bias) because individuals delivering the capsules had no ongoing contact with participants, and the manufacturer (Roche) held the code until the study was completed. Though post hoc, we made the decision to include these studies before extracting data or conducting analyses; we conducted a sensitivity analysis to determine if the decision had any impact on the results, which it did not (see 'Sensitivity analysis' subheading, under 'Primary outcome: all‐cause mortality' in Effects of interventions section).
Types of participants
Children living in the community and aged six months to five years at the time of recruitment were eligible for inclusion. We excluded children in hospital and children with disease or infection.
We contacted trial authors to determine if the study population included some participants who were not eligible for this review (for example, children over five years of age) and requested disaggregated data. If such data were not available, we included studies if the majority of participants (51% or more) met the inclusion criteria. If this could not be determined and the participants met the inclusion criteria on average (for example, the mean age was within the eligible range), then we included these trials.
Types of interventions
Synthetic oral VAS compared to either placebo or treatment‐as‐usual control groups, including trials of various doses and frequencies. Co‐interventions (for example, multiple vitamin or mineral supplementation), must have been identical in both groups. We excluded studies evaluating the effects of food fortification, consumption of foods rich in vitamin A, and beta‐carotene supplementation.
If a trial included more than one eligible intervention group (for example, different doses), we combined the groups for the main analysis, although we treated the groups separately for subgroup analyses where appropriate. If a trial included multiple control groups (for example, both placebo and treatment as usual), we selected the control group that most closely replicated the non‐specific treatment of the intervention group (that is, placebo).
Types of outcome measures
We extracted data on the outcomes listed below. In studies reporting more than one measure of an outcome, we combined measures for meta‐analysis using the methods described in Data synthesis.
Primary outcomes
-
All‐cause mortality.
Secondary outcomes
-
Cause‐specific mortality due to:
-
diarrhoea;
-
measles;
-
meningitis; and
-
lower respiratory tract infection (LRTI).
-
-
Cause‐specific morbidity (i.e. incidence and prevalence) due to:
-
diarrhoea;
-
measles;
-
malaria;
-
meningitis;
-
LRTI;
-
Bitot's spots;
-
night blindness;
-
xerophthalmia; and
-
hospitalisation.
-
-
Side effects (for example, vomiting or diarrhoea following supplementation).
-
Vitamin A deficiency (VAD) status (based on serum retinol level).
We combined pneumonia and LRTI outcomes post hoc. Pneumonia is a type of LRTI, and most of the studies did not test for pneumonia specifically (using specific clinical criteria). In the event a study reported both pneumonia and LRTI outcomes, we extracted the LRTI outcome data to combine with other studies.
Search methods for identification of studies
Electronic searches
For this update, we searched the databases and trials registers listed below on 1 March 2016, using the search strategies in Appendix 1. Further details about the searches are in Appendix 2. See Appendix 3 for the previous search strategies.
-
Cochrane Central Register of Controlled Trials (CENTRAL; 2016, Issue 2) in the Cochrane Library, which includes the Cochrane Developmental, Psychosoical and Learning Problems Specialised Register (searched 1 March 2016).
-
MEDLINE Ovid (1946 to February Week 3 2016).
-
Medline In‐Process & Other Non‐Indexed Citations Ovid (29 February 2016).
-
Embase Ovid (1980 to 2016 Week 9).
-
Science Citation Index Web of Science (SCI; 1970 to 27 February 2016).
-
Conference Proceedings Citation Index ‐ Science Web of Science (CPCI‐S; 1990 to 27 February 2016).
-
Cochrane Database of Systematic Reviews (CDSR; 2016, Issue 2) in the Cochrane Library.
-
Database of Abstracts of Reviews of Effects (DARE; 2015 Issue 2) in the Cochrane Library.
-
LILACS (Latin American and Caribbean Health Science Information database; bases.bireme.br/cgi‐bin/wxislind.exe/iah/online; searched 1 March 2016).
-
African Index Medicus (indexmedicus.afro.who.int/cgi‐bin/wxis.exe/iah/?IsisScript=iah/iah.xis⟨=I&base=AIM; searched 1 March 2016).
-
ClinicalTrials.gov (clinicaltrials.gov; searched 1 March 2016).
-
World Health Organization International Clinical Trials Registry Platform (WHO ICTRP; apps.who.int/trialsearch; searched 1 March 2016).
We applied no language limits.
Searching other resources
We checked the reference lists of reviews and included and excluded studies in order to identify additional citations. We also contacted organisations and researchers.
Data collection and analysis
Selection of studies
For this update, two people (Aamer Imdad and Zunirah Ahmed) independently screened titles and abstracts for inclusion in the review. We resolved differences of opinion about suitability for inclusion by discussion and through consultation with a third review author (Evan Mayo Wilson). We recorded our decisions in a PRISMA diagram (Moher 2009).
Data extraction and management
For this update, two people (Aamer Imdad and Jai Das or Renee Sharma) used a data extraction sheet to independently extract the data below from each eligible study. Review authors resolved discrepancies through discussion.
-
General:
-
year of study;
-
location (country, urban/rural);
-
method of recruitment;
-
inclusion criteria;
-
unit of analysis; and
-
risk of bias (see Assessment of risk of bias in included studies).
-
-
Participants:
-
sociodemographic characteristics (age, sex); and
-
comorbidities.
-
-
For each intervention and comparison group of interest:
-
dosage;
-
duration;
-
frequency; and
-
co‐intervention (if any).
-
-
For each outcome of interest:
-
time points collected and reported;
-
definition;
-
validity;
-
unit of measurement (if relevant); and
-
loss to follow‐up.
-
The main analyses included the longest reported follow‐up in each study. We grouped outcomes according to follow‐up period (0 to 12 months; 13 to 60 months, and greater than 60 months since randomisation); when trials reported multiple time points for a period, we extracted the longest outcome interval in a given period.
Assessment of risk of bias in included studies
Two people (Aamer Imdad and Jai Das or Renee Sharma) independently assessed the risk of bias within each included study using Cochrane's 'Risk of bias' tool (Higgins 2011a). For all studies, we assessed the following: sequence generation; allocation concealment; blinding of participants and providers; blinding of outcome assessors; incomplete outcome data; selective outcome reporting; and other sources of bias. We specifically looked for the possibility of performance bias (differential treatment of the intervention and control groups) and detection bias (for example, differential effort to locate death records for the intervention and control groups). Findings are discussed in the Risk of bias in included studies section and included in the 'Risk of bias' tables (beneath the Characteristics of included studies tables).
Measures of treatment effect
We measured morbidity in different ways, and we combined all available data whenever possible. For example, for diarrhoea, we included all types of diarrhoea (mild, moderate, and severe). In the case of pneumonia, we included lower (but not upper) respiratory tract infection.
To avoid reviewer bias, we predetermined the order of preference for extracting outcomes when data were available in several formats. For studies that randomised individuals, we gave preference to data that required the least manipulation by authors or inference by reviewers. We extracted raw values (for example, means and standard deviations) rather than calculated effect sizes (for example, Cohen's d). For mortality data, we gave preference to denominators in the following order: number with definite outcome known (or imputed as described below), number randomised, and child‐years. For other dichotomous outcomes to which both survivors and non‐survivors may have contributed data (for example, incidence of measles), we gave preference to child years, number with definite outcome known, and number randomised.
In the case of cluster‐RCTs, we used either adjusted estimates reported by the trial authors or raw data, and we inflated the standard error (SE) using the procedures described below in the Unit of analysis issues section.
Unit of analysis issues
Cluster‐randomised trials
In studies randomising units other than the individual (i.e. clusters), trials should present results with controls for clustering (for example, robust SEs or hierarchical linear models). We analysed clustered data using the procedures outlined in Higgins 2011b.
Where results did not control for clustering, we contacted trial authors to request an estimate of the intracluster correlation coefficient (ICC). If the trial authors were unable to provide an ICC, we calculated the ICC using design effects calculated previously (Beaton 1993), and we estimated the ICC for studies that did not publish a value (see section on 'Unit of randomisation' under Included studies). For estimated values, we conducted sensitivity analyses using larger and smaller design effects to determine if the results were robust (see Sensitivity analysis).
Multiple‐arm trials
For multiple‐arm trials, we grouped data so that the only difference between the groups was VAS. For example, if a trial had four arms (vitamin A plus zinc, zinc alone, vitamin A alone, and placebo), we included it as two comparisons: vitamin A plus zinc versus zinc alone and vitamin A alone versus placebo. In multiple‐arm trials using two different doses of vitamin A, we combined the two groups to avoid double‐counting the participants in the control group.
Dealing with missing data
Differential dropout can lead to biased estimates of effect size, and bias may arise if reasons for dropout differ across groups.
We described missing data, including dropouts and reasons for dropout, when given. If data were missing for some cases, or if reasons for dropout were not reported, we contacted the trial authors. When analyses considered completers and controlled for dropout (for example, imputed using regression methods), we extracted the latter.
Assessment of heterogeneity
We assessed included studies for clinical heterogeneity by comparing the distribution of important factors such as study participants, study setting, dose, and duration of intervention and co‐interventions. We assessed methodological heterogeneity by comparing data included in the 'Risk of bias' tables (beneath the Characteristics of included studies tables). We assessed statistical heterogeneity by visual inspection of forest plots, the Chi2 test (and P value), and the I2 statistic. If the P value was less than 0.10 and the I2 exceeded 50%, we considered heterogeneity to be substantial. We also reported Tau2 – an estimate of between‐study variance.
Assessment of reporting biases
To assess the possibility of small study bias, we drew funnel plots for outcomes with 10 or more studies and compared random‐effects estimates to the fixed‐effect estimate (see Sensitivity analysis).
Data synthesis
We performed meta‐analysis using Review Manager 5 (RevMan) software (RevMan 2014). When data were in several formats that we could not combine directly in RevMan, we used the generic inverse variance (GIV) option. This was meant to handle the scenario when only summary estimates (like the risk ratio, or RR) were available and no numbers for nominators and denominators were available to calculate the summary estimate. In this case, it would not be possible to pool that study with other studies using conventional methods. Hence, we used GIV, which does not require input of data in the form of nominators and denominators of intervention and control group, but the log of effect size (e.g. RR) and standard error (SE). For this update, we entered data into the built‐in calculator in RevMan to calculate the log of RR and their SE.
We reported all outcomes with 95% confidence intervals (CIs) and weighted overall effects by the inverse of variance using a fixed‐effect model. Although there might be some differences across trials (for example, dose, and population), the biological mechanism should be similar. We explored differences through analyses described elsewhere (Mayo‐Wilson 2011).
For dichotomous outcomes, we calculated the overall RR. For incidence data, we combined RRs (events per child) and rate ratios (events per child‐year) because these ratios use the same scale and can be interpreted in the same way for these studies (the duration of studies was relatively short, i.e. median duration was one year or less).
In some cases, we estimated time at risk, as when trial authors reported incidence rate, duration of study, and number of children in each group.
We decided post hoc that we would pool incidence and prevalence data for morbidity separately. The primary difference between incidence and prevalence data is time at risk. Incidence data covers the time (prospectively) while prevalence data is a snapshot of a condition at one point in time. Therefore, we thought that combining incidence and prevalence data was not appropriate and so decided not to pool together these two types of data.
For continuous outcomes we calculated Hedges g.
Subgroup analysis and investigation of heterogeneity
Effectiveness of the intervention may differ across members of populations (for example, due to differences in baseline vitamin A status) and may be affected by other interventions (for example, immunisation or deficiency of other micronutrients). For example, neonatal VAS is thought to have different effects in Asia versus Africa (Klemm 2009). Unlike trial‐level factors (such as dose), associations between individual‐level moderators (such as VAS) and outcomes should be analysed using individual patient data from RCTs and observational studies. With two exceptions, we did not include subgroup analyses based on individual‐level moderators in this review, as such analyses are at high risk of ecological fallacy (for example, lack of variation between studies would not indicate there was no variation within them). We included subgroups of age and sex; trials commonly report separate effects for these groups. We performed subgroup analyses when disaggregated data were available for groups within studies or between studies.
The following subgroup analyses were prespecified, and differences were tested using the Chi2 test in RevMan 2014.
-
Dose: standard (up to 100,000 IU for children aged 6 to 11 months, and 200,000 IU for children aged 12 months to five years) versus high (greater than standard).
-
Frequency: high (doses more than once in six months) versus low (one dose every six months or six‐plus‐month interval).
-
Location: continent.
-
Age: six to 12 months versus one to five years.
-
Sex: boys versus girls.
Sensitivity analysis
We performed the following sensitivity analyses.
-
To test for bias, we repeated the primary analysis without studies at high risk of bias for sequence generation.
-
To test for small study bias, we repeated the analysis using a random‐effects model (as the assumption for this model is that effect is not identical across studies, and included studies are considered a 'random' sample of all the possible studies on the topic) and drew funnel plots for all outcomes with 10 or more studies.
-
To test the robustness of results when using imputed ICCs, we conducted sensitivity analyses using larger and smaller design effects (post hoc sensitivity analysis described under the 'Unit of randomisation' subheading in the Included studies section below).
Summary of findings table
In collaboration with the Cochrane Editorial Unit, two review authors (Aamer Imdad and Evan Mayo‐Wilson) assessed the overall quality of the evidence using the GRADE approach (Guyatt 2011). The GRADE assessment was based on five criteria: limitations in the design and implementation of available studies, imprecision of results, inconsistency of results, indirectness of study results, and publication bias.
We assessed the quality of the evidence as 'high', 'moderate', 'low' or 'very low' for each of the following outcomes: all‐cause mortality; mortality due to diarrhoea, measles, and LRTI; incidence of diarrhoea, measles, LRTI, Bitot's spots, and night blindness; vomiting; and VAD status. We presented our quality ratings and results in summary of findings Table for the main comparison; our reasons for the quality rating are available in footnotes of the table.
Results
Description of studies
Results of the search
For this update, electronic searches identified 5236 records; 5228 records remained after duplicates were removed. From these we identified 54 relevant citations and reviewed the full texts. We excluded 25 irrelevant reports and a further 15 reports (10 studies) that met the screening criteria but did not meet the full inclusion criteria. For more information see the Excluded studies section. We included four new studies from 10 reports; nine of these were identified from the updated searches and one was carried forward from the previous review where it was awaiting classification. We also added five new reports to previously included studies (see Included studies). See Figure 1.

Study flow diagram.
Included studies
The previous version of this review included 43 studies from 91 reports (Imdad 2010a). This update includes four new studies (from 10 reports) (Albert 2003; Chen 2013a and Chen 2013b (one study); DEVTA trial 2013; Fisker 2014), one of which was included in the previous review as awaiting classification (DEVTA trial 2013). We also found five new reports of three studies included the previous review (Sommer 1986; Long 2006a; Lima 2014), bringing the total included studies in this review to 47 (106 reports).
Of the included studies, there were three factorial design studies. Factorial design studies typically test more than one intervention in different combinations in a single study. For meta‐analysis, we included each such study as two discrete data sets (with intervention and comparison group differentiated by vitamin A supplementation only) and counted them as one study overall (Chen 2013a and Chen 2013b; Long 2006a and Long 2006b; Reddy 1986a and Reddy 1986b). Futher details are available below under the subheading 'Multiple‐arms trials'. More than one report was available for 19 (40%) trials. Where multiple reports existed for an included trial, we extracted data from all reports following current guidelines (Higgins 2011b). Further information about individual studies is available in the Characteristics of included studies tables.
Forty‐two trials (89%) reported data that could be included in a meta‐analysis; five trials reported either outcomes that were not relevant to the review (Albert 2003; Cherian 2003), data that were not available by group (Lima 2014), or data that were incomplete (Van Agtmaal 1988; Smith 1999).
Sample size
Trials assigned approximately 1,223,856 participants, with sample sizes ranging between 35 participants in Van Agtmaal 1988 to approximately 1 million participants in DEVTA trial 2013. The 42 trials that could be analysed included 1,223,607 participants (99.9% of children included in the review).
The 11 largest studies randomised about 1,200,214 children, 98.06% of participants in the review (Sommer 1986; Rahmathullah 1990; Vijayaraghavan 1990; West 1991; Daulaire 1992; Herrera 1992; Ross 1993 SURVIVAL; Stansfield 1993; Agarwal 1995; Pant 1996; DEVTA trial 2013).
Comparisons
Seven (14%) studies compared VAS to treatment as usual (Sommer 1986; Van Agtmaal 1988; West 1991; Daulaire 1992; Pant 1996; Donnen 1998; DEVTA trial 2013). Forty (85%) studies compared VAS to placebo. One large trial reported not using a placebo because it was forbidden by government (Sommer 1986).
Multiple‐arm trials
Fifteen (31%) trials had multiple arms, nine of which were relevant to this review (Reddy 1986a; Florentino 1990; Benn 1997; Smith 1999; Rahman 2001; Long 2006a; Lin 2009; Chen 2013a; DEVTA trial 2013).
Seven trials used factorial designs, combining vitamin A with other treatments such as zinc (Smith 1999; Rahman 2001; Albert 2003; Long 2006a), deworming (Reddy 1986a; DEVTA trial 2013), or iron (Chen 2013a); we extracted data for comparisons that differed only in the provision of vitamin A (for example, vitamin A versus placebo; and vitamin A plus zinc versus zinc alone). In one trial (Rahman 2001), raw data were not available, and we could not identify outcome data for an eligible comparison. One study combined different doses (Florentino 1990).
Unit of randomisation
Two studies randomised participants by household, and we treated participants as if they were individually randomised (Herrera 1992; Stansfield 1993). We conducted a sensitivity analysis for all‐cause mortality using ICCs of 0 and 0.010 for studies estimating the mean design effect.
We used previously reported design effects from Beaton 1993 to calculate ICCs for clustered studies (Sommer 1986; Rahmathullah 1990; Vijayaraghavan 1990; West 1991; Daulaire 1992; Ross 1993 SURVIVAL). The ICCs were consistently around 0.002. We imputed an ICC value of 0.002 for the single study that did not account for clustering in the original analysis (DEVTA trial 2013).
Allocation ratio
Thirty‐nine (83%) studies evenly allocated participants to the intervention and control groups. In eight (17%) studies, the number assigned to each group was unclear (Reddy 1986a; Ross 1993 HEALTH; Ross 1993 SURVIVAL; Stansfield 1993; Biswas 1994; Dibley 1996; Ramakrishnan 1995; Pant 1996).
Participants
There were 20 studies that categorically excluded participants with clinical signs of VAD (like xerophthalmia, Bitot's spots) while 23 studies did not clearly mention vitamin A. There were four studies that allowed participants who had clinical signs of VAD (Rahmathullah 1990; West 1991; Daulaire 1992; DEVTA trial 2013). Only one trial mentioned biochemical VAD as an inclusion criterion (Albert 2003).
Location/setting
Studies took place in 19 countries: 30 (63%) in Asia, including 16 in India; 8 (17%) in Africa (Herrera 1992; Ross 1993 HEALTH; Ross 1993 SURVIVAL; Stabell 1995; Benn 1997; Donnen 1998; Shankar 1999; Fisker 2014); 7 (15%) in Latin America (Stansfield 1993; Barreto 1994; Sempertegui 1999; Smith 1999; Long 2006a; Long 2007; Lima 2014), and 2 (4%) in Australia (Pinnock 1986; Pinnock 1988). Eighteen (38%) studies were in urban/periurban settings, and 26 (55%) were in rural settings. Three studies did not explicitly describe their urban or rural setting.
Age
Twenty‐one (44%) studies reported average age, which was 33 months across the studies.
Sex
Thirty‐five (74%) studies reported sex. The majority assigned approximately equal numbers of boys and girls. Three studies favoured boys by more than 10% (Semba 1991; Ranjini 2001; Lin 2008). The median percentage of boys in the studies was 51%.
Time
There were 11 studies that continued for five years or more (Vijayaraghavan 1990; West 1991; Herrera 1992; Dibley 1996; Pant 1996; Shankar 1999; Chowdhury 2002; Long 2006a; Long 2007; DEVTA trial 2013; Ross 1993 SURVIVAL); the remainder of the studies lasted about one year or less. In the event that a single study reported data at more than one time point, we used the data from the longest interval in the overall analysis.
Dose
All included studies used large doses of vitamin A in the range of 50,000 IU to 200,000 IU (one IU = 0.3 mcg), depending on the age of participants, except for five studies that used small doses, that is, 3866 IU given three times a week (Pinnock 1988), 8333 IU given once a week (Rahmathullah 1990), 10,000 IU given weekly (Sempertegui 1999; Smith 1999), or 25,000 IU given every two weeks (Chen 2013a and Chen 2013b; considered as one study). Some studies had two different dosing regimens for younger children (50,000 IU or 100,000 IU for ages 6 to 11 months) and older children (100,000 IU or 200,000 IU for ages one year or older).
Frequency
Participants received the large doses (50,000 IU to 200,000 IU) every four to six months, either once or more, depending on the study duration. Studies that used smaller doses gave more frequent doses as described above.
Route
Retinol palmitate was the most commonly used compound to deliver vitamin A, and all studies used the oral route for supplementation.
Excluded studies
Overall, we excluded 18 studies (23 reports) from this review. We excluded 8 studies from a previous version of this review (Imdad 2010a), plus 10 others for this update. We list all excluded studies in the Characteristics of excluded studies tables with reasons for exclusion. Six studies had ineligible populations (Bloem 1990; Bahl 1997; Semba 2005; Fahmida 2007; Edmond 2012; Al‐Mekhlafi 2014), five had ineligible controls (Chhagan 2010; Yakymenko 2011; Chen 2012; Kartasurya 2012; Owusu‐Agyei 2013), three had ineligible interventions (Semba 1990; Yang 2002; Ganon 2014), and four were not RCTs (Kothari 1991; Bhaskaram 1997; Wu 2007; Nankabirwa 2011).
Ineligible populations: Among the six studies that had ineligible populations, three studies included children that were either above (Al‐Mekhlafi 2014; Bloem 1990) or below (Fahmida 2007) the age range for this review; one study included children with diarrhea (Bahl 1997); one study included children with HIV (Semba 2005); and in one study the vitamin A was given to mothers only (Edmond 2012).
Ineligible controls: In the five studies that had ineligible controls (Chhagan 2010; Yakymenko 2011; Chen 2012; Kartasurya 2012; Owusu‐Agyei 2013), the control group also received vitamin A so it was not possible to determine the independent effect of vitamin A supplementation.
Ineligible interventions: In the three studies that had ineligible interventions, one study supplemented vitamin A fortified with maize (Ganon 2014); one study supplemented vitamin A in combination with other micronutrients in a way that it was not possible to determine the independent effect of vitamin A supplementation (Yang 2002); and one study included children with bitot's spots and vitamin A was given as therapeutic intervention and not as a preventive intervention (Semba 1990).
Studies awaiting assessment
We could not assess one trial reported in a conference abstract (Aklamati 2006). It appeared to meet the inclusion criteria but reported unclear results. For example, the study included 36 children and reported an outcome of 1.2% of 17; though one child out of 17 is nearly 6%. To the best of our knowledge, the complete results have not been published as yet. See Characteristics of studies awaiting classification table for more information.
Risk of bias in included studies
For each study, we assessed seven domains of methodological bias listed in the Assessment of risk of bias in included studies section and rated them as being at high, low or unclear risk. We described our results below. Please also see Figure 2.
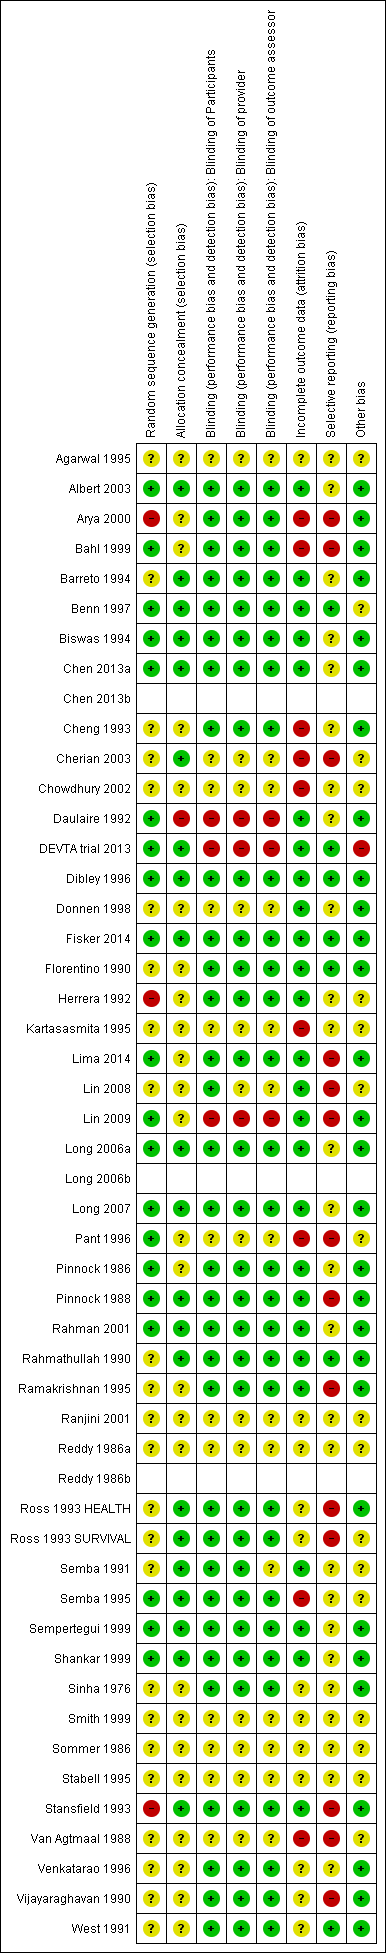
Risk of bias summary: review authors' judgements about each risk of bias item for each included study.
Allocation
Sequence generation
All included studies were RCTs or quasi‐RCTs. Twenty (42%) studies specified the method of randomisation and were rated at low risk of bias for sequence generation. Twenty‐four studies were at unclear risk. Three (6%) studies, including 42,660 participants (3% of those included in the review), were at high risk of bias in this domain (Herrera 1992; Stansfield 1993; Arya 2000). One of these studies described assignment as random (Arya 2000), but participants may have been assigned in order of arrival at hospital, which would not qualify as truly random.
Allocation concealment
We judged one study to be at high risk of bias for allocation concealment (Daulaire 1992), as authors reported in correspondence that they had made no effort to conceal the allocation. We rated 25 studies (53%) at unclear risk of bias and 21 studies at low risk of bias.
Blinding
Blinding of participants
Thirty‐two (68%) studies described efforts to blind participants, and we considered them to be at low risk of bias for blinding of participants. We judged 3 studies to be at high risk of bias (Daulaire 1992; Lin 2009; DEVTA trial 2013), and we deemed 12 (25%) studies to be at unclear risk of bias (Reddy 1986a; Sommer 1986; Van Agtmaal 1988; Agarwal 1995; Kartasasmita 1995; Stabell 1995; Pant 1996; Donnen 1998; Smith 1999; Ranjini 2001; Chowdhury 2002; Cherian 2003).
Blinding of providers
In some trials, staff delivering the intervention also conducted assessments. We considered 3 studies to be at high risk of bias (Daulaire 1992; Lin 2009; DEVTA trial 2013), while the risk was unclear in 13 (27%) studies (Reddy 1986a; Sommer 1986; Van Agtmaal 1988; Agarwal 1995; Kartasasmita 1995; Stabell 1995; Pant 1996; Donnen 1998; Smith 1999; Ranjini 2001; Chowdhury 2002; Cherian 2003; Lin 2008). We considered 31 (65%) studies to be at low risk of bias for blinding of providers.
Blinding of outcome assessors
We assessed three (6%) studies to be at high risk of bias for blinding of outcome assessors (Daulaire 1992; Lin 2009; DEVTA trial 2013), and the risk was unclear in 14 (30%) studies (Reddy 1986a; Sommer 1986; Van Agtmaal 1988; Semba 1991; Agarwal 1995; Kartasasmita 1995; Stabell 1995; Pant 1996; Donnen 1998; Smith 1999; Ranjini 2001; Chowdhury 2002; Cherian 2003; Lin 2008). Thirty (63%) studies had low risk of bias.
Incomplete outcome data
For incomplete outcome data, we judged 26 (55%) studies to be at low risk of bias. Of those remaining, we rated nine (19%) studies to be at high risk of bias (Van Agtmaal 1988; Cheng 1993; Kartasasmita 1995; Semba 1995; Pant 1996; Bahl 1999; Arya 2000; Chowdhury 2002; Cherian 2003), while risk was unclear in 12 (25%) studies (Sinha 1976; Reddy 1986a; Sommer 1986; Vijayaraghavan 1990; West 1991; Ross 1993 HEALTH; Ross 1993 SURVIVAL; Agarwal 1995; Stabell 1995; Venkatarao 1996; Smith 1999; Ranjini 2001). The primary reason for a high risk rating was a lack of explanation for attrition in intervention and control group.
Selective reporting
Most of the trials in the review included multiple outcome measures, and positive results are more likely to be included in reports than negative results. Only seven (14%) studies appeared to be free of selective outcome reporting (Florentino 1990; Rahmathullah 1990; West 1991; Dibley 1996; Benn 1997; DEVTA trial 2013; Fisker 2014). We judged 26 (55%) studies to be at unclear risk of bias and 14 (29%) studies to be at high risk of bias (Pinnock 1988; Van Agtmaal 1988; Vijayaraghavan 1990; Ross 1993 HEALTH; Ross 1993 SURVIVAL; Stansfield 1993; Ramakrishnan 1995; Pant 1996; Bahl 1999; Arya 2000; Cherian 2003; Lin 2008; Lin 2009; Lima 2014).
Most of the studies did not cite a published protocol, which is why we assessed a large proportion of studies to be at unclear risk of bias.
Other potential sources of bias
We extracted other potential sources of bias and noted them in the Characteristics of included studies tables, but none were likely to influence the results of the review in a meaningful way.
Effects of interventions
See: Summary of findings for the main comparison
We present the results for each outcome below, summarising the main outcomes in summary of findings Table for the main comparison.
We did not conduct all of our planned subgroup analyses. For the primary outcome, only one study used a non‐standard dose and frequency. Other analyses with more than 10 studies contained significantly fewer participants (for example, the analysis of serum level included less than 7000 participants). Consequently, we did not conduct subgroup analyses for dose and frequency because the analyses were clearly underpowered, and any effects would be attributable to chance. Results of the attempted subgroup analyses are listed in Table 1. We performed sensitivity analyses for all‐cause mortality and incidence due to diarrhoea and vitamin A serum levels only, as most analyses contained a small number of studies.
| Outcome or subgroup | Studies | Heterogeneity | Statistical Method | Effect estimate | Test for subgroup differences (P value) |
| All‐cause mortality, outcomes < 1 year since randomisation | 13 | Chi2 = 34.29, df = 12; P < 0.001; I2 = 65% | Risk ratio (GIV, fixed, 95% CI) | 0.83 (0.75 to 0.92) | NA |
| All‐cause mortality, outcomes 13 months to 59 months since randomisation | 6 | Chi2 = 15.75, df = 5; P < 0.001; I2 = 68% | Risk ratio (GIV, fixed, 95% CI) | 0.88 (0.81 to 0.97) | NA |
| All‐cause mortality at longest follow‐up (subgroup analysis): Asia | 12 | Chi2 = 42.65, df = 10; P < 0.001; I2 = 77% | Risk ratio (GIV, fixed, 95% CI) | 0.90 (0.84 to 0.96) | 0.83 |
| All‐cause mortality at longest follow‐up (subgroup analysis): Africa | 6 | Chi2 = 10.06, df = 5; P = 0.07; I2 = 50% | Risk ratio (GIV, fixed, 95% CI) | 0.86 (0.75 to 0.98) | |
| All‐cause mortality at longest follow‐up (subgroup analysis): Latin America | 1 | NA | Risk ratio (GIV, fixed, 95% CI) | 1.00 (0.14 to 7.08) | |
| All‐cause mortality at longest follow‐up, by national child mortality rate (subgroup analysis): high (> 40/1000) | 17 | Chi2 = 53.07, df = 16 (P < 0.001; I2 = 70% | Risk ratio (GIV, fixed, 95% CI) | 0.89 (0.84 to 0.94) | 0.9 |
| All‐cause mortality at longest follow‐up, by national child mortality rate (subgroup analysis): low (< 40/1000) | 2 | NA | Risk ratio (GIV, fixed, 95% CI) | 1.00 (0.14 to 7.08) | |
| All‐cause mortality at longest follow‐up (sensitivity analysis): random‐effects model | 19 | Tau2 = 0.04; Chi2 = 44.00, df = 17; P = 0.001; I2 = 61% | Risk ratio (GIV, fixed, 95% CI) | 0.76 (0.66 to 0.88) | NA |
| All‐cause mortality at longest follow‐up (sensitivity analysis): without DEVTA trial | 18 | Chi2 = 30.38, df = 16; P = 0.02; I2 = 47% | Risk ratio (GIV, fixed, 95% CI) | 0.77 (0.70 to 0.84) | NA |
| All‐cause mortality at longest follow‐up (sensitivity analysis): ICC = 0.002 (assumes no impact of clustering for studies with unknown ICC) | 19 | Chi2 = 57.02, df = 16; P < 0.001; I2 = 72% | Risk ratio (GIV, fixed, 95% CI) | 0.89 (0.84, 0.94) | NA |
| All‐cause mortality at longest follow‐up (sensitivity analysis): ICC = 0.010 (assumes high impact of clustering for studies with unknown ICC) | 19 | Chi2 = 47.87, df = 16; P < 0.001; I2 = 67% | Risk ratio (GIV, fixed, 95% CI) | 0.89 (0.84 to 0.94) | NA |
| Mortality due to diarrhoea, outcomes < 1 year since randomisation | 6 | Chi2 = 5.23, df = 5; P = 0.39; I2 = 4% | Risk ratio (GIV, fixed, 95% CI) | 0.76 (0.61 to 0.95) | NA |
| Mortality due to measles, outcomes < 1 year since randomisation | 4 | Chi2 = 0.52, df = 3; P = 0.91; I2 = 0% | Risk ratio (GIV, fixed, 95% CI) | 0.85 (0.52 to 1.37) | NA |
| Mortality due to meningitis, outcomes < 1 year since randomisation | 1 | NA | Risk ratio (GIV, fixed, 95% CI) | 5.79 (0.22 to 153.24) | NA |
| Mortality due to LRTI, outcomes < 1 year since randomisation | 6 | Chi2 = 5.66, df = 5; P = 0.34; I2 = 12% | Risk ratio (GIV, fixed, 95% CI) | 0.66 (0.40 to 1.10) | NA |
| Diarrhoea incidence at longest follow‐up (sensitivity analysis): analysis without studies Cheng 1993; Chowdhury 2002 | 13 | Heterogeneity: chi2 = 30.71, df = 12; P = 0.002; I2 = 61% | Risk ratio (GIV, fixed, 95% CI) | 0.96 (0.93 to 1.00) | NA |
| Diarrhoea incidence, outcomes < 1 year since randomisation | 13 | Chi2 = 51.64, df = 11; P < 0.001; I2 = 79% | Risk ratio (GIV, fixed, 95% CI) | 0.93 (0.89 to 0.96) | NA |
| Diarrhoea incidence at longest follow‐up (sensitivity analysis): random‐effects model | 15 | Tau2 = 0.07; Chi2 = 219.04, df = 14; P < 0.001; I2 = 94% | Risk ratio (GIV, random, 95% CI) | 0.84 (0.73, 0.98) | NA |
| Measles incidence, outcomes < 1 year since randomisation | 5 | Chi2 = 0.24, df = 4; P = 0.99; I2 = 0% | Risk ratio (GIV, fixed, 95% CI) | 0.54 (0.36 to 0.80) | NA |
| Malaria incidence, outcomes 1 + years since randomisation (subgroup analysis): age | 1 | NA | Risk ratio (M‐H, fixed, 95% CI) | 0.73 (0.60 to 0.88) | NA |
| LRTI Incidence, outcomes < 1 year since randomisation | 11 | Chi2 = 5.23, df = 8; P = 0.73; I2 = 0% | Risk ratio (GIV, fixed, 95% CI) | 0.96 (0.89 to 1.04) | NA |
| Bitot's spots incidence, outcomes < 1 year since randomisation | 1 | NA | Risk ratio (GIV, fixed, 95% CI) | 0.93 (0.76 to 1.14) | NA |
| Bitot's spots prevalence, outcomes < 1 year since randomisation | 3 | Chi2 = 6.06, df = 2; P = 0.05; I2 = 67% | Risk ratio (GIV, fixed, 95% CI) | 0.43 (0.33 to 0.56) | NA |
| Night blindness prevalence, outcomes < 1 year since randomisation | 1 | NA | Risk ratio (GIV, fixed, 95% CI) | 0.30 (0.17 to 0.52) | NA |
| Xerophthalmia incidence, outcomes < 1 year since randomisation | 2 | NA | Risk ratio (GIV, fixed, 95% CI) | 0.88 (0.72 to 1.07) | NA |
| Vitamin A serum retinol level, outcomes < 1 year since randomisation | 11 | Chi2 = 178.42, df = 10; P < 0.001; I2 = 94% | Standardised mean difference (GIV, fixed, 95% CI) | 0.45 (0.37 to 0.53) | NA |
| Vitamin A serum retinol level at longest follow‐up (sensitivity analysis): random‐effects model | 14 | Tau2 = 0.13; Chi2 = 278.45, df = 14; P < 0.001; I2 = 95% | Standardised mean difference (GIV, random, 95% CI) | 0.50 (0.30 to 0.70) | NA |
CI: confidence interval; GIV: Generic inverse variance; LRTI: lower respiratory tract infection;M‐H: mantel Haenszel method;NA: not applicable.
Primary outcome: all‐cause mortality
Ninteen trials involved 1,202,382 children (98.25% of the children included in the review) in an overall analysis (using data from the last follow‐up for trials measuring outcomes multiple times) (Sommer 1986; Rahmathullah 1990; Vijayaraghavan 1990; West 1991; Daulaire 1992; Herrera 1992; Ross 1993 HEALTH; Ross 1993 SURVIVAL; Barreto 1994; Agarwal 1995; Dibley 1996; Pant 1996; Venkatarao 1996; Benn 1997; Donnen 1998; Chowdhury 2002; Lin 2008; DEVTA trial 2013; Fisker 2014). One trial reported no events (Lin 2008).
Vitamin A was associated with a 12% reduction in all‐cause mortality (RR 0.88, 95% CI 0.83 to 0.93; Analysis 1.1; Figure 3), though there was moderate heterogeneity (Chi2 = 44.00, degrees of freedom (df) = 17; P < 0.001; I2 = 61%). We judged the quality of this evidence to be high (see summary of findings Table for the main comparison).
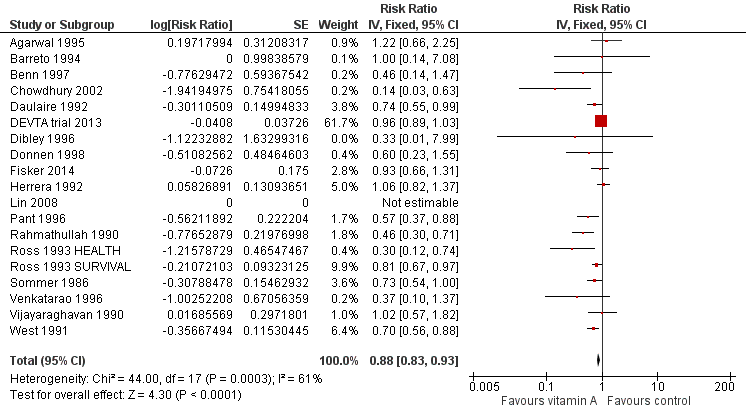
Forest plot of comparison: 1 Vitamin A versus Control, outcome: 1.1 All‐cause mortality at longest follow‐up.
The effect during the first year postrandomisation was similar based on data available from 13 studies (RR 0.83, 95% CI 0.75 to 0.92), and the statistical heterogeneity was similar (Chi2 = 34.29, df = 12; P < 0.001; I2 = 65%). Only six (12%) studies measured mortality between 13 and 59 months, and the effect was similar (RR 0.88, 95% CI 0.81 to 0.97, 6 studies), with moderate and significant statistical heterogeneity (Chi2 = 15.75, df = 5; P = 0.008; I2 = 68%). See Table 1.
Subgroup analyses
Dose and frequency
Only one study reporting all‐cause mortality did not use the standard dose and frequency recommended by WHO: Rahmathullah 1990 used a weekly dose for 52 weeks. We did not conduct the planned subgroup analyses.
Location
Twelve studies took place in Asia (RR 0.90, 95% CI 0.84 to 0.96), six in Africa (RR 0.86, 95% CI 0.75 to 0.98), and one in Latin America (RR 1.00, 95% CI 0.14 to 7.08). These were not significantly different (P = 0.83). See Table 1.
Age
Five studies reported separate effects for children aged 6 to 12 months (RR 0.59, 95% CI 0.43 to 0.82; Analysis 1.2.1) and children aged one to five years (RR 0.68, 95% CI 0.57 to 0.81; Analysis 1.2.2) (Sommer 1986; Rahmathullah 1990; West 1991; Daulaire 1992; Benn 1997); the subgroups did not differ significantly (P = 0.46). Notably, both effect estimates are larger than the overall result from 19 trials reporting mortality.
Sex
Seven studies reported separate effects for boys (RR 0.96, 95% CI 0.89 to 1.04; Analysis 1.3.1) and girls (RR 0.90, 95% CI 0.84 to 0.97; Analysis 1.3.2), which were not significantly different (P = 0.22) (Sommer 1986; West 1991; Daulaire 1992; Herrera 1992; Lin 2008; DEVTA trial 2013; Fisker 2014).
Child mortality
Seventeen studies from countries with high child mortality showed a similar effect as the overall estimate (RR 0.89, 95% CI 0.84 to 0.94), and two studies from countries with low child mortality showed no combined effect for VAS (RR 1.0, 95% CI 0.14 to 7.08). See Table 1.
Sensitivity analyses
Bias
Of the studies at high risk of bias due to sequence generation, only Herrera 1992 contributed to the main mortality analysis and reported no effect (RR 1.06, 95% CI 0.82 to 1.37), indicating that this study was not likely to influence the results in a positive direction.
To test for small study bias, we repeated the analysis using a random‐effects model. The overall estimate was larger than the fixed‐effect estimate (RR 0.76, 95% CI 0.66 to 0.88, 19 studies; heterogeneity: Tau2 = 0.04; Chi2 = 44.00, df = 17; P < 0.001; I2 = 61%); however, CIs overlapped with estimates from the fixed‐effect model. The apparent increase in effect size suggests that heterogeneity might be explained by relatively small studies compared to larger studies, as exclusion of the DEVTA trial 2013 reduced the heterogeneity (from Chi2 = 44.00, df = 17; P < 0.001; I2 = 61% to Chi2 = 30.38, df = 16; P = 0.02; I2 = 47%). See Table 1.
Design effects in cluster trials
Known ICCs were remarkably consistent. For three studies for which the ICC was not known, we estimated ICC = 0.002 and adjusted SEs using this value and the average cluster size. To determine if this decision had any impact on the results, we repeated the primary analysis using a much larger and much smaller ICC estimate. The size of the effect was slightly smaller when these trials were treated as if they had randomised individuals (RR 0.89, 95% CI 0.84 to 0.94, 19 studies). The effect was virtually unchanged when we increased the ICC to 0.010 (RR 0.89, 95% CI 0.84 to 0.94, 19 studies). See Table 1. These results indicate that over‐weighting these three studies in the analysis would not impact the conclusions of this review; further inflating their SEs would increase the size of the effect estimate.
Secondary outcomes
Cause‐specific mortality
Diarrhoea
Nine studies reported a combined 12% reduction in mortality due to diarrhoea (RR 0.88, 95% CI 0.79 to 0.98; 1,098,538 participants; Analysis 1.4; Rahmathullah 1990; Daulaire 1992; Herrera 1992; Ross 1993 SURVIVAL; Agarwal 1995; Venkatarao 1996; Chowdhury 2002; DEVTA trial 2013; Fisker 2014), with no important heterogeneity (Chi2 = 10.15, df = 8; P = 0.25; I2 = 21%). We judged the quality of this evidence to be high (see summary of findings Table for the main comparison). Results for diarrhoea mortality reported within one year of randomisation showed similar results (0.76, 95% CI 0.61 to 0.95; 6 studies; see Table 1).
Measles
Six studies reported a lower risk of mortality due to measles, but the effect was not statistically significant (RR 0.88, 95% CI 0.69 to 1.11; 1,088,261 participants; Analysis 1.5; Rahmathullah 1990; Daulaire 1992; Herrera 1992; Ross 1993 SURVIVAL; Agarwal 1995; DEVTA trial 2013). There was no important heterogeneity (Chi2 = 0.66, df = 5; P = 0.99; I2 = 0%). We judged the quality of this evidence as low (see summary of findings Table for the main comparison). One year postrandomisation results were similar (RR 0.85, 95% CI 0.52 to 1.37; 4 studies; see Table 1).
Meningitis
Three studies reported a lower risk of mortality due to meningitis, but the effect was not statistically significant (RR 0.57, 95% CI 0.17 to 1.88; Analysis 1.6; Ross 1993 SURVIVAL; Agarwal 1995; Chowdhury 2002). There was no important heterogeneity (Chi2 = 0.75, df = 2; P = 0.69; I2 = 0%). Only one study reported data within one year postrandomisation, with results that were not significant (RR 5.79, 95% CI 0.22 to 153.24; see Table 1).
Lower respiratory tract infection
Nine studies did not show any significant difference between the intervention and placebo group (RR 0.98, 95% CI 0.86 to 1.12; 1,098,538 participants; Analysis 1.7; Rahmathullah 1990; Daulaire 1992; Herrera 1992; Ross 1993 SURVIVAL; Agarwal 1995; Venkatarao 1996; Chowdhury 2002; DEVTA trial 2013; Fisker 2014). There was no important heterogeneity (Chi2 = 9.70, df = 8; P = 0.29; I2 = 18%). We judged the quality of this evidence as low (see summary of findings Table for the main comparison). A combined result for one year postrandomisation showed non‐significant results (RR 0.66, 95% CI 0.40 to 1.10; 6 studies; see Table 1).
Cause‐specific morbidity
Diarrhoea
Meta‐analyses
Fifteen studies reported a 15% decrease in diarrhoea incidence (RR 0.85, 95% CI 0.82 to 0.87; 77,946 participants; Analysis 1.8; Figure 4; Florentino 1990; Herrera 1992; Cheng 1993; Barreto 1994; Biswas 1994; Ramakrishnan 1995; Dibley 1996; Venkatarao 1996; Sempertegui 1999; Shankar 1999; Arya 2000; Chowdhury 2002; Long 2007; Chen 2013a and Chen 2013b (counted as one study); Fisker 2014), though statistical heterogeneity was substantial and highly significant (Chi2 = 219.04, df = 14; P < 0.001; I 2= 94%). We judged this evidence to be of low quality (see summary of findings Table for the main comparison).

Forest plot of comparison: 1 Vitamin A versus Control, outcome: 1.8 Diarrhoea incidence at longest follow‐up.
Two studies were responsible for most of the heterogeneity and account for the majority of the overall effect (Cheng 1993; Chowdhury 2002). Exclusion of these studies reduced I2 from 94% to 61%, and the overall effect almost disappeared (RR 0.96, 95% CI 0.93 to 1.00; see Table 1). The observed heterogeneity may be due to measurement error or differences in the effects of VAS across populations and settings. For example, VAS may reduce susceptibility to particular infections that are prevalent in some places but not others.
Thirteen studies that reported data for within one year postrandomisation showed a small effect (RR 0.93, 95% CI 0.89 to 0.96). See Table 1.
Three studies reported no protective effect on diarrhoea prevalence (RR 1.06, 95% CI 1.03 to 1.10; Analysis 1.9; Stansfield 1993; Long 2006a and Long 2006b (counted as one study); DEVTA trial 2013), though statistical heterogeneity was substantial and highly significant (Chi2 = 28.91, df = 3; P < 0.001; I2 = 90%).
Sensitivity analysis
To test for small study bias, we repeated the analysis using a random‐effects model. The overall estimate was identical to the fixed‐effect estimate, though the CI widened compared to the fixed‐effect model, suggesting that heterogeneity is not explained by small studies reporting larger effects (RR 0.84, 95% CI 0.73 to 0.98; 15 studies). See Table 1. The funnel plot we produced was dominated by two studies accounting for 74% of the overall effect (Figure 5), and the plot was relatively flat.
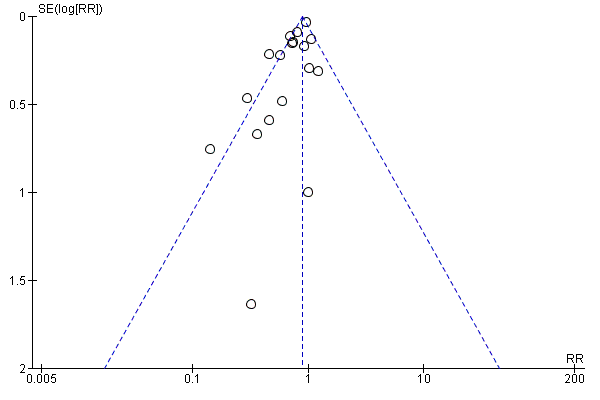
Funnel plot of comparison: 1 Vitamin A versus Control, outcome: 1.1 All‐cause mortality at longest follow‐up.
With regard to the design effects in cluster trials, no ICCs were imputed, so a sensitivity analysis was not required.
Measles
Six studies reported a 50% decrease in measles incidence (RR 0.50, 95% CI 0.37 to 0.67; 19,566 participants; Analysis 1.10; Figure 6; Herrera 1992; Barreto 1994; Semba 1995; Benn 1997; Bahl 1999; Chowdhury 2002), with no important heterogeneity (Chi2 = 0.55, df = 5; P = 0.99; I2 = 0%). We judged this evidence to be of moderate quality (see summary of findings Table for the main comparison).
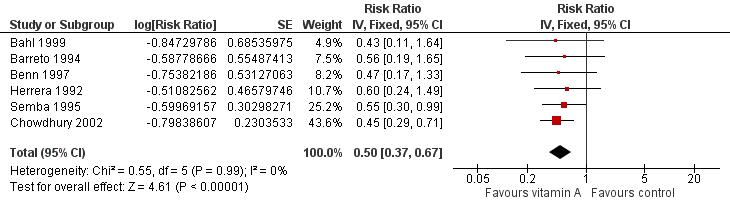
Forest plot of comparison: 1 Vitamin A versus Control, outcome: 1.12 Measles Incidence at Longest Follow‐up.
A combined effect from studies that reported measles incidence within one year postrandomisation showed similar results (RR 0.54, 95% CI 0.36 to 0.80; 5 studies). See Table 1.
There were no studies that reported data on prevalence of measles.
Malaria
One study reported a 27% reduction in malaria incidence at follow‐up (RR 0.73, 95% CI 0.60 to 0.88; see the illustrative forest plot in Analysis 1.11 and Table 1; Shankar 1999).
Two studies reported data on malaria prevalence; the combined effect was not statistically significant (RR 0.73, 95% CI 0.41 to 1.28; Analysis 1.12; Ross 1993 HEALTH; Ross 1993 SURVIVAL), and there was no important heterogeneity (Chi2 = 0.02, df = 1; P = 0.88; I2 = 0%).
Meningitis
There were no studies that reported incidence or prevalence data for this outcome.
Lower respiratory tract infection
Eleven studies reported no combined effect for VAS on LRTI incidence (RR 0.99, 95% CI 0.92 to 1.06; 27,540 participants; Analysis 1.13; Rahmathullah 1990; Cheng 1993; Barreto 1994; Biswas 1994; Kartasasmita 1995; Venkatarao 1996; Sempertegui 1999; Chowdhury 2002; Long 2007; Chen 2013a and Chen 2013b (considered as one study); Fisker 2014), with no important heterogeneity (Chi2 = 11.35, df = 9; P = 0.25; I2 = 21%). We judged the quality of this evidence to be low (see summary of findings Table for the main comparison).
Eleven studies that reported data on LRTI incidence within one year postrandomisation showed similar results (RR 0.96, 95% CI 0.89 to 1.04). See Table 1.
Two trials with two relevant comparisons reported LRTI prevalence; the combined result suggests benefit for VAS (RR 0.60, 95% CI 0.45 to 0.81; Analysis 1.14; Long 2006a; DEVTA trial 2013).
Bitot's spots
Herrera 1992 reported no effect on Bitot's spots incidence (RR 0.93, 95% CI 0.76 to 1.14). See Table 1
Five trials reported a 58% reduction in Bitot's spots prevalence (RR 0.42, 95% CI 0.33 to 0.53; 1,063,278 participants; Analysis 1.15; Sinha 1976; Sommer 1986; West 1991; Pant 1996; DEVTA trial 2013), with substantial and significant heterogeneity (Chi2 = 7.89, df = 4; P = 0.10; I2 = 49%). We judged this evidence to be of moderate quality (see summary of findings Table for the main comparison).
Three studies reported data within one year postrandomisation, and combined results were similar (RR 0.43, 95% CI 0.33 to 0.56). See Table 1.
Night blindness
Herrera 1992 reported a 47% reduction in night blindness incidence (RR 0.53, 95% CI 0.28 to 0.99), as shown in the illustrative forest plot in Analysis 1.16.
Sommer 1986 and West 1991 reported a 68% reduction in night blindness prevalence (RR 0.32, 95% CI 0.21 to 0.50; 22,972 participants; Analysis 1.17), with no heterogeneity (Chi2 = 0.19, df = 1; P = 0.66; I2 = 0%). We judged the quality of this evidence to be moderate (see summary of findings Table for the main comparison).
One study reported prevalence within one year postrandomisation, and results were similar (RR 0.30, 95% CI 0.17 to 0.52). See Table 1.
Xerophthalmia
Three trials reported no combined effect on xerophthalmia incidence (RR 0.85, 95% CI 0.70 to 1.03; Analysis 1.18; West 1991; Herrera 1992; Barreto 1994), though statistical heterogeneity was substantial and significant (Chi2 = 2.69, df = 1; P = 0.10; I2 = 63%).
Two studies reported data for one year postrandomisation, and results were similar (RR 0.88, 95% CI 0.72 to 1.07). See Table 1.
Sommer 1986 and West 1991 reported a 69% reduction in xerophthalmia prevalence (RR 0.31, 95% CI 0.22 to 0.45; Analysis 1.19) with no statistical heterogeneity (Chi2 = 0.22, df = 1; P = 0.64; I2 = 0%).
Hospitalisation
Ross 1993 HEALTH reported the likelihood of hospitalisations; however, results were not statistically significant (RR 0.64, 95% CI 0.40 to 1.02; see the illustrative forest plot in Analysis 1.20).
Cheng 1993 reported inconclusive evidence on hospitalisation due to diarrhoea (RR 0.25, 95% CI 0.01 to 6.11; see the illustrative forest plot in Analysis 1.21) and hospitalisation due to LRTI (RR 0.11, 95% CI 0.01 to 2.06; see the illustrative forest plot in Analysis 1.22).
Side effects
We assessed two short‐term side effects: vomiting (within 48 hours) and bulging fontanelle.
Four trials reported a significant increase in risk of vomiting (RR 1.97, 95% CI 1.44 to 2.69; 10,541 participants; Analysis 1.23; Sinha 1976; Florentino 1990; Arya 2000; Fisker 2014), with significant statistical heterogeneity (Chi2 = 9.51, df = 3; P = 0.02; I2 = 68%). We judged this evidence to be of moderate quality (see summary of findings Table for the main comparison).
Four trials reported bulging fontanelle side effects, but the only two that had enough data to enable analysis reported no effect (RR 1.24, 95% CI 0.74 to 2.08; Analysis 1.24; Stabell 1995; Bahl 1999; Arya 2000; Fisker 2014). Most studies included children over one year of age and would not have assessed this side effect.
Vitamin A deficiency status
Meta‐analyses
We assessed two indices of vitamin A deficiency: number deficient and serum retinol level.
Four trials reported a 29% reduction in the number of VAD children (RR 0.71, 95% CI 0.65 to 0.78; 2262 participants; Analysis 1.25; Ross 1993 HEALTH; Dibley 1996; Shankar 1999; Ranjini 2001); however, statistical heterogeneity was substantial and significant (Chi2 = 13.58, df = 3; P = 0.004; I2 = 78%). We judged this evidence to be of moderate quality (see summary of findings Table for the main comparison).
Fourteen trials reported data on vitamin A serum retinol level at follow‐up, including one factorial study contributing two comparisons (Pinnock 1986; Reddy 1986a and Reddy 1986b (considered as one study); Pinnock 1988; Semba 1991; Cheng 1993; Ross 1993 HEALTH; Ross 1993 SURVIVAL; Kartasasmita 1995; Dibley 1996; Sempertegui 1999; Shankar 1999; Ranjini 2001; Lin 2009; DEVTA trial 2013). Vitamin A serum levels were higher in the vitamin A group (standardised mean difference (SMD) 0.26, 95% CI 0.22 to 0.30; Analysis 1.26); however, statistical heterogeneity was substantial and significant (Chi2 = 278.45, df = 14; P < 0.001; I2 = 95%).
Eleven studies reported data within one year postrandomisation and results showed a relatively modest effect (RR 0.45, 95% CI 0.37 to 0.53). See Table 1.
Sensitivity analysis
No studies in this outcome were at high risk of bias for sequence generation.
To test for small study bias, we repeated the analysis using a random‐effects model. The overall estimate was considerably larger than the fixed‐effect estimate, suggesting small studies report larger effects (SMD 0.50, 95% CI 0.30 to 0.70; 14 studies). See Table 1.
The funnel plot that we produced was highly asymmetrical (data not shown).
With regard to the design effects in cluster trials, no ICCs were imputed, so a sensitivity analysis was not required.
Discussion
Summary of main results
Despite the addition of newer studies, notably the large study from India (DEVTA trial 2013), vitamin A supplementation was still associated with a reduction in all‐cause mortality of 12%. There was some statistical heterogeneity in the pooled data, and a sensitivity analysis using a random‐effects model changed the effect size from 12% to 24%; however, the confidence intervals overlapped with that of the fixed‐effect model. Whatever method of analysis we used, vitamin A has a significant and clinically meaningful effect, so supplementation should be offered to children in populations at risk of VAD.
Even though the exact mechanism of vitamin A against mortality is not clear, at least some of its protective effect stems from reductions in death due to diarrhoea and measles. The overall effect for mortality due to measles was not significant, as not all the studies that reported all‐cause mortality reported measles‐specific mortality; however, the therapeutic effects of VAS in reducing measles‐related mortality and morbidity are well established (Yang 2005). Furthermore, VAS resulted in reduced incidence of diarrhoea and measles. Other reviews have shown that the therapeutic use of VAD may prevent acute diarrhoea from becoming chronic (Imdad 2010b). Together, these results suggest that reductions in diarrhoea and measles are potential pathways in the reduction of all‐cause mortality.
In addition to reducing death and illness, VAS reduces night blindness and potential precursors to blindness, namely Bitot's spots and xerophthalmia.
Few studies reported data about side effects, including vomiting, bulging fontanelle, and diarrhoea soon after receiving the intervention. VAS may increase short‐term vomiting almost two‐fold.
Overall completeness and applicability of evidence
This review systematically assessed both mortality and morbidity associated with VAS. This update includes new published studies, but results are similar in terms of the effectiveness of VAS for reducing mortality, morbidity, and nutrition‐related blindness.
All included studies reporting all‐cause mortality took place in low‐middle income countries. Given that a large proportion of the included studies (20/47) specifically excluded children with vitamin A deficiency, and vitamin A status was not clear in 23, it is likely that the effectiveness of vitamin A supplementation may be even more effective for children in developing countries who are at risk of vitamin A deficiency. The primary analysis is based on 19 trials from different countries and locations. It included 1,202,382 children randomised in this review. The risk of selective reporting for the primary outcome appears minimal. Statistical heterogeneity suggests that the magnitude of the effect may differ across settings and populations, possibly due to the extent of VAD or the availability of other nutrients. For example, dietary intake of vitamin A will differ across locations, and the effects of supplementation may be smaller in places with greater access to foods rich in vitamin A. Concomitant nutrient deficiencies may also impair the bioavailability of the supplements, since some of these nutrients (including fat, protein, and zinc) could be limiting factors for the absorption and utilisation of vitamin A, which is lipid‐soluble (Villamor 2000). Comorbid illnesses could also reduce absorption of vitamin A; that is, if vitamin A reduces mortality by reducing susceptibility to particular pathogens, differences in the prevalence of disease, sanitation, etc. might contribute to heterogeneity in outcomes across trials.
Analyses for many of the cause‐specific mortality and morbidity outcomes were consistent in favour of intervention. A general weakness of many interventions is the under‐reporting of implementation data, such as the core components of an intervention, the degree to which they are delivered in practice, and what aspects of the trial may have influenced implementation (Mayo‐Wilson 2007). In theory, the putative effect of this intervention relies little on the relationship between the provider and participant, but it is essential that large‐scale interventions effectively distribute capsules that have been stored properly and remain active. Additionally, the degree to which children were treated for morbidities across trials might influence incidence and prevalence data collected in various trials, and this could contribute to heterogeneity.
This review suggests some ways in which vitamin A might work, but it does not describe how the effects of vitamin A might differ across subpopulations. The included trials did not report the data required for such analyses, and we decided a priori not to include subgroup analyses based on individual‐level moderators for reasons described in the section on Subgroup analysis and investigation of heterogeneity. A more detailed investigation of heterogeneity would require individual participant data and possibly information on vitamin A status at the individual or population level. Co‐interventions, including other nutrients or vaccinations, might interact with vitamin A, but we were unable to review possible interaction effects. We were also unable to compare HIV‐positive children to HIV‐negative children, though there is a separate Cochrane Review that specifically looked at effectiveness of vitamin A supplementation in individuals who are infected with HIV, and the results were similar (Irlam 2010). Subgroup analyses by geographic region included few studies; some disaggregated data by sex and age, but these were not representative of the studies overall or the results. Subgroup results were neither significant nor meaningful, and they are vulnerable to reporting bias (i.e. differences are more likely to be reported than similarities). Though a review with individual participant data could be informative, systematic reviews are not the best method for answering all questions, and other studies might explain why results are sometimes different. In any case, the observed effects are so large that heterogeneity may be unimportant; vitamin A should be given to children whether it reduces childhood mortality by 7% or 17%.
Quality of the evidence
This review included 47 studies and an estimated 1,223,856 children. This is the largest review of VAS for children to date.
In certain studies it was impossible to assess allocation concealment. Efforts to blind participants and providers suggest the overall risk of bias is minimal, and any impact on the primary outcome (all‐cause mortality) is likely to be small.
In some trials, children interacted with researchers or clinicians who were aware of their assignment. We judged three studies to be at high risk of performance bias, mostly because of failure to adequately blind participants, providers, and outcome assessors (Daulaire 1992; Lin 2009; DEVTA trial 2013). We considered bias due to inadequate blinding to be low and, if anything, likely to underestimate effects; for example, a teacher would be more likely to give extra food to a child receiving the placebo rather than the reverse.
Missing data are much more likely to influence secondary analyses than the primary outcome. Results for all‐cause mortality are known for over 98% of randomised participants. Of the 19 (40%) studies that reported this outcome, we judged seven to be at unclear risk of bias, but four of these had minimal attrition (Vijayaraghavan 1990; Ross 1993 HEALTH; Ross 1993 SURVIVAL; Venkatarao 1996). The others failed to report reasons for dropout. Two studies did not adequately handle missing data (Pant 1996; Chowdhury 2002), but together these studies contributed only 5% to the pooled estimate.
The DEVTA trial 2013, which included about a million children, found a small benefit for vitamin A supplementation. These findings generated controversy because many experts believe that the methods for the delivery of the intervention and the assessment of the primary outcome (i.e. all‐cause mortality) were not rigorous (Habicht 2013; Mannar 2013; Mayo‐Wilson 2013; Sloan 2013; Sommer 2013). For example, investigators did not count children at baseline or obtain informed consent, and methods of follow‐up and data collection were not vigorous (Mannar 2013; Sommer 2013). In this cluster‐randomised trial, vitamin A capsules were distributed by Anganwadi workers who had contact with only 26% of the children living in the study area (Sommer 2013). In reply to this extensive criticism, authors of DEVTA emphasised that results of this trial need to be interpreted alongside previously published studies (Peto 2013). In the updated analysis of 19 trials for all‐cause mortality for this review, DEVTA accounted for 61.7% of the combined effect in a fixed‐effect analysis. A sensitivity analysis using a random‐effects model found a 24% reduction in mortality, essentially the same as our original estimate (RR 0.76, 95% CI 0.69 to 0.83), published previously (Imdad 2010a). Thus, VAS appears to have a robust effect on risk of death in children, which is clinically meaningful and important for policy. Unsurprisingly, the effect of vitamin A supplementation may be reduced when the intervention is not delivered with fidelity.
In summary, the primary outcome was at low risk of bias, and the size and the significance of the effect cannot be explained by bias. While there was some evidence of small study bias for secondary outcomes, further research is unlikely to change the conclusion that VAS, delivered with high quality and coverage, prevents death among children aged 6 to 59 months in low‐ and middle‐income countries. Despite sensitivity analyses and attempts to explain sources of heterogeneity by comparing the characteristics of the studies, we could not explain reasons for these differences across trials. Observational studies might investigate the mechanisms by which vitamin A reduces mortality.
Potential biases in the review process
This review used clearly specified inclusion and exclusion criteria, a comprehensive search strategy for the identification of relevant studies, and prespecified subgroup and sensitivity analyses to explore heterogeneity. We also described the post hoc decision to include two quasi‐RCTs (Herrera 1992; Stansfield 1993). Only Herrera 1992 contributed data to the primary outcome of all‐cause mortality, and sensitivity analyses demonstrated that exclusion of this study did not change the results significantly.
We combined risk ratios (events per child) and rate ratios (events per child‐year) for incidence data. Strictly speaking these two ratios have different interpretations; however, we think that the included studies used the same scale, and outcomes are less likely to be biased by use of denominator. For the primary outcome of all‐cause mortality, there were three studies where the denominator was time at risk (Ross 1993 HEALTH; Dibley 1996; Fisker 2014), and exclusion of these studies did not change the results.
For three trials with multiple arms, we included each such study as two comparisons (Reddy 1986a and Reddy 1986b; Long 2006a and Long 2006b; Chen 2013a and Chen 2013b). We acknowledge that results for comparisons from the same study may be correlated; however, this is unlikely to affect the results of our analysis because each group was counted only once (i.e. we would have obtained the same overall result by combining the eligible treatment groups and the eligible control groups).
The comprehensive search strategy was devised to minimise publication bias by searching for both published and unpublished studies, though none of the included studies were unpublished. While studies with positive results are more likely to be published than studies with negative results, studies large enough to make a difference in this review are very likely to be published. One study awaiting assessment was too small to affect any analysis (Aklamati 2006).
Some secondary outcomes did not contain a majority of the children randomised in the review, and these results may be vulnerable to selective outcome reporting bias.
Agreements and disagreements with other studies or reviews
Our results are consistent with the results of other reviews assessing a similar question, though the magnitude of the reduction in risk of death was smaller. Glasziou 1993 reported a 30% reduction in all‐cause mortality, and Beaton 1993 reported a 23% reduction. Fawzi 1993 used an odds ratio (OR) rather than risk ratio as the measure of association, so the reported reduction is not directly comparable (OR 0.70, 95% CI 0.56 to 0.87).
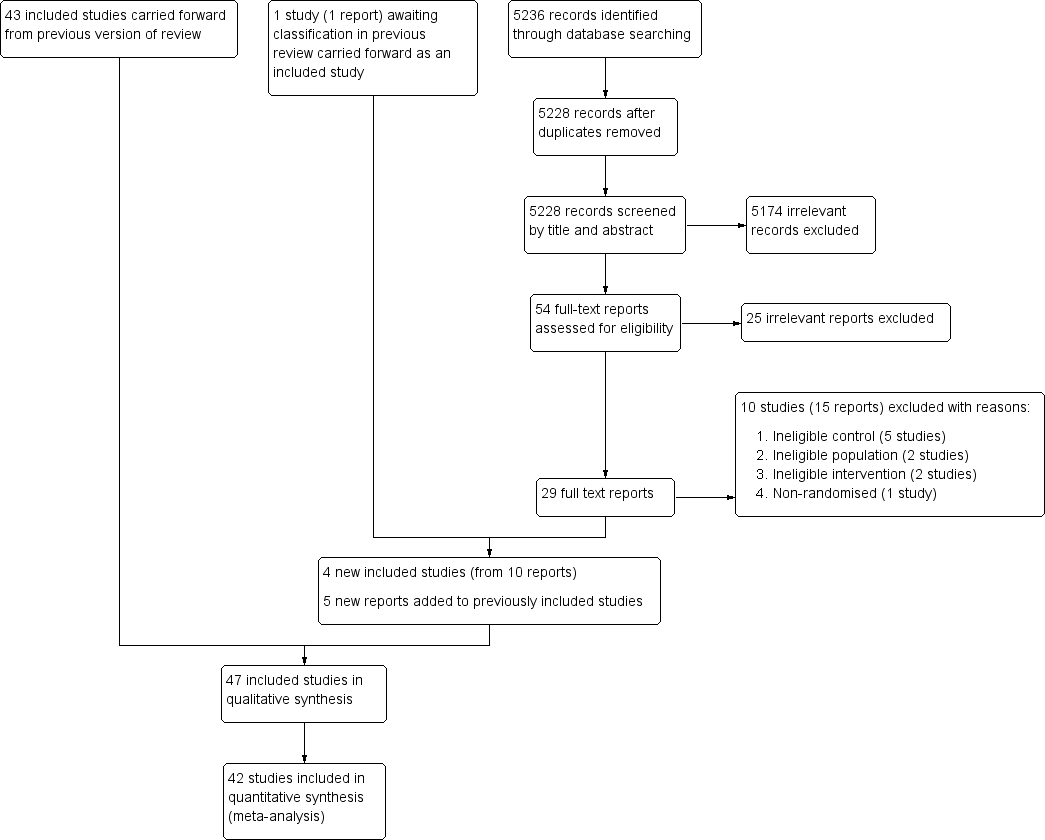
Study flow diagram.

Risk of bias summary: review authors' judgements about each risk of bias item for each included study.

Forest plot of comparison: 1 Vitamin A versus Control, outcome: 1.1 All‐cause mortality at longest follow‐up.
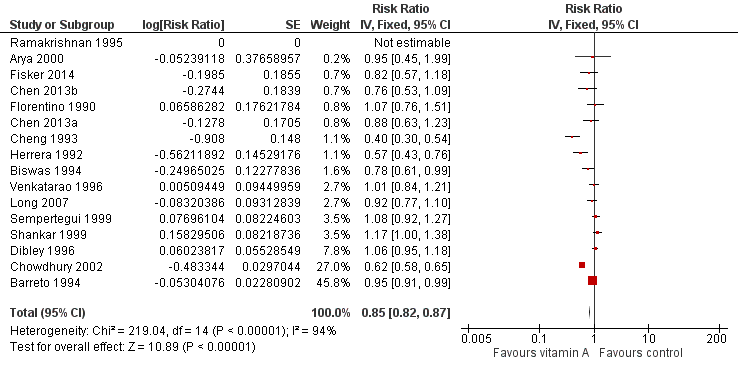
Forest plot of comparison: 1 Vitamin A versus Control, outcome: 1.8 Diarrhoea incidence at longest follow‐up.

Funnel plot of comparison: 1 Vitamin A versus Control, outcome: 1.1 All‐cause mortality at longest follow‐up.

Forest plot of comparison: 1 Vitamin A versus Control, outcome: 1.12 Measles Incidence at Longest Follow‐up.
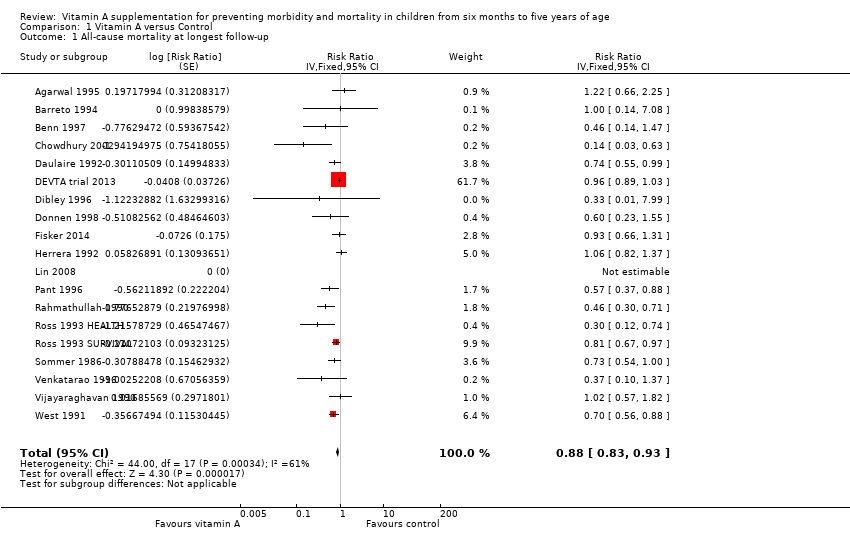
Comparison 1 Vitamin A versus Control, Outcome 1 All‐cause mortality at longest follow‐up.
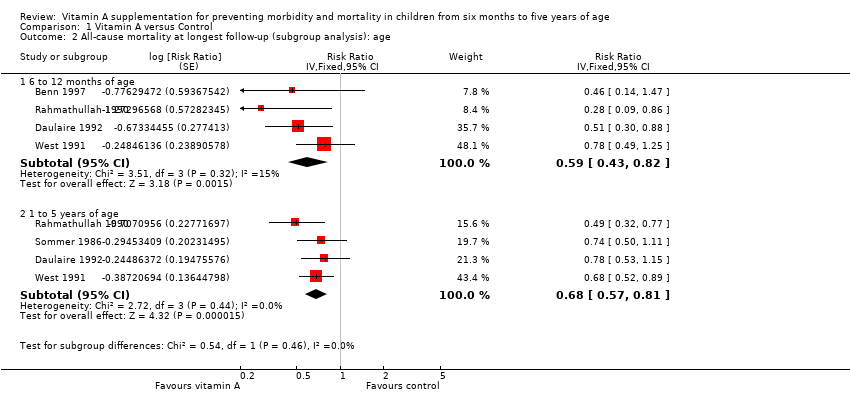
Comparison 1 Vitamin A versus Control, Outcome 2 All‐cause mortality at longest follow‐up (subgroup analysis): age.
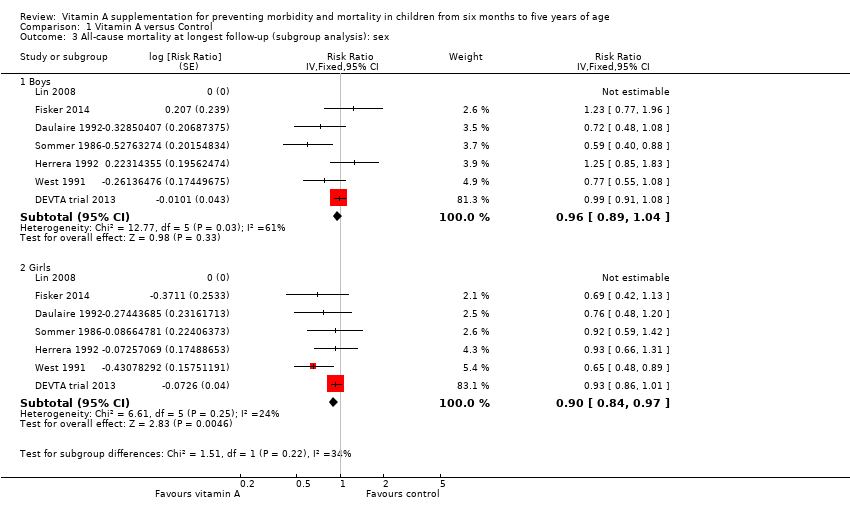
Comparison 1 Vitamin A versus Control, Outcome 3 All‐cause mortality at longest follow‐up (subgroup analysis): sex.
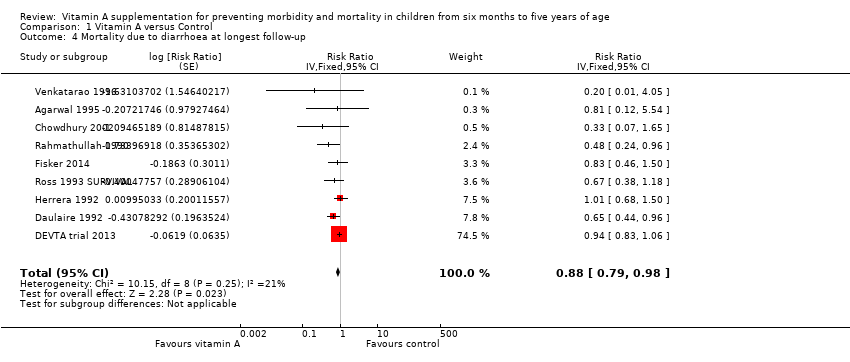
Comparison 1 Vitamin A versus Control, Outcome 4 Mortality due to diarrhoea at longest follow‐up.
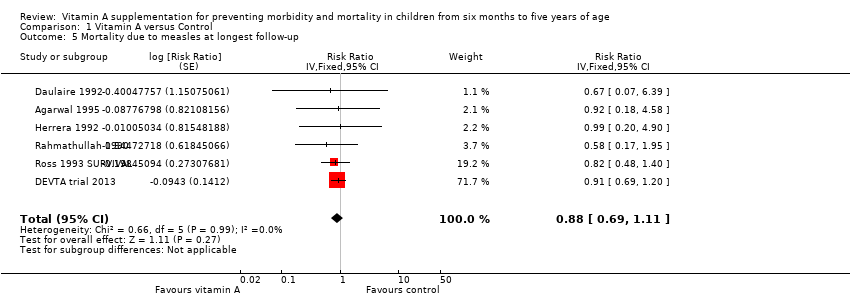
Comparison 1 Vitamin A versus Control, Outcome 5 Mortality due to measles at longest follow‐up.
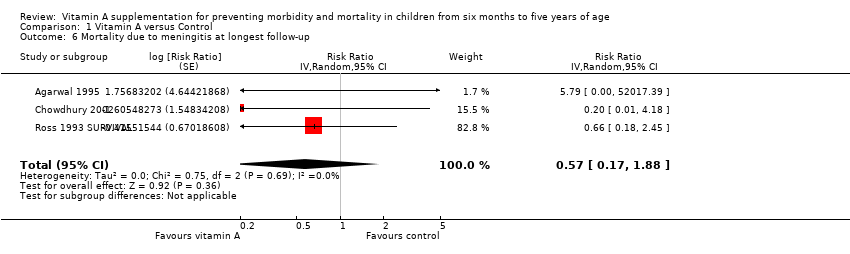
Comparison 1 Vitamin A versus Control, Outcome 6 Mortality due to meningitis at longest follow‐up.
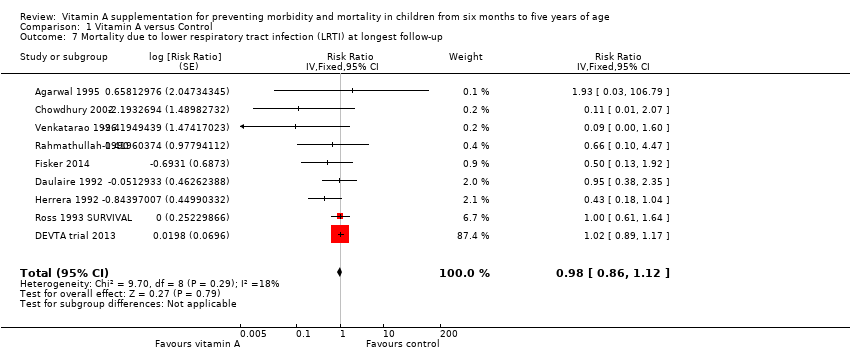
Comparison 1 Vitamin A versus Control, Outcome 7 Mortality due to lower respiratory tract infection (LRTI) at longest follow‐up.
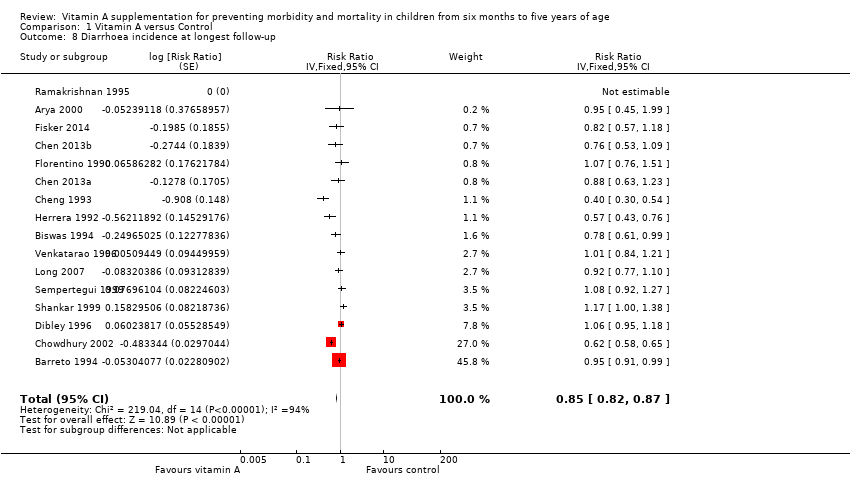
Comparison 1 Vitamin A versus Control, Outcome 8 Diarrhoea incidence at longest follow‐up.
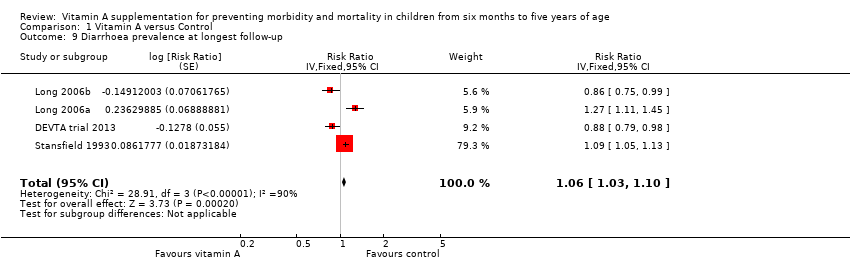
Comparison 1 Vitamin A versus Control, Outcome 9 Diarrhoea prevalence at longest follow‐up.
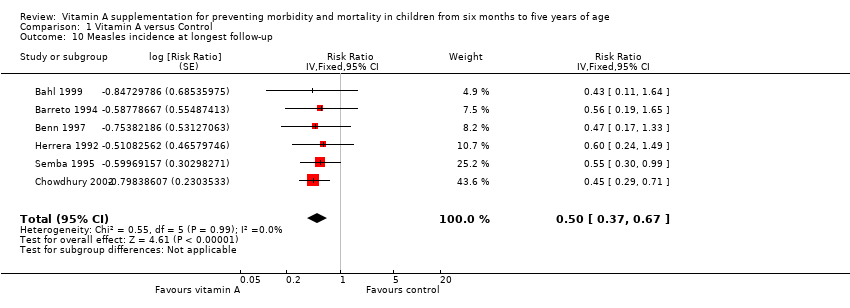
Comparison 1 Vitamin A versus Control, Outcome 10 Measles incidence at longest follow‐up.
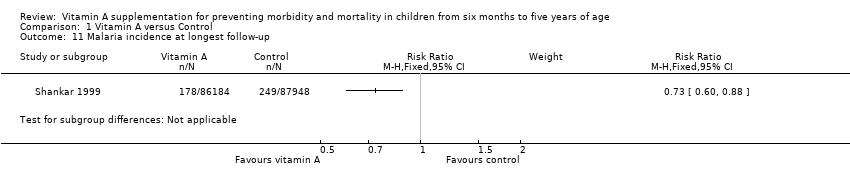
Comparison 1 Vitamin A versus Control, Outcome 11 Malaria incidence at longest follow‐up.
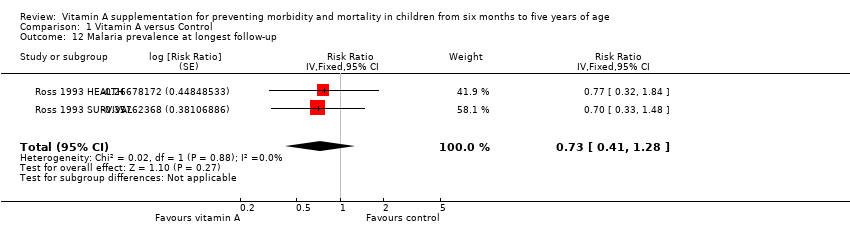
Comparison 1 Vitamin A versus Control, Outcome 12 Malaria prevalence at longest follow‐up.
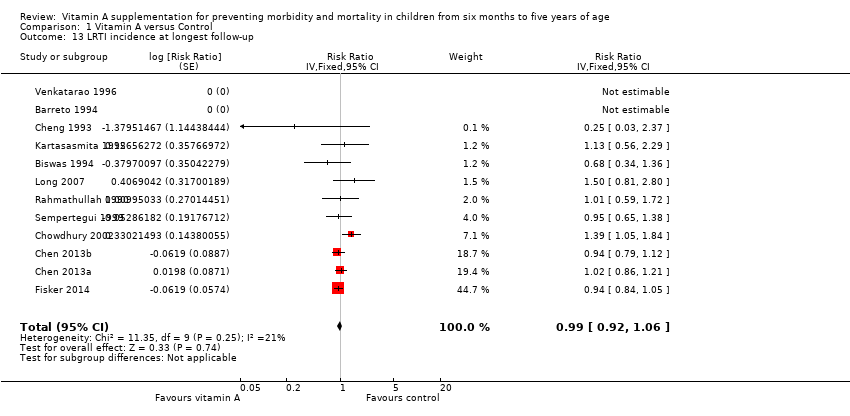
Comparison 1 Vitamin A versus Control, Outcome 13 LRTI incidence at longest follow‐up.
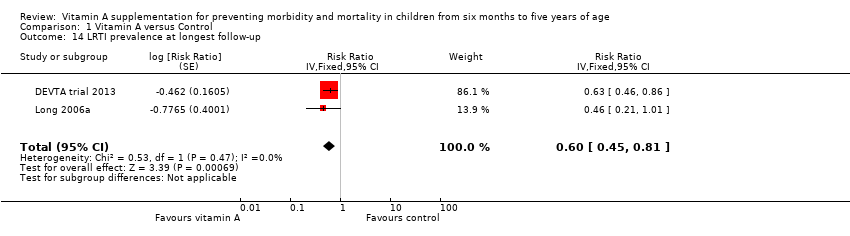
Comparison 1 Vitamin A versus Control, Outcome 14 LRTI prevalence at longest follow‐up.
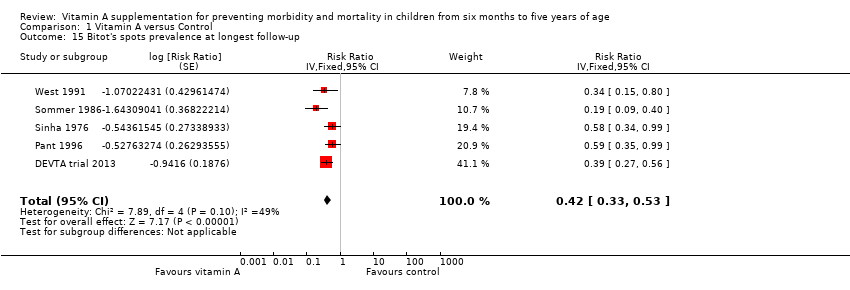
Comparison 1 Vitamin A versus Control, Outcome 15 Bitot's spots prevalence at longest follow‐up.
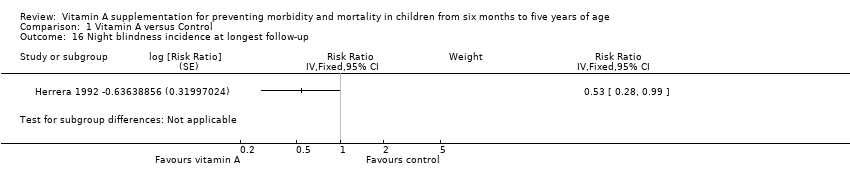
Comparison 1 Vitamin A versus Control, Outcome 16 Night blindness incidence at longest follow‐up.
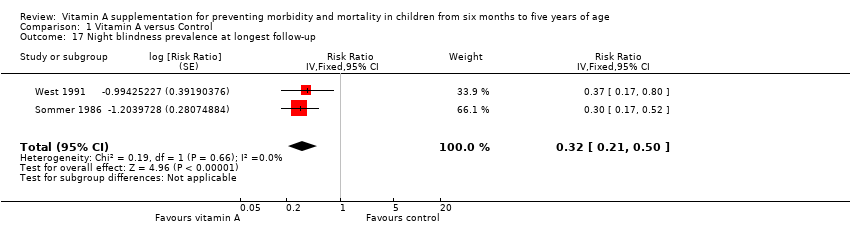
Comparison 1 Vitamin A versus Control, Outcome 17 Night blindness prevalence at longest follow‐up.
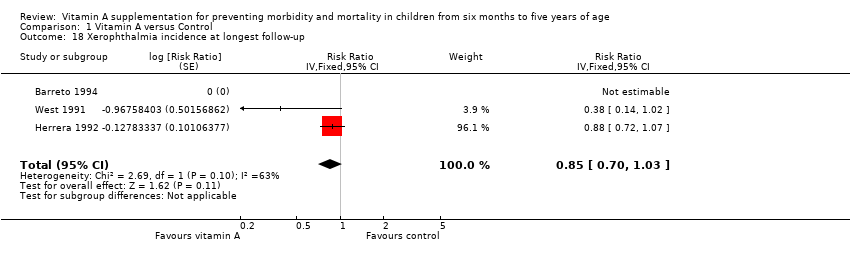
Comparison 1 Vitamin A versus Control, Outcome 18 Xerophthalmia incidence at longest follow‐up.
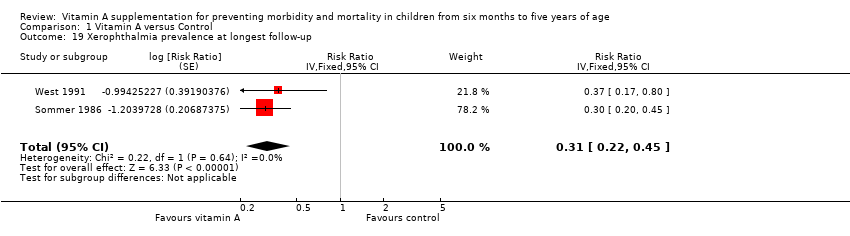
Comparison 1 Vitamin A versus Control, Outcome 19 Xerophthalmia prevalence at longest follow‐up.
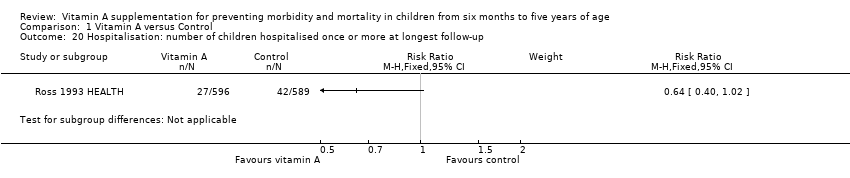
Comparison 1 Vitamin A versus Control, Outcome 20 Hospitalisation: number of children hospitalised once or more at longest follow‐up.

Comparison 1 Vitamin A versus Control, Outcome 21 Hospitalisation due to diarrhoea at longest follow‐up.
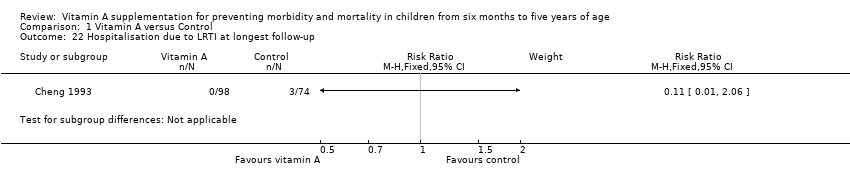
Comparison 1 Vitamin A versus Control, Outcome 22 Hospitalisation due to LRTI at longest follow‐up.
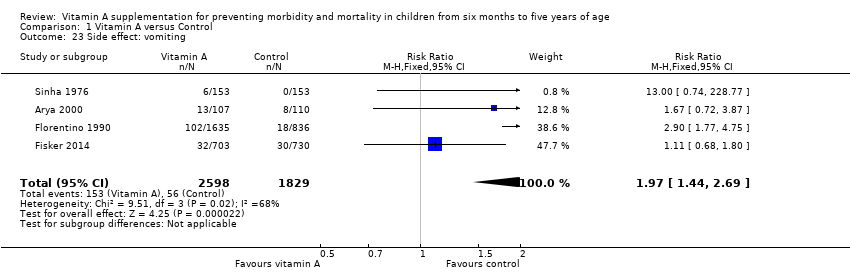
Comparison 1 Vitamin A versus Control, Outcome 23 Side effect: vomiting.
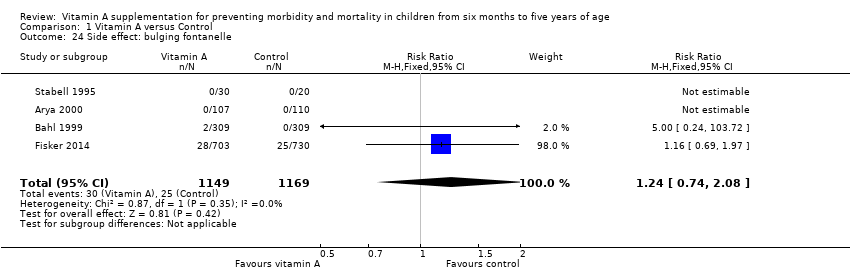
Comparison 1 Vitamin A versus Control, Outcome 24 Side effect: bulging fontanelle.
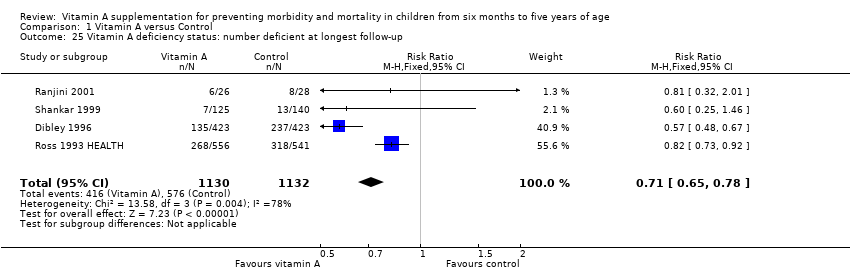
Comparison 1 Vitamin A versus Control, Outcome 25 Vitamin A deficiency status: number deficient at longest follow‐up.
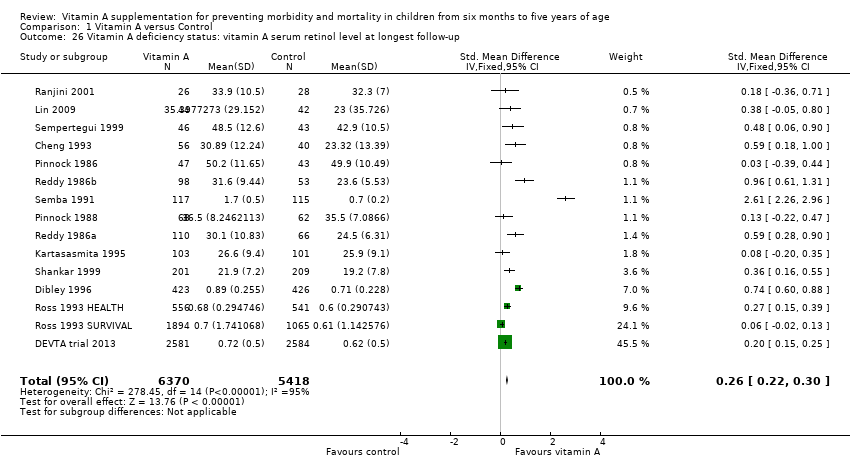
Comparison 1 Vitamin A versus Control, Outcome 26 Vitamin A deficiency status: vitamin A serum retinol level at longest follow‐up.
| Vitamin A supplementation for preventing morbidity and mortality in children from 6 months to 5 years of age | ||||||
| Patient or population: children aged between 6 months and 5 years Intervention: vitamin A supplementation Comparison: placebo or usual care | ||||||
| Outcomes | Illustrative comparative risks* (95% CI) | Relative effect | Number of participants | Quality of the evidence | Comments | |
| Assumed risk | Corresponding risk | |||||
| Control | Vitamin A | |||||
| All‐cause mortality Follow‐up: 12‐96 weeks | Study population | RR 0.88 (0.83 to 0.93) | 1,202,382 (19 studies) | ++++ | Random‐effects RR 0.76 (95% CI 0.66 to 0.88) | |
| 26 per 1000a | 23 per 1000 (22 to 24) | |||||
| Mortality due to diarrhoea Follow‐up: 48‐104 weeks | Study population | RR 0.88, (0.79 to 0.98) | 1,098,538 | ++++ | Total number of participants reflects number randomised to studies. The analysis combined cumulative risk and risk per 1000 years follow‐up | |
| 8 per 1000a | 7 per 1000 (6 to 8) | |||||
| Mortality due to measles Follow‐up: 52 to 104 weeks | Study population | RR 0.88, (0.69 to 1.11) | 1,088,261 | ++OO Lowc,d | Total number of participants reflects number randomised to studies. The analysis combined cumulative risk and risk per 1000 years follow‐up | |
| 2 per 10,000a | 2 per 1000 (1 to 2) | |||||
| Mortality due to LRTI Follow‐up: 48‐104 weeks | Study population | RR 0.98, (0.86 to 1.12) | 1,098,538 | ++OO | Total number of participants reflects number randomised to studies. The analysis combined cumulative risk and risk per 1000 years follow‐up | |
| 4 per 10,000a | 4 per 1000 (3 to 5) | |||||
| Diarrhoea incidence Mean episodes per child per year | Study population | Rate ratio 0.85, 95% CI 0.82 to 0.87 | 77,946 | ++OO | — | |
| Mean episodes of diarrhoea in control group: 4.0 per child per yeare | VAS led to 3 fewer episodes of diarrhoea per child per year (3 to 4 fewer episodes) | |||||
| Measles incidence Mean episodes of measles per child per year | Study population | Rate ratio 0.50, 95% CI 0.37 to 0.67 | 19,566 | ++O Moderatec | — | |
| Mean episodes of measles in control group: 0.2 per child per yeare | VAS led to 0.015 fewer episodes per child per year (0.019 events fewer per child to 0.01 events fewer per child) | |||||
| LRTI incidence Mean episodes per child per year | Study population | Rate ratio 0.99, 95% CI 0.92 to 1.06 | 27, 540 | ++OO Lowc,d | — | |
| Mean episodes of LRTI in control group: 0.1 episodes per child per yeare | VAS led to 0.1 more episodes of LRTI per child per year (0.1 fewer episodes to 0.1 more episodes) | |||||
| Bitot's spots incidence Follow‐up: mean 80.72 weeks | Study population | RR 0.42, 95% CI 0.33 to 0.53 | 1,063,278 | +++O Moderatec | — | |
| 35 per 1000a | 15 per 1000 (12 to 19) | |||||
| Night blindness incidence Follow‐up: 52 to 68 weeks | Study population | RR 0.32, 95% CI 0.21 to 0.50 | 22,972 (2 studies) | +++O Moderatec | — | |
| 4 per 1000g | 1 per 1000 (1 to 2) | |||||
| Vitamin A deficiency Follow‐up: mean 54.5 weeks | Study population | RR 0.71, 95% CI 0.65 to 0.78 | 2262 | +++O | — | |
| 509 per 1000g | 361 per 1000 (331 to 397) | |||||
| Vomiting Follow‐up: 0.14 to 52 weeks | Study population | RR 1.97, 95% CI 1.44 to 2.69 | 10541 | +++O | — | |
| 31 per 1000g | 61 per 1000 (45 to 83) | |||||
| *The basis for the assumed risk (for example, the median control group risk across studies) is provided in footnotes. The corresponding risk (and its 95% CI) is based on the assumed risk in the comparison group and the relative effect of the intervention (and its 95% CI). | ||||||
| GRADE Working Group grades of evidence | ||||||
| aBased on control group mortality risk in DEVTA trial 2013. | ||||||
| Outcome or subgroup | Studies | Heterogeneity | Statistical Method | Effect estimate | Test for subgroup differences (P value) |
| All‐cause mortality, outcomes < 1 year since randomisation | 13 | Chi2 = 34.29, df = 12; P < 0.001; I2 = 65% | Risk ratio (GIV, fixed, 95% CI) | 0.83 (0.75 to 0.92) | NA |
| All‐cause mortality, outcomes 13 months to 59 months since randomisation | 6 | Chi2 = 15.75, df = 5; P < 0.001; I2 = 68% | Risk ratio (GIV, fixed, 95% CI) | 0.88 (0.81 to 0.97) | NA |
| All‐cause mortality at longest follow‐up (subgroup analysis): Asia | 12 | Chi2 = 42.65, df = 10; P < 0.001; I2 = 77% | Risk ratio (GIV, fixed, 95% CI) | 0.90 (0.84 to 0.96) | 0.83 |
| All‐cause mortality at longest follow‐up (subgroup analysis): Africa | 6 | Chi2 = 10.06, df = 5; P = 0.07; I2 = 50% | Risk ratio (GIV, fixed, 95% CI) | 0.86 (0.75 to 0.98) | |
| All‐cause mortality at longest follow‐up (subgroup analysis): Latin America | 1 | NA | Risk ratio (GIV, fixed, 95% CI) | 1.00 (0.14 to 7.08) | |
| All‐cause mortality at longest follow‐up, by national child mortality rate (subgroup analysis): high (> 40/1000) | 17 | Chi2 = 53.07, df = 16 (P < 0.001; I2 = 70% | Risk ratio (GIV, fixed, 95% CI) | 0.89 (0.84 to 0.94) | 0.9 |
| All‐cause mortality at longest follow‐up, by national child mortality rate (subgroup analysis): low (< 40/1000) | 2 | NA | Risk ratio (GIV, fixed, 95% CI) | 1.00 (0.14 to 7.08) | |
| All‐cause mortality at longest follow‐up (sensitivity analysis): random‐effects model | 19 | Tau2 = 0.04; Chi2 = 44.00, df = 17; P = 0.001; I2 = 61% | Risk ratio (GIV, fixed, 95% CI) | 0.76 (0.66 to 0.88) | NA |
| All‐cause mortality at longest follow‐up (sensitivity analysis): without DEVTA trial | 18 | Chi2 = 30.38, df = 16; P = 0.02; I2 = 47% | Risk ratio (GIV, fixed, 95% CI) | 0.77 (0.70 to 0.84) | NA |
| All‐cause mortality at longest follow‐up (sensitivity analysis): ICC = 0.002 (assumes no impact of clustering for studies with unknown ICC) | 19 | Chi2 = 57.02, df = 16; P < 0.001; I2 = 72% | Risk ratio (GIV, fixed, 95% CI) | 0.89 (0.84, 0.94) | NA |
| All‐cause mortality at longest follow‐up (sensitivity analysis): ICC = 0.010 (assumes high impact of clustering for studies with unknown ICC) | 19 | Chi2 = 47.87, df = 16; P < 0.001; I2 = 67% | Risk ratio (GIV, fixed, 95% CI) | 0.89 (0.84 to 0.94) | NA |
| Mortality due to diarrhoea, outcomes < 1 year since randomisation | 6 | Chi2 = 5.23, df = 5; P = 0.39; I2 = 4% | Risk ratio (GIV, fixed, 95% CI) | 0.76 (0.61 to 0.95) | NA |
| Mortality due to measles, outcomes < 1 year since randomisation | 4 | Chi2 = 0.52, df = 3; P = 0.91; I2 = 0% | Risk ratio (GIV, fixed, 95% CI) | 0.85 (0.52 to 1.37) | NA |
| Mortality due to meningitis, outcomes < 1 year since randomisation | 1 | NA | Risk ratio (GIV, fixed, 95% CI) | 5.79 (0.22 to 153.24) | NA |
| Mortality due to LRTI, outcomes < 1 year since randomisation | 6 | Chi2 = 5.66, df = 5; P = 0.34; I2 = 12% | Risk ratio (GIV, fixed, 95% CI) | 0.66 (0.40 to 1.10) | NA |
| Diarrhoea incidence at longest follow‐up (sensitivity analysis): analysis without studies Cheng 1993; Chowdhury 2002 | 13 | Heterogeneity: chi2 = 30.71, df = 12; P = 0.002; I2 = 61% | Risk ratio (GIV, fixed, 95% CI) | 0.96 (0.93 to 1.00) | NA |
| Diarrhoea incidence, outcomes < 1 year since randomisation | 13 | Chi2 = 51.64, df = 11; P < 0.001; I2 = 79% | Risk ratio (GIV, fixed, 95% CI) | 0.93 (0.89 to 0.96) | NA |
| Diarrhoea incidence at longest follow‐up (sensitivity analysis): random‐effects model | 15 | Tau2 = 0.07; Chi2 = 219.04, df = 14; P < 0.001; I2 = 94% | Risk ratio (GIV, random, 95% CI) | 0.84 (0.73, 0.98) | NA |
| Measles incidence, outcomes < 1 year since randomisation | 5 | Chi2 = 0.24, df = 4; P = 0.99; I2 = 0% | Risk ratio (GIV, fixed, 95% CI) | 0.54 (0.36 to 0.80) | NA |
| Malaria incidence, outcomes 1 + years since randomisation (subgroup analysis): age | 1 | NA | Risk ratio (M‐H, fixed, 95% CI) | 0.73 (0.60 to 0.88) | NA |
| LRTI Incidence, outcomes < 1 year since randomisation | 11 | Chi2 = 5.23, df = 8; P = 0.73; I2 = 0% | Risk ratio (GIV, fixed, 95% CI) | 0.96 (0.89 to 1.04) | NA |
| Bitot's spots incidence, outcomes < 1 year since randomisation | 1 | NA | Risk ratio (GIV, fixed, 95% CI) | 0.93 (0.76 to 1.14) | NA |
| Bitot's spots prevalence, outcomes < 1 year since randomisation | 3 | Chi2 = 6.06, df = 2; P = 0.05; I2 = 67% | Risk ratio (GIV, fixed, 95% CI) | 0.43 (0.33 to 0.56) | NA |
| Night blindness prevalence, outcomes < 1 year since randomisation | 1 | NA | Risk ratio (GIV, fixed, 95% CI) | 0.30 (0.17 to 0.52) | NA |
| Xerophthalmia incidence, outcomes < 1 year since randomisation | 2 | NA | Risk ratio (GIV, fixed, 95% CI) | 0.88 (0.72 to 1.07) | NA |
| Vitamin A serum retinol level, outcomes < 1 year since randomisation | 11 | Chi2 = 178.42, df = 10; P < 0.001; I2 = 94% | Standardised mean difference (GIV, fixed, 95% CI) | 0.45 (0.37 to 0.53) | NA |
| Vitamin A serum retinol level at longest follow‐up (sensitivity analysis): random‐effects model | 14 | Tau2 = 0.13; Chi2 = 278.45, df = 14; P < 0.001; I2 = 95% | Standardised mean difference (GIV, random, 95% CI) | 0.50 (0.30 to 0.70) | NA |
| CI: confidence interval; GIV: Generic inverse variance; LRTI: lower respiratory tract infection;M‐H: mantel Haenszel method;NA: not applicable. | |||||
| Outcome or subgroup title | No. of studies | No. of participants | Statistical method | Effect size |
| 1 All‐cause mortality at longest follow‐up Show forest plot | 19 | Risk Ratio (Fixed, 95% CI) | 0.88 [0.83, 0.93] | |
| 2 All‐cause mortality at longest follow‐up (subgroup analysis): age Show forest plot | 5 | Risk Ratio (Fixed, 95% CI) | Subtotals only | |
| 2.1 6 to 12 months of age | 4 | Risk Ratio (Fixed, 95% CI) | 0.59 [0.43, 0.82] | |
| 2.2 1 to 5 years of age | 4 | Risk Ratio (Fixed, 95% CI) | 0.68 [0.57, 0.81] | |
| 3 All‐cause mortality at longest follow‐up (subgroup analysis): sex Show forest plot | 7 | Risk Ratio (Fixed, 95% CI) | Subtotals only | |
| 3.1 Boys | 7 | Risk Ratio (Fixed, 95% CI) | 0.96 [0.89, 1.04] | |
| 3.2 Girls | 7 | Risk Ratio (Fixed, 95% CI) | 0.90 [0.84, 0.97] | |
| 4 Mortality due to diarrhoea at longest follow‐up Show forest plot | 9 | Risk Ratio (Fixed, 95% CI) | 0.88 [0.79, 0.98] | |
| 5 Mortality due to measles at longest follow‐up Show forest plot | 6 | Risk Ratio (Fixed, 95% CI) | 0.88 [0.69, 1.11] | |
| 6 Mortality due to meningitis at longest follow‐up Show forest plot | 3 | Risk Ratio (Random, 95% CI) | 0.57 [0.17, 1.88] | |
| 7 Mortality due to lower respiratory tract infection (LRTI) at longest follow‐up Show forest plot | 9 | Risk Ratio (Fixed, 95% CI) | 0.98 [0.86, 1.12] | |
| 8 Diarrhoea incidence at longest follow‐up Show forest plot | 16 | Risk Ratio (Fixed, 95% CI) | 0.85 [0.82, 0.87] | |
| 9 Diarrhoea prevalence at longest follow‐up Show forest plot | 4 | Risk Ratio (Fixed, 95% CI) | 1.06 [1.03, 1.10] | |
| 10 Measles incidence at longest follow‐up Show forest plot | 6 | Risk Ratio (Fixed, 95% CI) | 0.50 [0.37, 0.67] | |
| 11 Malaria incidence at longest follow‐up Show forest plot | 1 | Risk Ratio (M‐H, Fixed, 95% CI) | Subtotals only | |
| 12 Malaria prevalence at longest follow‐up Show forest plot | 2 | Risk Ratio (Fixed, 95% CI) | 0.73 [0.41, 1.28] | |
| 13 LRTI incidence at longest follow‐up Show forest plot | 12 | Risk Ratio (Fixed, 95% CI) | 0.99 [0.92, 1.06] | |
| 14 LRTI prevalence at longest follow‐up Show forest plot | 2 | Risk Ratio (Fixed, 95% CI) | 0.60 [0.45, 0.81] | |
| 15 Bitot's spots prevalence at longest follow‐up Show forest plot | 5 | Risk Ratio (Fixed, 95% CI) | 0.42 [0.33, 0.53] | |
| 16 Night blindness incidence at longest follow‐up Show forest plot | 1 | Risk Ratio (Fixed, 95% CI) | Subtotals only | |
| 17 Night blindness prevalence at longest follow‐up Show forest plot | 2 | Risk Ratio (Fixed, 95% CI) | 0.32 [0.21, 0.50] | |
| 18 Xerophthalmia incidence at longest follow‐up Show forest plot | 3 | Risk Ratio (Fixed, 95% CI) | 0.85 [0.70, 1.03] | |
| 19 Xerophthalmia prevalence at longest follow‐up Show forest plot | 2 | Risk Ratio (Fixed, 95% CI) | 0.31 [0.22, 0.45] | |
| 20 Hospitalisation: number of children hospitalised once or more at longest follow‐up Show forest plot | 1 | Risk Ratio (M‐H, Fixed, 95% CI) | Subtotals only | |
| 21 Hospitalisation due to diarrhoea at longest follow‐up Show forest plot | 1 | Risk Ratio (M‐H, Fixed, 95% CI) | Subtotals only | |
| 22 Hospitalisation due to LRTI at longest follow‐up Show forest plot | 1 | Risk Ratio (M‐H, Fixed, 95% CI) | Subtotals only | |
| 23 Side effect: vomiting Show forest plot | 4 | 4427 | Risk Ratio (M‐H, Fixed, 95% CI) | 1.97 [1.44, 2.69] |
| 24 Side effect: bulging fontanelle Show forest plot | 4 | 2318 | Risk Ratio (M‐H, Fixed, 95% CI) | 1.24 [0.74, 2.08] |
| 25 Vitamin A deficiency status: number deficient at longest follow‐up Show forest plot | 4 | 2262 | Risk Ratio (M‐H, Fixed, 95% CI) | 0.71 [0.65, 0.78] |
| 26 Vitamin A deficiency status: vitamin A serum retinol level at longest follow‐up Show forest plot | 15 | 11788 | Std. Mean Difference (IV, Fixed, 95% CI) | 0.26 [0.22, 0.30] |