نقش مصرف مکمل ویتامین A در پیشگیری از بروز مرگومیر (mortality) و بیماری (morbidity) در کودکان سنین شش ماه تا پنج سال
Appendices
Appendix 1. Search strategies 2016
Cochrane Central Register of Controlled Trials (CENTRAL, part of the Cochrane Library)
#1[mh "Vitamin A"]
#2"Vitamin A" or retinol* or "Aquasol A" or retinal
#3#1 or #2
#4MeSH descriptor: [Child] explode all trees
#5MeSH descriptor: [Infant] this term only
#6(baby or babies or infant* or toddler* or child* or (pre next school*) or preschool* or girl* or boy*)
#7#4 or #5 or #6
#8#3 and #7 Publication Year from 2010 to 2016, in Trials
Ovid MEDLINE(R)
1 exp Vitamin A/
2 (retinol$ or retinal$ or aquasol a or vitamin a).tw.
3 or/1‐2
4 Infant/
5 exp Child/
6 (baby or babies or infant$ or toddler$ or child$ or girl$ or boy$ or pre school$ or pre‐school$ or preschool$).tw.
7 or/4‐6
8 randomized controlled trial.pt.
9 controlled clinical trial.pt.
10 randomi#ed.ab.
11 placebo$.ab.
12 drug therapy.fs.
13 randomly.ab.
14 trial.ab.
15 groups.ab.
16 or/8‐15
17 exp animals/ not humans.sh.
18 16 not 17
19 3 and 7 and 18
20 limit 19 to ed=20100401‐20160218
Ovid MEDLINE(R) In‐Process & Other Non‐Indexed Citations
1 (retinol$ or retinal$ or aquasol a or vitamin a).tw.
2 (baby or babies or infant$ or toddler$ or child$ or girl$ or boy$ or pre school$ or pre‐school$ or preschool$).tw.
3 1 and 2
4 random$.tw.
5 placebo$.tw.
6 trial.tw.
7 groups.tw.
8 (crossover or cross‐over).tw.
9 ((singl$ or doubl$ or tripl$ or trebl$) adj1 (blind$ or mask$)).tw.
10 prospective.tw.
11 factorial$.tw.
12 assign$.ab.
13 allocat$.ab.
14 or/4‐13
15 3 and 14
16 remove duplicates from 15
Embase (Ovid)
1 retinol/
2 (retinol$ or retinal$ or aquasol a or vitamin a).tw.
3 or/1‐2
4 exp child/
5 (baby or babies or infant$ or toddler$ or child$ or girl$ or boy$ or pre school$ or pre‐school$ or preschool$).tw.
6 or/4‐5
7 Randomized controlled trial/
8 controlled clinical trial/
9 Single blind procedure/
10 Double blind procedure/
11 triple blind procedure/
12 Crossover procedure/
13 (crossover or cross‐over).tw.
14 ((singl$ or doubl$ or tripl$ or trebl$) adj1 (blind$ or mask$)).tw.
15 Placebo/
16 placebo.tw.
17 prospective.tw.
18 factorial$.tw.
19 random$.tw.
20 assign$.ab.
21 allocat$.tw.
22 volunteer$.ab.
23 or/7‐22
24 exp animals/ or exp invertebrate/ or animal experiment/ or animal model/ or animal tissue/ or animal cell/ or nonhuman/
25 human/ or normal human/ or human cell/
26 24 and 25
27 24 not 2
28 23 not 27
29 3 and 6 and 28
30 limit 29 to yr="2010 ‐Current"
31 remove duplicates from 30
Science Citation Index‐Expanded (SCI, Web of Science) and Conference Proceedings Citation Index‐Science (CPCI‐S, Web of Science)
#5 #4 AND #3
DocType=All document types; Language=All languages;
#4 TS=(random* or placebo* or trial )
DocType=All document types; Language=All languages;
#3 #2 AND #1
DocType=All document types; Language=All languages;
#2 TS=(baby or babies or infant* or toddler* or child* or girl* or boy* or "pre school*" or pre‐school* or preschool*)
DocType=All document types; Language=All languages;
#1 TS=(retinol or "vitamin a")
DocType=All document types; Language=All languages;
Cochrane Database of Systematic Reviews (CDSR, part of the Cochrane Library) and Database of Abstracts of Reviews of Effects (DARE, part of the Cochrane Library)
#1 [mh "Vitamin A"]
#2 ("Vitamin A" or retinol* or "Aquasol A"):ti,ab,kw
#3 #1 or #2
#4 MeSH descriptor: [Child] explode all trees
#5 MeSH descriptor: [Infant] 1 tree(s) exploded
#6 (baby or babies or infant* or toddler* or child* or (pre next school*) or preschool* or girl* or boy*):ti,ab,kw
#7 #4 or #5 or #6
#8 #3 and #7 in Cochrane Reviews (Reviews and Protocols) and Other Reviews
Latino Americana e do Caribe em Ciências da Saúde (LILACS, bases.bireme.br/cgi‐bin/wxislind.exe/iah/online/)
(Mh vitamin a or tw retinol$ or tw aquasol$ or tw retinal$ ) AND ( Mh Child OR Mh Infant or Mh Child,preschool or Tw baby or Tw babies or Tw child$ or Tw infant$ or Tw toddler$ or Tw girl$ or Tw boy$ or Tw prescshool$ or Tw pre‐school$ or Tw niño or Tw niños or Tw niña or Tw niñas or Tw bebé or Tw bebés or Tw preescolar or Tw prescolares) [Words] and ((Pt randomized controlled trial OR Pt controlled clinical trial OR Mh randomized controlled trials OR Mh random allocation OR Mh double‐blind method OR Mh single‐blind method) AND NOT (Ct animal AND NOT (Ct human and Ct animal)) OR (Pt clinical trial OR Ex E05.318.760.535$ OR (Tw clin$ AND (Tw trial$ OR Tw ensa$ OR Tw estud$ OR Tw experim$ OR Tw investiga$)) OR ((Tw singl$ OR Tw simple$ OR Tw doubl$ OR Tw doble$ OR Tw duplo$ OR Tw trebl$ OR Tw trip$) AND (Tw blind$ OR Tw cego$ OR Tw ciego$ OR Tw mask$ OR Tw mascar$)) OR Mh placebos OR Tw placebo$ OR (Tw random$ OR Tw randon$ OR Tw casual$ OR Tw acaso$ OR Tw azar OR Tw aleator$) OR Mh research design) AND NOT (Ct animal AND NOT (Ct human and Ct animal)) OR (Ct comparative study OR Ex E05.337$ OR Mh follow‐up studies OR Mh prospective studies OR Tw control$ OR Tw prospectiv$ OR Tw volunt$ OR Tw volunteer$) AND NOT (Ct animal AND NOT (Ct human and Ct animal))) [Words] and (2010 OR 2011 OR 2012 OR 2013 OR 2014 OR 2015 OR 2016) [Country, year publication]
African Index Medicus (indexmedicus.afro.who.int/cgi‐bin/wxis.exe/iah/)
Retinol$ or retinal$ or aquasol$ or vitamin a [Descriptor] and 2010 OR 2011 OR 2012 OR 2013 OR 2014 OR 2015 OR 2016 [Publication Year]
World Health Organization International Clinical Trials Registry Platform (WHO ICTRP, apps.who.int/trialsearch/)
Advanced search: Intervention : Vitamin A AND Clinical Trials in Children AND Recruitment status: all (105)
Standard search: Vitamin A AND child OR Vitamin A AND babies OR Vitamin A AND infants (46)
The records from each of these searches were imported and deduplicated in Excel (148 records)
ClinicalTrials.gov
Advanced search: Intervention : Vitamin A AND Age Group: child
Appendix 2. Record of searches 2016
| Database | Search date | Database date range/issue/version | Number of records | Limits applied |
| CENTRAL | 01 March 2016 | 2016 Issue 2 | 465 | Year=2010‐2016 |
| MEDLINE Ovid | 01 March 2016 | 1946 to February Week 3 2016 | 1150 | ed=20100401‐20160218 |
| MEDLINE In‐Process Ovid | 01 March 2016 | February 29, 2016 | 143 | No limits |
| Embase OVID | 01 March 2016 | 1980 to 2016 Week 09 | 1157 | Year="2010 ‐Current" |
| Science Citation Index ‐ Expanded (Web of Science) | 01 March 2016 | 1970 to 27 February 2016 | 1774 | No limits. Not searched previously |
| Conference Proceedings Citation Index ‐Science (Web of Science) | 01 March 2016 | 1990 to 27 February 2016 | 156 | No limits. Not searched previously |
| LILACS (lilacs.bvsalud.org/en) | 01 March 2016 | all available years | 51 | Year=2010‐2016 |
| African Index Medicus (indexmedicus.afro.who.int/cgi‐bin/wxis.exe/iah) | 01 March 2016 | all available years | 8 | Year=2010‐2016 |
| Cochrane Database of Systematic Reviews | 01 March 2016 | 2016 Issue 2 | 30 | No limits. Not searched previously |
| Database of Abstracts of Reviews of Effects | 01 March 2016 | 2015 Issue 2 | 20 | No limits. Not searched previously |
| ClinicalTrials.gov (clinicaltrials.gov) | 01 March 2016 | all available years | 126 | After deduplication with ICTRP records |
| WHO ICTRP (apps.who.int/trialsearch) | 01 March 2016 | all available years | 148 | No limits. Not searched previously |
| Total number of records | 5236 | |||
Footnotes
CENTRAL: Cochrane Central Register of Controlled Trials.
WHO ICTRP: World Health Organization International Clinical Trials Registry Platform
WoS: Web of Science.
Appendix 3. Search strategies 2010
CENTRAL
27 April 2010
#1 MeSH descriptor Child explode all trees
#2 MeSH descriptor Infant explode all trees
#3 MeSH descriptor Child, Preschool explode all trees
#4 (baby or babies or infant* or toddler* or child* or (pre next school*) or preschool* or girl* or boy*):ti,ab,kw
#5 (#1 OR #2 OR #3 OR #4)
#6 MeSH descriptor Vitamin A explode all trees
#7 retinol* or retinal$ or “aquasol a” or “vitamin a”
#8 (#6 OR #7)
#9 (#5 AND #8)
Ovid MEDLINE
1950 to April Week 2 2010
1 exp infant/ or exp child/ or exp child, preschool/
2 (baby or babies or infant$ or toddler$ or child$ or girl$ or boy$ or pre school$ or pre‐school$ or preschool$).tw.
3 1 or 2
4 exp Vitamin A/
5 (retinol$ or retinal$ or aquasol a or vitamin a).ab,ti.
6 4 or 5
7 randomised controlled trial.pt.
8 controlled clinical trial.pt.
9 randomized.ab.
10 placebo.ab.
11 drug therapy.fs.
12 randomly.ab.
13 trial.ab.
14 groups.ab.
15 7 or 8 or 9 or 10 or 11 or 12 or 13 or 14
16 exp animals/ not humans.sh.
17 15 not 16
18 3 and 6 and 17
Embase
1980 to 2010 Week 16
EMTREE index terms were used when possible. The UK Cochrane Centre suggested that a combination of EMTREE and free‐text words were used to search for randomized controlled trials.
1 exp infant/ or exp child/ or exp child, preschool/
2 (baby or babies or infant$ or toddler$ or child$ or girl$ or boy$ or pre school$ or pre‐school$ or preschool$).tw.
3 1 or 2
4 exp Vitamin A/
5 (retinol$ or retinal$ or aquasol a or vitamin a).ab,ti.
6 4 or 5
7 exp crossover‐procedure/ or exp double‐blind procedure/ or exp randomized controlled trial/ or exp single‐blind procedure/
8 (random$ or factorial$ or crossover$ or cross over$ or cross‐over$ or placebo$ or (doubl$ adj blind$) or (singl$ adj blind$) or assign$ or allocat$ or volunteer$).mp.
9 7 or 8
10 3 and 6 and 9
Global Health
1973 to March 2010
For the search of Global Health database, replacement subject headings mapped to the Global Health database were used when possible, otherwise the text was used similar to the MEDLINE searches conducted previously.
1 exp school children/ or exp children/ or exp preschool children/
2 (baby or babies or infant$ or toddler$ or child$ or girl$ or boy$ or pre school$ or pre‐school$ or preschool$).tw.
3 1 or 2
4 retinol.sh.
5 (retinol$ or retinal$ or aquasol a or vitamin a).ab,ti.
6 4 or 5
7 exp randomized controlled trials/ or exp clinical trials/
8 random*.mp.
9 placebo.mp.
10 trial.mp.
11 7 or 8 or 9 or 10
12 3 and 6 and 11
LILACS
27 April 2010
Mh vitamin a or tw retinol$ or tw aquasol$ or tw retinal$ [Words] AND [Tw baby or Tw babies or Tw child$ or Tw infant$ or Tw toddler$ or Tw girl$ or Tw boy$ or Tw prescshool$ or Tw pre‐school$ or Tw niño or Tw niños or Tw niña or Tw niñas or Tw bebé or Tw bebés or Tw preescolar or Tw prescolares [Words] AND ((Pt randomized controlled trial OR Pt controlled clinical trial OR Mh randomized controlled trials OR Mh random allocation OR Mh double‐blind method OR Mh single‐blind method) AND NOT (Ct animal AND NOT (Ct human and Ct animal)) OR (Pt clinical trial OR Ex E05.318.760.535$ OR (Tw clin$ AND (Tw trial$ OR Tw ensa$ OR Tw estud$ OR Tw experim$ OR Tw investiga$)) OR ((Tw singl$ OR Tw simple$ OR Tw doubl$ OR Tw doble$ OR Tw duplo$ OR Tw trebl$ OR Tw trip$) AND (Tw blind$ OR Tw cego$ OR Tw ciego$ OR Tw mask$ OR Tw mascar$)) OR Mh placebos OR Tw placebo$ OR (Tw random$ OR Tw randon$ OR Tw casual$ OR Tw acaso$ OR Tw azar OR Tw aleator$) OR Mh research design) AND NOT (Ct animal AND NOT (Ct human and Ct animal)) OR (Ct comparative study OR Ex E05.337$ OR Mh follow‐up studies OR Mh prospective studies OR Tw control$ OR Tw prospectiv$ OR Tw volunt$ OR Tw volunteer$) AND NOT (Ct animal AND NOT (Ct human and Ct animal))) [Words]
metaRegister of Controlled Trials
27 April 2010
(baby or babies or infant or child) and (vitamin a or aquasol or retinol or retinal)
African Index Medicus
27 April 2010
1. retinol$ or retinal$ or aquasol a or vitamin a [Descriptor]
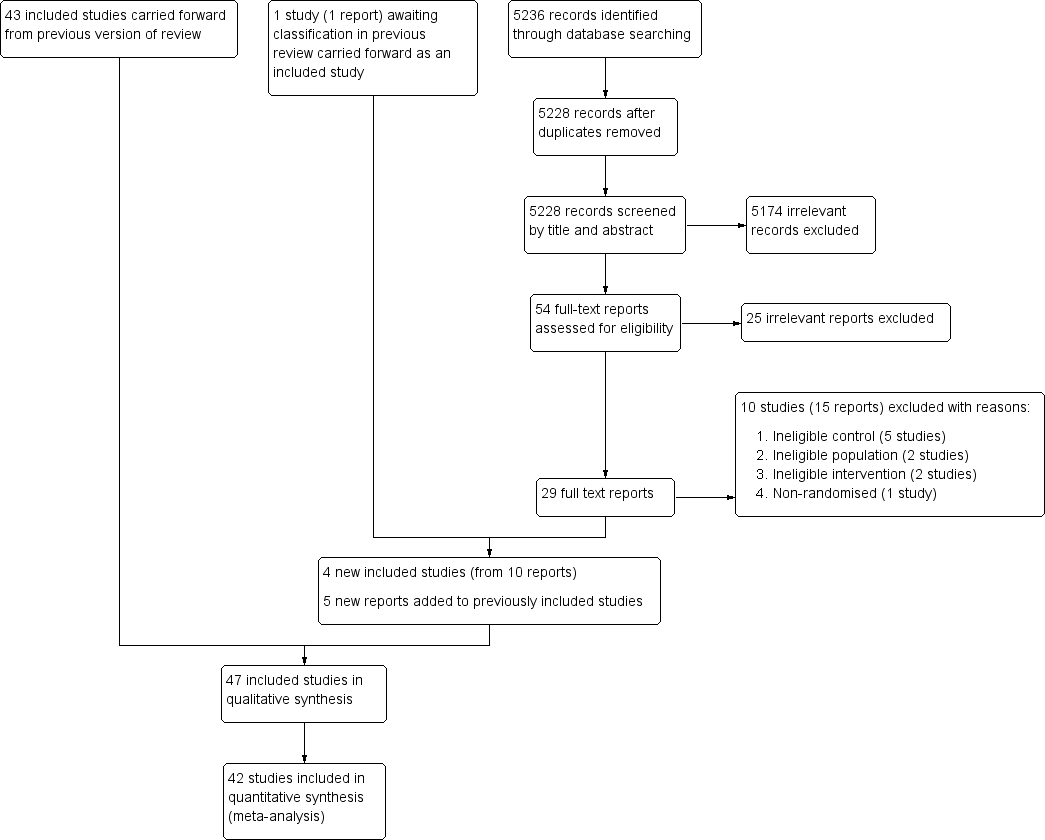
Study flow diagram.
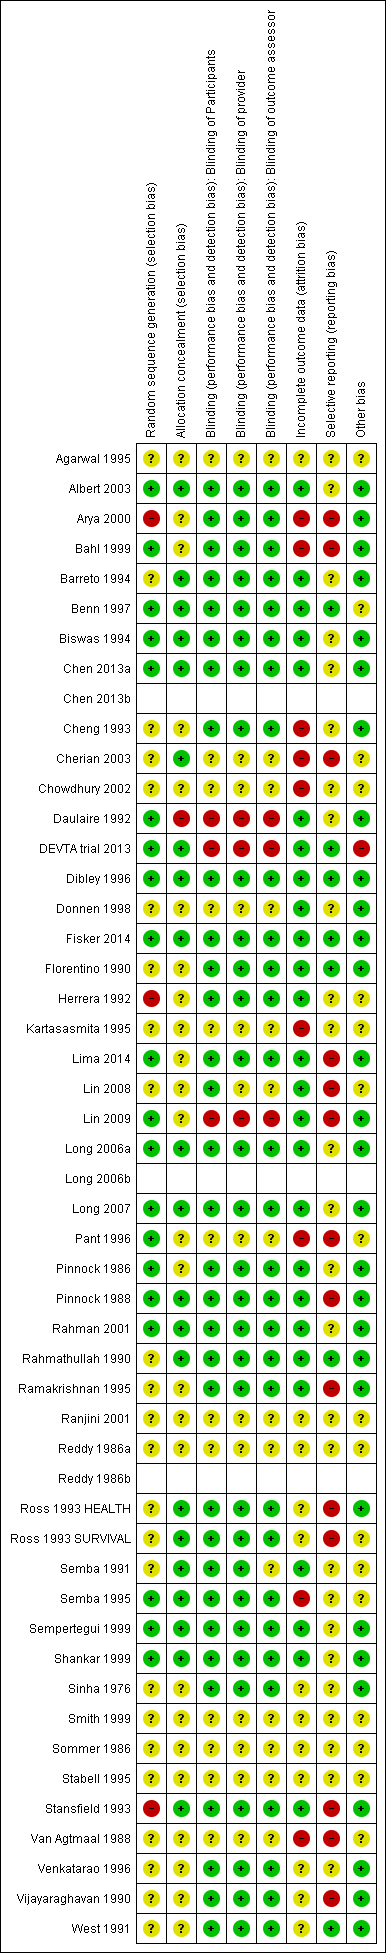
Risk of bias summary: review authors' judgements about each risk of bias item for each included study.
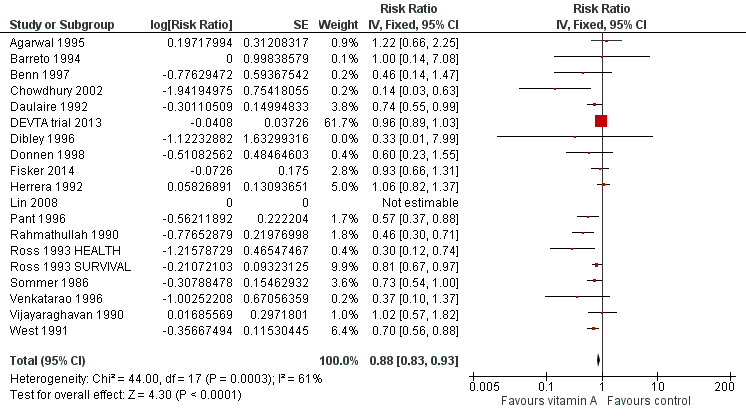
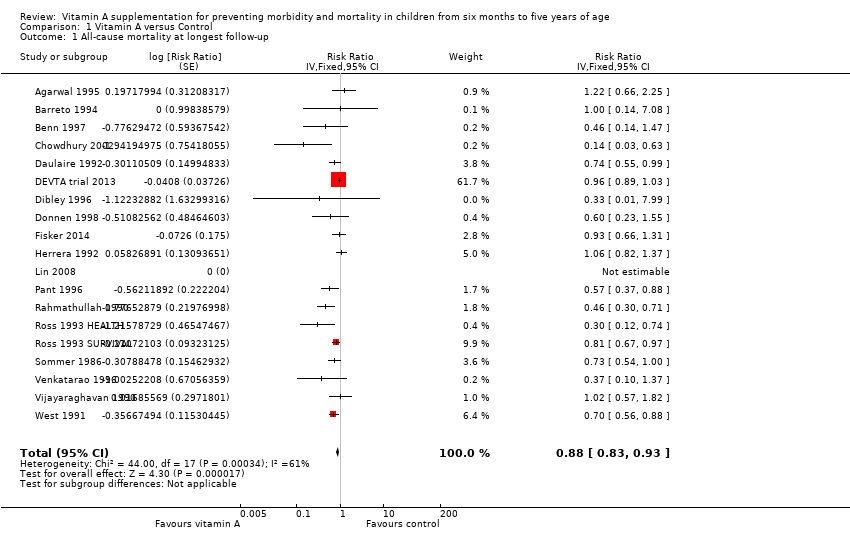
Forest plot of comparison: 1 Vitamin A versus Control, outcome: 1.1 All‐cause mortality at longest follow‐up.
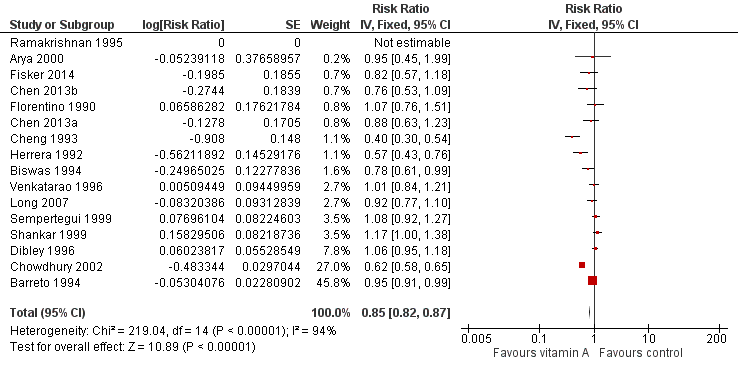
Forest plot of comparison: 1 Vitamin A versus Control, outcome: 1.8 Diarrhoea incidence at longest follow‐up.
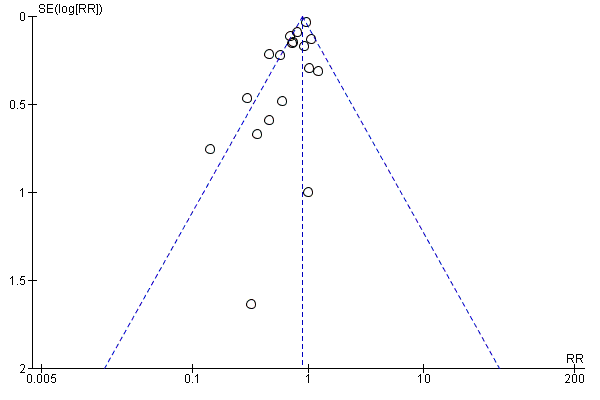
Funnel plot of comparison: 1 Vitamin A versus Control, outcome: 1.1 All‐cause mortality at longest follow‐up.
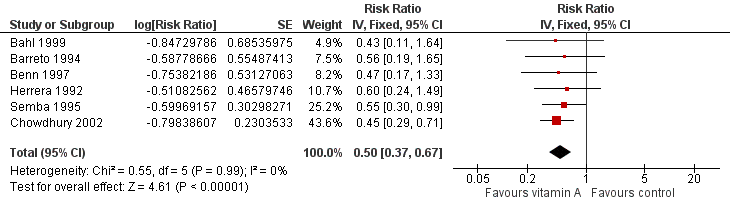
Forest plot of comparison: 1 Vitamin A versus Control, outcome: 1.12 Measles Incidence at Longest Follow‐up.
Comparison 1 Vitamin A versus Control, Outcome 1 All‐cause mortality at longest follow‐up.
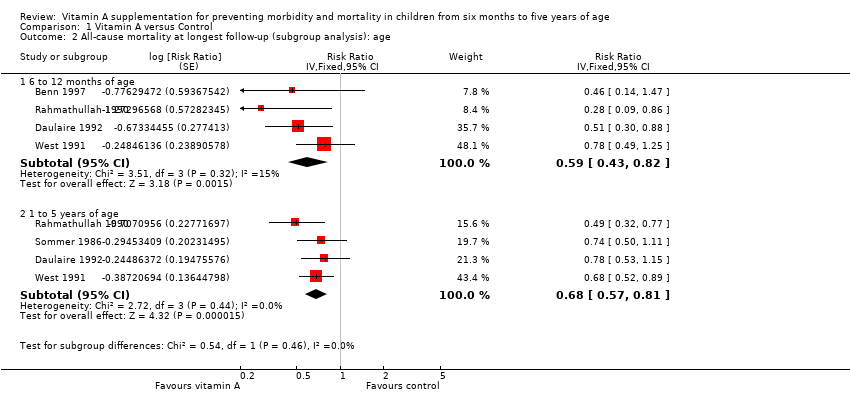
Comparison 1 Vitamin A versus Control, Outcome 2 All‐cause mortality at longest follow‐up (subgroup analysis): age.
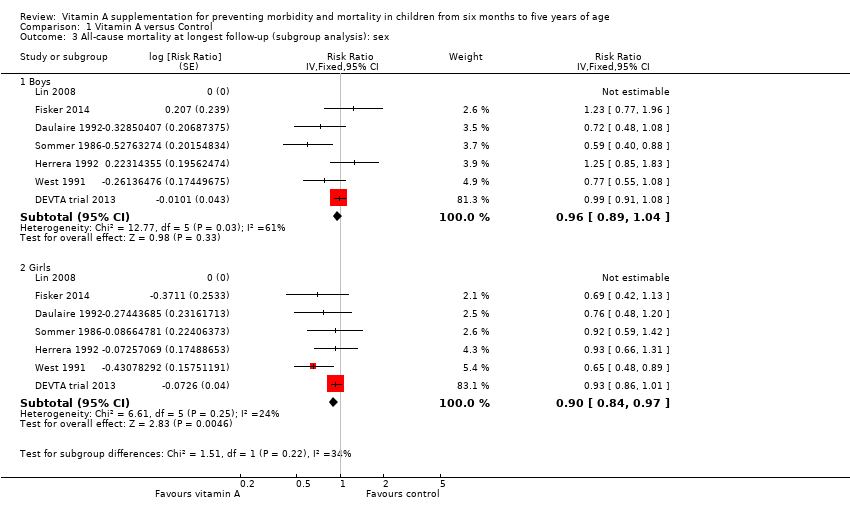
Comparison 1 Vitamin A versus Control, Outcome 3 All‐cause mortality at longest follow‐up (subgroup analysis): sex.
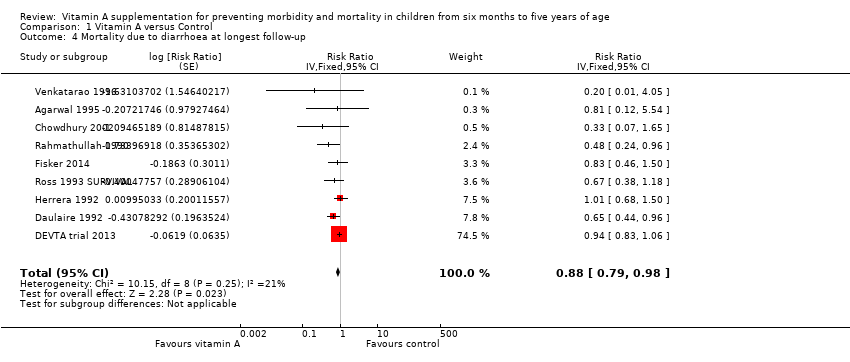
Comparison 1 Vitamin A versus Control, Outcome 4 Mortality due to diarrhoea at longest follow‐up.
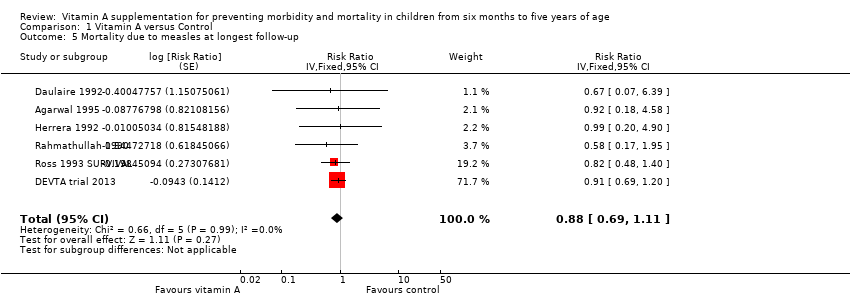
Comparison 1 Vitamin A versus Control, Outcome 5 Mortality due to measles at longest follow‐up.
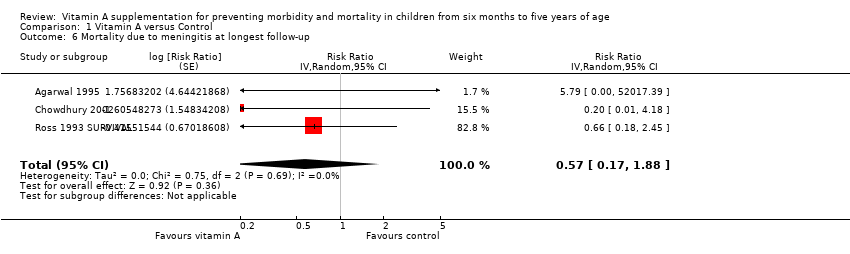
Comparison 1 Vitamin A versus Control, Outcome 6 Mortality due to meningitis at longest follow‐up.
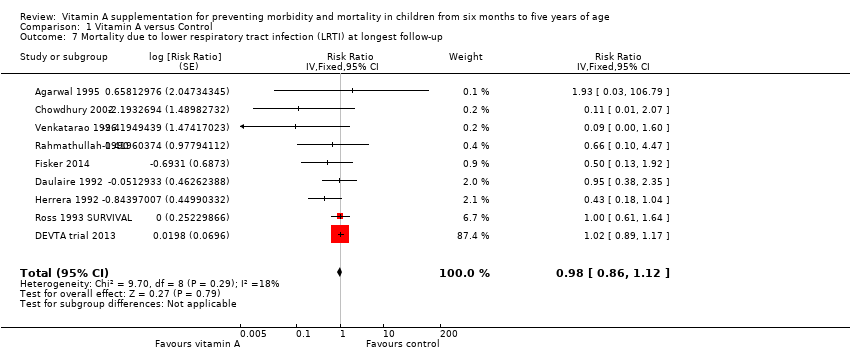
Comparison 1 Vitamin A versus Control, Outcome 7 Mortality due to lower respiratory tract infection (LRTI) at longest follow‐up.
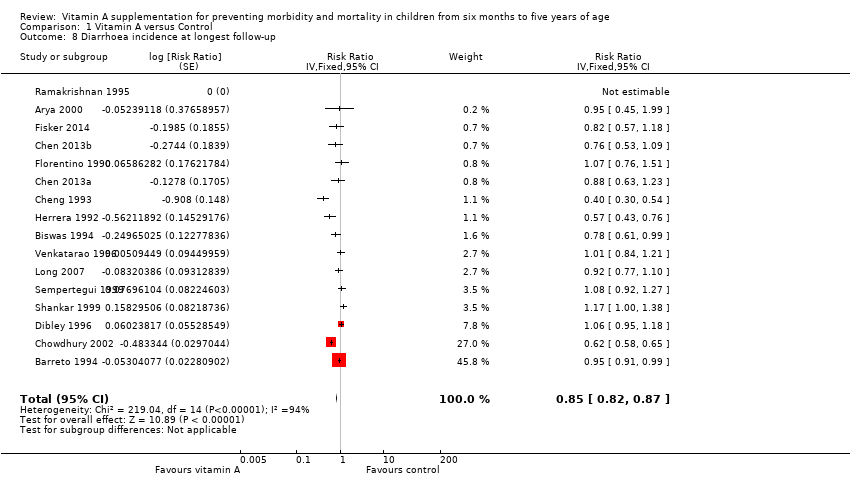
Comparison 1 Vitamin A versus Control, Outcome 8 Diarrhoea incidence at longest follow‐up.
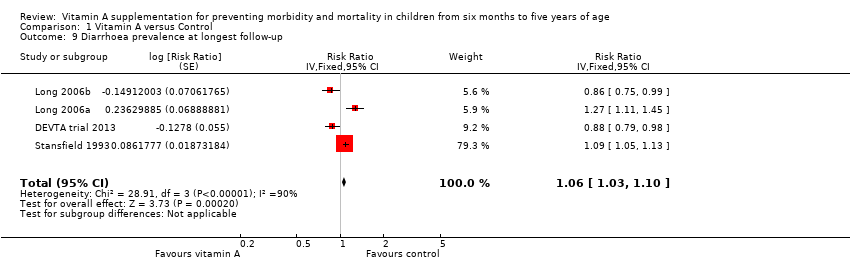
Comparison 1 Vitamin A versus Control, Outcome 9 Diarrhoea prevalence at longest follow‐up.
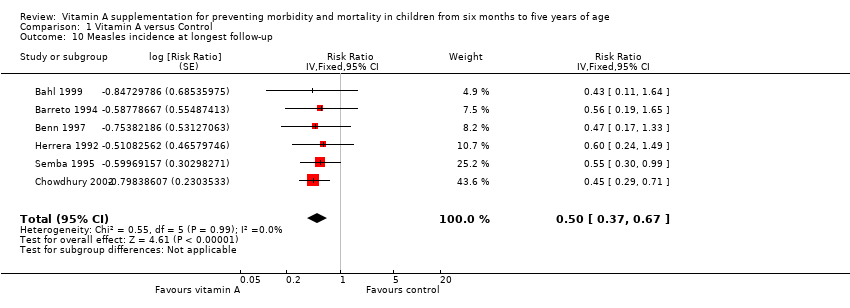
Comparison 1 Vitamin A versus Control, Outcome 10 Measles incidence at longest follow‐up.
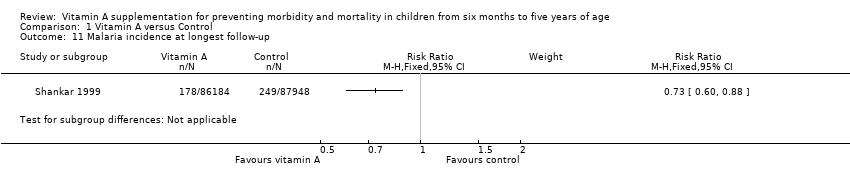
Comparison 1 Vitamin A versus Control, Outcome 11 Malaria incidence at longest follow‐up.
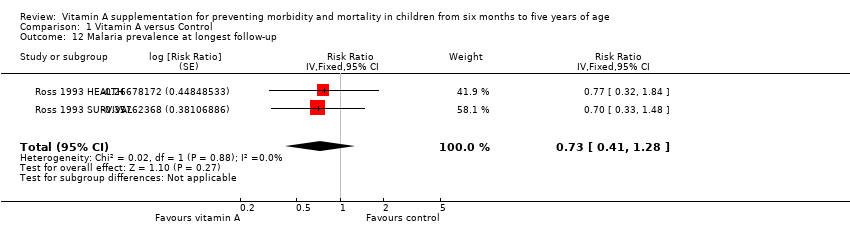
Comparison 1 Vitamin A versus Control, Outcome 12 Malaria prevalence at longest follow‐up.
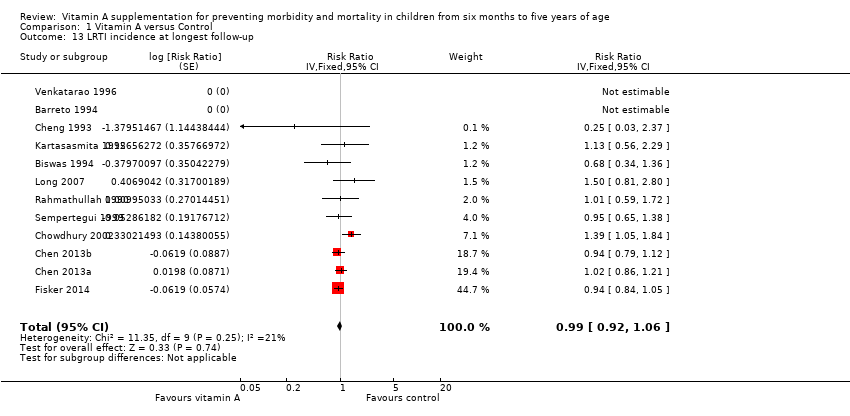
Comparison 1 Vitamin A versus Control, Outcome 13 LRTI incidence at longest follow‐up.
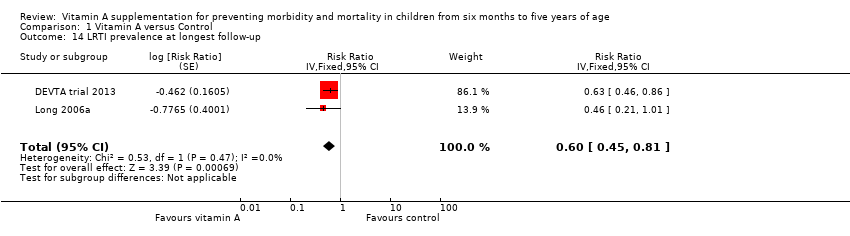
Comparison 1 Vitamin A versus Control, Outcome 14 LRTI prevalence at longest follow‐up.
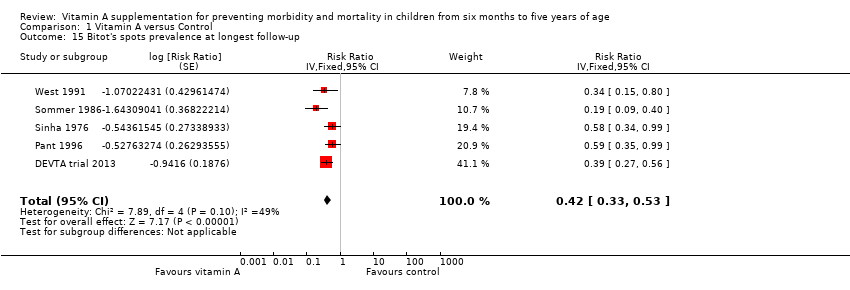
Comparison 1 Vitamin A versus Control, Outcome 15 Bitot's spots prevalence at longest follow‐up.
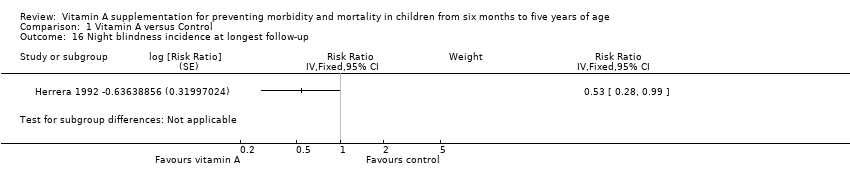
Comparison 1 Vitamin A versus Control, Outcome 16 Night blindness incidence at longest follow‐up.
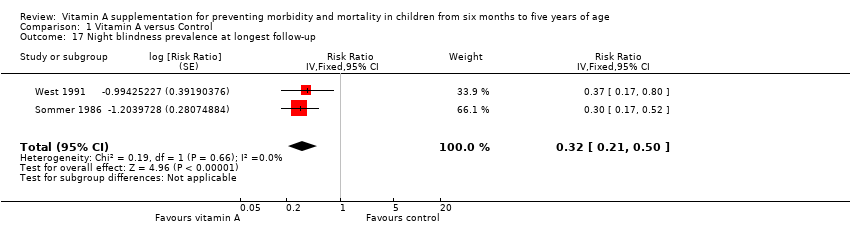
Comparison 1 Vitamin A versus Control, Outcome 17 Night blindness prevalence at longest follow‐up.
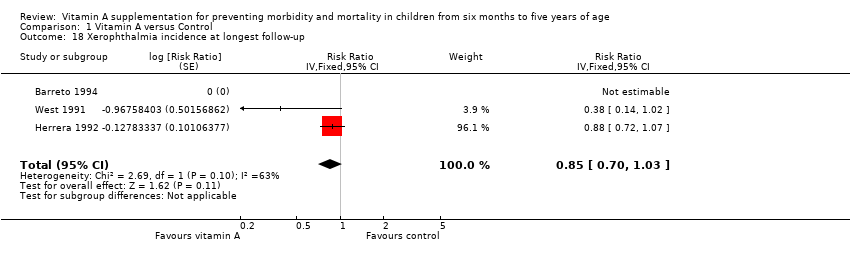
Comparison 1 Vitamin A versus Control, Outcome 18 Xerophthalmia incidence at longest follow‐up.
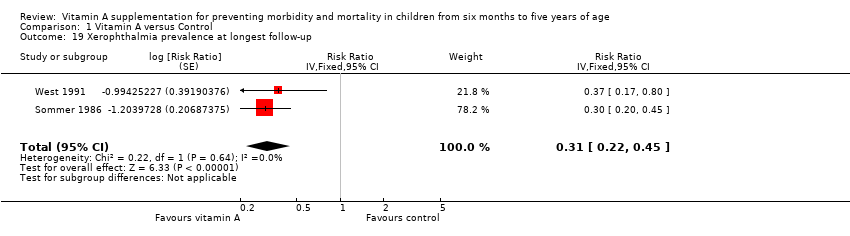
Comparison 1 Vitamin A versus Control, Outcome 19 Xerophthalmia prevalence at longest follow‐up.
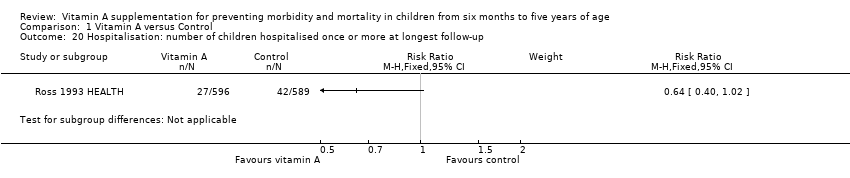
Comparison 1 Vitamin A versus Control, Outcome 20 Hospitalisation: number of children hospitalised once or more at longest follow‐up.

Comparison 1 Vitamin A versus Control, Outcome 21 Hospitalisation due to diarrhoea at longest follow‐up.
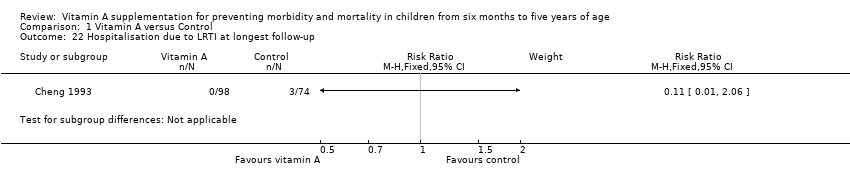
Comparison 1 Vitamin A versus Control, Outcome 22 Hospitalisation due to LRTI at longest follow‐up.
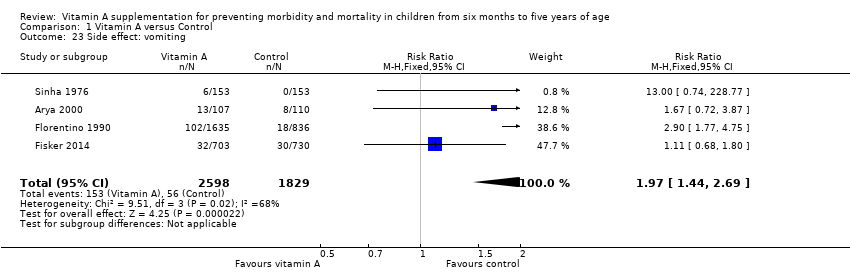
Comparison 1 Vitamin A versus Control, Outcome 23 Side effect: vomiting.
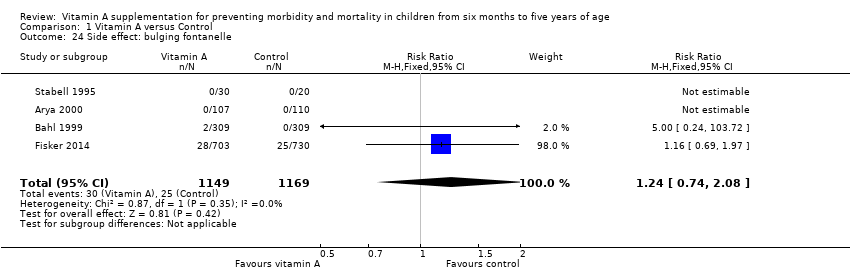
Comparison 1 Vitamin A versus Control, Outcome 24 Side effect: bulging fontanelle.
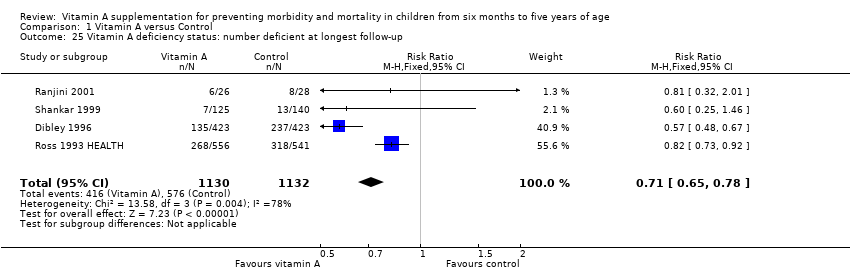
Comparison 1 Vitamin A versus Control, Outcome 25 Vitamin A deficiency status: number deficient at longest follow‐up.
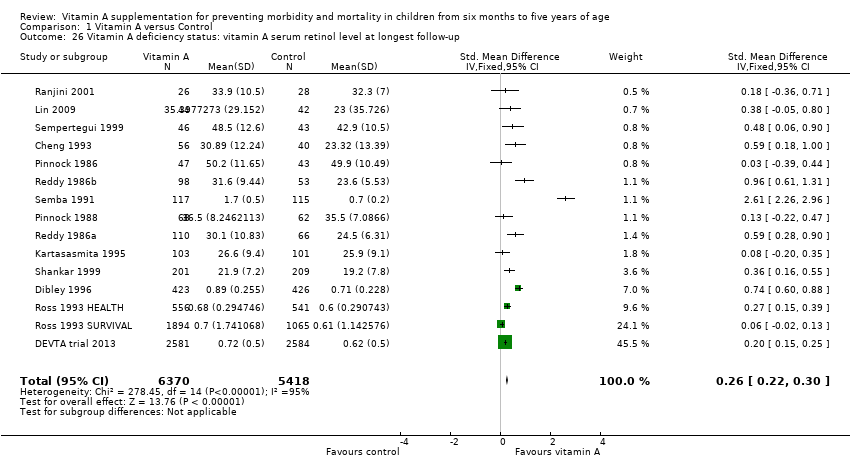
Comparison 1 Vitamin A versus Control, Outcome 26 Vitamin A deficiency status: vitamin A serum retinol level at longest follow‐up.
| Vitamin A supplementation for preventing morbidity and mortality in children from 6 months to 5 years of age | ||||||
| Patient or population: children aged between 6 months and 5 years Intervention: vitamin A supplementation Comparison: placebo or usual care | ||||||
| Outcomes | Illustrative comparative risks* (95% CI) | Relative effect | Number of participants | Quality of the evidence | Comments | |
| Assumed risk | Corresponding risk | |||||
| Control | Vitamin A | |||||
| All‐cause mortality Follow‐up: 12‐96 weeks | Study population | RR 0.88 (0.83 to 0.93) | 1,202,382 (19 studies) | ++++ | Random‐effects RR 0.76 (95% CI 0.66 to 0.88) | |
| 26 per 1000a | 23 per 1000 (22 to 24) | |||||
| Mortality due to diarrhoea Follow‐up: 48‐104 weeks | Study population | RR 0.88, (0.79 to 0.98) | 1,098,538 | ++++ | Total number of participants reflects number randomised to studies. The analysis combined cumulative risk and risk per 1000 years follow‐up | |
| 8 per 1000a | 7 per 1000 (6 to 8) | |||||
| Mortality due to measles Follow‐up: 52 to 104 weeks | Study population | RR 0.88, (0.69 to 1.11) | 1,088,261 | ++OO Lowc,d | Total number of participants reflects number randomised to studies. The analysis combined cumulative risk and risk per 1000 years follow‐up | |
| 2 per 10,000a | 2 per 1000 (1 to 2) | |||||
| Mortality due to LRTI Follow‐up: 48‐104 weeks | Study population | RR 0.98, (0.86 to 1.12) | 1,098,538 | ++OO | Total number of participants reflects number randomised to studies. The analysis combined cumulative risk and risk per 1000 years follow‐up | |
| 4 per 10,000a | 4 per 1000 (3 to 5) | |||||
| Diarrhoea incidence Mean episodes per child per year | Study population | Rate ratio 0.85, 95% CI 0.82 to 0.87 | 77,946 | ++OO | — | |
| Mean episodes of diarrhoea in control group: 4.0 per child per yeare | VAS led to 3 fewer episodes of diarrhoea per child per year (3 to 4 fewer episodes) | |||||
| Measles incidence Mean episodes of measles per child per year | Study population | Rate ratio 0.50, 95% CI 0.37 to 0.67 | 19,566 | ++O Moderatec | — | |
| Mean episodes of measles in control group: 0.2 per child per yeare | VAS led to 0.015 fewer episodes per child per year (0.019 events fewer per child to 0.01 events fewer per child) | |||||
| LRTI incidence Mean episodes per child per year | Study population | Rate ratio 0.99, 95% CI 0.92 to 1.06 | 27, 540 | ++OO Lowc,d | — | |
| Mean episodes of LRTI in control group: 0.1 episodes per child per yeare | VAS led to 0.1 more episodes of LRTI per child per year (0.1 fewer episodes to 0.1 more episodes) | |||||
| Bitot's spots incidence Follow‐up: mean 80.72 weeks | Study population | RR 0.42, 95% CI 0.33 to 0.53 | 1,063,278 | +++O Moderatec | — | |
| 35 per 1000a | 15 per 1000 (12 to 19) | |||||
| Night blindness incidence Follow‐up: 52 to 68 weeks | Study population | RR 0.32, 95% CI 0.21 to 0.50 | 22,972 (2 studies) | +++O Moderatec | — | |
| 4 per 1000g | 1 per 1000 (1 to 2) | |||||
| Vitamin A deficiency Follow‐up: mean 54.5 weeks | Study population | RR 0.71, 95% CI 0.65 to 0.78 | 2262 | +++O | — | |
| 509 per 1000g | 361 per 1000 (331 to 397) | |||||
| Vomiting Follow‐up: 0.14 to 52 weeks | Study population | RR 1.97, 95% CI 1.44 to 2.69 | 10541 | +++O | — | |
| 31 per 1000g | 61 per 1000 (45 to 83) | |||||
| *The basis for the assumed risk (for example, the median control group risk across studies) is provided in footnotes. The corresponding risk (and its 95% CI) is based on the assumed risk in the comparison group and the relative effect of the intervention (and its 95% CI). | ||||||
| GRADE Working Group grades of evidence | ||||||
| aBased on control group mortality risk in DEVTA trial 2013. | ||||||
| Outcome or subgroup | Studies | Heterogeneity | Statistical Method | Effect estimate | Test for subgroup differences (P value) |
| All‐cause mortality, outcomes < 1 year since randomisation | 13 | Chi2 = 34.29, df = 12; P < 0.001; I2 = 65% | Risk ratio (GIV, fixed, 95% CI) | 0.83 (0.75 to 0.92) | NA |
| All‐cause mortality, outcomes 13 months to 59 months since randomisation | 6 | Chi2 = 15.75, df = 5; P < 0.001; I2 = 68% | Risk ratio (GIV, fixed, 95% CI) | 0.88 (0.81 to 0.97) | NA |
| All‐cause mortality at longest follow‐up (subgroup analysis): Asia | 12 | Chi2 = 42.65, df = 10; P < 0.001; I2 = 77% | Risk ratio (GIV, fixed, 95% CI) | 0.90 (0.84 to 0.96) | 0.83 |
| All‐cause mortality at longest follow‐up (subgroup analysis): Africa | 6 | Chi2 = 10.06, df = 5; P = 0.07; I2 = 50% | Risk ratio (GIV, fixed, 95% CI) | 0.86 (0.75 to 0.98) | |
| All‐cause mortality at longest follow‐up (subgroup analysis): Latin America | 1 | NA | Risk ratio (GIV, fixed, 95% CI) | 1.00 (0.14 to 7.08) | |
| All‐cause mortality at longest follow‐up, by national child mortality rate (subgroup analysis): high (> 40/1000) | 17 | Chi2 = 53.07, df = 16 (P < 0.001; I2 = 70% | Risk ratio (GIV, fixed, 95% CI) | 0.89 (0.84 to 0.94) | 0.9 |
| All‐cause mortality at longest follow‐up, by national child mortality rate (subgroup analysis): low (< 40/1000) | 2 | NA | Risk ratio (GIV, fixed, 95% CI) | 1.00 (0.14 to 7.08) | |
| All‐cause mortality at longest follow‐up (sensitivity analysis): random‐effects model | 19 | Tau2 = 0.04; Chi2 = 44.00, df = 17; P = 0.001; I2 = 61% | Risk ratio (GIV, fixed, 95% CI) | 0.76 (0.66 to 0.88) | NA |
| All‐cause mortality at longest follow‐up (sensitivity analysis): without DEVTA trial | 18 | Chi2 = 30.38, df = 16; P = 0.02; I2 = 47% | Risk ratio (GIV, fixed, 95% CI) | 0.77 (0.70 to 0.84) | NA |
| All‐cause mortality at longest follow‐up (sensitivity analysis): ICC = 0.002 (assumes no impact of clustering for studies with unknown ICC) | 19 | Chi2 = 57.02, df = 16; P < 0.001; I2 = 72% | Risk ratio (GIV, fixed, 95% CI) | 0.89 (0.84, 0.94) | NA |
| All‐cause mortality at longest follow‐up (sensitivity analysis): ICC = 0.010 (assumes high impact of clustering for studies with unknown ICC) | 19 | Chi2 = 47.87, df = 16; P < 0.001; I2 = 67% | Risk ratio (GIV, fixed, 95% CI) | 0.89 (0.84 to 0.94) | NA |
| Mortality due to diarrhoea, outcomes < 1 year since randomisation | 6 | Chi2 = 5.23, df = 5; P = 0.39; I2 = 4% | Risk ratio (GIV, fixed, 95% CI) | 0.76 (0.61 to 0.95) | NA |
| Mortality due to measles, outcomes < 1 year since randomisation | 4 | Chi2 = 0.52, df = 3; P = 0.91; I2 = 0% | Risk ratio (GIV, fixed, 95% CI) | 0.85 (0.52 to 1.37) | NA |
| Mortality due to meningitis, outcomes < 1 year since randomisation | 1 | NA | Risk ratio (GIV, fixed, 95% CI) | 5.79 (0.22 to 153.24) | NA |
| Mortality due to LRTI, outcomes < 1 year since randomisation | 6 | Chi2 = 5.66, df = 5; P = 0.34; I2 = 12% | Risk ratio (GIV, fixed, 95% CI) | 0.66 (0.40 to 1.10) | NA |
| Diarrhoea incidence at longest follow‐up (sensitivity analysis): analysis without studies Cheng 1993; Chowdhury 2002 | 13 | Heterogeneity: chi2 = 30.71, df = 12; P = 0.002; I2 = 61% | Risk ratio (GIV, fixed, 95% CI) | 0.96 (0.93 to 1.00) | NA |
| Diarrhoea incidence, outcomes < 1 year since randomisation | 13 | Chi2 = 51.64, df = 11; P < 0.001; I2 = 79% | Risk ratio (GIV, fixed, 95% CI) | 0.93 (0.89 to 0.96) | NA |
| Diarrhoea incidence at longest follow‐up (sensitivity analysis): random‐effects model | 15 | Tau2 = 0.07; Chi2 = 219.04, df = 14; P < 0.001; I2 = 94% | Risk ratio (GIV, random, 95% CI) | 0.84 (0.73, 0.98) | NA |
| Measles incidence, outcomes < 1 year since randomisation | 5 | Chi2 = 0.24, df = 4; P = 0.99; I2 = 0% | Risk ratio (GIV, fixed, 95% CI) | 0.54 (0.36 to 0.80) | NA |
| Malaria incidence, outcomes 1 + years since randomisation (subgroup analysis): age | 1 | NA | Risk ratio (M‐H, fixed, 95% CI) | 0.73 (0.60 to 0.88) | NA |
| LRTI Incidence, outcomes < 1 year since randomisation | 11 | Chi2 = 5.23, df = 8; P = 0.73; I2 = 0% | Risk ratio (GIV, fixed, 95% CI) | 0.96 (0.89 to 1.04) | NA |
| Bitot's spots incidence, outcomes < 1 year since randomisation | 1 | NA | Risk ratio (GIV, fixed, 95% CI) | 0.93 (0.76 to 1.14) | NA |
| Bitot's spots prevalence, outcomes < 1 year since randomisation | 3 | Chi2 = 6.06, df = 2; P = 0.05; I2 = 67% | Risk ratio (GIV, fixed, 95% CI) | 0.43 (0.33 to 0.56) | NA |
| Night blindness prevalence, outcomes < 1 year since randomisation | 1 | NA | Risk ratio (GIV, fixed, 95% CI) | 0.30 (0.17 to 0.52) | NA |
| Xerophthalmia incidence, outcomes < 1 year since randomisation | 2 | NA | Risk ratio (GIV, fixed, 95% CI) | 0.88 (0.72 to 1.07) | NA |
| Vitamin A serum retinol level, outcomes < 1 year since randomisation | 11 | Chi2 = 178.42, df = 10; P < 0.001; I2 = 94% | Standardised mean difference (GIV, fixed, 95% CI) | 0.45 (0.37 to 0.53) | NA |
| Vitamin A serum retinol level at longest follow‐up (sensitivity analysis): random‐effects model | 14 | Tau2 = 0.13; Chi2 = 278.45, df = 14; P < 0.001; I2 = 95% | Standardised mean difference (GIV, random, 95% CI) | 0.50 (0.30 to 0.70) | NA |
| CI: confidence interval; GIV: Generic inverse variance; LRTI: lower respiratory tract infection;M‐H: mantel Haenszel method;NA: not applicable. | |||||
| Outcome or subgroup title | No. of studies | No. of participants | Statistical method | Effect size |
| 1 All‐cause mortality at longest follow‐up Show forest plot | 19 | Risk Ratio (Fixed, 95% CI) | 0.88 [0.83, 0.93] | |
| 2 All‐cause mortality at longest follow‐up (subgroup analysis): age Show forest plot | 5 | Risk Ratio (Fixed, 95% CI) | Subtotals only | |
| 2.1 6 to 12 months of age | 4 | Risk Ratio (Fixed, 95% CI) | 0.59 [0.43, 0.82] | |
| 2.2 1 to 5 years of age | 4 | Risk Ratio (Fixed, 95% CI) | 0.68 [0.57, 0.81] | |
| 3 All‐cause mortality at longest follow‐up (subgroup analysis): sex Show forest plot | 7 | Risk Ratio (Fixed, 95% CI) | Subtotals only | |
| 3.1 Boys | 7 | Risk Ratio (Fixed, 95% CI) | 0.96 [0.89, 1.04] | |
| 3.2 Girls | 7 | Risk Ratio (Fixed, 95% CI) | 0.90 [0.84, 0.97] | |
| 4 Mortality due to diarrhoea at longest follow‐up Show forest plot | 9 | Risk Ratio (Fixed, 95% CI) | 0.88 [0.79, 0.98] | |
| 5 Mortality due to measles at longest follow‐up Show forest plot | 6 | Risk Ratio (Fixed, 95% CI) | 0.88 [0.69, 1.11] | |
| 6 Mortality due to meningitis at longest follow‐up Show forest plot | 3 | Risk Ratio (Random, 95% CI) | 0.57 [0.17, 1.88] | |
| 7 Mortality due to lower respiratory tract infection (LRTI) at longest follow‐up Show forest plot | 9 | Risk Ratio (Fixed, 95% CI) | 0.98 [0.86, 1.12] | |
| 8 Diarrhoea incidence at longest follow‐up Show forest plot | 16 | Risk Ratio (Fixed, 95% CI) | 0.85 [0.82, 0.87] | |
| 9 Diarrhoea prevalence at longest follow‐up Show forest plot | 4 | Risk Ratio (Fixed, 95% CI) | 1.06 [1.03, 1.10] | |
| 10 Measles incidence at longest follow‐up Show forest plot | 6 | Risk Ratio (Fixed, 95% CI) | 0.50 [0.37, 0.67] | |
| 11 Malaria incidence at longest follow‐up Show forest plot | 1 | Risk Ratio (M‐H, Fixed, 95% CI) | Subtotals only | |
| 12 Malaria prevalence at longest follow‐up Show forest plot | 2 | Risk Ratio (Fixed, 95% CI) | 0.73 [0.41, 1.28] | |
| 13 LRTI incidence at longest follow‐up Show forest plot | 12 | Risk Ratio (Fixed, 95% CI) | 0.99 [0.92, 1.06] | |
| 14 LRTI prevalence at longest follow‐up Show forest plot | 2 | Risk Ratio (Fixed, 95% CI) | 0.60 [0.45, 0.81] | |
| 15 Bitot's spots prevalence at longest follow‐up Show forest plot | 5 | Risk Ratio (Fixed, 95% CI) | 0.42 [0.33, 0.53] | |
| 16 Night blindness incidence at longest follow‐up Show forest plot | 1 | Risk Ratio (Fixed, 95% CI) | Subtotals only | |
| 17 Night blindness prevalence at longest follow‐up Show forest plot | 2 | Risk Ratio (Fixed, 95% CI) | 0.32 [0.21, 0.50] | |
| 18 Xerophthalmia incidence at longest follow‐up Show forest plot | 3 | Risk Ratio (Fixed, 95% CI) | 0.85 [0.70, 1.03] | |
| 19 Xerophthalmia prevalence at longest follow‐up Show forest plot | 2 | Risk Ratio (Fixed, 95% CI) | 0.31 [0.22, 0.45] | |
| 20 Hospitalisation: number of children hospitalised once or more at longest follow‐up Show forest plot | 1 | Risk Ratio (M‐H, Fixed, 95% CI) | Subtotals only | |
| 21 Hospitalisation due to diarrhoea at longest follow‐up Show forest plot | 1 | Risk Ratio (M‐H, Fixed, 95% CI) | Subtotals only | |
| 22 Hospitalisation due to LRTI at longest follow‐up Show forest plot | 1 | Risk Ratio (M‐H, Fixed, 95% CI) | Subtotals only | |
| 23 Side effect: vomiting Show forest plot | 4 | 4427 | Risk Ratio (M‐H, Fixed, 95% CI) | 1.97 [1.44, 2.69] |
| 24 Side effect: bulging fontanelle Show forest plot | 4 | 2318 | Risk Ratio (M‐H, Fixed, 95% CI) | 1.24 [0.74, 2.08] |
| 25 Vitamin A deficiency status: number deficient at longest follow‐up Show forest plot | 4 | 2262 | Risk Ratio (M‐H, Fixed, 95% CI) | 0.71 [0.65, 0.78] |
| 26 Vitamin A deficiency status: vitamin A serum retinol level at longest follow‐up Show forest plot | 15 | 11788 | Std. Mean Difference (IV, Fixed, 95% CI) | 0.26 [0.22, 0.30] |