Terapias psicológicas versus fármacos antidepresivos, solos y en combinación para la depresión en niños y adolescentes
Información
- DOI:
- https://doi.org/10.1002/14651858.CD008324.pub3Copiar DOI

- Base de datos:
-
- Cochrane Database of Systematic Reviews
- Versión publicada:
-
- 30 noviembre 2014see what's new
- Tipo:
-
- Intervention
- Etapa:
-
- Review
- Grupo Editorial Cochrane:
-
Grupo Cochrane de Trastornos mentales comunes
- Copyright:
-
- Copyright © 2014 The Cochrane Collaboration. Published by John Wiley & Sons, Ltd.
Cifras del artículo
Altmetric:
Citado por:
Autores
Contributions of authors
Sarah Hetrick (SH) conceived the review and co‐ordinated the development of the original protocol. She assisted with selection of articles for inclusion, data extraction and guided the data analysis. She had oversight of the write‐up of the review.
Georgina Cox (GC) assisted in selecting articles from the updated search, extracted descriptive and numerical data for all included studies, inputted data into meta‐analyses and was heavily involved in writing the Methods, Description of studies, Results and Discussion sections of the review.
Patrick Callahan (PC) assisted in the development of the original protocol for this review, executed the search of electronic databases, screened and selected articles for inclusion, extracted descriptive and numerical data for all included studies, and was involved in inputting data into meta‐analyses.
Rachel Churchill (RC) assisted in the development of the original protocol and provided input to the data analysis and write‐up of the review.
Vivien Hunot (VH) assisted in the development of the original protocol and provided input to the data analysis and write‐up of the review.
Alex Parker (AP) assisted in the development of the original protocol and had input into the write‐up of the review.
Sally Merry (SM) assisted in the development of the original protocol and had input, particularly from a clinical point of view, into the write‐up of the review.
Sources of support
Internal sources
-
Headspace, Australia.
Australian Government funding for the National Youth Mental Health Foundation
External sources
-
No sources of support supplied
Declarations of interest
There are no known conflicts of interest in this working group.
Acknowledgements
Thanks to Judy Stoelwinder for assisting in the development of search strategies for the original review and to the CCDAN editorial team for ongoing support and advice. We are also grateful to trial authors Paula Riggs and Glenn Melvin who were able to provide us with additional data for this review.
Thanks to Sarah Dawson who undertook the searching and screening of retrivals from the search for the 2014 update, as well as to Karla Soares Weiser who performed the data extration and under took the risk of bias assessment for the newly included trial identified for inclusion in the updated review.
Version history
| Published | Title | Stage | Authors | Version |
| 2014 Nov 30 | Psychological therapies versus antidepressant medication, alone and in combination for depression in children and adolescents | Review | Georgina R Cox, Patch Callahan, Rachel Churchill, Vivien Hunot, Sally N Merry, Alexandra G Parker, Sarah E Hetrick | |
| 2012 Nov 14 | Psychological therapies versus antidepressant medication, alone and in combination for depression in children and adolescents | Review | Georgina R Cox, Patch Callahan, Rachel Churchill, Vivien Hunot, Sally N Merry, Alexandra G Parker, Sarah E Hetrick | |
| 2010 Jan 20 | Psychological therapies versus antidepressant medication, alone and in combination for depression in children and adolescents | Protocol | Patch Callahan, Sarah E Hetrick, Rachel Churchill, Vivien Hunot, Sally N Merry, Alexandra G Parker | |
Differences between protocol and review
One additional objective was added to the review following the publication of the protocol. Given the concern that antidepressant medication may increase suicide related behaviours in children and adolescents, we felt it was important to assess the degree of suicide related behaviours related to antidepressant medication. Therefore a final objective was:
6. To determine whether there is an increased risk of suicide related outcomes in children and adolescents treated with antidepressant medication alone, compared with psychological therapy alone, or a combination of treatments.
Keywords
MeSH
Medical Subject Headings (MeSH) Keywords
Medical Subject Headings Check Words
Adolescent; Child; Humans;
PICO

PRISMA flow diagram: CCDANCTR update search June 2014
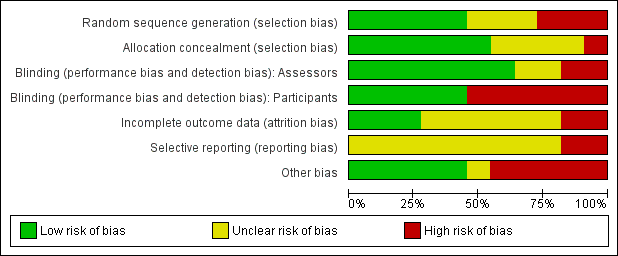
Methodological quality graph: review authors' judgements about each methodological quality item presented as percentages across all included studies.

Comparison 1 Psychological therapy versus antidepressant medication, Outcome 1 Remission by clinical interview (post‐intervention) ITT.
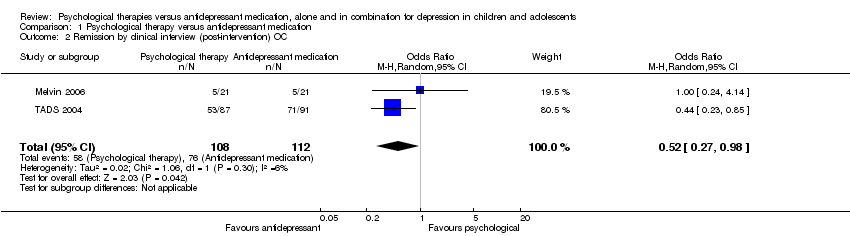
Comparison 1 Psychological therapy versus antidepressant medication, Outcome 2 Remission by clinical interview (post‐intervention) OC.

Comparison 1 Psychological therapy versus antidepressant medication, Outcome 3 Remission by clinical interview (six to nine months follow‐up) ITT.

Comparison 1 Psychological therapy versus antidepressant medication, Outcome 4 Remission by clinical interview (six to nine months follow‐up) OC.
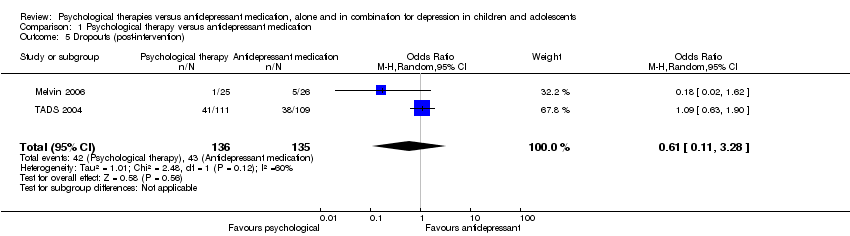
Comparison 1 Psychological therapy versus antidepressant medication, Outcome 5 Dropouts (post‐intervention).

Comparison 1 Psychological therapy versus antidepressant medication, Outcome 6 Dropouts (six to nine months follow‐up).

Comparison 1 Psychological therapy versus antidepressant medication, Outcome 7 Suicidal ideation (post‐intervention).

Comparison 1 Psychological therapy versus antidepressant medication, Outcome 8 Suicidal ideation (six to nine months follow‐up).

Comparison 1 Psychological therapy versus antidepressant medication, Outcome 9 Suicidal ideation (post‐intervention).
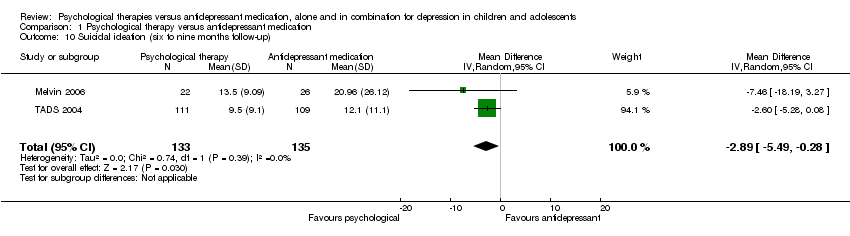
Comparison 1 Psychological therapy versus antidepressant medication, Outcome 10 Suicidal ideation (six to nine months follow‐up).
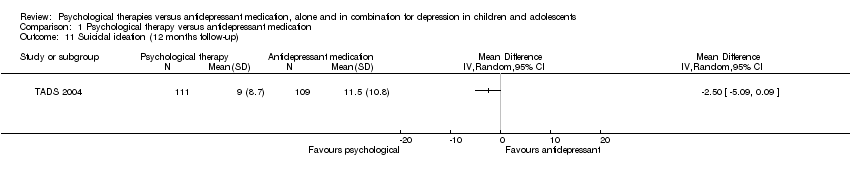
Comparison 1 Psychological therapy versus antidepressant medication, Outcome 11 Suicidal ideation (12 months follow‐up).

Comparison 1 Psychological therapy versus antidepressant medication, Outcome 12 Remission by cut‐off (post‐intervention).

Comparison 1 Psychological therapy versus antidepressant medication, Outcome 13 Remission by cut‐off (six to nine months follow‐up).

Comparison 1 Psychological therapy versus antidepressant medication, Outcome 14 Remission by cut‐off (12 months follow‐up).

Comparison 1 Psychological therapy versus antidepressant medication, Outcome 15 Depression symptoms clinician rated (CDRS‐R) (post‐intervention).

Comparison 1 Psychological therapy versus antidepressant medication, Outcome 16 Depression symptoms clinician rated (CDRS‐R) (six to nine months follow‐up).
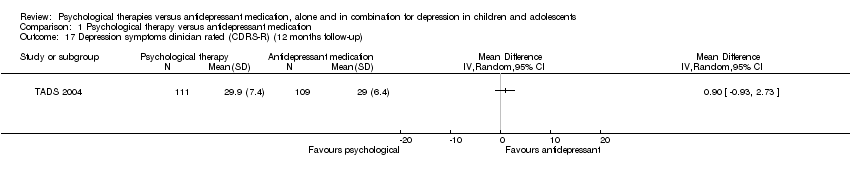
Comparison 1 Psychological therapy versus antidepressant medication, Outcome 17 Depression symptoms clinician rated (CDRS‐R) (12 months follow‐up).

Comparison 1 Psychological therapy versus antidepressant medication, Outcome 18 Depression symptoms self rated (post‐intervention).
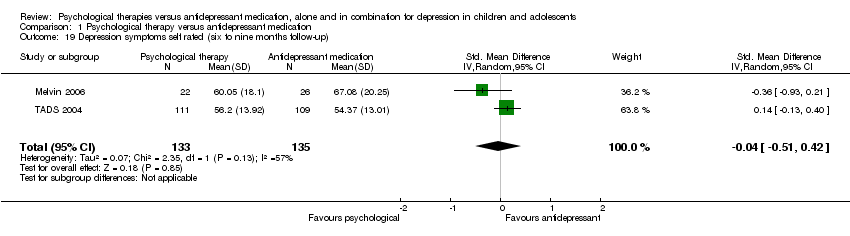
Comparison 1 Psychological therapy versus antidepressant medication, Outcome 19 Depression symptoms self rated (six to nine months follow‐up).

Comparison 1 Psychological therapy versus antidepressant medication, Outcome 20 Depression symptoms self rated (12 months follow‐up).

Comparison 1 Psychological therapy versus antidepressant medication, Outcome 21 Functioning (post‐intervention).
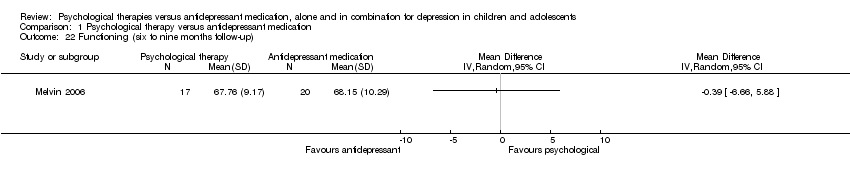
Comparison 1 Psychological therapy versus antidepressant medication, Outcome 22 Functioning (six to nine months follow‐up).
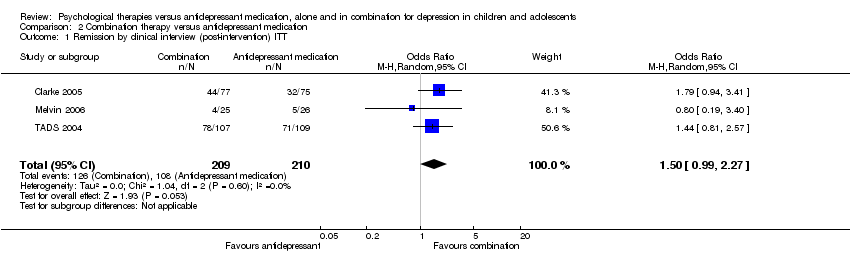
Comparison 2 Combination therapy versus antidepressant medication, Outcome 1 Remission by clinical interview (post‐intervention) ITT.
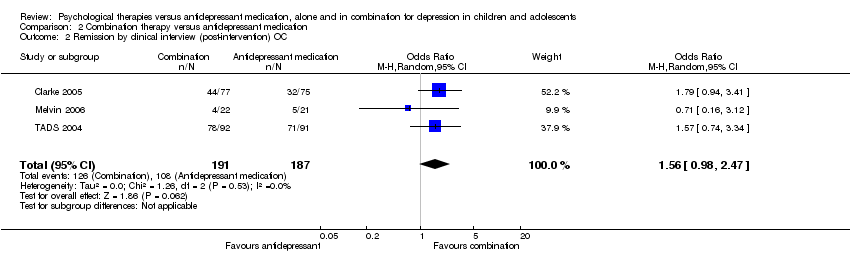
Comparison 2 Combination therapy versus antidepressant medication, Outcome 2 Remission by clinical interview (post‐intervention) OC.

Comparison 2 Combination therapy versus antidepressant medication, Outcome 3 Remission by clinical interview (six to nine months follow‐up) ITT.
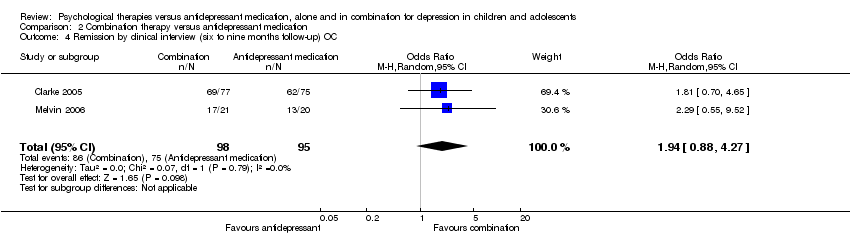
Comparison 2 Combination therapy versus antidepressant medication, Outcome 4 Remission by clinical interview (six to nine months follow‐up) OC.
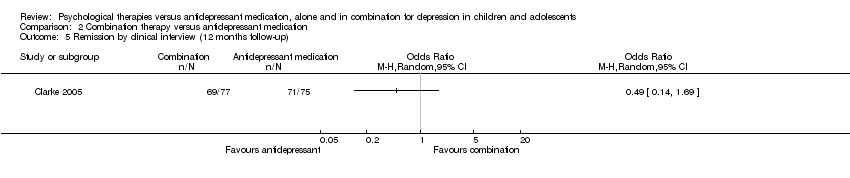
Comparison 2 Combination therapy versus antidepressant medication, Outcome 5 Remission by clinical interview (12 months follow‐up).

Comparison 2 Combination therapy versus antidepressant medication, Outcome 6 Dropouts (post‐intervention).

Comparison 2 Combination therapy versus antidepressant medication, Outcome 7 Dropouts (six to nine months follow‐up).

Comparison 2 Combination therapy versus antidepressant medication, Outcome 8 Dropouts (12 months follow‐up).
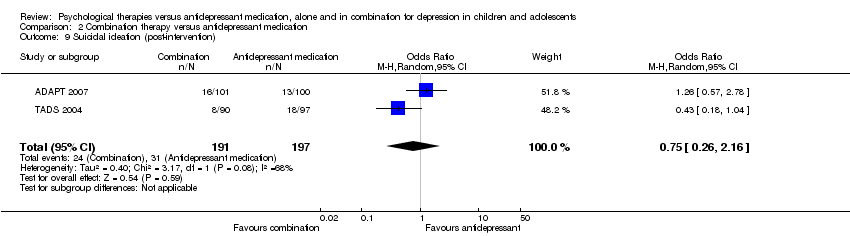
Comparison 2 Combination therapy versus antidepressant medication, Outcome 9 Suicidal ideation (post‐intervention).

Comparison 2 Combination therapy versus antidepressant medication, Outcome 10 Suicidal ideation (six to nine months follow‐up).

Comparison 2 Combination therapy versus antidepressant medication, Outcome 11 Suicidal ideation (12 months follow‐up).
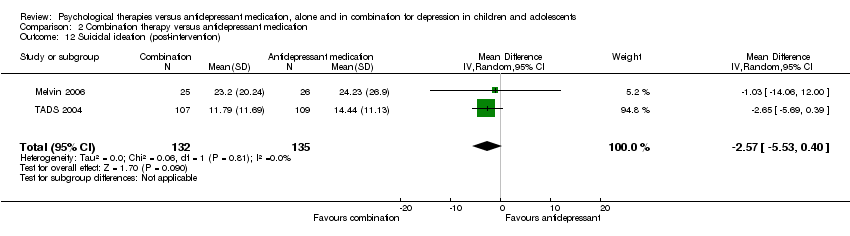
Comparison 2 Combination therapy versus antidepressant medication, Outcome 12 Suicidal ideation (post‐intervention).

Comparison 2 Combination therapy versus antidepressant medication, Outcome 13 Suicidal ideation (six to nine months follow‐up).

Comparison 2 Combination therapy versus antidepressant medication, Outcome 14 Suicidal ideation (12 months follow‐up).

Comparison 2 Combination therapy versus antidepressant medication, Outcome 15 Remission by cut‐off (post‐intervention).
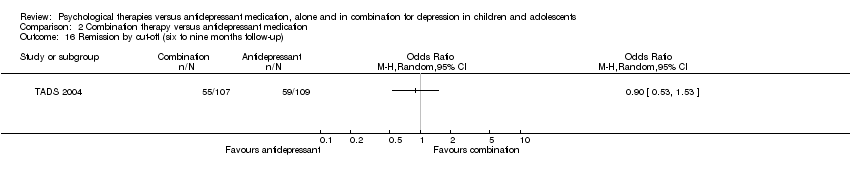
Comparison 2 Combination therapy versus antidepressant medication, Outcome 16 Remission by cut‐off (six to nine months follow‐up).

Comparison 2 Combination therapy versus antidepressant medication, Outcome 17 Remission by cut‐off (12 months follow‐up).
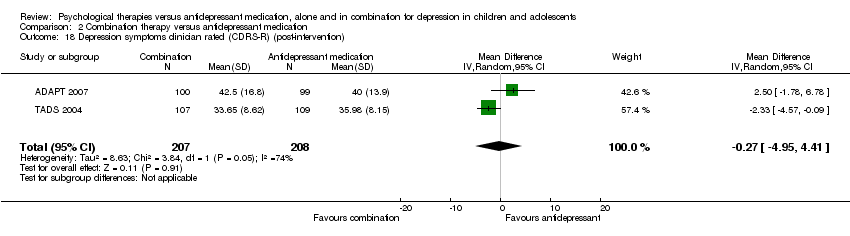
Comparison 2 Combination therapy versus antidepressant medication, Outcome 18 Depression symptoms clinician rated (CDRS‐R) (post‐intervention).
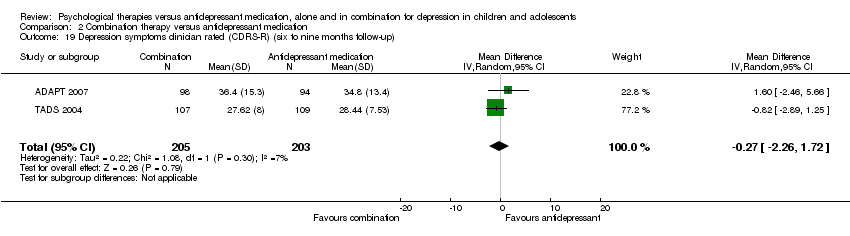
Comparison 2 Combination therapy versus antidepressant medication, Outcome 19 Depression symptoms clinician rated (CDRS‐R) (six to nine months follow‐up).

Comparison 2 Combination therapy versus antidepressant medication, Outcome 20 Depression symptoms clinician rated (CDRS‐R) (12 months follow‐up).

Comparison 2 Combination therapy versus antidepressant medication, Outcome 21 Depression symptoms self rated (post‐intervention).
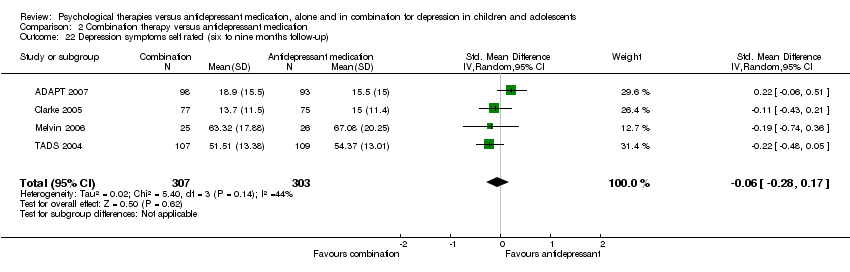
Comparison 2 Combination therapy versus antidepressant medication, Outcome 22 Depression symptoms self rated (six to nine months follow‐up).

Comparison 2 Combination therapy versus antidepressant medication, Outcome 23 Depression symptoms self rated (12 months follow‐up).

Comparison 2 Combination therapy versus antidepressant medication, Outcome 24 Functioning (post‐intervention).

Comparison 2 Combination therapy versus antidepressant medication, Outcome 25 Functioning (six to nine months follow‐up).

Comparison 2 Combination therapy versus antidepressant medication, Outcome 26 Functioning (12 months follow‐up).
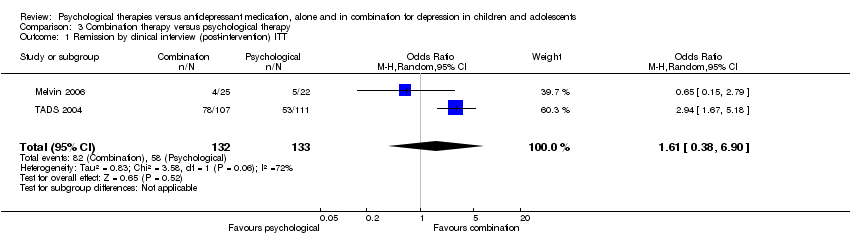
Comparison 3 Combination therapy versus psychological therapy, Outcome 1 Remission by clinical interview (post‐intervention) ITT.
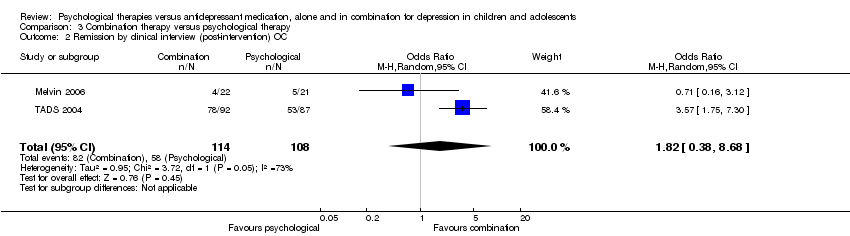
Comparison 3 Combination therapy versus psychological therapy, Outcome 2 Remission by clinical interview (post‐intervention) OC.

Comparison 3 Combination therapy versus psychological therapy, Outcome 3 Remission by clinical interview (six to nine months follow‐up) ITT.

Comparison 3 Combination therapy versus psychological therapy, Outcome 4 Remission by clinical interview (six to nine months follow‐up) OC.
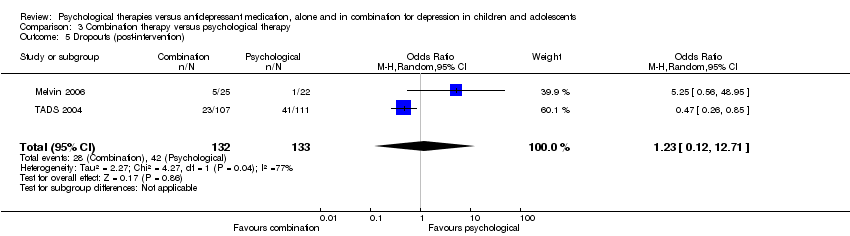
Comparison 3 Combination therapy versus psychological therapy, Outcome 5 Dropouts (post‐intervention).

Comparison 3 Combination therapy versus psychological therapy, Outcome 6 Dropouts (six to nine months follow‐up).

Comparison 3 Combination therapy versus psychological therapy, Outcome 7 Suicidal ideation (post‐intervention).

Comparison 3 Combination therapy versus psychological therapy, Outcome 8 Suicidal ideation (six to nine months follow‐up).

Comparison 3 Combination therapy versus psychological therapy, Outcome 9 Suicidal ideation (post‐intervention).

Comparison 3 Combination therapy versus psychological therapy, Outcome 10 Suicidal ideation (six to nine months follow‐up).

Comparison 3 Combination therapy versus psychological therapy, Outcome 11 Suicidal ideation (12 months follow‐up).

Comparison 3 Combination therapy versus psychological therapy, Outcome 12 Remission by cut‐off (post‐intervention).

Comparison 3 Combination therapy versus psychological therapy, Outcome 13 Remission by cut‐off (six to nine months follow‐up).
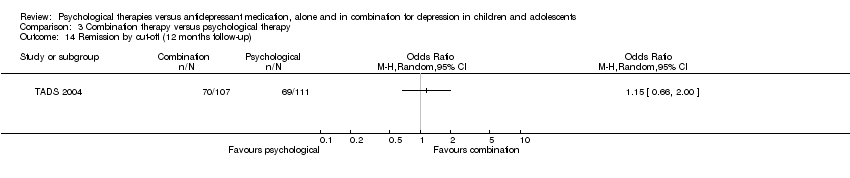
Comparison 3 Combination therapy versus psychological therapy, Outcome 14 Remission by cut‐off (12 months follow‐up).

Comparison 3 Combination therapy versus psychological therapy, Outcome 15 Depression symptoms clinician rated (CDRS‐R) (post‐intervention).
Comparison 3 Combination therapy versus psychological therapy, Outcome 16 Depression symptoms clinician rated (CDRS‐R) (six to nine months follow‐up).

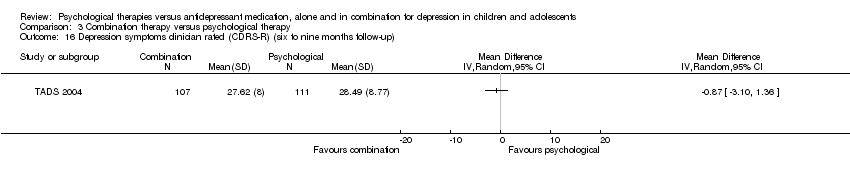
Comparison 3 Combination therapy versus psychological therapy, Outcome 17 Depression symptoms clinician rated (CDRS‐R) (12 months follow‐up).
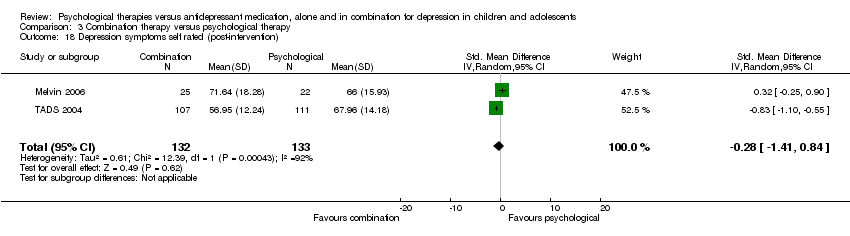
Comparison 3 Combination therapy versus psychological therapy, Outcome 18 Depression symptoms self rated (post‐intervention).
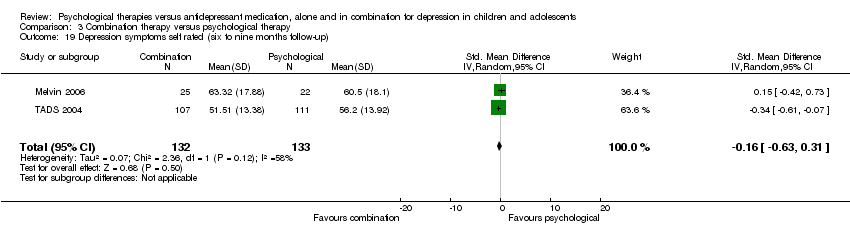
Comparison 3 Combination therapy versus psychological therapy, Outcome 19 Depression symptoms self rated (six to nine months follow‐up).

Comparison 3 Combination therapy versus psychological therapy, Outcome 20 Depression symptoms self rated (12 months follow‐up).

Comparison 3 Combination therapy versus psychological therapy, Outcome 21 Functioning (post‐intervention).

Comparison 3 Combination therapy versus psychological therapy, Outcome 22 Functioning (six to nine months follow‐up).

Comparison 4 Combination therapy versus psychological therapy plus placebo, Outcome 1 Dropouts (post‐intervention).

Comparison 4 Combination therapy versus psychological therapy plus placebo, Outcome 2 Suicidal ideation (post‐intervention).

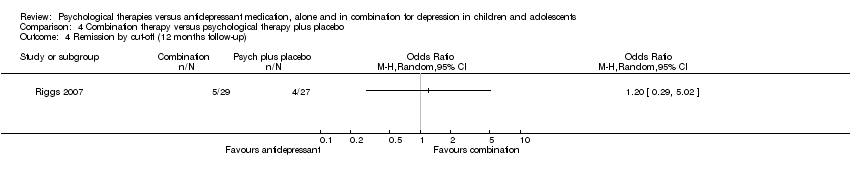
Comparison 4 Combination therapy versus psychological therapy plus placebo, Outcome 3 Remission by cut‐off (post‐intervention).
Comparison 4 Combination therapy versus psychological therapy plus placebo, Outcome 4 Remission by cut‐off (12 months follow‐up).

Comparison 4 Combination therapy versus psychological therapy plus placebo, Outcome 5 Depression symptoms clinician rated (CDRS‐R) (post‐intervention).
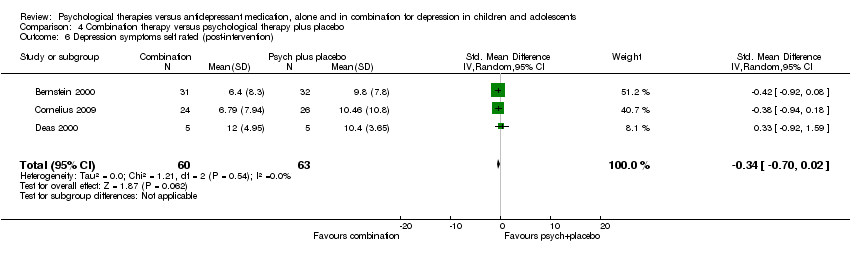
Comparison 4 Combination therapy versus psychological therapy plus placebo, Outcome 6 Depression symptoms self rated (post‐intervention).
| Outcome or subgroup title | No. of studies | No. of participants | Statistical method | Effect size |
| 1 Remission by clinical interview (post‐intervention) ITT Show forest plot | 2 | 268 | Odds Ratio (M‐H, Random, 95% CI) | 0.62 [0.28, 1.35] |
| 2 Remission by clinical interview (post‐intervention) OC Show forest plot | 2 | 220 | Odds Ratio (M‐H, Random, 95% CI) | 0.52 [0.27, 0.98] |
| 3 Remission by clinical interview (six to nine months follow‐up) ITT Show forest plot | 1 | Odds Ratio (M‐H, Random, 95% CI) | Totals not selected | |
| 4 Remission by clinical interview (six to nine months follow‐up) OC Show forest plot | 1 | Odds Ratio (M‐H, Random, 95% CI) | Totals not selected | |
| 5 Dropouts (post‐intervention) Show forest plot | 2 | 271 | Odds Ratio (M‐H, Random, 95% CI) | 0.61 [0.11, 3.28] |
| 6 Dropouts (six to nine months follow‐up) Show forest plot | 2 | 223 | Odds Ratio (M‐H, Random, 95% CI) | 1.17 [0.63, 2.19] |
| 7 Suicidal ideation (post‐intervention) Show forest plot | 1 | Odds Ratio (M‐H, Random, 95% CI) | Totals not selected | |
| 8 Suicidal ideation (six to nine months follow‐up) Show forest plot | 1 | Odds Ratio (M‐H, Random, 95% CI) | Totals not selected | |
| 9 Suicidal ideation (post‐intervention) Show forest plot | 2 | 268 | Mean Difference (IV, Random, 95% CI) | ‐3.12 [‐5.91, ‐0.33] |
| 10 Suicidal ideation (six to nine months follow‐up) Show forest plot | 2 | 268 | Mean Difference (IV, Random, 95% CI) | ‐2.89 [‐5.49, ‐0.28] |
| 11 Suicidal ideation (12 months follow‐up) Show forest plot | 1 | Mean Difference (IV, Random, 95% CI) | Totals not selected | |
| 12 Remission by cut‐off (post‐intervention) Show forest plot | 1 | Odds Ratio (M‐H, Random, 95% CI) | Totals not selected | |
| 13 Remission by cut‐off (six to nine months follow‐up) Show forest plot | 1 | Odds Ratio (M‐H, Random, 95% CI) | Totals not selected | |
| 14 Remission by cut‐off (12 months follow‐up) Show forest plot | 1 | Odds Ratio (M‐H, Random, 95% CI) | Totals not selected | |
| 15 Depression symptoms clinician rated (CDRS‐R) (post‐intervention) Show forest plot | 1 | Mean Difference (IV, Random, 95% CI) | Totals not selected | |
| 16 Depression symptoms clinician rated (CDRS‐R) (six to nine months follow‐up) Show forest plot | 1 | Mean Difference (IV, Random, 95% CI) | Totals not selected | |
| 17 Depression symptoms clinician rated (CDRS‐R) (12 months follow‐up) Show forest plot | 1 | Mean Difference (IV, Random, 95% CI) | Totals not selected | |
| 18 Depression symptoms self rated (post‐intervention) Show forest plot | 2 | 255 | Std. Mean Difference (IV, Random, 95% CI) | 0.16 [‐0.69, 1.01] |
| 19 Depression symptoms self rated (six to nine months follow‐up) Show forest plot | 2 | 268 | Std. Mean Difference (IV, Random, 95% CI) | ‐0.04 [‐0.51, 0.42] |
| 20 Depression symptoms self rated (12 months follow‐up) Show forest plot | 1 | Mean Difference (IV, Random, 95% CI) | Totals not selected | |
| 21 Functioning (post‐intervention) Show forest plot | 1 | Mean Difference (IV, Random, 95% CI) | Totals not selected | |
| 22 Functioning (six to nine months follow‐up) Show forest plot | 1 | Mean Difference (IV, Random, 95% CI) | Totals not selected | |
| Outcome or subgroup title | No. of studies | No. of participants | Statistical method | Effect size |
| 1 Remission by clinical interview (post‐intervention) ITT Show forest plot | 3 | 419 | Odds Ratio (M‐H, Random, 95% CI) | 1.50 [0.99, 2.27] |
| 2 Remission by clinical interview (post‐intervention) OC Show forest plot | 3 | 378 | Odds Ratio (M‐H, Random, 95% CI) | 1.56 [0.98, 2.47] |
| 3 Remission by clinical interview (six to nine months follow‐up) ITT Show forest plot | 2 | 203 | Odds Ratio (M‐H, Random, 95% CI) | 1.93 [0.93, 4.00] |
| 4 Remission by clinical interview (six to nine months follow‐up) OC Show forest plot | 2 | 193 | Odds Ratio (M‐H, Random, 95% CI) | 1.94 [0.88, 4.27] |
| 5 Remission by clinical interview (12 months follow‐up) Show forest plot | 1 | Odds Ratio (M‐H, Random, 95% CI) | Totals not selected | |
| 6 Dropouts (post‐intervention) Show forest plot | 5 | 699 | Odds Ratio (M‐H, Random, 95% CI) | 0.84 [0.51, 1.39] |
| 7 Dropouts (six to nine months follow‐up) Show forest plot | 3 | 420 | Odds Ratio (M‐H, Random, 95% CI) | 0.94 [0.54, 1.64] |
| 8 Dropouts (12 months follow‐up) Show forest plot | 1 | Odds Ratio (M‐H, Random, 95% CI) | Totals not selected | |
| 9 Suicidal ideation (post‐intervention) Show forest plot | 2 | 388 | Odds Ratio (M‐H, Random, 95% CI) | 0.75 [0.26, 2.16] |
| 10 Suicidal ideation (six to nine months follow‐up) Show forest plot | 2 | 344 | Odds Ratio (M‐H, Random, 95% CI) | 0.53 [0.06, 4.58] |
| 11 Suicidal ideation (12 months follow‐up) Show forest plot | 1 | Odds Ratio (M‐H, Random, 95% CI) | Totals not selected | |
| 12 Suicidal ideation (post‐intervention) Show forest plot | 2 | 267 | Mean Difference (IV, Random, 95% CI) | ‐2.57 [‐5.53, 0.40] |
| 13 Suicidal ideation (six to nine months follow‐up) Show forest plot | 2 | 267 | Mean Difference (IV, Random, 95% CI) | ‐1.89 [‐4.50, 0.72] |
| 14 Suicidal ideation (12 months follow‐up) Show forest plot | 1 | Mean Difference (IV, Random, 95% CI) | Totals not selected | |
| 15 Remission by cut‐off (post‐intervention) Show forest plot | 1 | Odds Ratio (M‐H, Random, 95% CI) | Totals not selected | |
| 16 Remission by cut‐off (six to nine months follow‐up) Show forest plot | 1 | Odds Ratio (M‐H, Random, 95% CI) | Totals not selected | |
| 17 Remission by cut‐off (12 months follow‐up) Show forest plot | 2 | 319 | Odds Ratio (M‐H, Random, 95% CI) | 1.45 [0.60, 3.52] |
| 18 Depression symptoms clinician rated (CDRS‐R) (post‐intervention) Show forest plot | 2 | 415 | Mean Difference (IV, Random, 95% CI) | ‐0.27 [‐4.95, 4.41] |
| 19 Depression symptoms clinician rated (CDRS‐R) (six to nine months follow‐up) Show forest plot | 2 | 408 | Mean Difference (IV, Random, 95% CI) | ‐0.27 [‐2.26, 1.72] |
| 20 Depression symptoms clinician rated (CDRS‐R) (12 months follow‐up) Show forest plot | 1 | Mean Difference (IV, Random, 95% CI) | Totals not selected | |
| 21 Depression symptoms self rated (post‐intervention) Show forest plot | 5 | 683 | Std. Mean Difference (IV, Random, 95% CI) | ‐0.14 [‐0.36, 0.09] |
| 22 Depression symptoms self rated (six to nine months follow‐up) Show forest plot | 4 | 610 | Std. Mean Difference (IV, Random, 95% CI) | ‐0.06 [‐0.28, 0.17] |
| 23 Depression symptoms self rated (12 months follow‐up) Show forest plot | 2 | 368 | Std. Mean Difference (IV, Random, 95% CI) | ‐0.26 [‐0.46, ‐0.05] |
| 24 Functioning (post‐intervention) Show forest plot | 3 | 396 | Std. Mean Difference (IV, Random, 95% CI) | 0.09 [‐0.11, 0.28] |
| 25 Functioning (six to nine months follow‐up) Show forest plot | 3 | 385 | Std. Mean Difference (IV, Random, 95% CI) | 0.08 [‐0.12, 0.28] |
| 26 Functioning (12 months follow‐up) Show forest plot | 1 | Mean Difference (IV, Random, 95% CI) | Totals not selected | |
| Outcome or subgroup title | No. of studies | No. of participants | Statistical method | Effect size |
| 1 Remission by clinical interview (post‐intervention) ITT Show forest plot | 2 | 265 | Odds Ratio (M‐H, Random, 95% CI) | 1.61 [0.38, 6.90] |
| 2 Remission by clinical interview (post‐intervention) OC Show forest plot | 2 | 222 | Odds Ratio (M‐H, Random, 95% CI) | 1.82 [0.38, 8.68] |
| 3 Remission by clinical interview (six to nine months follow‐up) ITT Show forest plot | 1 | Odds Ratio (M‐H, Random, 95% CI) | Totals not selected | |
| 4 Remission by clinical interview (six to nine months follow‐up) OC Show forest plot | 1 | Odds Ratio (M‐H, Random, 95% CI) | Totals not selected | |
| 5 Dropouts (post‐intervention) Show forest plot | 2 | 265 | Odds Ratio (M‐H, Random, 95% CI) | 1.23 [0.12, 12.71] |
| 6 Dropouts (six to nine months follow‐up) Show forest plot | 2 | 231 | Odds Ratio (M‐H, Random, 95% CI) | 0.75 [0.40, 1.42] |
| 7 Suicidal ideation (post‐intervention) Show forest plot | 1 | Odds Ratio (M‐H, Random, 95% CI) | Totals not selected | |
| 8 Suicidal ideation (six to nine months follow‐up) Show forest plot | 1 | Odds Ratio (M‐H, Random, 95% CI) | Totals not selected | |
| 9 Suicidal ideation (post‐intervention) Show forest plot | 2 | 265 | Mean Difference (IV, Random, 95% CI) | 0.60 [‐2.25, 3.45] |
| 10 Suicidal ideation (six to nine months follow‐up) Show forest plot | 2 | 265 | Mean Difference (IV, Random, 95% CI) | 1.78 [‐2.29, 5.85] |
| 11 Suicidal ideation (12 months follow‐up) Show forest plot | 1 | Mean Difference (IV, Random, 95% CI) | Totals not selected | |
| 12 Remission by cut‐off (post‐intervention) Show forest plot | 1 | Odds Ratio (M‐H, Random, 95% CI) | Totals not selected | |
| 13 Remission by cut‐off (six to nine months follow‐up) Show forest plot | 1 | Odds Ratio (M‐H, Random, 95% CI) | Totals not selected | |
| 14 Remission by cut‐off (12 months follow‐up) Show forest plot | 1 | Odds Ratio (M‐H, Random, 95% CI) | Totals not selected | |
| 15 Depression symptoms clinician rated (CDRS‐R) (post‐intervention) Show forest plot | 1 | Mean Difference (IV, Random, 95% CI) | Totals not selected | |
| 16 Depression symptoms clinician rated (CDRS‐R) (six to nine months follow‐up) Show forest plot | 1 | Mean Difference (IV, Random, 95% CI) | Totals not selected | |
| 17 Depression symptoms clinician rated (CDRS‐R) (12 months follow‐up) Show forest plot | 1 | Mean Difference (IV, Random, 95% CI) | Totals not selected | |
| 18 Depression symptoms self rated (post‐intervention) Show forest plot | 2 | 265 | Std. Mean Difference (IV, Random, 95% CI) | ‐0.28 [‐1.41, 0.84] |
| 19 Depression symptoms self rated (six to nine months follow‐up) Show forest plot | 2 | 265 | Std. Mean Difference (IV, Random, 95% CI) | ‐0.16 [‐0.63, 0.31] |
| 20 Depression symptoms self rated (12 months follow‐up) Show forest plot | 1 | Mean Difference (IV, Random, 95% CI) | Totals not selected | |
| 21 Functioning (post‐intervention) Show forest plot | 1 | Mean Difference (IV, Random, 95% CI) | Totals not selected | |
| 22 Functioning (six to nine months follow‐up) Show forest plot | 1 | Mean Difference (IV, Random, 95% CI) | Totals not selected | |
| Outcome or subgroup title | No. of studies | No. of participants | Statistical method | Effect size |
| 1 Dropouts (post‐intervention) Show forest plot | 4 | 249 | Odds Ratio (M‐H, Random, 95% CI) | 0.98 [0.42, 2.28] |
| 2 Suicidal ideation (post‐intervention) Show forest plot | 1 | Mean Difference (IV, Random, 95% CI) | Totals not selected | |
| 3 Remission by cut‐off (post‐intervention) Show forest plot | 2 | 173 | Odds Ratio (M‐H, Random, 95% CI) | 2.15 [1.15, 4.02] |
| 4 Remission by cut‐off (12 months follow‐up) Show forest plot | 1 | Odds Ratio (M‐H, Random, 95% CI) | Totals not selected | |
| 5 Depression symptoms clinician rated (CDRS‐R) (post‐intervention) Show forest plot | 3 | 239 | Std. Mean Difference (IV, Random, 95% CI) | ‐0.52 [‐0.78, ‐0.26] |
| 6 Depression symptoms self rated (post‐intervention) Show forest plot | 3 | 123 | Std. Mean Difference (IV, Random, 95% CI) | ‐0.34 [‐0.70, 0.02] |