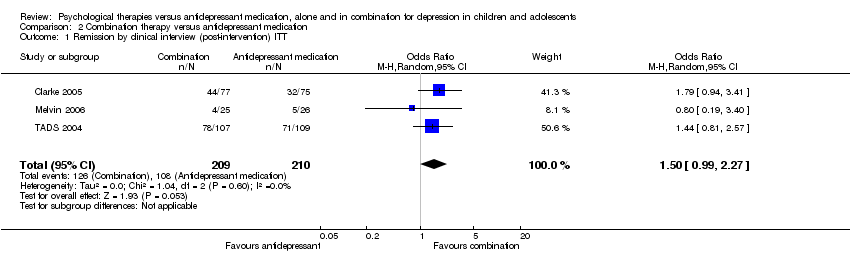
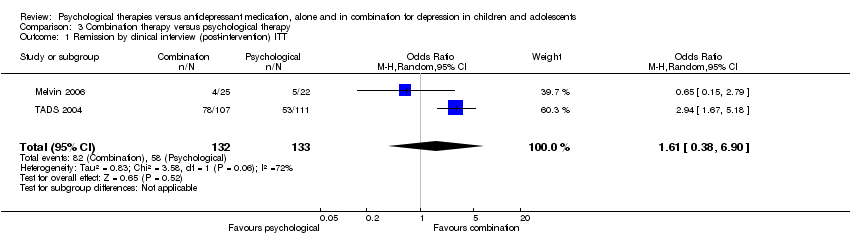
| 1 Remission by clinical interview (post‐intervention) ITT Show forest plot | 3 | 419 | Odds Ratio (M‐H, Random, 95% CI) | 1.50 [0.99, 2.27] |
|
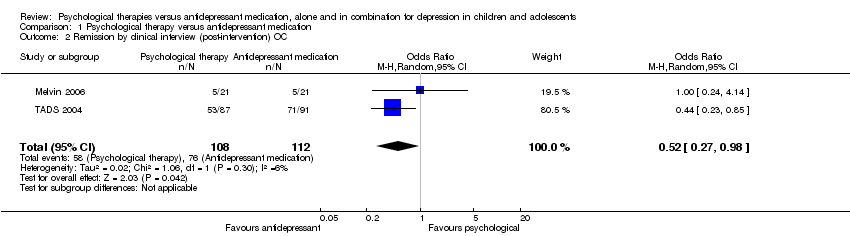
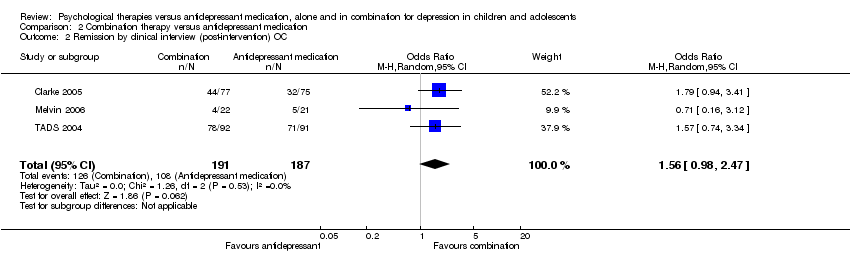
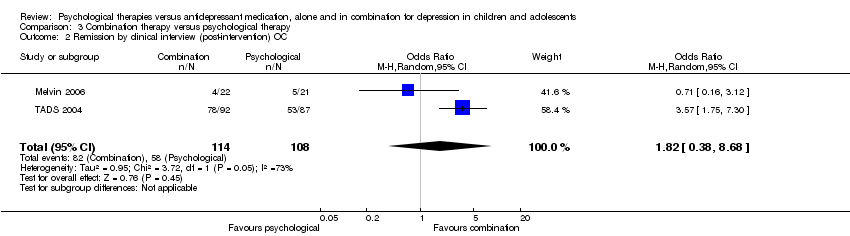
| 2 Remission by clinical interview (post‐intervention) OC Show forest plot | 3 | 378 | Odds Ratio (M‐H, Random, 95% CI) | 1.56 [0.98, 2.47] |
|
| 3 Remission by clinical interview (six to nine months follow‐up) ITT Show forest plot | 2 | 203 | Odds Ratio (M‐H, Random, 95% CI) | 1.93 [0.93, 4.00] |
|
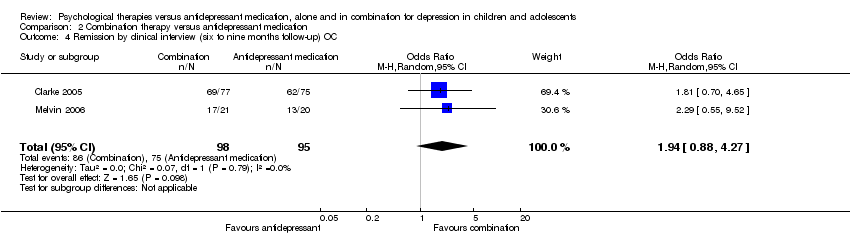
| 4 Remission by clinical interview (six to nine months follow‐up) OC Show forest plot | 2 | 193 | Odds Ratio (M‐H, Random, 95% CI) | 1.94 [0.88, 4.27] |
|
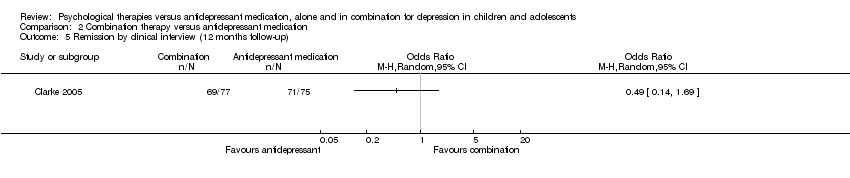
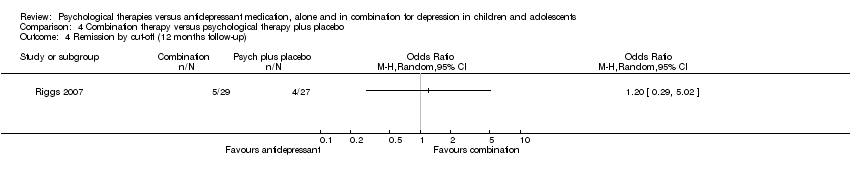
| 5 Remission by clinical interview (12 months follow‐up) Show forest plot | 1 | | Odds Ratio (M‐H, Random, 95% CI) | Totals not selected |
|
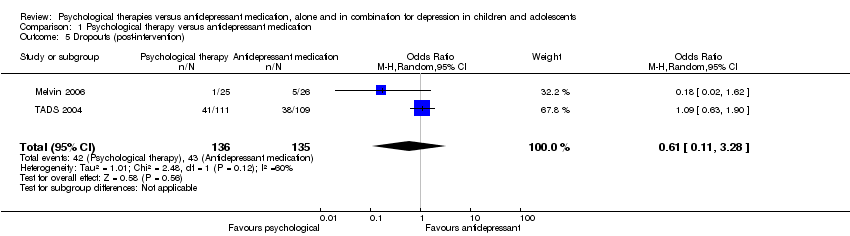
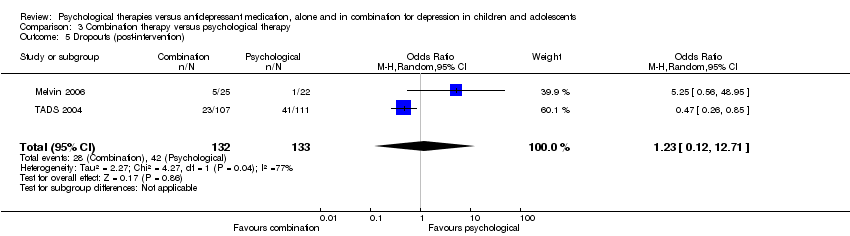
| 6 Dropouts (post‐intervention) Show forest plot | 5 | 699 | Odds Ratio (M‐H, Random, 95% CI) | 0.84 [0.51, 1.39] |
|
| 7 Dropouts (six to nine months follow‐up) Show forest plot | 3 | 420 | Odds Ratio (M‐H, Random, 95% CI) | 0.94 [0.54, 1.64] |
|
| 8 Dropouts (12 months follow‐up) Show forest plot | 1 | | Odds Ratio (M‐H, Random, 95% CI) | Totals not selected |
|
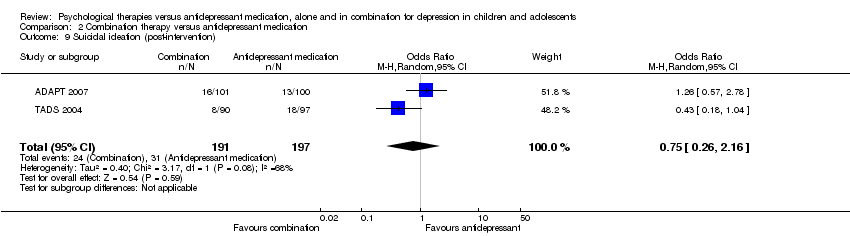
| 9 Suicidal ideation (post‐intervention) Show forest plot | 2 | 388 | Odds Ratio (M‐H, Random, 95% CI) | 0.75 [0.26, 2.16] |
|
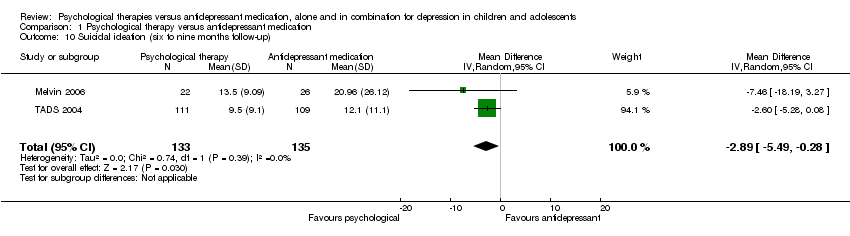
| 10 Suicidal ideation (six to nine months follow‐up) Show forest plot | 2 | 344 | Odds Ratio (M‐H, Random, 95% CI) | 0.53 [0.06, 4.58] |
|
| 11 Suicidal ideation (12 months follow‐up) Show forest plot | 1 | | Odds Ratio (M‐H, Random, 95% CI) | Totals not selected |
|
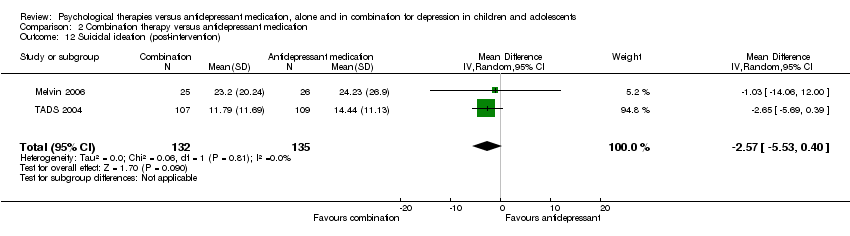
| 12 Suicidal ideation (post‐intervention) Show forest plot | 2 | 267 | Mean Difference (IV, Random, 95% CI) | ‐2.57 [‐5.53, 0.40] |
|
| 13 Suicidal ideation (six to nine months follow‐up) Show forest plot | 2 | 267 | Mean Difference (IV, Random, 95% CI) | ‐1.89 [‐4.50, 0.72] |
|
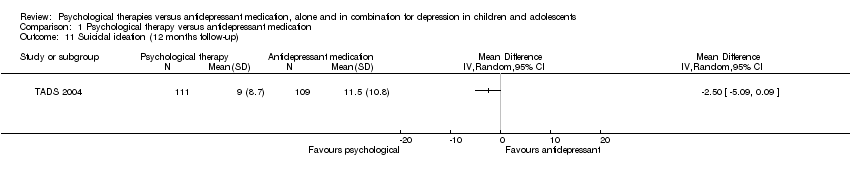
| 14 Suicidal ideation (12 months follow‐up) Show forest plot | 1 | | Mean Difference (IV, Random, 95% CI) | Totals not selected |
|
| 15 Remission by cut‐off (post‐intervention) Show forest plot | 1 | | Odds Ratio (M‐H, Random, 95% CI) | Totals not selected |
|
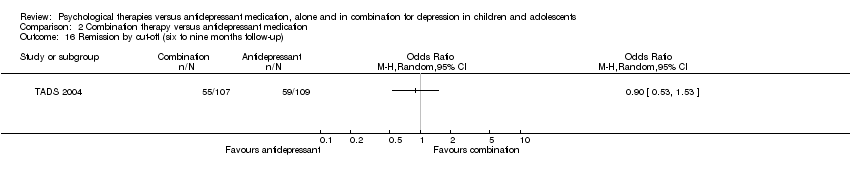
| 16 Remission by cut‐off (six to nine months follow‐up) Show forest plot | 1 | | Odds Ratio (M‐H, Random, 95% CI) | Totals not selected |
|
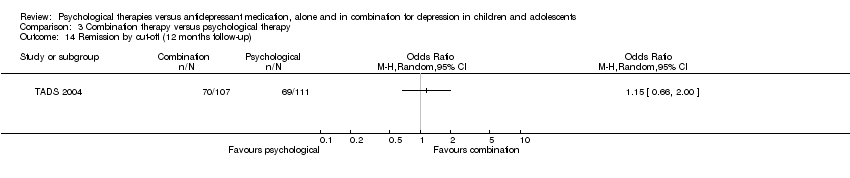
| 17 Remission by cut‐off (12 months follow‐up) Show forest plot | 2 | 319 | Odds Ratio (M‐H, Random, 95% CI) | 1.45 [0.60, 3.52] |
|
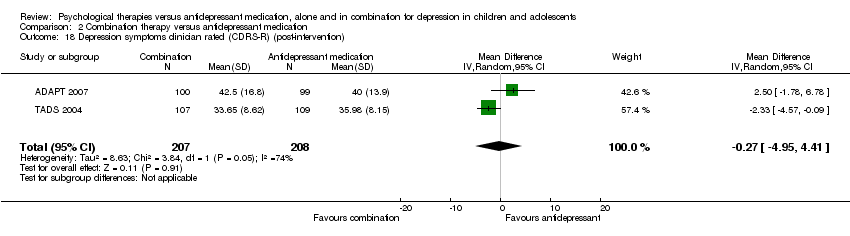
| 18 Depression symptoms clinician rated (CDRS‐R) (post‐intervention) Show forest plot | 2 | 415 | Mean Difference (IV, Random, 95% CI) | ‐0.27 [‐4.95, 4.41] |
|
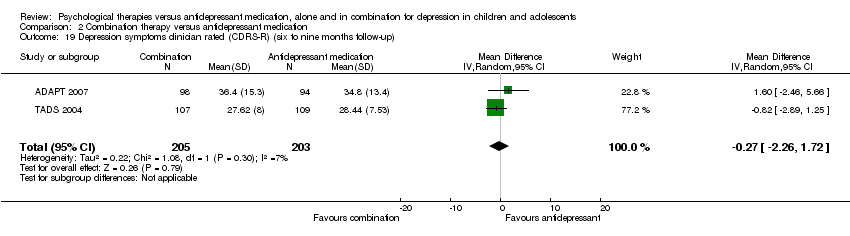
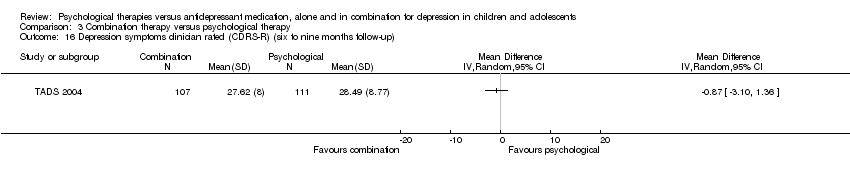
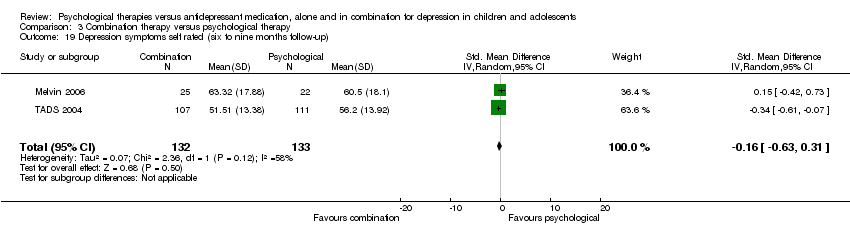
| 19 Depression symptoms clinician rated (CDRS‐R) (six to nine months follow‐up) Show forest plot | 2 | 408 | Mean Difference (IV, Random, 95% CI) | ‐0.27 [‐2.26, 1.72] |
|
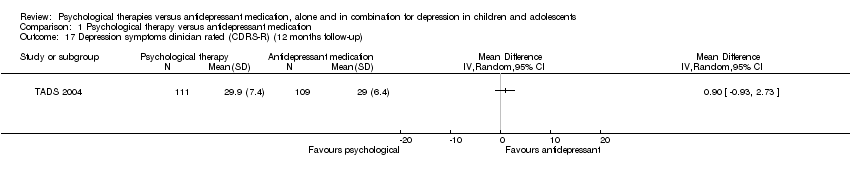
| 20 Depression symptoms clinician rated (CDRS‐R) (12 months follow‐up) Show forest plot | 1 | | Mean Difference (IV, Random, 95% CI) | Totals not selected |
|
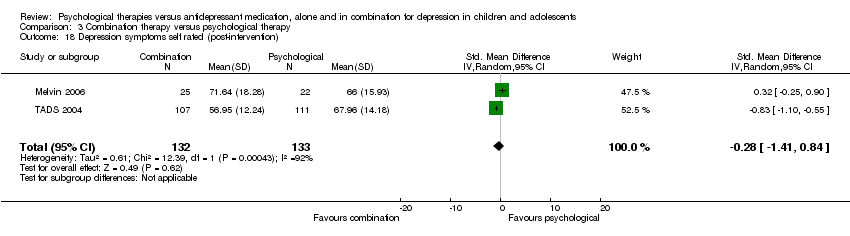
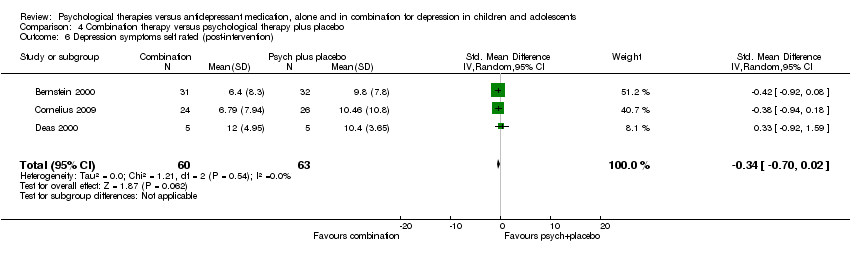
| 21 Depression symptoms self rated (post‐intervention) Show forest plot | 5 | 683 | Std. Mean Difference (IV, Random, 95% CI) | ‐0.14 [‐0.36, 0.09] |
|
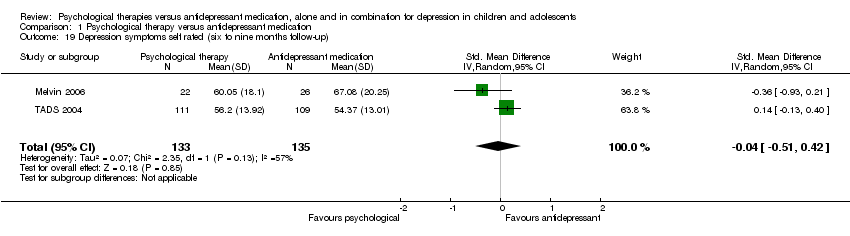
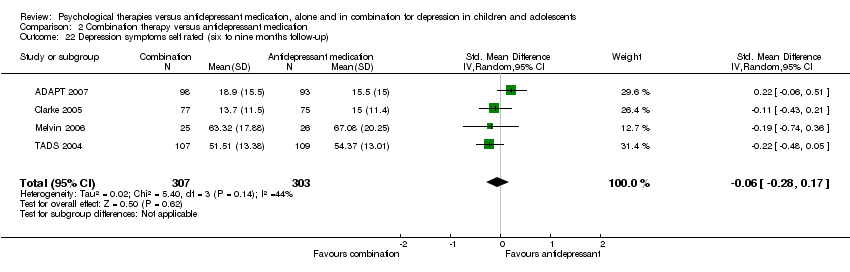
| 22 Depression symptoms self rated (six to nine months follow‐up) Show forest plot | 4 | 610 | Std. Mean Difference (IV, Random, 95% CI) | ‐0.06 [‐0.28, 0.17] |
|
| 23 Depression symptoms self rated (12 months follow‐up) Show forest plot | 2 | 368 | Std. Mean Difference (IV, Random, 95% CI) | ‐0.26 [‐0.46, ‐0.05] |
|
| 24 Functioning (post‐intervention) Show forest plot | 3 | 396 | Std. Mean Difference (IV, Random, 95% CI) | 0.09 [‐0.11, 0.28] |
|
| 25 Functioning (six to nine months follow‐up) Show forest plot | 3 | 385 | Std. Mean Difference (IV, Random, 95% CI) | 0.08 [‐0.12, 0.28] |
|
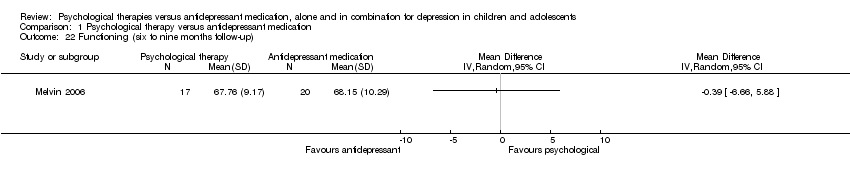
| 26 Functioning (12 months follow‐up) Show forest plot | 1 | | Mean Difference (IV, Random, 95% CI) | Totals not selected |
|