Comparaison de la chimiothérapie incluant un régime croissant de BEACOPP à la chimiothérapie incluant un régime de ABVD chez les patients atteints de lymphome de Hodgkin au stade précoce défavorable ou avancé
Résumé scientifique
Contexte
Il existe deux traitements de référence internationaux différents pour le lymphome de Hodgkin au stade précoce défavorable et avancé (LH) : la chimiothérapie avec un régime croissant de BEACOPP (bléomycine/étoposide/doxorubicine/cyclophosphamide/vincristine/procarbazine/ prednisone) et la chimiothérapie avec un régime de ABVD (doxorubicine/bléomycin/vinblastine/dacarbazine).
Objectifs
Apporter une réponse fondée sur les preuves concernant les avantages et les inconvénients de la chimiothérapie incluant un régime croissant de BEACOPP comparativement à la chimiothérapie incluant un régime de ABVD.
Stratégie de recherche documentaire
Nous avons recherché des essais contrôlés randomisés (ECR) dans MEDLINE, CENTRAL et dans des actes de conférences (de janvier 1985 jusqu'au mois de novembre 2010) et EMBASE (de 1985 jusqu'au mois de novembre 2008).
Critères de sélection
Nous avons inclus des essais contrôlés randomisés ayant examiné la chimiothérapie incluant au moins deux cycles de régimes croissants de BEACOPP comparativement à la chimiothérapie incluant au moins quatre cycles de régimes de ABVD en tant que traitement de première ligne chez les patients atteints de lymphome de Hodgkin au stade précoce défavorable ou avancé (LH).
Recueil et analyse des données
Nous avons utilisé le hazard ratio (HR) pour mesurer l'effet pour la survie globale (SG), la survie sans progression (SSP) et l'absence de première progression. Le risque relatif a été utilisé pour analyser le taux de réponse complète, la mortalité liée au traitement et les événements indésirables. Deux auteurs indépendants ont extrait les données et évalué la qualité des essais.
Résultats principaux
Au total, 790 dossiers ont été passés au crible. Cinq essais éligibles (quatre ayant été publiés, un étant en cours), ont été identifiés. Ces essais n'ont inclus que des patients adultes (âgés de 16 à 60 ans). Quatre essais totalisant 2 868 patients ont été inclus dans les méta‐analyses : les essais HD9 et HD14 menés en Allemagne, les essais HD2000 et GSM‐HD menés en Italie. Tous les essais ont rendu compte des résultats pour la SSP et la SG. La SSP était statistiquement significativement plus longue avec le régime croissant de BEACOPP : le HR était de 0,53 (intervalle de confiance (IC) à 95 % 0,44 à 0,64, I2 = 0 %). Il n'y avait pas de différence statistiquement significative dans la survie globale entre les traitements comparatifs : le HR était de 0,80 (IC à 95 % 0,59 à 1,09, I2 = 0 %). Trois essais ont rendu compte des évènements indésirables : les régimes croissants de BEACOPP ont provoqué statistiquement significativement plus de toxicités hématologiques de grade III ou IV selon l'OMS (anémie P < 0,00001, neutropénie P = 0,007, thrombocytopénie P < 0,00001), infections (P < 0,00001)) et l'apparition d'un syndrome myélodysplasique (SMD) ou d'une leucémie aiguë myéloïde (LAM) (P = 0,05). Il n'y avait aucune différence entre les deux régimes pour les tumeurs malignes secondaires, la mortalité liée au traitement ou l'infertilité.
Conclusions des auteurs
Cette méta‐analyse a montré que les patients adultes âgés de 16 à 60 ans atteints de lymphome de Hodgkin au stade précoce défavorable ou avancé (LH) ont bénéficié de la chimiothérapie incluant un régime croissant de BEACOPP concernant la SSP, mais il n'y avait aucune différence significative dans la SG. Une période de suivi plus longue et l'inclusion de l'essai EORTC 20012 permettront d'apporter une réponse plus définitive en ce qui concerne la survie globale (SG).
PICO
Résumé simplifié
Comparaison des deux traitements de référence internationaux par chimiothérapie chez les patients atteints de lymphome de Hodgkin au stade précoce défavorable ou avancé
Le lymphome de Hodgkin est une affection maligne du système lymphatique. C'est l'un des cancers les plus fréquents chez les jeunes adultes, en particulier au cours de la troisième décennie de la vie, mais il touche aussi les enfants et les personnes âgées. Au cours des cinquante dernières années, il est devenu l'une des formes de cancer les plus curables. Trouver le meilleur traitement ayant la plus grande efficacité et le moins de toxicité est le défi le plus important du traitement le lymphome de Hodgkin. Il existe deux traitements de référence internationaux pour le lymphome de Hodgkin au stade précoce défavorable ou avancé : la chimiothérapie avec un régime croissant de BEACOPP (bléomycine/étoposide/doxorubicine/cyclophosphamide/vincristine/procarbazine/ prednisone) instaurée par le groupe allemand d'étude de Hodgkin (German Hodgkin Study Group (GHSG)) et la chimiothérapie avec un régime de ABVD (doxorubicine/bléomycine/vinblastine/dacarbazine), dont l'utilisation est très répandue parce qu'elle s'avère efficace, bien tolérée et facile à administrer. Nous avons cherché à clarifier les avantages et les inconvénients des deux traitements en comparant les chances de survie (survie globale), le risque de récidive tumorale et les fréquences des événements indésirables après le traitement de patients atteints de lymphome de Hodgkin au stade précoce défavorable ou avancé.
Nous avons identifié cinq essais éligibles mais l'un d'eux n'avait pas été publié. Ces essais n'ont inclus que des patients adultes (âgés de 16 à 60 ans). Nous avons inclus 2 868 patients dans notre revue. L'analyse indique que les chances d'éviter une récidive tumorale sont meilleures chez les patients ayant suivi une chimiothérapie incluant un régime croissant de BEACOPP. Chez les patients atteints d'une maladie au stade précoce défavorable, 22 patients (intervalle de confiance (IC) à 95 % 18 à 29) devaient être traités pour prévenir une récidive tumorale au cours des 3,5 années ; chez les patients atteints d'une maladie au stade avancé, 7 patients (IC à 95 % 6 à 10) devaient être traités pour prévenir cet événement dans les 10 années. Le traitement avec un régime croissant de BEACOPP a entraîné un risque plus élevé d'événements indésirables tels que l'anémie (10 fois plus élevé) et la thrombocytopénie (19 fois plus élevé). Toutefois, cela n'a pas conduit à une augmentation de la mortalité liée au traitement. En outre, le risque de syndromes de leucémie myéloïde aiguë secondaire ou syndromes myélodysplasiques était de huit fois plus élevé chez les patients recevant un régime croissant de BEACOPP, mais le nombre total de tumeurs malignes secondaires n'était pas différent statistiquement dans les deux groupes de traitement. Aucune différence concernant la survie globale n'a pu être mise en évidence, ce qui pourrait s'expliquer par la courte période de suivi (moins de cinq ans) des trois essais inclus. Puisque plus de 70 % des patients atteints de lymphome de Hodgkin ont survécu les cinq premières années grâce à la chimiothérapie, la différence entre les régimes pourrait nécessiter plus de temps pour être perçue. Ainsi, une période de suivi plus longue et l'inclusion de l'essai récemment clôturé EORTC 20012 permettront d'apporter une réponse plus définitive en ce qui concerne la survie globale (SG).
Néanmoins, ces résultats ne peuvent être extrapolés que pour les patients adultes (âgés de 16 à 60 ans) atteints de lymphome de Hodgkin au stade précoce défavorable ou avancé. Les patients plus âgés présentent une toxicité liée au traitement plus grave et une mortalité plus élevée pendant le traitement que les patients plus jeunes, ce qui entraîne des résultats plus mauvais pour la survie chez les personnes âgées. L'essai randomisé HD9elderly a consisté à examiner le traitement de référence BEACOPP comparativement au régime de COPP/ABVD chez les patients âgés de plus de 65 ans et n'a pas mis en évidence de différence statistiquement significative pour la survie globale (taux de survie globale de 50 % à cinq ans dans les deux bras de traitement), mais a révélé un taux important plus élevé de décès toxiques, 21 % contre 8 %, après le traitement de référence BEACOPP. Par conséquent, les approches de traitement des patients âgés sont différentes de celles concernant les adultes âgés de moins de 60 ans et les résultats de cette revue ne sont pertinents que pour les patients adultes âgés de moins de 60 ans.
Authors' conclusions
Summary of findings
| Chemotherapy including escalated BEACOPP compared with chemotherapy including ABVD for patients with early unfavourable or advanced stage Hodgkin lymphoma | ||||||
| Patient or population: patients with early unfavourable or advanced stage Hodgkin lymphoma Intervention: chemotherapy including escalated BEACOPP Comparison: chemotherapy including ABVD | ||||||
| Outcomes | Illustrative comparative risks* (95% CI) | Relative effect | No of Participants | Quality of the evidence | Comments | |
| Assumed risk | Corresponding risk | |||||
| ABVD | escalated BEACOPP | |||||
| OS | Low risk population1 | HR 0.80 [0.59 to 1.09] | 2586 | +++O | ||
| 100 deaths per 1000 | 81 per 1000 | |||||
| High risk population2 | ||||||
| 250 deaths per 1000 | 206 per 1000 | |||||
| PFS | Low risk population3 | HR 0.53 [0.44 to 0.64] | 2586 | +++O | ||
| 100 progressions or relapses per 1000 | 54 per 1000 | |||||
| High risk population2 | ||||||
| 330 progressions or relapses per 1000 | 191 per 1000 | |||||
| CR rate | High risk population2 | RR 1.11 [1.06 to 1.16] | 1245 | ++++ | ||
| 831 complete responses per 1000 | 922 per 1000 | |||||
| Adverse events WHO grade III or IV | See comment | See comment | See comment | 2547 | +++O6 | Escalated BEACOPP regimens cause more haematological toxicities, infections, alopecia, mucositis and pain. No differences were found for constipation, nausea, neurologic toxicity. |
| Incidence of secondary malignancies | Low risk population2 | RR 0.95 (0.61 to 1.48) | 2547 | ++OO | As most of the trials had a median observation of less than 10 years, sufficient long term information on secondary malignancies cannot be expected. | |
| 2 per 1000 | 2 per 1000 (2 to 2) | |||||
| High risk population2 | ||||||
| 44 per 1000 | 42 per 1000 | |||||
| Incidence of infertility | 375 per 1000 | 514 per 1000 (311 to 847) | RR 1.37 [0.83 to 2.26] | 106 | +OOO | The subset of only 106 out of 608 eligible women of the HD9 were available for analyses regarding infertility. Reasons for availability are unknown and might have introduced bias in the results. |
| Treatment related mortality | See comment | See comment | RR 5.05 (0.25 to 103.87) | 197 | +OOO | No participant died in the control group and 2 died in the intervention group of the only study that reported this outcome. |
| *The basis for the assumed risk (e.g. the median control group risk across studies) is provided in footnotes. The corresponding risk (and its 95% confidence interval) is based on the assumed risk in the comparison group and the relative effect of the intervention (and its 95% CI). | ||||||
| GRADE Working Group grades of evidence | ||||||
| 1The risk for the "low risk population" (i.e. patients with early unfavourable HL) was taken from the GHSG HD8 trial, because the HD14 trial did not provide sufficient information regarding the control risk. 2The risk for the "high risk population" (i.e. patients with advanced stage of HL) was approximately the risk of the GHSG HD9 trial. 3The risk for the "low risk population" (i.e. patients with early unfavourable HL) was taken from the GHSG HD14 trial. 4 The median follow‐up varied between the trials. Longer follow‐ups and the inclusion of the EORTC 20012 trial will lead to a more precise estimate of the effect. This uncertainty causes the downgrading here. 5The definition of how to assess progression of disease varied between the trials. These heterogeneous definitions lead to an imprecise estimate of the effect that causes the downgrading here. 6So far two of the four trials reported results regarding adverse effects. The inclusion of further trials might lead to a more precise estimate of the effect. This uncertainty causes the downgrading here. 7 So far two of the four trials reported results regarding secondary malignancies. Furthermore, as most of the trials had a median observation of less than 10 years, sufficient long term information on secondary malignancies cannot be expected. The inclusion of further trials and results of longer follow‐up might lead to a more precise estimate of the effect. This uncertainty causes the downgrading here. 8 So far only 106 patients of the HD9 were analysed regarding infertility. The inclusion of further trials will lead to a more precise estimate of the effect.This uncertainty causes the downgrading here. 9 So far one of the four trials reported results regarding treatment‐related mortality. The inclusion of further trials will lead to a more precise estimate of the effect.This uncertainty causes the downgrading here. | ||||||
Background
Description of the condition
With an annual incidence of approximately two to three per 100,000 in western countries, Hodgkin lymphoma is a comparatively rare disease (SEER 2010). However, it is one of the most common malignancies in young adults. In industrialised countries the age distribution of Hodgkin lymphoma shows a first peak in the third decade and a second peak after the age of 55 (Swerdlow 2003; Thomas 2002).
Staging of Hodgkin lymphoma is based on the Ann Arbor system (Carbone 1971), B symptoms and risk factors. Risk factors for Hodgkin lymphoma are, for example, large mediastinal mass, three or more involved lymph node areas, high erythrocyte sedimentation rate (ESR), extranodal lesion, advanced age and these may vary slightly between different study groups. Additionally, the definition of bulky disease (largest tumour diameter > 10 cm), often referred to as the Cotswold modification (Lister 1989), is taken into consideration. Generally, Hodgkin lymphoma is classified into early favourable, early unfavourable and advanced stage (Engert 2007a; Klimm 2005). In Europe, the early favourable stage group usually comprises Ann Arbor stages I and II without risk factors. Early unfavourable stage includes those patients in stages I and II with risk factors, as well as selected patients with stage IIIA disease. Most stage III and IV patients are classified in the advanced stage risk group (Diehl 2001; Engert 2003). Patients with Ann Arbor stage IIB and some specific risk factors or stage II with bulky disease may be included in trials for advanced stages.
Standard chemotherapy for early unfavourable and advanced stage Hodgkin lymphoma in the United States is ABVD, a combination of adriamycin, bleomycin, vinblastine and dacarbazine (Cheson 2004). The ABVD regimen has less severe toxic effects on bone marrow than the previously used MOPP regimen (mechlorethamine, vincristine, procarbazine, and prednisone) and a non‐significant improvement in overall survival (OS) at five years compared to MOPP (66% for MOPP and 73% for ABVD) (Canellos 1992). The problem after both therapy regimens is that there is a 30% to 35% risk of disease progression or relapse within five years and a poor response to salvage treatment (Bonfante 1997; Josting 2002). The ABVD regimen has a number of advantages: it is all‐intravenous, has less cumulative myelotoxicity, a lower risk of secondary malignancies and a lower rate of infertility compared with the previous regimen (Cheson 2004).
In Germany, the standard treatment for early unfavourable and advanced stage Hodgkin lymphoma was COPP/ABVD until the middle 1990s. Then, based on a mathematical model of tumour growth and chemotherapy effects predicting that moderate dose escalation would increase tumour control by 10% to 15% at five years (Hasenclever 1996; Loeffler 1998), the German Hodgkin Study Group (GHSG) evaluated tolerability and efficacy of a new regimen, BEACOPP (bleomycin, etoposide, doxorubicin, cyclophosphamide, vincristine, procarbazine, prednisone) in time and dose intensification (Diehl 2003). After a median observation time of seven years, this study showed the superiority of the escalated BEACOPP regimen in comparison to COPP/ABVD in terms of freedom from treatment failure (85% versus 67%) and overall survival (90% versus 79%). However, an increased second leukaemia rate (acute myeloid leukemia (AML)/myeloid dysplastic syndrome (MDS)) was associated with the escalated BEACOPP regimen (Diehl 2003a; Diehl 2004).
Description of the intervention
This escalated BEACOPP schedule initiated by the German Hodgkin Study Group (GHSG) in the late 1990s combines a shorter time (shorter cycle) and increased dose (increased single dose) scheme with the following substances: bleomycin, etoposide, doxorubicin, cyclophosphamide, vincristine, procarbazine and prednisone. The regimen should have been applied in an escalated dose, which is given in the following table (Diehl 2003) and a cycle should have been repeated after 21 days. As supportive therapy, G‐CSF should have been administered during the escalated BEACOPP regimen from day eight of the cycle. The GHSG recommends to treat patients with early unfavourable stages with four cycles of chemotherapy (e.g. two cycles escalated BEACOPP followed by two cycles ABVD). Patients in advanced stages should receive four to six cycles of escalated BEACOPP followed by two to four cycles of standard BEACOPP.
| Drug | Single Dose (mg/m2) | Route | Days given* |
| Bleomycin | 10 | i.v. | 8 |
| Etoposide | 200 | i.v. | 1 to 3 |
| Doxorubicin | 35 | i.v. | 1 |
| Cyclophosphamide | 1200 | i.v. | 1 |
| Vincristine | 1.4 | i.v. | 8 |
| Procarbazine | 100 | p.o. | 1 to 7 |
| Prednisone | 40 | p.o. | 1 to 14 |
| G‐CSF |
| s.c. | from day 8 |
| *the regimen was repeated on day 22 i.v.: intravenously, p.o.: orally, s.c.: subcutaneous | |||
TABLE 1: the escalated BEACOPP regimen
We considered treatment with chemotherapy including ABVD regimen with or without radiotherapy as control condition. The ABVD regimen includes the following drugs: doxorubicin (adriamycin), bleomycin, vinblastine, and dacarbazine. A cycle should have been repeated after 28 days. The chemotherapy of the comparator arm should have included at least four cycles of ABVD. The ABVD regimen is considered as standard therapy for patients with Hodgkin lymphoma in some study groups (e.g. the Southwest Oncology Group considered in the trial E2496 eight cycles of ABVD as standard therapy). This regimen is widely used because it is well proven, supported by phase III data from the 1990s and it is well tolerated and easy to administer. It is effective for patients with early unfavourable or advanced stage without inducing too many adverse events (Gobbi 2005).
If additional radiotherapy was applied, the condition (based on remission status), dosage as well as field (involved or extended) must have been the same in both control and intervention arms. Supportive care should have been similar between control and intervention arms.
Why it is important to do this review
The most important challenge in treating Hodgkin lymphoma is to find the optimal treatment that accomplishes the best efficacy with least toxicity (Connors 2001; Connors 2005a). So far there are two different standards for the treatment of early unfavourable staged and advanced staged Hodgkin lymphoma. Chemotherapy with the ABVD regimen is widely used in North America (Canellos 2005a), while chemotherapy with escalated BEACOPP regimen is mostly used in Germany and some other parts of Europe.
Objectives
To determine the advantages and disadvantages of chemotherapy including escalated BEACOPP compared to chemotherapy including ABVD in the treatment of early unfavourable or advanced stage Hodgkin lymphoma. Besides the therapeutic effects on OS and PFS we also considered the therapy‐related risk of serious adverse events such as haematological toxicity, death under therapy, as well as long‐term complications such as secondary malignancies, infertility or cardiopulmonary toxicity.
Methods
Criteria for considering studies for this review
Types of studies
We considered only randomised controlled trials (RCT) as primary studies in this review and meta‐analysis (O'Connor 2008). We included both full text and abstract publications.
Types of participants
We included studies on male and female patients with previously untreated and histologically confirmed diagnosis of early unfavourable or advanced stage Hodgkin lymphoma. We would have accepted trials with protocols for children as well as adult patients, but we could not identify any randomised trial with children.
If the trial population was mixed, including patients with haematological malignancies, we would have used data from the Hodgkin lymphoma subgroup. If subgroups had been available (not reported and not provided after personally contacting the author), we would have included only trials with a minimum of 80% Hodgkin lymphoma patients, but we could not identify any trial of this type.
We included trials for early unfavourable or advanced stage Hodgkin lymphoma. We considered patients with Ann Arbor stage I/II with risk factors as early unfavourable and patients with Ann Arbor stage III/IV independently from risk factors as advanced stages. We accepted the risk factors used by the respective study group or institution and kept the classification defined and used by the respective study group or institution.
Types of interventions
To assure equal doses of chemotherapy, we considered chemotherapy including at least two cycles of escalated BEACOPP as the intervention condition and regimens including at least four cycles of ABVD as the control condition, both with or without radiotherapy as first‐line treatment for early unfavourable or advanced stage Hodgkin lymphoma (Hasenclever 2001).
We did not consider chemotherapy with BEACOPP given in the standard dose in this systematic review because the GHSG HD9 trial showed clearly better PFS results with the escalated regimen (Diehl 2004). We also did not take therapy with Dexa‐BEAM into account, as it is mostly used as salvage therapy for relapsed Hodgkin lymphoma patients.
If additional radiotherapy was applied, the condition, dosage and field should have been the same in both control and intervention arms.
Types of outcome measures
Primary outcomes
As primary outcomes we chose OS and PFS. The definition of OS was time from randomisation until death as a result of any cause (Cheson 2007a). Progression‐free survival was defined as the time from randomisation until disease progression, relapse or death as a result of any cause. However, we also accepted other definitions that addressed progression in the process of the disease such as freedom from treatment failure and event‐free survival. Freedom from treatment failure was defined as the time from randomisation until progression during treatment, lack of complete response at the end of treatment, relapse and death from any cause (GHSG HD9; GHSG HD14 (abstract)). The definition of event‐free survival was time from randomisation to evidence of severe toxicity causing definite treatment discontinuation, progressive lymphoma, cardiorespiratory failure, secondary leukaemia, death due to any cause, whichever occurred first (GSM‐HD 2008 (abstract)). Within the review, data coming under these definitions were discussed as results of PFS.
Secondary outcomes
As one secondary outcome, we selected the complete response (CR) rate, because this endpoint is directly measuring the response to the therapy and is one of the outcomes often evaluated in clinical trials in oncology.
We also analysed other tumour control outcomes such as freedom from first progression defined as time from randomisation to first evidence of progressive lymphoma (GSM‐HD 2008 (abstract)).
Other secondary outcomes were adverse events. As adverse events, we evaluated the following parameters:
-
treatment‐related mortality;
-
haematological grade III or IV toxicity, assessed according to the WHO‐scale, particularly thrombopenia, leucopenia, anaemia and infection;
-
secondary malignancies, particularly MDS and AML;
-
infertility (since infertility is only measurable indirectly, all assessed outcomes with respect to infertility are reported in the review);
-
cardiopulmonary toxicity: pulmonary toxicity (bleomycin induced lung fibrosis).
Search methods for identification of studies
We adapted search strategies from those suggested in the Cochrane Handbook for Systematic Reviews of Interventions (Lefebvre 2008). We applied no language restriction to reduce the language bias.
Electronic searches
We searched the following databases in two steps:
First step: MEDLINE (1985 to November 2008, search strategy see Appendix 1), EMBASE (1985 to November 2008, search strategy see Appendix 2) and Cochrane Central Register of Controlled Trials (CENTRAL) (The Cochrane Library 2008, Issue 3, search strategy see Appendix 3).
Second step: To keep the review up to date for publication we adapted the search strategies and performed another search in MEDLINE (November 2008 to August 2010, search strategy see Appendix 4) and CENTRAL (The Cochrane Library 2010, August 2010, search strategy see Appendix 5). EMBASE search was not updated because our account to this database ended in the meantime.
Searching other resources
We conducted the search for the years 1990 until August 2010. We searched those years which were included in CENTRAL via CENTRAL. We searched the conference proceedings of annual meetings of the following societies for abstracts:
-
American Society of Clinical Oncology (ASCO) (up to the issue of 2010);
-
American Society of Hematology (ASH) (up to the issue of 2010);
-
European Hematology Association (EHA) (up to the issue of 2010);
-
International Symposium on Hodgkin Lymphoma (ISHL) (up to the issue of 2010).
-
Handsearching of references: citations from identified trials and relevant review articles.
-
We checked references of all identified trials, relevant review articles and current treatment guidelines for further literature.
-
Personal contacts: We contacted experts in the field in order to locate other trials.
-
Databases of ongoing trials: Meta‐register of controlled trials: http://www.controlled‐trials.com/mrct/
-
We also searched a number of databases and web sites of relevant institutions, agencies, organisations (e.g. study groups), societies and registries for (ongoing) trials:
-
www.eortc.be/
-
www.ghsg.org/
-
www.ctc.usyd.edu.au/
-
www.trialscentral.org/index.html
Data collection and analysis
Selection of studies
Two review authors (KB, CB) independently screened titles and abstracts of studies identified from the sources above for potentially relevant studies. First screening discarded studies that were clearly ineligible. We assessed selected studies with an eligibility form to determine whether they met the inclusion criteria. We resolved any disagreement between the two review authors by discussion. We would have sought further information from the authors, whose articles contained insufficient data to make a decision about eligibility. The eligibility form contained the following questions:
-
Is the study described as a randomised trial for patients?
-
Were the participants newly diagnosed with early unfavourable or advanced stage Hogdkin lymphoma?
-
Were the participants in the intervention group treated with at least two cycles of escalated BEACOPP?
-
Were the participants in the control group treated with at least four cycles of ABVD?
To be eligible, studies had to meet all of the criteria stated above. We also identified duplicate reports.
We obtained all full text versions of all eligible studies for quality assessment and data collection. At every stage of searching and screening of the literature, we documented the overall number of studies identified, excluded and included with reasons in a flow diagram (Moher 2009). We resolved disagreements arising at any stage by discussion and consensus. If an agreement had not been reached, we would have asked a third review author (content expert) to give his or her opinion, but this procedure was not necessary.
Data extraction and management
We used both full‐text versions and abstracts (if full‐text was not published) of eligible studies to retrieve the data. In case these did not provide sufficient information, we contacted authors of individual studies for additional details (e.g. HD 2000; GHSG HD9). We conducted data extraction according to the guidelines proposed by The Cochrane Collaboration. For this review two review authors (KB, CB) extracted data independently from the studies using a standardised data extraction form containing the following items.
-
General information: first author of the publication, title of study, study ID, author's contact address (if available), source, publication date, country, language.
-
Quality and risk of bias assessment: sequence generation, allocation concealment, blinding (participants, personnel, outcome assessors), incomplete outcome data, selective outcome reporting, other sources of bias.
-
Trial details: trial design, objectives of the trial, types of outcomes reported, location, setting, sample size calculation, randomisation, treatment allocation, inclusion/exclusion criteria, reasons for exclusion, comparability of groups, length of follow‐up, stratification, stopping rules described, statistical analysis, results, power calculation, recruitment period, funding.
-
Characteristics of participants: age, gender, ethnicity, total number recruited/randomised/analysed (total and for each arm), stage of the disease (Ann Arbor stage, B‐symptoms and risk factors), tumour response (if it was a criteria for randomisation), lost to follow‐up, drop outs by trial arm and reasons.
-
Interventions: type of chemotherapy (name, dose and frequency of drugs from the chemotherapy regimen), number of cycles, length of a cycle and route of interventions, compliance to interventions, supportive therapy given, failure to maintain dose intensity, protocol violations, additional radiotherapy (dosage, field).
-
Outcomes measured: overall survival (OS), progression‐free survival (PFS) or similar tumour control outcomes, response, adverse events, especially haematological toxicity, treatment‐related mortality, secondary neoplasms, infertility, cardiopulmonary toxicity number of patients evaluated for each outcome, length of follow‐up for survival outcomes and definitions of the outcomes.
We extracted trials reported in more than one publication on one form only. We resolved potential disagreements by consensus. If an agreement had not been reached, we would have asked a third review author (content expert) to give his or her opinion, but this procedure was not necessary.
Assessment of risk of bias in included studies
Two review authors (KB, CB) assessed eligible studies obtained in the process of study selection as described above for methodological quality. To assess quality, we used the Cochrane Risk of Bias Table. To improve transparency of judgements, we included quotations from the full text article or from supplemental information from the author in the notes section of the Risk of Bias table.
We included the following items in the risk of bias assessment for randomised trials. For details of bias assessment we referred to the chapter on assessing Risk of Bias in the Cochrane Handbook 2008 (Higgins 2008):
There are three categories: yes (low risk of bias), unclear, and no (high risk of bias) in response to the following questions.
-
Was the allocation sequence adequately generated?
-
Was allocation adequately concealed?
-
Was the knowledge of the allocated intervention adequately prevented during the study?
-
Were incomplete outcome data adequately addressed (for every outcome separately)?
-
Are reports of the study free of selective outcome reporting?
-
Was the study apparently free of other problems that could put it at a risk of bias?
Measures of treatment effect
For binary variables, we estimated treatment effect measures of individual studies as relative effect measures risk ratio (RR) with corresponding 95% confidence intervals by using the Mantel‐Haenszel method in a fixed‐effect model. For time‐to‐event variables, we estimated treatment effects as hazard ratio (HR) with corresponding 95% confidence intervals by using the generic inverse variance method in a fixed‐effect model. For each trial, we extracted information about time to event outcome using the methods described by Tierney (Parmar 1998; Tierney 2007).
Dealing with missing data
We contacted the original investigators to request missing data and received additional information from Gianni et al., Engert et al. and Borchmann et al. We performed sensitivity analysis to assess how sensitive results were to reasonable changes in the assumptions that had been made. We addressed the potential impact of missing data on the findings of the review in the discussion.
Assessment of heterogeneity
We assessed heterogeneity of treatment effects between trials by using a Chi2 test with a significance level at P < 0.1. We used the I² statistic to quantify possible heterogeneity (30% < I² < 75%: moderate heterogeneity, 75% < I² : considerable heterogeneity) (Deeks 2008).
We explored potential causes of heterogeneity by performing sensitivity and subgroup analysis.
Assessment of reporting biases
In a meta‐analysis with more than 10 trials, we would have explored potential reporting bias by generating a funnel plot and statistically testing this by conducting a linear regression test (Sterne 2008). A P value less than 0.1 would have been considered significant for this test. However, we only included four trials so this test was not done.
Data synthesis
We performed meta‐analyses by using a fixed‐effect model (i.e. Generic Inverse Variance method for time‐to‐event outcomes and a Mantel‐Haenszel method for dichotomous outcomes).
We created a summary of findings table on absolute risks in each group with the help of GRADE (Schünemann 2008).
Subgroup analysis and investigation of heterogeneity
We took the following parameters into consideration for subgroup analysis of the primary outcomes:
-
stage of the disease (early unfavourable versus advanced);
-
age (e.g. children versus adults ≤ 50 years versus adults > 50 years, or depending on the median age of the trial);
-
treatment regimens (i.e. only ABVD regimen versus chemotherapy including ABVD regimen);
-
length of therapy (e.g. 4 versus 8 cycles of chemotherapy);
-
number of cycles of escalated BEACOPP (i.e. 2 versus 4 versus 8);
-
radiotherapy (with or without radiotherapy);
-
sequence (e.g. BEACOPP followed by other agents versus other chemotherapeutic agents followed by BEACOPP);
-
length of follow‐up (i.e. long follow‐up (more than 5 years) versus short follow‐up (5 years or less);
-
same total number of cycles of chemotherapy for the control and intervention groups (yes versus no).
In contrast to the planned procedure, subgroup analyses in terms of "age", "length of therapy", "radiotherapy", "sequence", and "same total number of cycles of chemotherapy" were not performed because the identified studies showed no differences due to these study characteristics.
Subgroup analysis was only performed for outcomes with a statistically significant effect on the overall meta‐analysis.
Sensitivity analysis
We assessed robustness of the results of the primary outcomes by analyses of the kind of publication (full text publications/abstracts) and the type of results (preliminary results/mature results).
Results
Description of studies
Results of the search
In total, 790 potentially relevant records related to treatment of patients with early unfavourable or advanced stage Hodgkin lymphoma were screened. Of these, 715 were excluded at the initial stage of screening because they did not fulfil our predefined inclusion criteria. The remaining 75 publications were retrieved as full text publications or abstract publications for detailed evaluation. Of these 75 references, 33 were excluded. Five eligible trials (four published and one ongoing) were identified and finally 4 trials (42 publications) with 2868 patients were formally included in the main analyses of this review (see Figure 1).
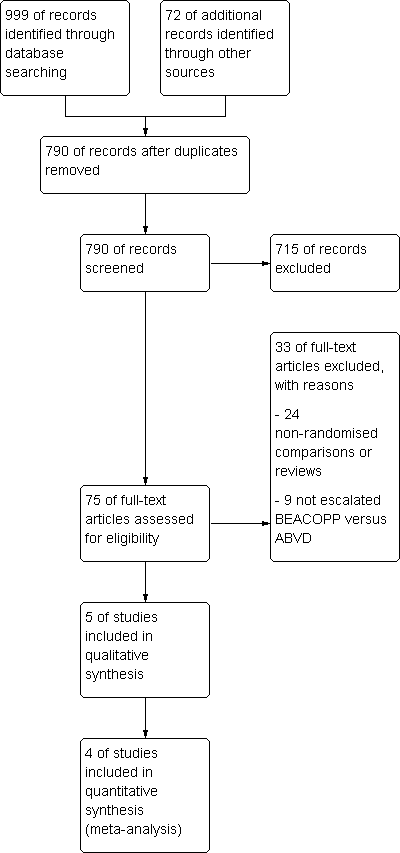
Study flow diagram.
Included studies
Four trials (GHSG HD9; GHSG HD14 (abstract); GSM‐HD 2008 (abstract); HD 2000) were included in the review. The data were extracted from full text publications for two trials (GHSG HD9; HD 2000). The other two trials were extracted from abstract publications (GHSG HD14 (abstract); GSM‐HD 2008 (abstract)). Furthermore, we received additional information from Gianni et al. and Borchmann et al. to complete the outcome data as well as information of patient characteristics of the published abstracts.
See also the table Characteristics of included studies.
Design
Of four included trials, two trials were two‐armed randomised controlled trials (GHSG HD14 (abstract); GSM‐HD 2008 (abstract)) and two trials were three‐armed randomised controlled trials (GHSG HD9; HD 2000). One of these trials recruited patients from 1993 to 1998 (GHSG HD9) and the others within a period between 2000 to 2008.
Participants
A total of 3575 patients with newly confirmed diagnosis of early unfavourable (GHSG HD14 (abstract) N=1655) or advanced stage HL (GHSG HD9 N = 1282; GSM‐HD 2008 (abstract) N = 331; HD 2000 N = 307) were randomised within the four trials, but only 2868 of these could be included in this review as they received regimens including escalated BEACOPP or ABVD (GHSG HD9 N = 727; GHSG HD14 (abstract) N = 1623; GSM‐HD 2008 (abstract) N = 321; HD 2000 N = 197).
All four studies had different eligibility criteria for age (GHSG HD9: 16 to 65 years; GHSG HD14 (abstract): 16 to 60 years; GSM‐HD 2008 (abstract): up to 60 years of age; HD 2000: older than 16 years of age.; Only two trials reported data regarding the median age of included patients in these studies (GHSG HD9: 32 years; HD 2000: 29 years). The proportion of the patients being older than 45 or 50 years was between 15% to 26% in the three reporting trials (GHSG HD9: escalated BEACOPP: 15% of 466 patients 50 to 65 years old; standard BEACOPP: 18% of 469 patients 50 to 65 years old; COPP/ABVD: 16% of 260 patients 50 to 65 years old; GSM‐HD 2008 (abstract): escalated BEACOPP 20% of 155 patients at least 45 years; ABVD 23% of 166 patients at least 45 years); HD 2000: escalated BEACOPP: 17% of 98 patients at least 45 years); CEC: 26% of 98 patients at least 45 years; ABVD: 18% of 99 patients at least 45 years.
Location
The included trials came from Europe. Two were performed by the German Hodgkin Study Group (GHSG HD9; GHSG HD14 (abstract)), the others were provided by Italian study groups (GSM‐HD 2008 (abstract); HD 2000).
Intervention
Patients from included trials were either treated with chemotherapy including escalated BEACOPP or with chemotherapy including ABVD as primary treatment for HL. The included trials used the following regimens: four escalated plus two standard courses of BEACOPP versus six courses of ABVD versus six courses of CEC (cyclophosphamide, lomustine, vindesine, melphalan, prednisone, epidoxorubicin, vincristine, procarbazine, vinblastine, and bleomycin) (HD 2000); two escalated courses of BEACOPP plus two courses of ABVD versus four courses of ABVD (GHSG HD14 (abstract)), eight escalated courses of BEACOPP versus eight courses of cyclophosphamide, vincristine, procarbazine, and prednisone (COPP) alternating with ABVD (GHSG HD9), four escalated plus four standard courses of BEACOPP versus six to eight courses of ABVD GSM‐HD 2008 (abstract). Three of these trials scheduled radiotherapy after chemotherapy for sites of previous bulky disease and slowly or partially responding sites with 30 to 40 Gray (GHSG HD9; GSM‐HD 2008 (abstract); HD 2000). In the GHSG HD14 (abstract) trial all patients received involved‐field radiotherapy of 30 Gray.
Outcomes
Primary outcome measure
All included trials analysed OS. The median observation times for OS were as follows: 10 years for one trial (GHSG HD9); 5 years for one trial (HD 2000); 3 to 3.5 years for two trials (GHSG HD14 (abstract); GSM‐HD 2008 (abstract)). PFS or similar outcomes (for further information see heading "Types of outcome measures: Primary outcomes") were analysed by all included trials. The median observation times for these outcomes were the same as for OS.
Secondary outcome measures
Three trials (GHSG HD9; GSM‐HD 2008 (abstract); HD 2000) reported CR rates. Analysable information with regard to adverse events was reported by the following studies: haematological grade III or IV toxicity by three studies (GHSG HD9; GHSG HD14 (abstract); HD 2000), secondary malignancies by three studies (GHSG HD9; GHSG HD14 (abstract); HD 2000), treatment‐related mortality was reported by one study (HD 2000) and respiratory toxicity by one study (GHSG HD9). Time to progression was reported by one study (GSM‐HD 2008 (abstract)) and data regarding infertility was reported only by one study (GHSG HD9).
Excluded studies
A total of 32 articles were excluded after detailed evaluation of full text publications. The main reasons for exclusion were:
-
24 non‐randomised comparisons or reviews;
-
8 not escalated BEACOPP versus ABVD.
These publications are described under Characteristics of excluded studies.
Ongoing studies
Currently there is one ongoing trial organised by the European Organization for Research and Treatment of Cancer (EORTC 20012). It started in 2002 and the estimated number of patients with previously untreated HL (clinical stage III or IV) to be included in this trial is 550. Patients will be randomised to receive either four courses of escalated BEACOPP plus four courses of standard BEACOPP or eight courses of ABVD. Further information about this trial is summarized under Characteristics of excluded studies: EORTC 20012.
Risk of bias in included studies
Allocation
The GHSG HD9 trial reported that treatment allocation of patients was performed at a central trials office and sequence was generated by computer. The other trials did not state any information with respect to these issues. However, sequence generation and allocation concealment were judged to probably be adequate in the GHSG HD14 (abstract), because other large multi‐centre trials of the GHSG have previously shown adequate randomised and allocation concealment.
Blinding
None of the trials reported information about blinding. Results with respect to OS are judged not to be influenced by this source of bias, because to define the status of a patient as dead or alive is not a question of individual judgement. With regard to the remaining outcomes all trials were judged "unclear" for the question of blinding.
Incomplete outcome data
HD 2000 and GHSG HD9 described missing outcome data in detail. The GHSG HD9 trial excluded 80 patients because they did not fulfil the inclusion criteria of the study and five patients due to other reasons. HD 2000 excluded all in all eight patients. Missing outcome data in both trials were balanced in numbers across intervention groups (see risk of bias tables for further details). The two trials that were published as abstracts (GHSG HD14 (abstract); GSM‐HD 2008 (abstract)) did not report any further details of exclusions. GHSG HD14 (abstract) did not include 32 of 1655 patients in the analyses, but missing outcome data were balanced in numbers across both groups (see risk of bias tables for further details). GSM‐HD 2008 (abstract) analysed 321 of the 331 randomised patients. However, due to the small proportion of missing data in most trials and the detailed descriptions in two of them, we do not believe that bias was introduced into the meta‐analysis by missing data.
Selective reporting
The HD 2000 trial was the only trial that had a registered protocol. Thus, little information was available about which outcomes were primary outcomes and how these were defined.
Other potential sources of bias
In the GHSG HD9 trial randomisation to the escalated BEACOPP arm started later than the randomisation to the ABVD arm and the standard BEACOPP arm. Furthermore, randomisation to the COPP/ABVD arm was stopped after the first interim analysis due to the fact that both BEACOPP groups together were significantly superior to COPP/ABVD in terms of the rate of freedom from treatment failure (Diehl 2003). According to this potential risk of bias, the analyses of OS and PFS were based on data of patients recruited within the same time period. J. Franklin, statistician for the HD9 trial, recalculated HR with CI for OS und PFS by considering only patients where randomised in the same time‐period ( between date 1 and date 2). He hat a direct access to the individual patient data. It means he considered 265 patients for the escalated BEACOPP arm and 177 patients for de COPP/ABVD arm.
The HD 2000 trial was initially designed to examine the myelotoxicity of CEC and BEACOPP regimens compared to ABVD, but the protocol was amended after the first 18 months to test the effect of BEACOPP regimen versus ABVD and CEC, respectively. To calculate the power of the study a one‐sided test was used to consider the expected superiority of BEACOPP in terms of FFS. To use a one‐sided test might have led to an underpowered design of the study.
Effects of interventions
See: Summary of findings for the main comparison
Primary outcome: overall survival (OS)
Participants
All four trials provided information regarding this outcome. To avoid the introduction of potential risk of bias that might have caused by the GHSG HD9 trial, patients of this trial had to be recruited in a parallel time period to be considered in the analyses (Other potential sources of bias). Together with the patients randomised in the three other trials this analysis included 2586 participants.
Results
In the main analysis, there was no statistically significant difference between treatment with escalated BEACOPP or ABVD on OS: HR was 0.80 (95% confidence interval (CI) 0.59 to 1.09, P = 0.16). There was no heterogeneity between the trials, with an I2 = 0% (see Figure 2).
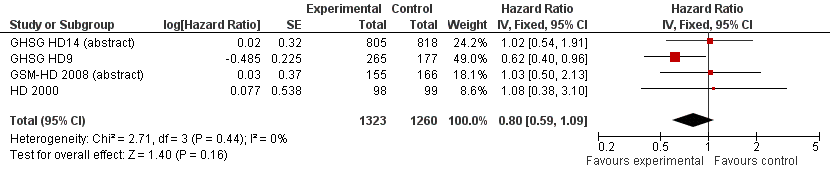
Forest plot of comparison: 1 Analysis of Overall Survival, outcome: 1.1 OS ‐ all ‐ same recruitment period between the 2 arms (HD9).
Subgroup analysis
Although no statistically significant heterogeneity was apparent, we conducted subgroup analysis to explore the underlying clinical heterogeneity in order to assess the influence of clinical differences between the studies.
The "test for subgroup differences" showed no statistical differences between the following subgroups:
-
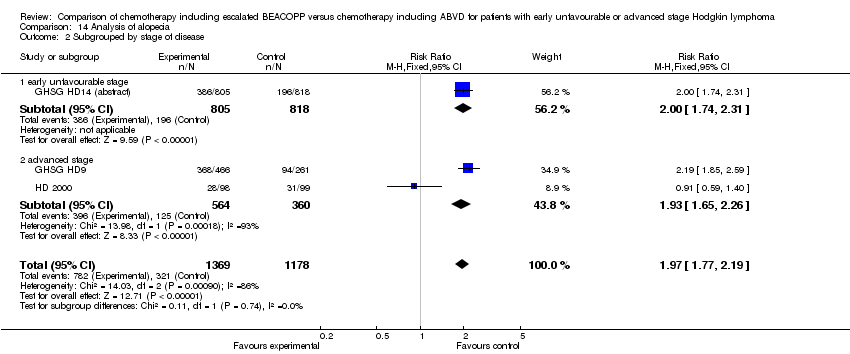
different stages of disease (P = 0.39, early unfavourable: 1 trial, N = 1010; advanced: 3 trials, N = 960);,
-
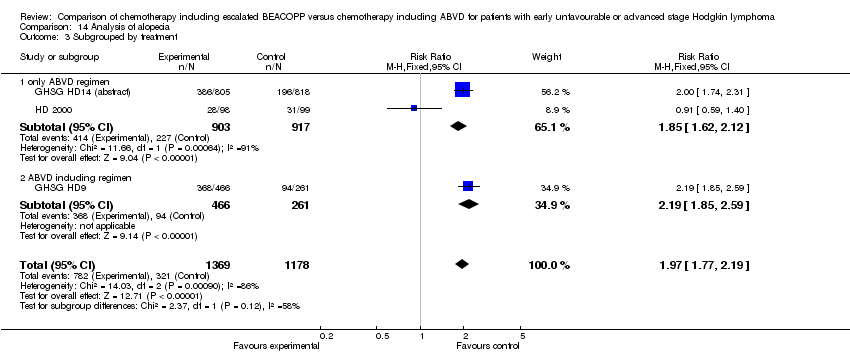
different types of treatment regimens (P = 0.10, only ABVD: 3 trials, N = 1528; ABVD including regimen: 1 trial, N = 442);
-
different numbers of cycles of escalated BEACOPP (P = 0.26, 8 cycles: 1 trial, N = 442; 4 cycles: 2 trials, N = 518; 2 cycles: 1 trial, N = 1010);
-
different length of follow‐up (P = 0.10, short term follow‐up: 3 trials, N = 1528; long term follow‐up: 1 trial, N = 442).
Subgroup analyses in terms of "age", "length of therapy", "radiotherapy", "sequence", and "same total number of cycles of chemotherapy" were not performed, because the identified studies showed no differences due to these study characteristics (see Subgroup analysis and investigation of heterogeneity).
Sensitivity analysis
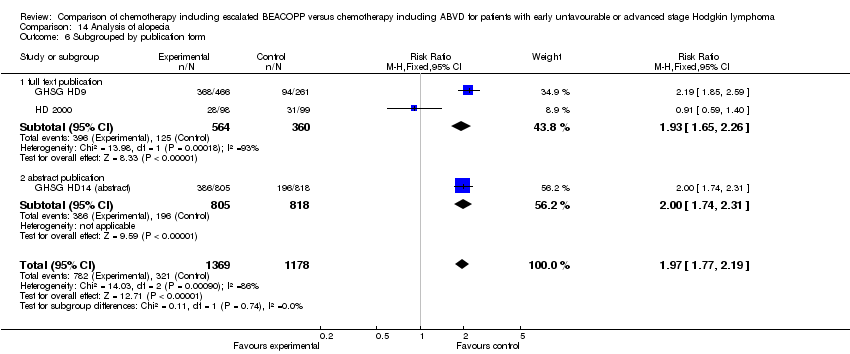
We further investigated how the publication form (full text publications/abstracts) or the type of results (preliminary results/mature results) may influence the analysis, but "test for subgroup differences" showed no statistically significant differences between the following sensitivity groups:
-
publication form (P = 0.18, full text publications: 2 trials, N = 639; abstracts: 2 trials, N = 1331);
-
type of results (P = 0.18, preliminary results: 2 trials, N = 133; mature results: 2 trials, N = 639).
Primary outcome: progression‐free survival
Participants
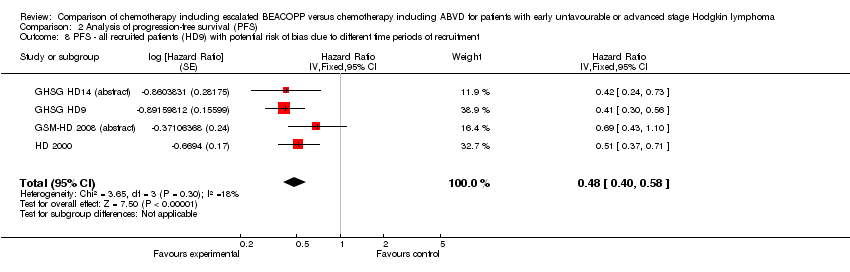
All four trials provided information regarding this outcome. Similar to the procedure for participants of OS, we used the data of patients who were recruited in the GHSG HD9 trial in parallel with the other three trials to perform the main analysis of PFS. This was to avoid the introduction of potential risk of bias (Other potential sources of bias). This analyses included data of 2586 patients from all four studies.
Results
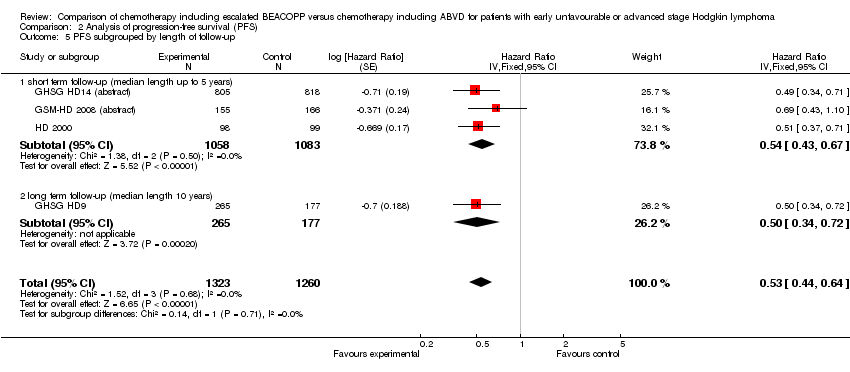
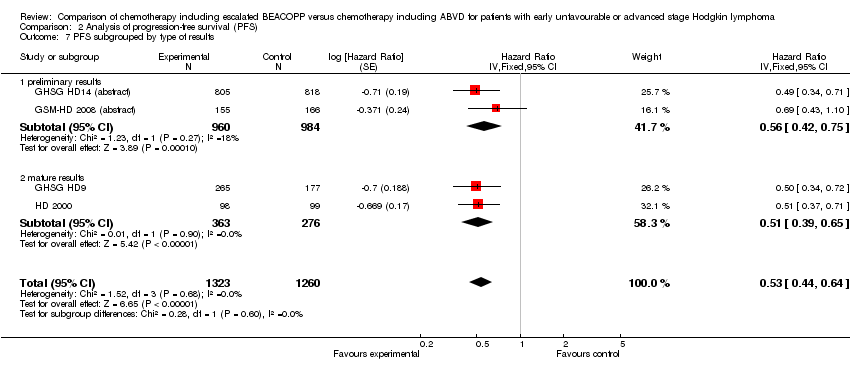
The main analysis of PFS showed a statistically significant improved outcome for patients with escalated BEACOPP: HR was 0.53 (95% CI 0.44 to 0.64, P < 0.00001, number needed to treat to benefit (NNTB) = 22 (95% CI 18 to 28) for early unfavourable stage HL, NNTB = 7 (95% CI 6 to 9) for advanced stage HL, see Figure 3; summary of findings Table for the main comparison). There was no heterogeneity between trials (I2 = 0%).
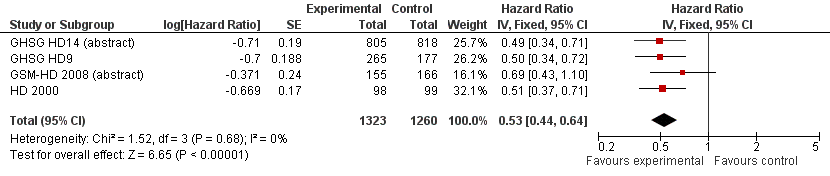
Forest plot of comparison: 2 Analysis of Progression Free Survival, outcome: 2.1 PFS ‐ all ‐ same recruitment period between the 2 arms (HD9).
Subgroup analysis
We conducted subgroup analysis to explore the potential underlying clinical heterogeneity between the studies. The "test for subgroup differences" showed no statistical differences between the following subgroups:
-
different stages of disease (P = 0.67, early unfavourable: 1 trial, N = 1623; advanced: 3 trials, N = 960);
-
different types of treatment regimens (P = 0.71, only ABVD: 3 trials, N = 2144; ABVD including regimen: 1 trial, N = 442);
-
different numbers of cycles of escalated BEACOPP (P = 0.78, 8 cycles: 1 trial, N = 442; 4 cycles: 2 trials, N = 518; 2 cycles: 1 trial, N = 1623);
-
different length of follow‐up (P = 0.71, short term follow‐up: 3 trials, N = 2144; long term follow‐up: 1 trial, N = 442).
As explained above, subgroup analyses in terms of "age", "length of therapy", "radiotherapy", "sequence", and "same total number of cycles of chemotherapy" were not performed (see Subgroup analysis and investigation of heterogeneity).
Sensitivity analysis
We did not find any statistically significant differences between the sensitivity groups:
-
publication form (P = 0.60, full text publications: 2 trials, N = 639; abstracts: 2 trials, N = 1820);
-
type of results (P = 0.60, preliminary results: 2 trials, N = 1820; mature results: 2 trials, N = 639).
Secondary outcome: complete response (CR) rate
Participants
CR rate data were available from three trials (GHSG HD9; GSM‐HD 2008 (abstract); HD 2000) that included 1245 participants. Data from the parallel randomisation period of the GHSG HD9 trial were not available so we used the provided CR results of all included patients of this trial.
Results
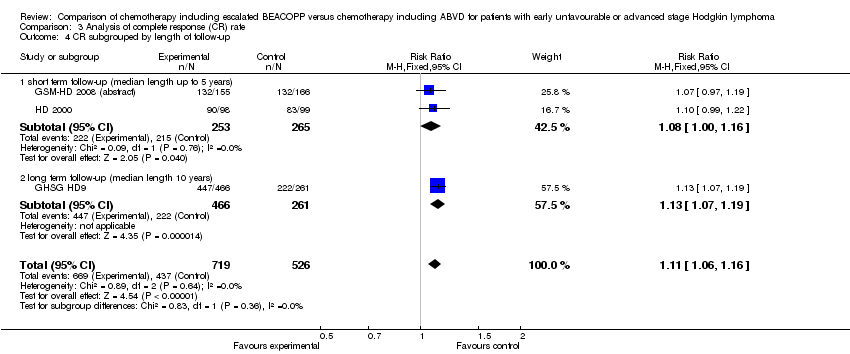
The overall estimate of CR rate showed a RR of 1.11 (95% CI 1.06 to 1.16, P < 0.00001, I² = 0%) in favour of BEACOPP included regimens (see Figure 4).
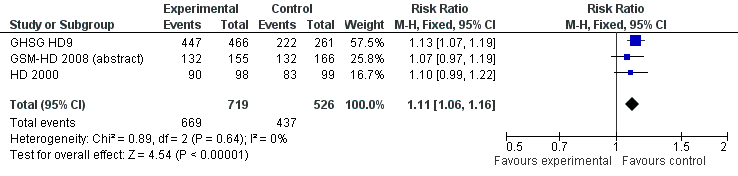
Forest plot of comparison: 3 Analysis of complete response (CR) rate, outcome: 3.1 CR.
Subgroup analysis
We did not find any statistical differences between the following subgroups:
-
different types of treatment regimens (P = 0.36, only ABVD: 2 trials, N = 518; ABVD including regimen: 1 trial, N = 727);
-
different numbers of cycles of escalated BEACOPP (P = 0.36, 8 cycles: 1 trial, N = 727; 4 cycles: 2 trials, N = 518);
-
different length of follow‐up (P = 0.36, short term follow‐up: 2 trials, N = 518; long term follow‐up: 1 trial, N = 727).
Subgroup analyses regarding "age", "length of therapy", "radiotherapy", "sequence", "stage of disease", "type of results" and "same total number of cycles of chemotherapy" were not performed (for more details see "Primary outcome: Overall survival (OS)" and Subgroup analysis and investigation of heterogeneity).
Sensitivity analysis
We did not find any statistically significant differences between the sensitivity groups:
-
publication form (P = 0.43, full text publications: 2 trials, N = 924; abstracts: 1 trials, N = 321).
Sensitivity analyses in terms of "type of results" were not performed because the identified studies showed no differences due to these study characteristics (see Subgroup analysis and investigation of heterogeneity).
Secondary outcome: freedom from first progression
Participants
Data of the treatment‐related mortality was only available from the GSM‐HD 2008 (abstract) trial with 321 participants.
Results
There was a statistically significant difference favouring escalated BEACOPP with regard to freedom from first progression (1 trial, N = 321, RR 0.51, 95% CI 0.31 to 0.85, P = 0.010).
Subgroup and sensitivity analysis
We did not perform subgroup and sensitivity analysis for this outcome since there was only one included study.
Secondary outcome: treatment‐related mortality
Participants
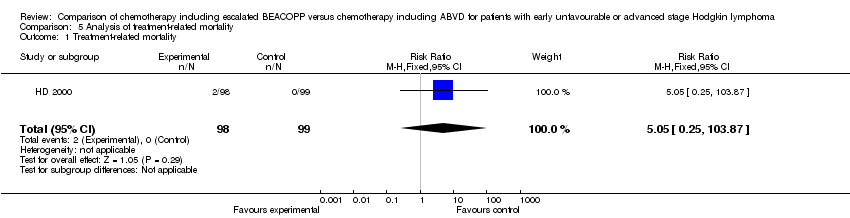
Data of the treatment‐related mortality was only available from the HD 2000 trial with 197 participants. The GHSG HD14 (abstract) mentioned that there was no difference in treatment‐related mortality between treatment arms, but did not provide any further data.
Results
There were no statistically significant differences between escalated BEACOPP and ABVD‐like regimens regarding treatment‐related mortality (1 trial, N = 197, RR 5.05, 95% CI 0.25 to 103.87, P = 0.29).
Subgroup and sensitivity analysis
We did not perform subgroup and sensitivity analysis for this outcome because there was only one included study.
Secondary outcome: adverse events, secondary malignancies and infertility
Participants
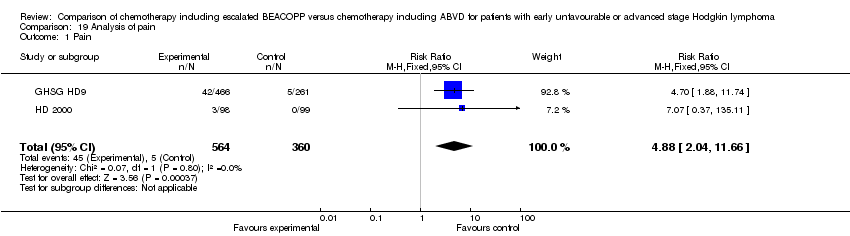
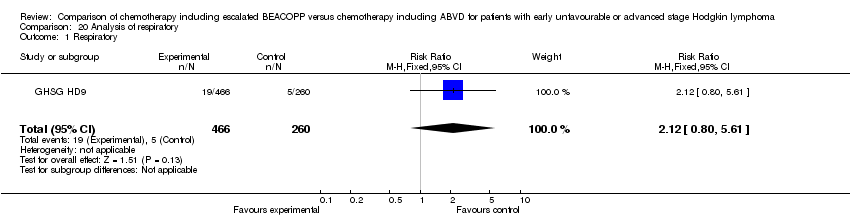
Data of the majority of acute adverse effects WHO grade III or IV (i.e. anaemia, infection, leucopenia, thrombocytopenia, alopecia) constipation, mucositis, nausea/vomiting, neurologic toxicity, pain) and number of secondary malignancies were reported by three trials (GHSG HD9; GHSG HD14 (abstract); HD 2000) including 2604 participants. Further acute adverse effects (constipation, mucositis, nausea/vomiting, neurologic toxicity, pain) and the occurrence of MDS or AML were reported by two trials (GHSG HD9;HD 2000) including 924 participants. Neutropenia was only available from the HD 2000 trial with 197 participants. Acute adverse effects of the respiratory tract and the skin were only provided by the GHSG HD9 trial with 726 patients. Data regarding infertility were only applied for 106 women of the GHSG HD9 trial.
Results
The escalated BEACOPP regimen caused statistically significantly more acute adverse effects WHO grade III or IV in terms of:
-
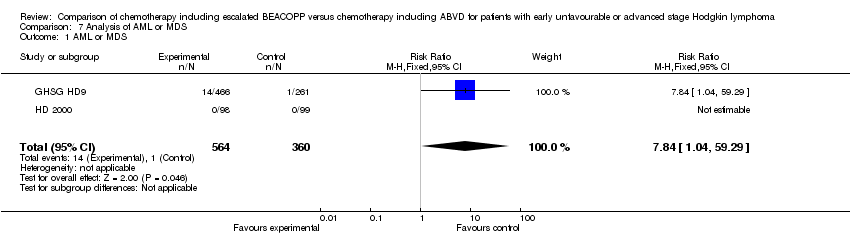
occurrence of MDS or AML (2 trials, N = 924, RR 7.84, 95% CI 1.04 to 59.29, P = 0.05);
-
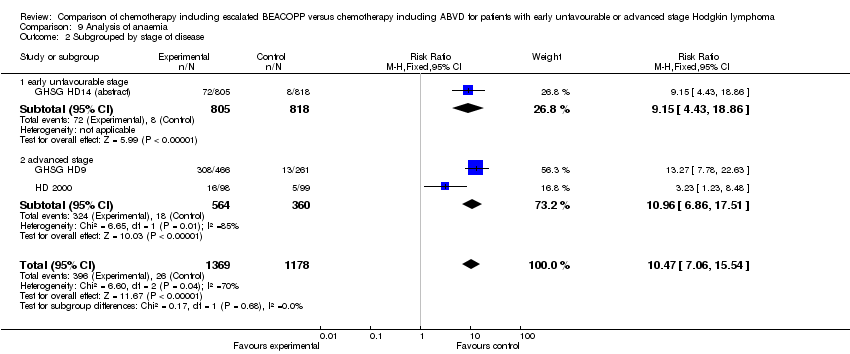
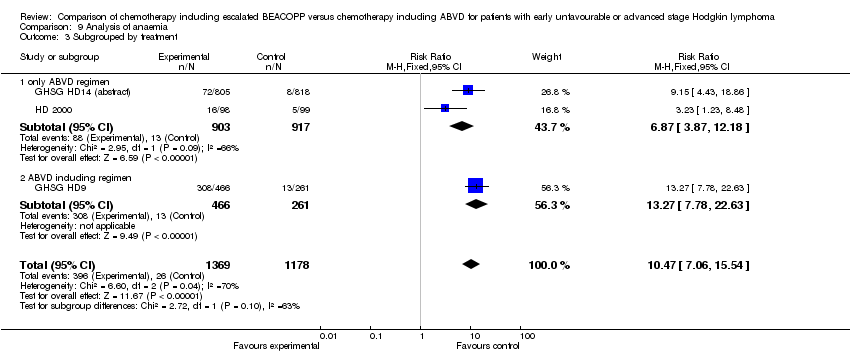
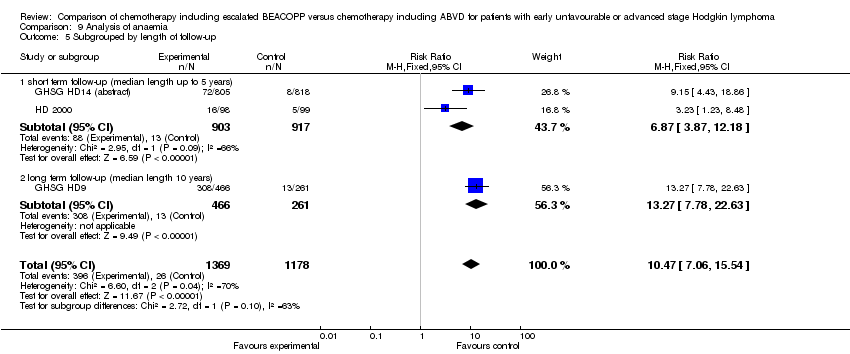
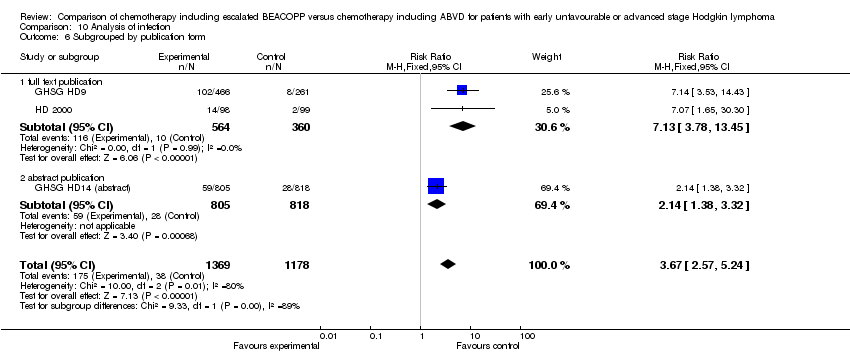
anaemia (3 trials, N = 2547, RR 10.47, 95% CI 7.06 to 15.54, P < 0.00001);
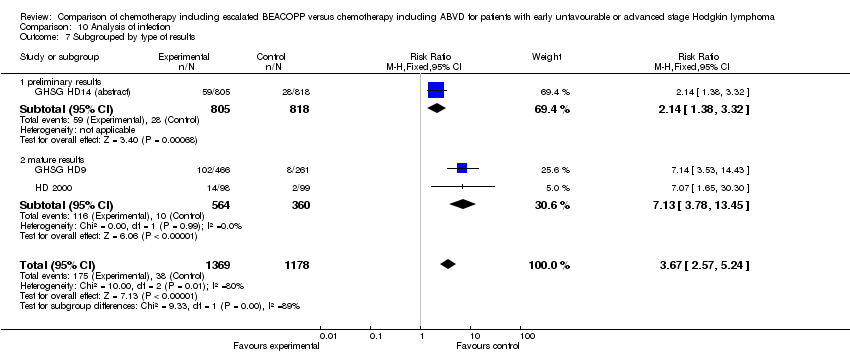
-
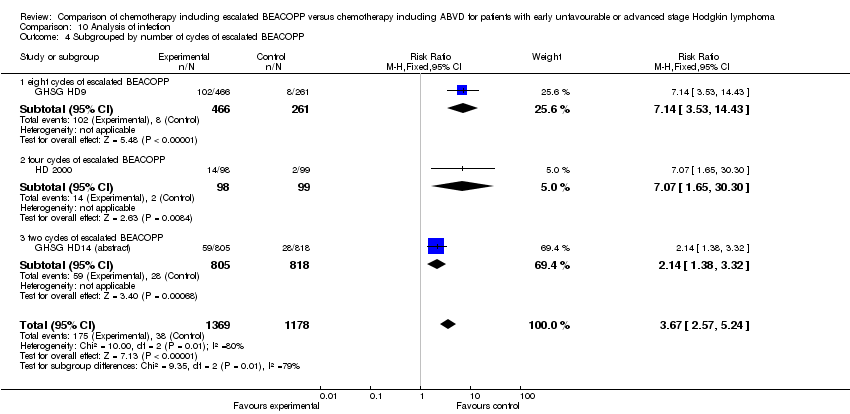
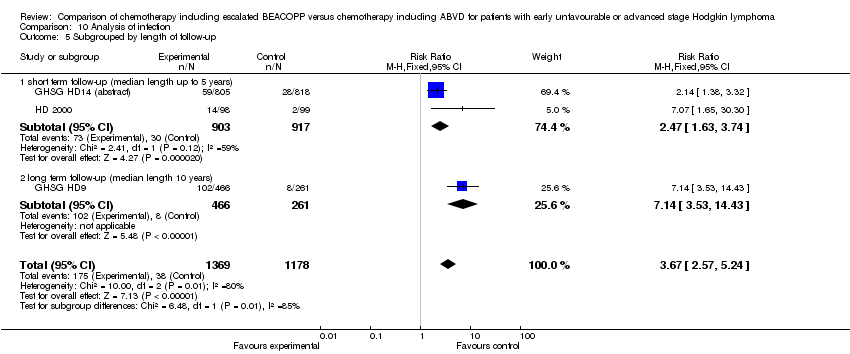
infection (3 trials, N = 2547, RR 3.67, 95% CI 2.57 to 5.24, P < 0.00001);
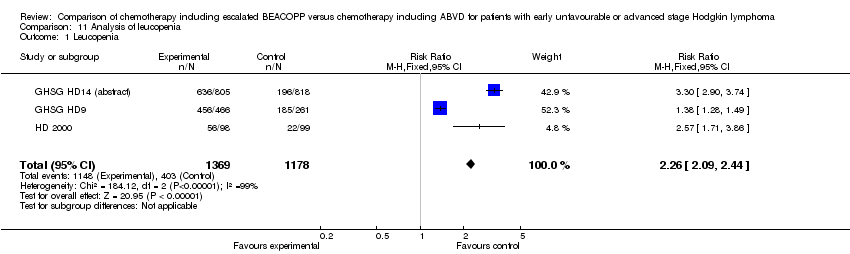
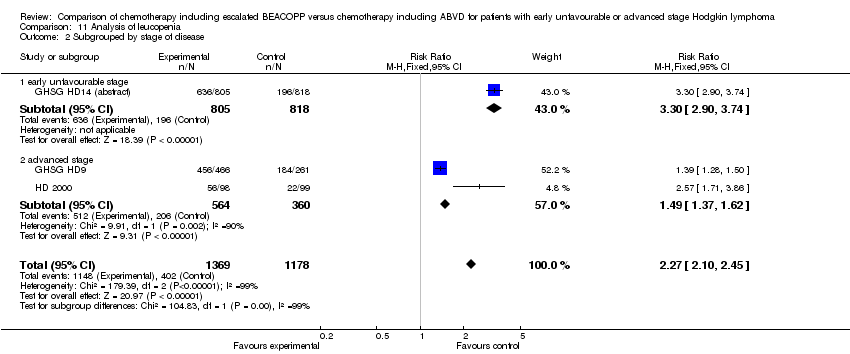
-
leucopenia (3 trials, N = 2547, RR 2.26, 95% CI 2.10 to 2.44, P < 0.00001);
-
neutropenia (1 trial, N = 197, RR 1.57, 95% CI 1.13 to 2.19, P = 0.007);
-
thrombocytopenia (3 trials, N = 2547, RR 18.73, 95% CI 12.17 to 28.82, P < 0.00001);
-
alopecia (3 trials, N = 2547, RR 1.97 95% CI 1.77 to 2.19, P < 0.00001);
-
mucositis (2 trials, N = 923, RR 6.32, 95% CI 2.25 to 17.65, P = 0.0005);
-
pain (2 trials, N = 923, RR 4.88, 95% CI 2.04 to 11.66, P = 0.0004).
The absolute numbers of MDS or AML seen within the trials were small (GHSG HD9: 14 of 466 BEACOPP patients, 1 of 261 COPP/ABVD patients; HD 2000: no cases of MDS or AML were seen within this trial).
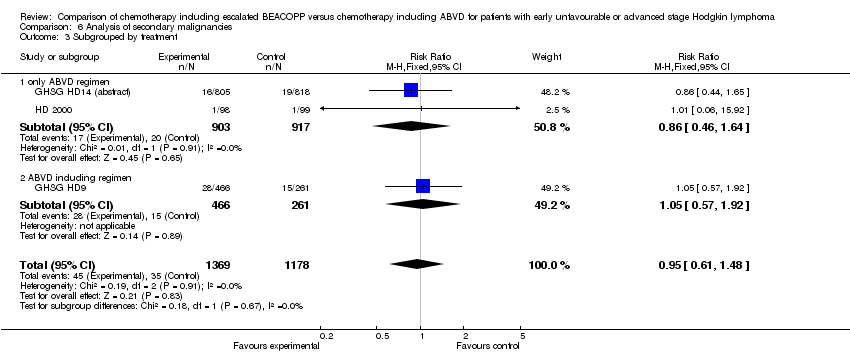
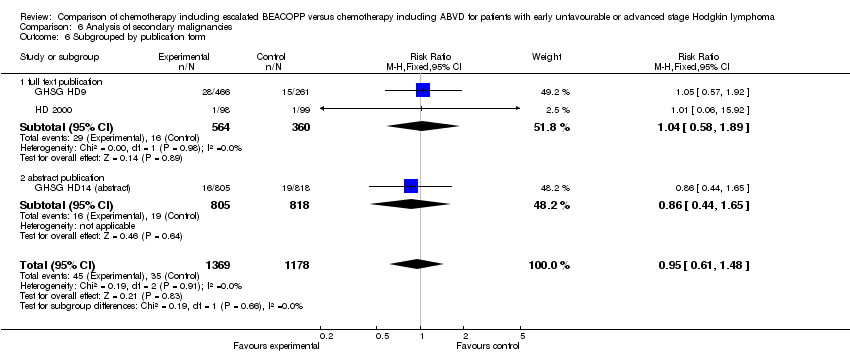
No statistically significant differences between escalated BEACOPP and ABVD‐like regimens were found for:
-
the total of secondary malignancies (3 trials, N = 2547, RR 0.95, 95% CI 0.61 to 1.48, P = 0.83);
-
secondary amenorrhoea as a quantity of infertility (1 trial, N = 106, RR 1.37 0.83 to 2.26, P = 0.22);
-
constipation (2 trials, N = 923, RR 1.19, 95% CI 0.56 to 2.55, P = 0.65);
-
nausea/vomiting (2 trials, N = 923, RR 0.94, 95% CI 0.71 to 1.25, P = 0.67);
-
neurologic toxicity (2 trials, N = 923, RR 1.14, 95% CI 0.55 to 2.35, P = 0.73);
-
acute adverse effect of the respiratory tract (1 trials, N = 726, RR 2.12, 95% CI 0.80 to 5.61, P = 0.13);
-
effects on skin (1 trial, N = 726, RR 2.60, 95% CI 0.76 to 8.98, P = 0.13).
Subgroup and sensitivity analysis
For further information regarding subgroup analysis of these outcomes see section "Data and analyses".
Discussion
Summary of main results
In this systematic review, we analysed the efficacy and safety of escalated BEACOPP and ABVD chemotherapies for the treatment of early unfavourable or advanced stage HL. The results are summarized in the summary of findings Table for the main comparison. The findings emerging from this meta‐analyses are as follows::
1) The present meta‐analysis showed no statistically significant difference in OS for patients with early unfavourable or advanced stage HL.
2) The meta‐analysis showed a statistically significant improved PFS for patients with early unfavourable or advanced stage HL who received escalated BEACOPP based chemotherapy.
3) Treatment with escalated BEACOPP caused statistically significantly more haematological toxicities WHO grade III or VI, such as infection, alopecia, mucositis and pain in patients with early unfavourable or advanced HL.
4) The meta‐analysis showed a statistically significant higher number of MDS or AML in patients with advanced HL treated with escalated BEACOPP, but the overall rate of secondary malignancies was not different between the comparators.
5) So far there is not enough evidence to judge the effects of both regimens on infertility. However, available data showed no differences between the treatments in patients with advanced HL.
Overall completeness and applicability of evidence
Four of the five identified eligible trials have been published (EORTC 20012 trial is still ongoing). The trials included adult patients between 16 and 65 years of age (GHSG HD9: 16 to 65 years; GHSG HD14 (abstract): 16 to 60 years); GSM‐HD 2008 (abstract): up to 60 years of age; HD 2000: older than 16 years of age) with intermediate or advance stage of HL. They provided sufficient evidence with regard to survival outcomes and adverse events (chemotherapy including BEACOPP caused more acute toxicities as well as a higher risk of AML/MDS) but data on treatment‐related mortality and long‐term toxicity (e.g. fertility, secondary malignancies, cardiac toxicity) are still insufficient. All in all, the meta‐analyses showed an improved PFS for patients who received chemotherapy including escalated BEACOPP. This indicates the benefit of treating patients with escalated BEACOPP regimens, even if the meta‐analyses showed no difference between the comparators regarding OS. Thus, longer follow‐up and the inclusion of the recently closed EORTC 20012 trial will shed more light on this question and should allow a more definitive answer with respect to OS.
Nevertheless, these results can only be extrapolated to Hodgkin populations which are of the same age group as the patients in this meta‐analysis. In contrast to younger patients, older patients experience more severe treatment‐related toxicity and a higher mortality during treatment which leads to poorer survival outcome in elderly patients (Engert 2005; Levis 1994; Peterson 1982) . In line with these findings, the randomised HD9 elderly trial examining BEACOPP baseline compared to COPP/ABVD in patients older than 65 years showed no statistically significant difference for overall survival (50% overall survival rate at five years in both arms), but an important difference of 21% compared to 8% toxic deaths after treatment with BEACOPP baseline (Ballova 2005). Therefore, treatment approaches for elderly patients have to be differentiated from the ones of patients under 60 years. So the results of this review are only relevant for adult patients younger than 60 years of age.
Quality of the evidence
Escalated BEACOPP regimens were investigated for early unfavourable as well as advanced stages of HL. A total of 790 references were screened. Five trials (four published and one ongoing) fulfilled the inclusion criteria. Four trials with 2868 patients were included in the main analyses: the GHSG HD9 and GHSG HD14 (abstract) trials from the Germany Hodgkin Study Group, the GSM‐HD 2008 (abstract) and HD 2000 trials from Italy. Only one trial (GHSG HD9) had a follow‐up of more than five years. The quality of evidence was high, because no serious risks of bias could be identified and all included studies reported data for the primary and most of the secondary outcomes.
For patients with early unfavourable HL, the investigation of more intensive chemotherapy regimens is an approach to improve long‐term results. Within this context two trials (Eich 2010; Ferme 2007a), examined the treatment with four to six cycles ABVD compared to four cycles BEACOPP baseline. Neither showed an advantage of BEACOPP baseline regarding response, freedom from treatment failure/event‐free survival, or OS. However, following the rationale to aim at improved outcomes by dose escalation, the HD14 trial was designed to examine the even more intensive regimen of two cycles of escalated BEACOPP plus two cycles of ABVD compared to four cycles of ABVD, both followed by 30 Gray involved field radiotherapy (IF‐RT) for early unfavourable HL. This further intensification might be a success, because after a median follow‐up of 3.5 years the trial showed an improved freedom from treatment failure for patients who received escalated BEACOPP (HR 0.49, 95% CI 0.34 to 0.71), even if a difference with regard to overall survival was not detectible within this short period (GHSG HD14 (abstract)).
The discussion on pros and cons of escalated BEACOPP compared to other treatment options, especially ABVD, for HL patients with advanced‐stage disease is active since the GHSG HD9 trial has been provided. All published trials that examined patients with newly diagnosed advanced stage HL showed an improved PFS (HR 0.53, 95% CI 0.44 to 0.64, P < 0.00001). This, so far, has not led to a statistically significant difference regarding OS within the subgroup of patients with advanced stage HL (HR 0.74, 95% CI 0.52 to 1.06, P = 0.10), which might be caused by length of follow‐up in trials (two trials up to five years follow‐up, one trial more than five years follow‐up) and the small number of events (since median overall survival rate at five years is more than 70% HL patients) (Canellos 2005; Duggan 2003; HD 2000). A previous publication of the HD9 trial with a median follow‐up of five years showed a statistically significant improvement in freedom from treatment failure (FFTF) for patients who received escalated BEACOPP but failed to show a statistically significant difference regarding OS. In contrast, the last analysis of the 10 year results showed a statistically significant improvement in FFTF as well as a statistically significant improvement in OS for patients who received escalated BEACOPP (GHSG HD9). Another point to consider is the use of COPP/ABVD as the standard arm within the HD9 trial, as was chosen between 1993 to 1998, as similar altering regimens such as MOPP/ABVD or MOPP/ABV were regarded as standard by most groups (Diehl 2003a). However, five year OS rates for ABVD‐only regimens in randomised trials report 84% (6 cycles of ABVD; HD 2000), 82% (8 to 10 cycles of ABVD; Duggan 2003) or 73% (5 to 8 cycles of ABVD; Canellos 2005) compared to the five year OS rate of 83% in the HD9 trial indicate that COPP/ABVD is as effective, and may be favourable, compared to ABVD.
Potential biases in the review process
To prevent bias within the review, only RCTs were considered. In addition, all important conference proceedings were searched up to their latest issue.
One concern associated with the GHSG HD9 trial was that randomisation to the escalated BEACOPP arm started later than the randomisation to the other two arms. Furthermore, randomisation to the COPP/ABVD‐arm was stopped after first interim analysis due to the fact that both BEACOPP groups together were statistically significantly superior to COPP/ABVD in terms of the rate of freedom from treatment failure (Diehl 2003). According to this potential risk of bias, the analyses of OS and PFS were based on data of patients recruited within the same time period (COOPP/ABVD N = 177, BEACOPP N = 265).
In summary, there is maximum likelihood that all relevant studies were identified, all relevant data could be obtained and the review process (searching, data collection, analysis) did not introduce bias into the review.

Study flow diagram.

Forest plot of comparison: 1 Analysis of Overall Survival, outcome: 1.1 OS ‐ all ‐ same recruitment period between the 2 arms (HD9).

Forest plot of comparison: 2 Analysis of Progression Free Survival, outcome: 2.1 PFS ‐ all ‐ same recruitment period between the 2 arms (HD9).

Forest plot of comparison: 3 Analysis of complete response (CR) rate, outcome: 3.1 CR.

Comparison 1 Analysis overall survival, Outcome 1 OS ‐ all ‐ same recruitment period between the 2 arms (HD9).

Comparison 1 Analysis overall survival, Outcome 2 OS subgrouped by stage of disease.
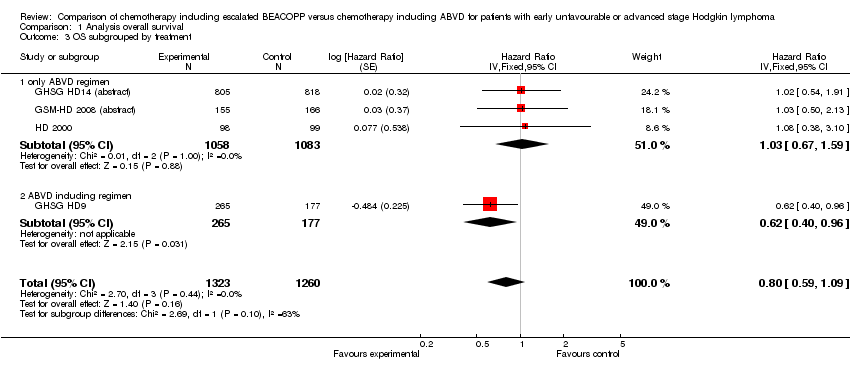
Comparison 1 Analysis overall survival, Outcome 3 OS subgrouped by treatment.

Comparison 1 Analysis overall survival, Outcome 4 OS subgrouped by number of cycles of escalated BEACOPP.

Comparison 1 Analysis overall survival, Outcome 5 OS subgrouped by length of follow‐up.
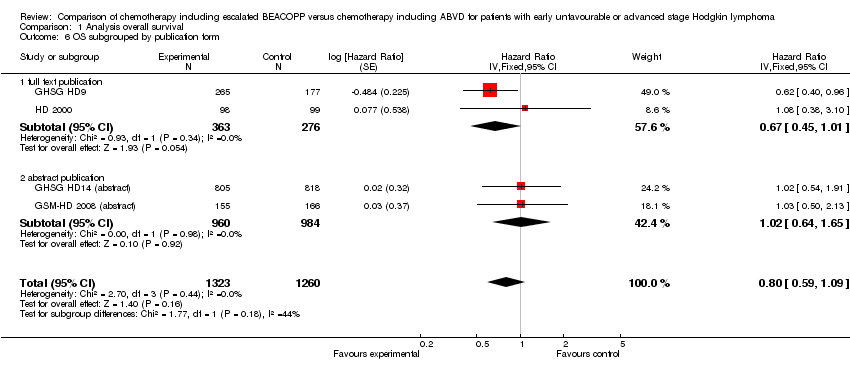
Comparison 1 Analysis overall survival, Outcome 6 OS subgrouped by publication form.

Comparison 1 Analysis overall survival, Outcome 7 OS subgrouped by type of results.

Comparison 1 Analysis overall survival, Outcome 8 OS ‐ all recruited patients (HD9) with potential risk of bias due to different time periods of recruitment.

Comparison 2 Analysis of progression‐free survival (PFS), Outcome 1 PFS ‐ all ‐ same recruitment period between the 2 arms (HD9).

Comparison 2 Analysis of progression‐free survival (PFS), Outcome 2 PFS subgrouped by stage of disease.

Comparison 2 Analysis of progression‐free survival (PFS), Outcome 3 PFS subgrouped by treatment.

Comparison 2 Analysis of progression‐free survival (PFS), Outcome 4 PFS subgrouped by number of cycles of escalated BEACOPP.
Comparison 2 Analysis of progression‐free survival (PFS), Outcome 5 PFS subgrouped by length of follow‐up.
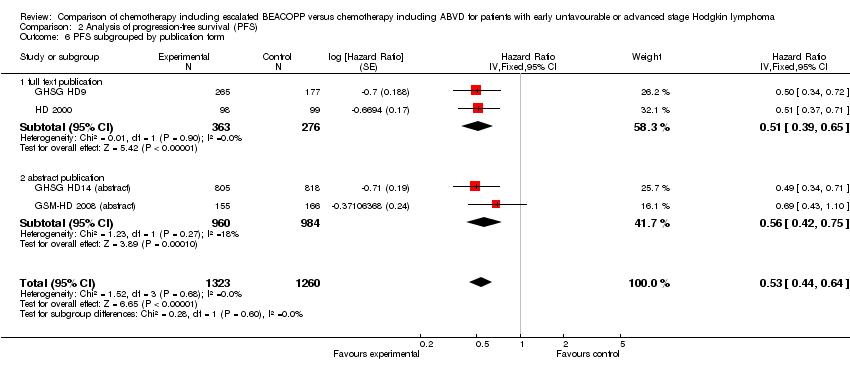
Comparison 2 Analysis of progression‐free survival (PFS), Outcome 6 PFS subgrouped by publication form.
Comparison 2 Analysis of progression‐free survival (PFS), Outcome 7 PFS subgrouped by type of results.
Comparison 2 Analysis of progression‐free survival (PFS), Outcome 8 PFS ‐ all recruited patients (HD9) with potential risk of bias due to different time periods of recruitment.

Comparison 3 Analysis of complete response (CR) rate, Outcome 1 CR.

Comparison 3 Analysis of complete response (CR) rate, Outcome 2 CR subgrouped by treatment.

Comparison 3 Analysis of complete response (CR) rate, Outcome 3 CR subgrouped by number of cycles of escalated BEACOPP.
Comparison 3 Analysis of complete response (CR) rate, Outcome 4 CR subgrouped by length of follow‐up.

Comparison 3 Analysis of complete response (CR) rate, Outcome 5 CR subgrouped by publication form.

Comparison 4 Analysis of freedom from first progression, Outcome 1 Freedom from first progression.
Comparison 5 Analysis of treatment‐related mortality, Outcome 1 Treatment‐related mortality.

Comparison 6 Analysis of secondary malignancies, Outcome 1 Secondary malignancies.

Comparison 6 Analysis of secondary malignancies, Outcome 2 Secondary malignancies subgrouped by stage of disease.
Comparison 6 Analysis of secondary malignancies, Outcome 3 Subgrouped by treatment.

Comparison 6 Analysis of secondary malignancies, Outcome 4 Subgrouped by number of cycles of escalated BEACOPP.

Comparison 6 Analysis of secondary malignancies, Outcome 5 Subgrouped by length of follow‐up.
Comparison 6 Analysis of secondary malignancies, Outcome 6 Subgrouped by publication form.

Comparison 6 Analysis of secondary malignancies, Outcome 7 Subgrouped by type of results.
Comparison 7 Analysis of AML or MDS, Outcome 1 AML or MDS.

Comparison 8 Analysis of fertility, Outcome 1 Secondary amenorrhoea.

Comparison 9 Analysis of anaemia, Outcome 1 Anaemia.
Comparison 9 Analysis of anaemia, Outcome 2 Subgrouped by stage of disease.
Comparison 9 Analysis of anaemia, Outcome 3 Subgrouped by treatment.

Comparison 9 Analysis of anaemia, Outcome 4 Subgrouped by number of cycles of escalated BEACOPP.
Comparison 9 Analysis of anaemia, Outcome 5 Subgrouped by length of follow‐up.

Comparison 9 Analysis of anaemia, Outcome 6 Subgrouped by publication form.

Comparison 9 Analysis of anaemia, Outcome 7 Subgrouped by type of results.

Comparison 10 Analysis of infection, Outcome 1 Infection.

Comparison 10 Analysis of infection, Outcome 2 Subgrouped by stage of disease.

Comparison 10 Analysis of infection, Outcome 3 Subgrouped by treatment.
Comparison 10 Analysis of infection, Outcome 4 Subgrouped by number of cycles of escalated BEACOPP.
Comparison 10 Analysis of infection, Outcome 5 Subgrouped by length of follow‐up.
Comparison 10 Analysis of infection, Outcome 6 Subgrouped by publication form.
Comparison 10 Analysis of infection, Outcome 7 Subgrouped by type of results.
Comparison 11 Analysis of leucopenia, Outcome 1 Leucopenia.
Comparison 11 Analysis of leucopenia, Outcome 2 Subgrouped by stage of disease.

Comparison 11 Analysis of leucopenia, Outcome 3 Subgrouped by treatment.

Comparison 11 Analysis of leucopenia, Outcome 4 Subgrouped by number of cycles of escalated BEACOPP.
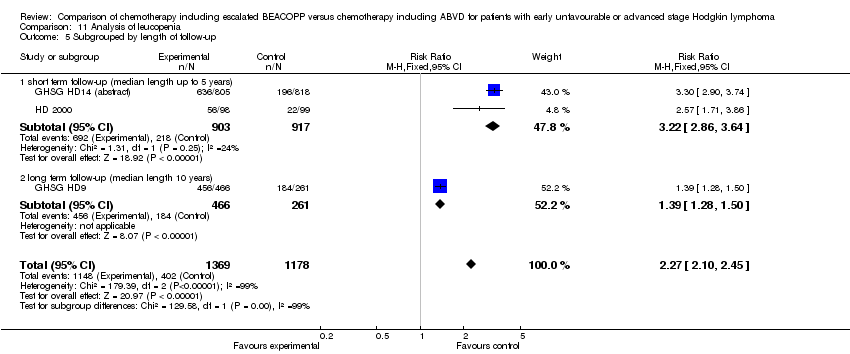
Comparison 11 Analysis of leucopenia, Outcome 5 Subgrouped by length of follow‐up.
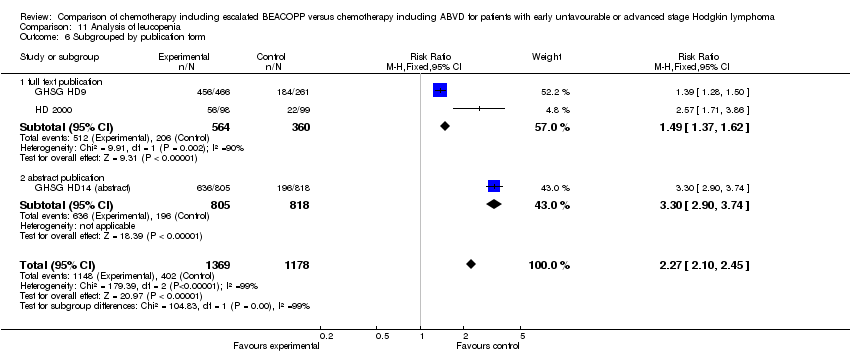
Comparison 11 Analysis of leucopenia, Outcome 6 Subgrouped by publication form.

Comparison 11 Analysis of leucopenia, Outcome 7 Subgrouped by type of results.

Comparison 12 Analysis of neutropenia, Outcome 1 Neutropenia.

Comparison 13 Analysis of thrombocytopenia, Outcome 1 Thrombocytopenia.
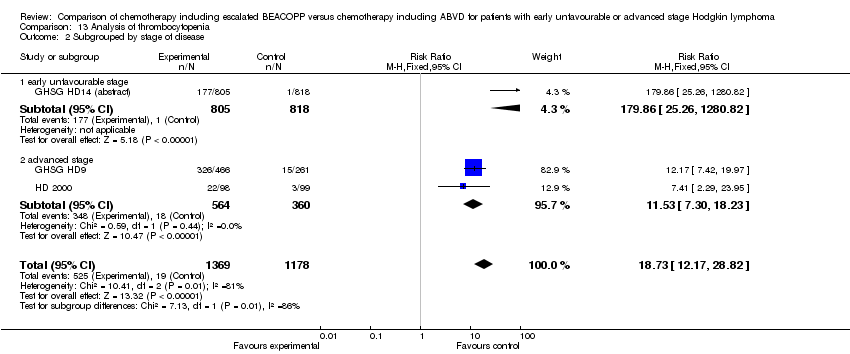
Comparison 13 Analysis of thrombocytopenia, Outcome 2 Subgrouped by stage of disease.

Comparison 13 Analysis of thrombocytopenia, Outcome 3 Subgrouped by treatment.

Comparison 13 Analysis of thrombocytopenia, Outcome 4 Subgrouped by number of cycles of escalated BEACOPP.

Comparison 13 Analysis of thrombocytopenia, Outcome 5 Subgrouped by length of follow‐up.

Comparison 13 Analysis of thrombocytopenia, Outcome 6 Subgrouped by publication form.

Comparison 13 Analysis of thrombocytopenia, Outcome 7 Subgrouped by type of results.
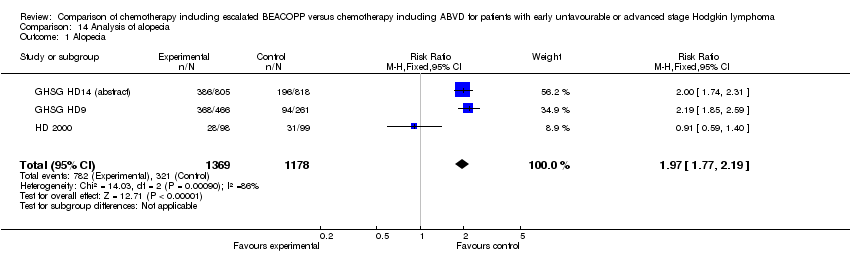
Comparison 14 Analysis of alopecia, Outcome 1 Alopecia.
Comparison 14 Analysis of alopecia, Outcome 2 Subgrouped by stage of disease.
Comparison 14 Analysis of alopecia, Outcome 3 Subgrouped by treatment.

Comparison 14 Analysis of alopecia, Outcome 4 Subgrouped by number of cycles of escalated BEACOPP.

Comparison 14 Analysis of alopecia, Outcome 5 Subgrouped by length of follow‐up.
Comparison 14 Analysis of alopecia, Outcome 6 Subgrouped by publication form.

Comparison 14 Analysis of alopecia, Outcome 7 Subgrouped by type of results.

Comparison 15 Analysis of constipation, Outcome 1 Constipation.
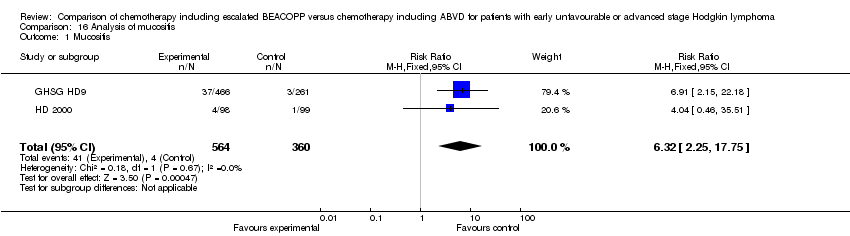
Comparison 16 Analysis of mucositis, Outcome 1 Mucositis.

Comparison 17 Analysis of nausea/vomiting, Outcome 1 Nausea/vomiting.

Comparison 18 Analysis of neurologic, Outcome 1 Neurologic.
Comparison 19 Analysis of pain, Outcome 1 Pain.
Comparison 20 Analysis of respiratory, Outcome 1 Respiratory.

Comparison 21 Analysis of skin, Outcome 1 Skin.
| Chemotherapy including escalated BEACOPP compared with chemotherapy including ABVD for patients with early unfavourable or advanced stage Hodgkin lymphoma | ||||||
| Patient or population: patients with early unfavourable or advanced stage Hodgkin lymphoma Intervention: chemotherapy including escalated BEACOPP Comparison: chemotherapy including ABVD | ||||||
| Outcomes | Illustrative comparative risks* (95% CI) | Relative effect | No of Participants | Quality of the evidence | Comments | |
| Assumed risk | Corresponding risk | |||||
| ABVD | escalated BEACOPP | |||||
| OS | Low risk population1 | HR 0.80 [0.59 to 1.09] | 2586 | +++O | ||
| 100 deaths per 1000 | 81 per 1000 | |||||
| High risk population2 | ||||||
| 250 deaths per 1000 | 206 per 1000 | |||||
| PFS | Low risk population3 | HR 0.53 [0.44 to 0.64] | 2586 | +++O | ||
| 100 progressions or relapses per 1000 | 54 per 1000 | |||||
| High risk population2 | ||||||
| 330 progressions or relapses per 1000 | 191 per 1000 | |||||
| CR rate | High risk population2 | RR 1.11 [1.06 to 1.16] | 1245 | ++++ | ||
| 831 complete responses per 1000 | 922 per 1000 | |||||
| Adverse events WHO grade III or IV | See comment | See comment | See comment | 2547 | +++O6 | Escalated BEACOPP regimens cause more haematological toxicities, infections, alopecia, mucositis and pain. No differences were found for constipation, nausea, neurologic toxicity. |
| Incidence of secondary malignancies | Low risk population2 | RR 0.95 (0.61 to 1.48) | 2547 | ++OO | As most of the trials had a median observation of less than 10 years, sufficient long term information on secondary malignancies cannot be expected. | |
| 2 per 1000 | 2 per 1000 (2 to 2) | |||||
| High risk population2 | ||||||
| 44 per 1000 | 42 per 1000 | |||||
| Incidence of infertility | 375 per 1000 | 514 per 1000 (311 to 847) | RR 1.37 [0.83 to 2.26] | 106 | +OOO | The subset of only 106 out of 608 eligible women of the HD9 were available for analyses regarding infertility. Reasons for availability are unknown and might have introduced bias in the results. |
| Treatment related mortality | See comment | See comment | RR 5.05 (0.25 to 103.87) | 197 | +OOO | No participant died in the control group and 2 died in the intervention group of the only study that reported this outcome. |
| *The basis for the assumed risk (e.g. the median control group risk across studies) is provided in footnotes. The corresponding risk (and its 95% confidence interval) is based on the assumed risk in the comparison group and the relative effect of the intervention (and its 95% CI). | ||||||
| GRADE Working Group grades of evidence | ||||||
| 1The risk for the "low risk population" (i.e. patients with early unfavourable HL) was taken from the GHSG HD8 trial, because the HD14 trial did not provide sufficient information regarding the control risk. 2The risk for the "high risk population" (i.e. patients with advanced stage of HL) was approximately the risk of the GHSG HD9 trial. 3The risk for the "low risk population" (i.e. patients with early unfavourable HL) was taken from the GHSG HD14 trial. 4 The median follow‐up varied between the trials. Longer follow‐ups and the inclusion of the EORTC 20012 trial will lead to a more precise estimate of the effect. This uncertainty causes the downgrading here. 5The definition of how to assess progression of disease varied between the trials. These heterogeneous definitions lead to an imprecise estimate of the effect that causes the downgrading here. 6So far two of the four trials reported results regarding adverse effects. The inclusion of further trials might lead to a more precise estimate of the effect. This uncertainty causes the downgrading here. 7 So far two of the four trials reported results regarding secondary malignancies. Furthermore, as most of the trials had a median observation of less than 10 years, sufficient long term information on secondary malignancies cannot be expected. The inclusion of further trials and results of longer follow‐up might lead to a more precise estimate of the effect. This uncertainty causes the downgrading here. 8 So far only 106 patients of the HD9 were analysed regarding infertility. The inclusion of further trials will lead to a more precise estimate of the effect.This uncertainty causes the downgrading here. 9 So far one of the four trials reported results regarding treatment‐related mortality. The inclusion of further trials will lead to a more precise estimate of the effect.This uncertainty causes the downgrading here. | ||||||
| Outcome or subgroup title | No. of studies | No. of participants | Statistical method | Effect size |
| 1 OS ‐ all ‐ same recruitment period between the 2 arms (HD9) Show forest plot | 4 | 2583 | Hazard Ratio (Fixed, 95% CI) | 0.80 [0.59, 1.09] |
| 2 OS subgrouped by stage of disease Show forest plot | 4 | 2583 | Hazard Ratio (Fixed, 95% CI) | 0.80 [0.59, 1.09] |
| 2.1 early unfavourable stage | 1 | 1623 | Hazard Ratio (Fixed, 95% CI) | 1.02 [0.54, 1.91] |
| 2.2 advanced stage | 3 | 960 | Hazard Ratio (Fixed, 95% CI) | 0.74 [0.52, 1.06] |
| 3 OS subgrouped by treatment Show forest plot | 4 | 2583 | Hazard Ratio (Fixed, 95% CI) | 0.80 [0.59, 1.09] |
| 3.1 only ABVD regimen | 3 | 2141 | Hazard Ratio (Fixed, 95% CI) | 1.03 [0.67, 1.59] |
| 3.2 ABVD including regimen | 1 | 442 | Hazard Ratio (Fixed, 95% CI) | 0.62 [0.40, 0.96] |
| 4 OS subgrouped by number of cycles of escalated BEACOPP Show forest plot | 4 | 2583 | Hazard Ratio (Fixed, 95% CI) | 0.80 [0.59, 1.09] |
| 4.1 eight cycles of escalated BEACOPP | 1 | 442 | Hazard Ratio (Fixed, 95% CI) | 0.62 [0.40, 0.96] |
| 4.2 four cycles of escalated BEACOPP | 2 | 518 | Hazard Ratio (Fixed, 95% CI) | 1.05 [0.58, 1.90] |
| 4.3 two cycles of escalated BEACOPP | 1 | 1623 | Hazard Ratio (Fixed, 95% CI) | 1.02 [0.54, 1.91] |
| 5 OS subgrouped by length of follow‐up Show forest plot | 4 | 2583 | Hazard Ratio (Fixed, 95% CI) | 0.80 [0.59, 1.09] |
| 5.1 short term follow‐up (median length up to 5 years) | 3 | 2141 | Hazard Ratio (Fixed, 95% CI) | 1.03 [0.67, 1.59] |
| 5.2 long term follow‐up (median length 10 years) | 1 | 442 | Hazard Ratio (Fixed, 95% CI) | 0.62 [0.40, 0.96] |
| 6 OS subgrouped by publication form Show forest plot | 4 | 2583 | Hazard Ratio (Fixed, 95% CI) | 0.80 [0.59, 1.09] |
| 6.1 full text publication | 2 | 639 | Hazard Ratio (Fixed, 95% CI) | 0.67 [0.45, 1.01] |
| 6.2 abstract publication | 2 | 1944 | Hazard Ratio (Fixed, 95% CI) | 1.02 [0.64, 1.65] |
| 7 OS subgrouped by type of results Show forest plot | 4 | 2583 | Hazard Ratio (Fixed, 95% CI) | 0.80 [0.59, 1.09] |
| 7.1 preliminary results | 2 | 1944 | Hazard Ratio (Fixed, 95% CI) | 1.02 [0.64, 1.65] |
| 7.2 mature results | 2 | 639 | Hazard Ratio (Fixed, 95% CI) | 0.67 [0.45, 1.01] |
| 8 OS ‐ all recruited patients (HD9) with potential risk of bias due to different time periods of recruitment Show forest plot | 4 | Hazard Ratio (Fixed, 95% CI) | 0.66 [0.50, 0.88] | |
| Outcome or subgroup title | No. of studies | No. of participants | Statistical method | Effect size |
| 1 PFS ‐ all ‐ same recruitment period between the 2 arms (HD9) Show forest plot | 4 | 2583 | Hazard Ratio (Fixed, 95% CI) | 0.53 [0.44, 0.64] |
| 2 PFS subgrouped by stage of disease Show forest plot | 4 | 2583 | Hazard Ratio (Fixed, 95% CI) | 0.53 [0.44, 0.64] |
| 2.1 early unfavourable stage | 1 | 1623 | Hazard Ratio (Fixed, 95% CI) | 0.49 [0.34, 0.71] |
| 2.2 advanced stage | 3 | 960 | Hazard Ratio (Fixed, 95% CI) | 0.54 [0.43, 0.67] |
| 3 PFS subgrouped by treatment Show forest plot | 4 | 2583 | Hazard Ratio (Fixed, 95% CI) | 0.53 [0.44, 0.64] |
| 3.1 only ABVD regimen | 3 | 2141 | Hazard Ratio (Fixed, 95% CI) | 0.54 [0.43, 0.67] |
| 3.2 ABVD including regimen | 1 | 442 | Hazard Ratio (Fixed, 95% CI) | 0.50 [0.34, 0.72] |
| 4 PFS subgrouped by number of cycles of escalated BEACOPP Show forest plot | 4 | 2583 | Hazard Ratio (Fixed, 95% CI) | 0.53 [0.44, 0.64] |
| 4.1 eight cycles of escalated BEACOPP | 1 | 442 | Hazard Ratio (Fixed, 95% CI) | 0.50 [0.34, 0.72] |
| 4.2 four cycles of escalated BEACOPP | 2 | 518 | Hazard Ratio (Fixed, 95% CI) | 0.57 [0.43, 0.74] |
| 4.3 two cycles of escalated BEACOPP | 1 | 1623 | Hazard Ratio (Fixed, 95% CI) | 0.49 [0.34, 0.71] |
| 5 PFS subgrouped by length of follow‐up Show forest plot | 4 | 2583 | Hazard Ratio (Fixed, 95% CI) | 0.53 [0.44, 0.64] |
| 5.1 short term follow‐up (median length up to 5 years) | 3 | 2141 | Hazard Ratio (Fixed, 95% CI) | 0.54 [0.43, 0.67] |
| 5.2 long term follow‐up (median length 10 years) | 1 | 442 | Hazard Ratio (Fixed, 95% CI) | 0.50 [0.34, 0.72] |
| 6 PFS subgrouped by publication form Show forest plot | 4 | 2583 | Hazard Ratio (Fixed, 95% CI) | 0.53 [0.44, 0.64] |
| 6.1 full text publication | 2 | 639 | Hazard Ratio (Fixed, 95% CI) | 0.51 [0.39, 0.65] |
| 6.2 abstract publication | 2 | 1944 | Hazard Ratio (Fixed, 95% CI) | 0.56 [0.42, 0.75] |
| 7 PFS subgrouped by type of results Show forest plot | 4 | 2583 | Hazard Ratio (Fixed, 95% CI) | 0.53 [0.44, 0.64] |
| 7.1 preliminary results | 2 | 1944 | Hazard Ratio (Fixed, 95% CI) | 0.56 [0.42, 0.75] |
| 7.2 mature results | 2 | 639 | Hazard Ratio (Fixed, 95% CI) | 0.51 [0.39, 0.65] |
| 8 PFS ‐ all recruited patients (HD9) with potential risk of bias due to different time periods of recruitment Show forest plot | 4 | Hazard Ratio (Fixed, 95% CI) | 0.48 [0.40, 0.58] | |
| Outcome or subgroup title | No. of studies | No. of participants | Statistical method | Effect size |
| 1 CR Show forest plot | 3 | 1245 | Risk Ratio (M‐H, Fixed, 95% CI) | 1.11 [1.06, 1.16] |
| 2 CR subgrouped by treatment Show forest plot | 3 | 1245 | Risk Ratio (M‐H, Fixed, 95% CI) | 1.11 [1.06, 1.16] |
| 2.1 only ABVD regimen | 2 | 518 | Risk Ratio (M‐H, Fixed, 95% CI) | 1.08 [1.00, 1.16] |
| 2.2 ABVD including regimen | 1 | 727 | Risk Ratio (M‐H, Fixed, 95% CI) | 1.13 [1.07, 1.19] |
| 3 CR subgrouped by number of cycles of escalated BEACOPP Show forest plot | 3 | 1245 | Risk Ratio (M‐H, Fixed, 95% CI) | 1.11 [1.06, 1.16] |
| 3.1 eight cycles of escalated BEACOPP | 1 | 727 | Risk Ratio (M‐H, Fixed, 95% CI) | 1.13 [1.07, 1.19] |
| 3.2 four cycles of escalated BEACOPP | 2 | 518 | Risk Ratio (M‐H, Fixed, 95% CI) | 1.08 [1.00, 1.16] |
| 4 CR subgrouped by length of follow‐up Show forest plot | 3 | 1245 | Risk Ratio (M‐H, Fixed, 95% CI) | 1.11 [1.06, 1.16] |
| 4.1 short term follow‐up (median length up to 5 years) | 2 | 518 | Risk Ratio (M‐H, Fixed, 95% CI) | 1.08 [1.00, 1.16] |
| 4.2 long term follow‐up (median length 10 years) | 1 | 727 | Risk Ratio (M‐H, Fixed, 95% CI) | 1.13 [1.07, 1.19] |
| 5 CR subgrouped by publication form Show forest plot | 3 | 1245 | Risk Ratio (M‐H, Fixed, 95% CI) | 1.11 [1.06, 1.16] |
| 5.1 full text publication | 2 | 924 | Risk Ratio (M‐H, Fixed, 95% CI) | 1.12 [1.07, 1.18] |
| 5.2 abstract publication | 1 | 321 | Risk Ratio (M‐H, Fixed, 95% CI) | 1.07 [0.97, 1.19] |
| Outcome or subgroup title | No. of studies | No. of participants | Statistical method | Effect size |
| 1 Freedom from first progression Show forest plot | 1 | 321 | Hazard Ratio (Fixed, 95% CI) | 0.51 [0.31, 0.85] |
| Outcome or subgroup title | No. of studies | No. of participants | Statistical method | Effect size |
| 1 Treatment‐related mortality Show forest plot | 1 | 197 | Risk Ratio (M‐H, Fixed, 95% CI) | 5.05 [0.25, 103.87] |
| Outcome or subgroup title | No. of studies | No. of participants | Statistical method | Effect size |
| 1 Secondary malignancies Show forest plot | 3 | 2547 | Risk Ratio (M‐H, Fixed, 95% CI) | 0.95 [0.61, 1.48] |
| 2 Secondary malignancies subgrouped by stage of disease Show forest plot | 3 | 2547 | Risk Ratio (M‐H, Fixed, 95% CI) | 0.95 [0.61, 1.48] |
| 2.1 early unfavourable stage | 1 | 1623 | Risk Ratio (M‐H, Fixed, 95% CI) | 0.86 [0.44, 1.65] |
| 2.2 advanced stage | 2 | 924 | Risk Ratio (M‐H, Fixed, 95% CI) | 1.04 [0.58, 1.89] |
| 3 Subgrouped by treatment Show forest plot | 3 | 2547 | Risk Ratio (M‐H, Fixed, 95% CI) | 0.95 [0.61, 1.48] |
| 3.1 only ABVD regimen | 2 | 1820 | Risk Ratio (M‐H, Fixed, 95% CI) | 0.86 [0.46, 1.64] |
| 3.2 ABVD including regimen | 1 | 727 | Risk Ratio (M‐H, Fixed, 95% CI) | 1.05 [0.57, 1.92] |
| 4 Subgrouped by number of cycles of escalated BEACOPP Show forest plot | 3 | 2547 | Risk Ratio (M‐H, Fixed, 95% CI) | 0.95 [0.61, 1.48] |
| 4.1 eight cycles of escalated BEACOPP | 1 | 727 | Risk Ratio (M‐H, Fixed, 95% CI) | 1.05 [0.57, 1.92] |
| 4.2 four cycles of escalated BEACOPP | 1 | 197 | Risk Ratio (M‐H, Fixed, 95% CI) | 1.01 [0.06, 15.92] |
| 4.3 two cycles of escalated BEACOPP | 1 | 1623 | Risk Ratio (M‐H, Fixed, 95% CI) | 0.86 [0.44, 1.65] |
| 5 Subgrouped by length of follow‐up Show forest plot | 3 | 2547 | Risk Ratio (M‐H, Fixed, 95% CI) | 0.95 [0.61, 1.48] |
| 5.1 short term follow‐up (median length up to 5 years) | 2 | 1820 | Risk Ratio (M‐H, Fixed, 95% CI) | 0.86 [0.46, 1.64] |
| 5.2 long term follow‐up (median length 10 years) | 1 | 727 | Risk Ratio (M‐H, Fixed, 95% CI) | 1.05 [0.57, 1.92] |
| 6 Subgrouped by publication form Show forest plot | 3 | 2547 | Risk Ratio (M‐H, Fixed, 95% CI) | 0.95 [0.61, 1.48] |
| 6.1 full text publication | 2 | 924 | Risk Ratio (M‐H, Fixed, 95% CI) | 1.04 [0.58, 1.89] |
| 6.2 abstract publication | 1 | 1623 | Risk Ratio (M‐H, Fixed, 95% CI) | 0.86 [0.44, 1.65] |
| 7 Subgrouped by type of results Show forest plot | 3 | 2547 | Risk Ratio (M‐H, Fixed, 95% CI) | 0.95 [0.61, 1.48] |
| 7.1 preliminary results | 1 | 1623 | Risk Ratio (M‐H, Fixed, 95% CI) | 0.86 [0.44, 1.65] |
| 7.2 mature results | 2 | 924 | Risk Ratio (M‐H, Fixed, 95% CI) | 1.04 [0.58, 1.89] |
| Outcome or subgroup title | No. of studies | No. of participants | Statistical method | Effect size |
| 1 AML or MDS Show forest plot | 2 | 924 | Risk Ratio (M‐H, Fixed, 95% CI) | 7.84 [1.04, 59.29] |
| Outcome or subgroup title | No. of studies | No. of participants | Statistical method | Effect size |
| 1 Secondary amenorrhoea Show forest plot | 1 | 106 | Risk Ratio (M‐H, Fixed, 95% CI) | 1.37 [0.83, 2.26] |
| Outcome or subgroup title | No. of studies | No. of participants | Statistical method | Effect size |
| 1 Anaemia Show forest plot | 3 | 2547 | Risk Ratio (M‐H, Fixed, 95% CI) | 10.47 [7.06, 15.54] |
| 2 Subgrouped by stage of disease Show forest plot | 3 | 2547 | Risk Ratio (M‐H, Fixed, 95% CI) | 10.47 [7.06, 15.54] |
| 2.1 early unfavourable stage | 1 | 1623 | Risk Ratio (M‐H, Fixed, 95% CI) | 9.15 [4.43, 18.86] |
| 2.2 advanced stage | 2 | 924 | Risk Ratio (M‐H, Fixed, 95% CI) | 10.96 [6.86, 17.51] |
| 3 Subgrouped by treatment Show forest plot | 3 | 2547 | Risk Ratio (M‐H, Fixed, 95% CI) | 10.47 [7.06, 15.54] |
| 3.1 only ABVD regimen | 2 | 1820 | Risk Ratio (M‐H, Fixed, 95% CI) | 6.87 [3.87, 12.18] |
| 3.2 ABVD including regimen | 1 | 727 | Risk Ratio (M‐H, Fixed, 95% CI) | 13.27 [7.78, 22.63] |
| 4 Subgrouped by number of cycles of escalated BEACOPP Show forest plot | 3 | 2547 | Risk Ratio (M‐H, Fixed, 95% CI) | 10.47 [7.06, 15.54] |
| 4.1 eight cycles of escalated BEACOPP | 1 | 727 | Risk Ratio (M‐H, Fixed, 95% CI) | 13.27 [7.78, 22.63] |
| 4.2 four cycles of escalated BEACOPP | 1 | 197 | Risk Ratio (M‐H, Fixed, 95% CI) | 3.23 [1.23, 8.48] |
| 4.3 two cycles of escalated BEACOPP | 1 | 1623 | Risk Ratio (M‐H, Fixed, 95% CI) | 9.15 [4.43, 18.86] |
| 5 Subgrouped by length of follow‐up Show forest plot | 3 | 2547 | Risk Ratio (M‐H, Fixed, 95% CI) | 10.47 [7.06, 15.54] |
| 5.1 short term follow‐up (median length up to 5 years) | 2 | 1820 | Risk Ratio (M‐H, Fixed, 95% CI) | 6.87 [3.87, 12.18] |
| 5.2 long term follow‐up (median length 10 years) | 1 | 727 | Risk Ratio (M‐H, Fixed, 95% CI) | 13.27 [7.78, 22.63] |
| 6 Subgrouped by publication form Show forest plot | 3 | 2547 | Risk Ratio (M‐H, Fixed, 95% CI) | 10.47 [7.06, 15.54] |
| 6.1 full text publication | 2 | 924 | Risk Ratio (M‐H, Fixed, 95% CI) | 10.96 [6.86, 17.51] |
| 6.2 abstract publication | 1 | 1623 | Risk Ratio (M‐H, Fixed, 95% CI) | 9.15 [4.43, 18.86] |
| 7 Subgrouped by type of results Show forest plot | 3 | 2547 | Risk Ratio (M‐H, Fixed, 95% CI) | 10.47 [7.06, 15.54] |
| 7.1 preliminary results | 1 | 1623 | Risk Ratio (M‐H, Fixed, 95% CI) | 9.15 [4.43, 18.86] |
| 7.2 mature results | 2 | 924 | Risk Ratio (M‐H, Fixed, 95% CI) | 10.96 [6.86, 17.51] |
| Outcome or subgroup title | No. of studies | No. of participants | Statistical method | Effect size |
| 1 Infection Show forest plot | 3 | 2547 | Risk Ratio (M‐H, Fixed, 95% CI) | 3.67 [2.57, 5.24] |
| 2 Subgrouped by stage of disease Show forest plot | 3 | 2547 | Risk Ratio (M‐H, Fixed, 95% CI) | 3.67 [2.57, 5.24] |
| 2.1 early unfavourable stage | 1 | 1623 | Risk Ratio (M‐H, Fixed, 95% CI) | 2.14 [1.38, 3.32] |
| 2.2 advanced stage | 2 | 924 | Risk Ratio (M‐H, Fixed, 95% CI) | 7.13 [3.78, 13.45] |
| 3 Subgrouped by treatment Show forest plot | 3 | 2547 | Risk Ratio (M‐H, Fixed, 95% CI) | 3.67 [2.57, 5.24] |
| 3.1 only ABVD regimen | 2 | 1820 | Risk Ratio (M‐H, Fixed, 95% CI) | 2.47 [1.63, 3.74] |
| 3.2 ABVD including regimen | 1 | 727 | Risk Ratio (M‐H, Fixed, 95% CI) | 7.14 [3.53, 14.43] |
| 4 Subgrouped by number of cycles of escalated BEACOPP Show forest plot | 3 | 2547 | Risk Ratio (M‐H, Fixed, 95% CI) | 3.67 [2.57, 5.24] |
| 4.1 eight cycles of escalated BEACOPP | 1 | 727 | Risk Ratio (M‐H, Fixed, 95% CI) | 7.14 [3.53, 14.43] |
| 4.2 four cycles of escalated BEACOPP | 1 | 197 | Risk Ratio (M‐H, Fixed, 95% CI) | 7.07 [1.65, 30.30] |
| 4.3 two cycles of escalated BEACOPP | 1 | 1623 | Risk Ratio (M‐H, Fixed, 95% CI) | 2.14 [1.38, 3.32] |
| 5 Subgrouped by length of follow‐up Show forest plot | 3 | 2547 | Risk Ratio (M‐H, Fixed, 95% CI) | 3.67 [2.57, 5.24] |
| 5.1 short term follow‐up (median length up to 5 years) | 2 | 1820 | Risk Ratio (M‐H, Fixed, 95% CI) | 2.47 [1.63, 3.74] |
| 5.2 long term follow‐up (median length 10 years) | 1 | 727 | Risk Ratio (M‐H, Fixed, 95% CI) | 7.14 [3.53, 14.43] |
| 6 Subgrouped by publication form Show forest plot | 3 | 2547 | Risk Ratio (M‐H, Fixed, 95% CI) | 3.67 [2.57, 5.24] |
| 6.1 full text publication | 2 | 924 | Risk Ratio (M‐H, Fixed, 95% CI) | 7.13 [3.78, 13.45] |
| 6.2 abstract publication | 1 | 1623 | Risk Ratio (M‐H, Fixed, 95% CI) | 2.14 [1.38, 3.32] |
| 7 Subgrouped by type of results Show forest plot | 3 | 2547 | Risk Ratio (M‐H, Fixed, 95% CI) | 3.67 [2.57, 5.24] |
| 7.1 preliminary results | 1 | 1623 | Risk Ratio (M‐H, Fixed, 95% CI) | 2.14 [1.38, 3.32] |
| 7.2 mature results | 2 | 924 | Risk Ratio (M‐H, Fixed, 95% CI) | 7.13 [3.78, 13.45] |
| Outcome or subgroup title | No. of studies | No. of participants | Statistical method | Effect size |
| 1 Leucopenia Show forest plot | 3 | 2547 | Risk Ratio (M‐H, Fixed, 95% CI) | 2.26 [2.09, 2.44] |
| 2 Subgrouped by stage of disease Show forest plot | 3 | 2547 | Risk Ratio (M‐H, Fixed, 95% CI) | 2.27 [2.10, 2.45] |
| 2.1 early unfavourable stage | 1 | 1623 | Risk Ratio (M‐H, Fixed, 95% CI) | 3.30 [2.90, 3.74] |
| 2.2 advanced stage | 2 | 924 | Risk Ratio (M‐H, Fixed, 95% CI) | 1.49 [1.37, 1.62] |
| 3 Subgrouped by treatment Show forest plot | 3 | 2547 | Risk Ratio (M‐H, Fixed, 95% CI) | 2.27 [2.10, 2.45] |
| 3.1 only ABVD regimen | 2 | 1820 | Risk Ratio (M‐H, Fixed, 95% CI) | 3.22 [2.86, 3.64] |
| 3.2 ABVD including regimen | 1 | 727 | Risk Ratio (M‐H, Fixed, 95% CI) | 1.39 [1.28, 1.50] |
| 4 Subgrouped by number of cycles of escalated BEACOPP Show forest plot | 3 | 2547 | Risk Ratio (M‐H, Fixed, 95% CI) | 2.27 [2.10, 2.45] |
| 4.1 eight cycles of escalated BEACOPP | 1 | 727 | Risk Ratio (M‐H, Fixed, 95% CI) | 1.39 [1.28, 1.50] |
| 4.2 two cycles of escalated BEACOPP | 1 | 197 | Risk Ratio (M‐H, Fixed, 95% CI) | 2.57 [1.71, 3.86] |
| 4.3 two cycles of escalated BEACOPP | 1 | 1623 | Risk Ratio (M‐H, Fixed, 95% CI) | 3.30 [2.90, 3.74] |
| 5 Subgrouped by length of follow‐up Show forest plot | 3 | 2547 | Risk Ratio (M‐H, Fixed, 95% CI) | 2.27 [2.10, 2.45] |
| 5.1 short term follow‐up (median length up to 5 years) | 2 | 1820 | Risk Ratio (M‐H, Fixed, 95% CI) | 3.22 [2.86, 3.64] |
| 5.2 long term follow‐up (median length 10 years) | 1 | 727 | Risk Ratio (M‐H, Fixed, 95% CI) | 1.39 [1.28, 1.50] |
| 6 Subgrouped by publication form Show forest plot | 3 | 2547 | Risk Ratio (M‐H, Fixed, 95% CI) | 2.27 [2.10, 2.45] |
| 6.1 full text publication | 2 | 924 | Risk Ratio (M‐H, Fixed, 95% CI) | 1.49 [1.37, 1.62] |
| 6.2 abstract publication | 1 | 1623 | Risk Ratio (M‐H, Fixed, 95% CI) | 3.30 [2.90, 3.74] |
| 7 Subgrouped by type of results Show forest plot | 3 | 2547 | Risk Ratio (M‐H, Fixed, 95% CI) | 2.27 [2.10, 2.45] |
| 7.1 preliminary results | 1 | 1623 | Risk Ratio (M‐H, Fixed, 95% CI) | 3.30 [2.90, 3.74] |
| 7.2 mature results | 2 | 924 | Risk Ratio (M‐H, Fixed, 95% CI) | 1.49 [1.37, 1.62] |
| Outcome or subgroup title | No. of studies | No. of participants | Statistical method | Effect size |
| 1 Neutropenia Show forest plot | 1 | 197 | Risk Ratio (M‐H, Fixed, 95% CI) | 1.57 [1.13, 2.19] |
| Outcome or subgroup title | No. of studies | No. of participants | Statistical method | Effect size |
| 1 Thrombocytopenia Show forest plot | 3 | 2547 | Risk Ratio (M‐H, Fixed, 95% CI) | 18.73 [12.17, 28.82] |
| 2 Subgrouped by stage of disease Show forest plot | 3 | 2547 | Risk Ratio (M‐H, Fixed, 95% CI) | 18.73 [12.17, 28.82] |
| 2.1 early unfavourable stage | 1 | 1623 | Risk Ratio (M‐H, Fixed, 95% CI) | 179.86 [25.26, 1280.82] |
| 2.2 advanced stage | 2 | 924 | Risk Ratio (M‐H, Fixed, 95% CI) | 11.53 [7.30, 18.23] |
| 3 Subgrouped by treatment Show forest plot | 3 | 2547 | Risk Ratio (M‐H, Fixed, 95% CI) | 18.73 [12.17, 28.82] |
| 3.1 only ABVD regimen | 2 | 1820 | Risk Ratio (M‐H, Fixed, 95% CI) | 50.43 [18.84, 134.96] |
| 3.2 ABVD including regimen | 1 | 727 | Risk Ratio (M‐H, Fixed, 95% CI) | 12.17 [7.42, 19.97] |
| 4 Subgrouped by number of cycles of escalated BEACOPP Show forest plot | 3 | 2547 | Risk Ratio (M‐H, Fixed, 95% CI) | 18.73 [12.17, 28.82] |
| 4.1 eight cycles of escalated BEACOPP | 1 | 727 | Risk Ratio (M‐H, Fixed, 95% CI) | 12.17 [7.42, 19.97] |
| 4.2 four cycles of escalated BEACOPP | 1 | 197 | Risk Ratio (M‐H, Fixed, 95% CI) | 7.41 [2.29, 23.95] |
| 4.3 two cycles of escalated BEACOPP | 1 | 1623 | Risk Ratio (M‐H, Fixed, 95% CI) | 179.86 [25.26, 1280.82] |
| 5 Subgrouped by length of follow‐up Show forest plot | 3 | 2547 | Risk Ratio (M‐H, Fixed, 95% CI) | 18.73 [12.17, 28.82] |
| 5.1 short term follow‐up (median length up to 5 years) | 2 | 1820 | Risk Ratio (M‐H, Fixed, 95% CI) | 50.43 [18.84, 134.96] |
| 5.2 long term follow‐up (median length 10 years) | 1 | 727 | Risk Ratio (M‐H, Fixed, 95% CI) | 12.17 [7.42, 19.97] |
| 6 Subgrouped by publication form Show forest plot | 3 | 2547 | Risk Ratio (M‐H, Fixed, 95% CI) | 18.73 [12.17, 28.82] |
| 6.1 full text publication | 2 | 924 | Risk Ratio (M‐H, Fixed, 95% CI) | 11.53 [7.30, 18.23] |
| 6.2 abstract publication | 1 | 1623 | Risk Ratio (M‐H, Fixed, 95% CI) | 179.86 [25.26, 1280.82] |
| 7 Subgrouped by type of results Show forest plot | 3 | 2547 | Risk Ratio (M‐H, Fixed, 95% CI) | 18.73 [12.17, 28.82] |
| 7.1 preliminary results | 1 | 1623 | Risk Ratio (M‐H, Fixed, 95% CI) | 179.86 [25.26, 1280.82] |
| 7.2 mature results | 2 | 924 | Risk Ratio (M‐H, Fixed, 95% CI) | 11.53 [7.30, 18.23] |
| Outcome or subgroup title | No. of studies | No. of participants | Statistical method | Effect size |
| 1 Alopecia Show forest plot | 3 | 2547 | Risk Ratio (M‐H, Fixed, 95% CI) | 1.97 [1.77, 2.19] |
| 2 Subgrouped by stage of disease Show forest plot | 3 | 2547 | Risk Ratio (M‐H, Fixed, 95% CI) | 1.97 [1.77, 2.19] |
| 2.1 early unfavourable stage | 1 | 1623 | Risk Ratio (M‐H, Fixed, 95% CI) | 2.00 [1.74, 2.31] |
| 2.2 advanced stage | 2 | 924 | Risk Ratio (M‐H, Fixed, 95% CI) | 1.93 [1.65, 2.26] |
| 3 Subgrouped by treatment Show forest plot | 3 | 2547 | Risk Ratio (M‐H, Fixed, 95% CI) | 1.97 [1.77, 2.19] |
| 3.1 only ABVD regimen | 2 | 1820 | Risk Ratio (M‐H, Fixed, 95% CI) | 1.85 [1.62, 2.12] |
| 3.2 ABVD including regimen | 1 | 727 | Risk Ratio (M‐H, Fixed, 95% CI) | 2.19 [1.85, 2.59] |
| 4 Subgrouped by number of cycles of escalated BEACOPP Show forest plot | 3 | 2547 | Risk Ratio (M‐H, Fixed, 95% CI) | 1.97 [1.77, 2.19] |
| 4.1 eight cycles of escalated BEACOPP | 1 | 727 | Risk Ratio (M‐H, Fixed, 95% CI) | 2.19 [1.85, 2.59] |
| 4.2 four cycles of escalated BEACOPP | 1 | 197 | Risk Ratio (M‐H, Fixed, 95% CI) | 0.91 [0.59, 1.40] |
| 4.3 two cycles of escalated BEACOPP | 1 | 1623 | Risk Ratio (M‐H, Fixed, 95% CI) | 2.00 [1.74, 2.31] |
| 5 Subgrouped by length of follow‐up Show forest plot | 3 | 2547 | Risk Ratio (M‐H, Fixed, 95% CI) | 1.97 [1.77, 2.19] |
| 5.1 short term follow‐up (median length up to 5 years) | 2 | 1820 | Risk Ratio (M‐H, Fixed, 95% CI) | 1.85 [1.62, 2.12] |
| 5.2 long term follow‐up (median length 10 years) | 1 | 727 | Risk Ratio (M‐H, Fixed, 95% CI) | 2.19 [1.85, 2.59] |
| 6 Subgrouped by publication form Show forest plot | 3 | 2547 | Risk Ratio (M‐H, Fixed, 95% CI) | 1.97 [1.77, 2.19] |
| 6.1 full text publication | 2 | 924 | Risk Ratio (M‐H, Fixed, 95% CI) | 1.93 [1.65, 2.26] |
| 6.2 abstract publication | 1 | 1623 | Risk Ratio (M‐H, Fixed, 95% CI) | 2.00 [1.74, 2.31] |
| 7 Subgrouped by type of results Show forest plot | 3 | 2547 | Risk Ratio (M‐H, Fixed, 95% CI) | 1.97 [1.77, 2.19] |
| 7.1 preliminary results | 1 | 1623 | Risk Ratio (M‐H, Fixed, 95% CI) | 2.00 [1.74, 2.31] |
| 7.2 mature results | 2 | 924 | Risk Ratio (M‐H, Fixed, 95% CI) | 1.93 [1.65, 2.26] |
| Outcome or subgroup title | No. of studies | No. of participants | Statistical method | Effect size |
| 1 Constipation Show forest plot | 2 | 923 | Risk Ratio (M‐H, Fixed, 95% CI) | 1.19 [0.56, 2.55] |
| Outcome or subgroup title | No. of studies | No. of participants | Statistical method | Effect size |
| 1 Mucositis Show forest plot | 2 | 924 | Risk Ratio (M‐H, Fixed, 95% CI) | 6.32 [2.25, 17.75] |
| Outcome or subgroup title | No. of studies | No. of participants | Statistical method | Effect size |
| 1 Nausea/vomiting Show forest plot | 2 | 924 | Risk Ratio (M‐H, Fixed, 95% CI) | 0.94 [0.71, 1.25] |
| Outcome or subgroup title | No. of studies | No. of participants | Statistical method | Effect size |
| 1 Neurologic Show forest plot | 2 | 924 | Risk Ratio (M‐H, Fixed, 95% CI) | 1.14 [0.55, 2.35] |
| Outcome or subgroup title | No. of studies | No. of participants | Statistical method | Effect size |
| 1 Pain Show forest plot | 2 | 924 | Risk Ratio (M‐H, Fixed, 95% CI) | 4.88 [2.04, 11.66] |
| Outcome or subgroup title | No. of studies | No. of participants | Statistical method | Effect size |
| 1 Respiratory Show forest plot | 1 | 726 | Risk Ratio (M‐H, Fixed, 95% CI) | 2.12 [0.80, 5.61] |
| Outcome or subgroup title | No. of studies | No. of participants | Statistical method | Effect size |
| 1 Skin Show forest plot | 1 | 726 | Risk Ratio (M‐H, Fixed, 95% CI) | 2.60 [0.76, 8.98] |