Comparison of first‐line chemotherapy including escalated BEACOPP versus chemotherapy including ABVD for people with early unfavourable or advanced stage Hodgkin lymphoma
Abstract
Background
There are two different international standards for the treatment of early unfavourable and advanced stage Hodgkin lymphoma (HL): chemotherapy with escalated BEACOPP (bleomycin/etoposide/doxorubicin/cyclophosphamide/vincristine/procarbazine/prednisone) regimen and chemotherapy with ABVD (doxorubicin/bleomycin/vinblastine/dacarbazine) regimen.
Objectives
To determine the advantages and disadvantages of chemotherapy including escalated BEACOPP compared to chemotherapy including ABVD in the treatment of early unfavourable or advanced stage HL as first‐line treatment.
Search methods
We searched for randomised controlled trials in MEDLINE, CENTRAL and conference proceedings (January 1985 to July 2013 and for the update to March 2017) and Embase (1985 to November 2008). Moreover we searched trial registries (March 2017; www.controlled‐trials.com, www.clinicaltrialsregister.eu/ctr‐search/search, clinicaltrials.gov, www.eortc.be, www.ghsg.org, www.ctc.usyd.edu.au, www.trialscentral.org/index.html)
Selection criteria
We included randomised controlled trials examining chemotherapy including at least two cycles of escalated BEACOPP regimens compared with chemotherapy including at least four cycles of ABVD regimens as first‐line treatment for patients with early unfavourable stage or advanced stage HL.
Data collection and analysis
The effect measures we used were hazard ratios (HRs) for overall survival (OS), progression‐free survival (PFS) and freedom from first progression.
We used risk ratios (RRs) relative risks to analyse harms: treatment‐related mortality, secondary malignancies (including myeloid dysplastic syndrome (MDS) or acute myeloid leukaemia (AML)), infertility and adverse events.
Quality of life was not reported in any trial, therefore not analysed. Two review authors independently extracted data and assessed quality of trials.
Main results
We screened 1796 records and identified five eligible trials in total i.e. one trial could be added on the previous review. These trials included only adults (16 to 65 years of age). We included all five trials with 3427 people in the meta‐analyses: the HD9 and HD14 trials were co‐ordinated in Germany, the HD2000 and GSM‐HD trials were performed in Italy and the EORTC 20012 was conducted in Belgium. The overall risk of performance and detection bias was low for overall survival (OS), but was high for other outcomes, as therapy blinding was not feasible. The remaining 'Risk of bias' domains were low and unclear.
All trials reported results for OS and progression‐free survival (PFS). In contrast to the our first published review (2011) the addition of results from the EORTC 20012 BEACOPP escalated increases OS (3142 participants; HR 0.74 (95% confidence interval (CI) 0.57 to 0.97; high‐quality evidence). This means that only 90 (70 to 117) patients will die after five years in the BEACOPP escalated arm compared to 120 in the ABVD arm. This survival advantage is also reflected in an increased PFS with BEACOPP escalated (3142 participants; HR 0.54 (95% CI 0.45 to 0.64); moderate‐quality evidence), meaning that after five years only 144 (121 to 168) patients will experience a progress, relapse or death in the BEACOPP escalated arm compared to 250 in the ABVD arm.
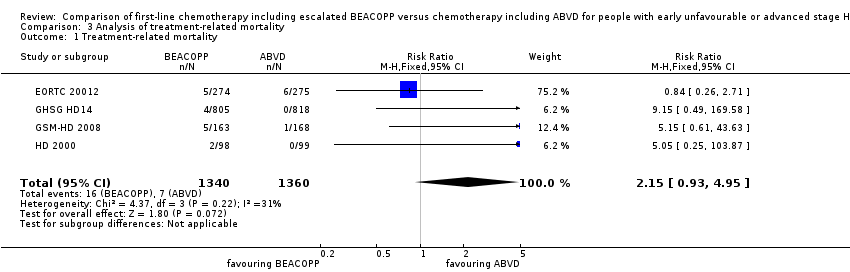
There is no evidence for a difference for treatment‐related mortality (2700 participants, RR 2.15 (95% CI = 0.93 to 4.95), low‐quality evidence).
Although the occurrence of MDS or AML may increase with BEACOPP escalated (3332 participants, RR 3.90 (95% CI 1.36 to 11.21); low‐quality evidence)), there is no evidence for a difference between both regimens for overall secondary malignancies (3332 participants, RR 1.00 (95% CI 0.68 to 1.48), low‐quality evidence). However, the observation time of the studies included in the review is too short to be expected to demonstrate differences with respect to second solid tumours which would not be expected to show significance until around 15 years after treatment.
We are very uncertain how many female patients will be infertile due to chemotherapy and which arm might be favoured (106 participants, RR 1.37 (95% CI 0.83 to 2.26), very low‐quality evidence). This is a very small sample, and the age of the patients was not detailed. No analysis of male fertility was provided.
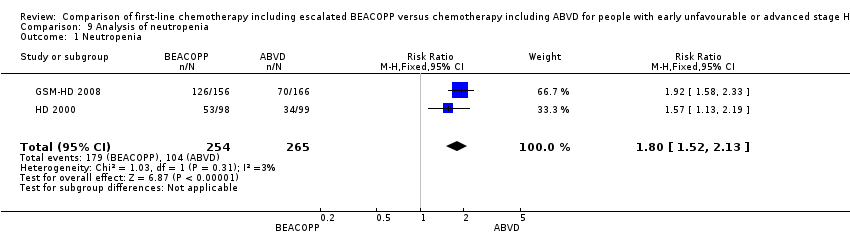
Five trials reported adverse events and the analysis shows that the escalated BEACOPP regimens probably causes more haematological toxicities WHO grade III or IV ((anaemia: 2425 participants, RR 10.67 (95% CI 7.14 to 15.93); neutropenia: 519 participants, RR 1.80 (95% CI 1.52 to 2.13); thrombocytopenia: 2425 participants, RR 18.12 (95% CI 11.77 to 27.92); infections: 2425 participants, RR 3.73 (95% CI 2.58 to 5.38), all low‐quality evidence).
Only one trial (EORTC 20012) planned to assess quality of life, however, no results were reported.
Authors' conclusions
This meta‐analysis provides moderate‐ to high‐quality evidence that adult patients between 16 and 60 years of age with early unfavourable and advanced stage HL benefit regarding OS and PFS from first‐line chemotherapy including escalated BEACOPP. The proven benefit in OS for patients with advanced HL is a new finding of this updated review due to the inclusion of the results from the EORTC 20012 trial. Furthermore, there is only low‐quality evidence of a difference in the total number of secondary malignancies, as the follow‐up period might be too short to detect meaningful differences. Low‐quality evidence also suggests that people treated with escalated BEACOPP may have a higher risk to develop secondary AML or MDS. Due to the availability of only very low‐quality evidence available, we are unable to come to a conclusion in terms of infertility. This review does for the first time suggest a survival benefit. However, it is clear from this review that BEACOPP escalated may be more toxic that ABVD, and very important long‐term side effects of second malignancies and infertility have not been sufficiently analysed yet.
PICO
Plain language summary
Comparison of the two international standards of chemotherapy for people with early unfavourable or advanced stage Hodgkin lymphoma
Review question
For the treatment of early unfavourable and advanced stage Hodgkin lymphoma (HL) two different international standards are commonly used, either chemotherapy with escalated (intensified) BEACOPP (bleomycin, etoposide, doxorubicin, cyclophosphamide, vincristine, procarbazine, prednisone) regimen or chemotherapy with ABVD (doxorubicin, bleomycin, vinblastine, dacarbazine) regimen.
Background
Hodgkin lymphoma is a malignancy of the lymphatic system. It is one of the most common cancers in young adults, particularly in their third decade of life, but it occurs also in children and elderly people. Within the last 50 years it has become one of the most curable forms of cancer. To find the best treatment with the greatest efficacy and least toxicity is the most important challenge in treating HL. There are two international standards for the treatment of early unfavourable or advanced stage HL: chemotherapy with escalated BEACOPP regimen initiated by the German Hodgkin Study Group (GHSG) and chemotherapy with ABVD regimen, which is widely used because it has been proven to be effective, well‐tolerated and easy to administer. We aimed to clarify the advantages and disadvantages of both treatments by comparing the chance of survival (overall survival), the chance of recurrence of the tumour and the frequencies of adverse events after treatment in patients with early unfavourable stage or advanced stage HL.
Study characteristics
We found five eligible trials by the date of this updated review (search date March 2017). These trials included 3427 patients adult patients (16 to 65 years of age).
Key results
For this updated review there are new data available resulting in a benefit in terms of overall survival (OS) for people with early unfavourable and advanced HL receiving BEACOPP escalated for first‐line treatment. Furthermore, the analysis shows a better chance of avoiding recurrence of the tumour in patients who received chemotherapy including BEACOPP escalated.
We analysed the following harms potentially caused by both regimens. There is no evidence for a difference for treatment‐related mortality.
There is evidence for a higher risk of secondary acute myeloid leukaemia (AML) or myelodysplastic syndromes (MDS) in patients receiving BEACOPP escalated, but the total number of secondary malignancies does not show evidence for a difference between both treatment groups. However, the observation time of the studies included in the review is too short to be expected to demonstrate differences with respect to second solid tumours. We are very uncertain how many female patients will be infertile due to chemotherapy and which arm might be favoured, as the evaluated sample is very small. No data for male patients and risk for infertility was provided. Treatment with BEACOPP escalated caused a higher risk of adverse events such as anaemia, neutropenia, thrombocytopenia and infections.
Quality of life was not reported by any of the included trials. One trial stated it would assess quality of life, however, there were no results reported.
Quality of evidence
We assessed the quality of the evidence as high relating to overall survival, as moderate for progression‐free survival and as low for secondary AML or MDS, secondary malignancies and treatment‐related mortality and adverse events. The quality of evidence is very low for infertility.
Authors' conclusions
Summary of findings
| Comparison of chemotherapy including escalated BEACOPP versus chemotherapy including ABVD for people with early unfavourable or advanced stage Hodgkin lymphoma | ||||||
| Patient or population: Patients with early unfavourable or advanced stage HL | ||||||
| Outcomes | Anticipated absolute effects* (95% CI) | Relative effect | № of participants | Quality of the evidence | Comments | |
| Risk with ABVD | Risk with BEACOPP | |||||
| Mortality | Study population1 | HR 0.74 | 3142 | ⊕⊕⊕⊕ | To provide correct results by using the GRADE software, we calculated mortality instead of overall survival | |
| 120 per 1000 | 90 per 1000 | |||||
| Progression, relapse or death | Study population3 | HR 0.54 | 3142 | ⊕⊕⊕⊝ | To provide correct results by using the GRADE software, we calculated progression, relapse or death instead of progression‐free survival | |
| 250 per 1000 | 144 per 1000 | |||||
| Adverse event: treatment‐related mortality follow up median 5 years | Study population | RR 2.15 | 2700 | ⊕⊕⊝⊝ | ||
| 5 per 1000 | 11 per 1000 | |||||
| Adverse event: secondary malignancies follow up median 5 years | Study population | RR 1.00 | 3332 | ⊕⊕⊝⊝ | ||
| 29 per 1000 | 29 per 1000 | |||||
| Adverse event: secondary malignancies: AML or MDS | Study population | RR 3.90 | 3332 | ⊕⊕⊝⊝ | ||
| 3 per 1000 | 10 per 1000 | |||||
| Adverse event: infertility (secondary amenorrhoea) follow up median 5 years | Study population | RR 1.37 | 106 | ⊕⊝⊝⊝ | In the text referred to as infertility. | |
| 375 per 1000 | 514 per 1000 | |||||
| Quality of life | Not reported | |||||
| *The risk in the intervention group (and its 95% confidence interval) is based on the assumed risk in the comparison group and the relative effect of the intervention (and its 95% CI). | ||||||
| GRADE Working Group grades of evidence | ||||||
| 1 we estimated the risk of mortality after 5 years in the ABVD arm as being 12% 2 we estimated the risk of progress, relapse or mortality after 5 years in the ABVD arm as being 25% 3 one level down due to the open‐label design of the included trials which could lead to performance or detection biases 4 two levels down due to very few events and wide confidence intervals (imprecision) 5 one level down due to few events and wide confidence intervals (imprecision) 6 one level down due to indirect results (follow‐up period not long enough to detect meaningful differences) 7 one level down due to indirect results (secondary amenorrhoea measured instead of infertility) (indirectness) | ||||||
Background
Description of the condition
With an annual incidence of approximately two to three per 100,000 in Western countries, Hodgkin lymphoma (HL) is a comparatively rare disease (SEER 2012). However, it is one of the most common malignancies in young adults. In industrialised countries the age distribution of HL shows a first peak in the third decade and a second peak after the age of 55 (Swerdlow 2003; Thomas 2002).
Staging of HL is based on the Ann Arbor system (Carbone 1971), B symptoms and risk factors. Risk factors for HL are, for example, large mediastinal mass, three or more involved lymph node areas, high erythrocyte sedimentation rate (ESR), extranodal lesion, advanced age; and these may vary slightly between different study groups. Additionally, the definition of bulky disease (largest tumour diameter > 10 cm), often referred to as the Cotswold modification (Lister 1989), is taken into consideration. Generally, HL is classified into early favourable, early unfavourable and advanced stage (Engert 2007a; Klimm 2006). In Europe, the early favourable stage group usually comprises Ann Arbor stages I and II without risk factors. Early unfavourable stage includes those patients in stages I and IIA with risk factors, as well as selected patients with stage IIB disease. Most stage III and IV patients are classified in the advanced stage risk group (Diehl 2001; Engert 2003). Patients with Ann Arbor stage IIB and extranodal disease or bulky disease may be included in trials for advanced stages.
Standard chemotherapy for early unfavourable and advanced stage HL in the USA is ABVD, a combination of adriamycin, bleomycin, vinblastine and dacarbazine (Cheson 2004). The ABVD regimen has less severe toxic effects on bone marrow than the previously used MOPP regimen (mechlorethamine, vincristine, procarbazine, and prednisone) and a non‐significant improvement in overall survival (OS) at five years compared to MOPP (66% for MOPP and 73% for ABVD) (Canellos 1992). The problem after both therapy regimens is that there is a 30% to 35% risk of disease progression or relapse within five years and a poor response to salvage treatment (Bonfante 1997; Josting 2002). The ABVD regimen has a number of advantages: it is all‐intravenous, has less cumulative myelotoxicity, a lower risk of secondary malignancies and a lower rate of infertility compared with the previous regimen (Cheson 2004).
In Germany, the standard treatment for early unfavourable and advanced stage HL was COPP/ABVD until the middle 1990s. Then, based on a mathematical model of tumour growth and chemotherapy effects predicting that moderate dose escalation would increase tumour control by 10% to 15% at five years (Hasenclever 1996; Loeffler 1998), the German Hodgkin Study Group (GHSG) evaluated tolerability and efficacy of a new regimen, BEACOPP (bleomycin, etoposide, doxorubicin, cyclophosphamide, vincristine, procarbazine, prednisone) in time and dose intensification (Diehl 2003). After a median observation time of seven years, this study showed the superiority of the escalated BEACOPP regimen in comparison to COPP/ABVD in terms of freedom from treatment failure (85% versus 67%) and overall survival (90% versus 79%). However, an increased second leukaemia rate ((acute myeloid leukaemia (AML)/myeloid dysplastic syndrome (MDS)) was associated with the escalated BEACOPP regimen (Diehl 2003a; Diehl 2004).
Description of the intervention
This escalated BEACOPP schedule initiated by the GHSG in the late 1990s combines a shorter time (shorter cycle) and increased dose (increased single dose) scheme with the following substances: bleomycin, etoposide, doxorubicin, cyclophosphamide, vincristine, procarbazine and prednisone. The regimen should have been applied in an escalated dose, which is given in the Additional tables, Table 1 (Diehl 2003) and a cycle should have been repeated after 21 days. As supportive therapy, granulocyte‐colony stimulating factor (G‐CSF) should have been administered during the escalated BEACOPP regimen from day eight of the cycle (Additional tables, Table 1).
| Drug | Single Dose (mg/m2) | Route | Days given* |
| Bleomycin | 10 | IV | 8 |
| Etoposide | 200 | IV | 1 to 3 |
| Doxorubicin | 35 | IV | 1 |
| Cyclophosphamide | 1200 | IV | 1 |
| Vincristine | 1.4 | IV | 8 |
| Procarbazine | 100 | P.O. | 1 to 7 |
| Prednisone | 40 | P.O. | 1 to 14 |
| G‐CSF | SC | from day 8 | |
| *the regimen was repeated on day 22 IV: intravenously, P.O.: orally, SC: subcutaneous | |||
We considered treatment with chemotherapy including ABVD regimen with or without radiotherapy as control condition. The ABVD regimen includes the following drugs: doxorubicin (adriamycin), bleomycin, vinblastine, and dacarbazine. A cycle should have been repeated after 28 days. The chemotherapy of the comparator arm should have included at least four cycles of ABVD.
If additional radiotherapy was applied, the condition (based on remission status), dosage as well as field (involved or extended) must have been the same in both control and intervention arms. Supportive care should have been similar between control and intervention arms.
How the intervention might work
For people with early unfavourable HL, the investigation of more intensive chemotherapy regimens is an approach to improve long‐term results. The GHSG recommends to treat people with early unfavourable stages with four cycles of chemotherapy (e.g. two cycles escalated BEACOPP followed by two cycles ABVD). People in advanced stages should receive four to six cycles of escalated BEACOPP followed by two to four cycles of standard BEACOPP.
The ABVD regimen is considered as standard therapy for people with HL in some study groups (e.g. the Southwest Oncology Group considered in the trial E2496 eight cycles of ABVD as standard therapy). This regimen is widely used because it is well‐proven, supported by phase III data from the 1990s and it is well‐tolerated and easy to administer. It is effective for patients with early unfavourable or advanced stage without inducing too many adverse events (Gobbi 2005).
Why it is important to do this review
The most important challenge in treating HL is to find the optimal treatment that accomplishes the best efficacy with least toxicity (Connors 2001; Connors 2005a). So far there are two different standards for the treatment of early unfavourable staged and advanced staged HL. Chemotherapy with the ABVD regimen is widely used in North America (Canellos 2005a), while chemotherapy with escalated BEACOPP regimen is mostly used in Germany and some other parts of Europe.
Objectives
To determine the advantages and disadvantages of chemotherapy including escalated BEACOPP compared to chemotherapy including ABVD in the treatment of early unfavourable or advanced stage Hodgkin lymphoma (HL).
Methods
Criteria for considering studies for this review
Types of studies
We considered only randomised controlled trials (RCT) as primary studies in this review and meta‐analysis (O'Connor 2011). We included both full text and abstract publications.
Types of participants
We included studies on male and female patients with previously untreated and histologically‐confirmed diagnosis of early unfavourable or advanced stage Hodgkin lymphoma (HL). We would have accepted trials with protocols for children as well as adults, but we could not identify any randomised trials including children.
If the trial population had been mixed, including participants with haematological malignancies, we would have used data from the HL subgroup. If subgroups had been available (not reported and not provided after personally contacting the author), we would have included only trials with a minimum of 80% of patients with HL, but we could not identify any trial of this type.
We included trials for early unfavourable or advanced stage HL. We considered patients with Ann Arbor stage I/II with risk factors as early unfavourable and patients with Ann Arbor stage III/IV independently from risk factors as advanced stages. We accepted the risk factors used by the respective study group or institution and kept the classification defined and used by the respective study group or institution.
Types of interventions
To assure equal doses of chemotherapy, we considered chemotherapy including at least two cycles of escalated BEACOPP as the intervention condition, and regimens including at least four cycles of ABVD as the control condition, both with or without radiotherapy as first‐line treatment for early unfavourable or advanced stage HL (Hasenclever 2001).
We did not consider chemotherapy with BEACOPP given in the standard dose in this systematic review because the GHSG HD9 trial showed clearly better progression‐free survival (PFS) results with the escalated regimen (Diehl 2004).
If additional radiotherapy was applied, the condition, dosage and field should have been the same in both control and intervention arms.
Types of outcome measures
Primary outcomes
As primary outcomes we chose overall survival (OS) and progression‐free survival (PFS). The definition of OS was time from randomisation until death as a result of any cause (Cheson 2007a).
PFS was defined as the time from randomisation until disease progression, relapse or death as a result of any cause. PFS was provided by GHSG HD14, HD 2000 and EORTC 20012. However, we also accepted other definitions that addressed progression in the process of the disease such as freedom from treatment failure (FFTF) and event‐free survival (EFS). Freedom from treatment failure was defined as the time from randomisation until progression during treatment, lack of complete response at the end of treatment, relapse and death from any cause (GHSG HD9). The definition of EFS was time from randomisation to evidence of severe toxicity causing definite treatment discontinuation, progressive lymphoma, cardiorespiratory failure, secondary leukaemia, death due to any cause, whichever occurred first (GSM‐HD 2008). Within the review, data coming under these definitions were discussed as results of PFS.
Secondary outcomes
In the previous version of this review the authors selected complete response (CR) rate as a secondary outcome because the endpoint is directly measuring the response to the therapy and is one of the outcomes often evaluated in clinical trials in oncology. The review authors also analysed other tumour control outcomes such as freedom from first progression defined as time from randomisation to first evidence of progressive lymphoma (GSM‐HD 2008). In this updated version, we considered these endpoints as less patient‐relevant ones, therefore, we did not present the results for these outcomes in the summary of findings Table for the main comparison.
Other secondary outcomes were harms. We evaluated the following parameters for this purpose:
-
treatment‐related mortality;
-
secondary malignancies, particularly myeloid dysplastic syndrome (MDS) and acute myeloid leukaemia (AML);
-
infertility (since infertility is only measurable indirectly, all assessed outcomes with respect to infertility are reported in the review);
-
adverse events: haematological grade III or IV toxicity, assessed according to the WHO‐scale, particularly thrombocytopenia, leucopenia, anaemia and infection;
-
adverse events: cardiopulmonary toxicity: pulmonary toxicity (bleomycin‐induced lung fibrosis).
We additionally assessed quality of life in this updated review.
Search methods for identification of studies
We adapted search strategies from those suggested in the Cochrane Handbook for Systematic Reviews of Interventions (Lefebvre 2008). We applied no language restriction to reduce the language bias.
Electronic searches
For the primary review published in 2011 we searched the following databases in two steps:
First step: MEDLINE (1985 to November 2008, search strategy see Appendix 1), Embase (1985 to November 2008, search strategy see Appendix 2) and Cochrane Central Register of Controlled Trials (CENTRAL) (the Cochrane Library 2008, Issue 3, search strategy see Appendix 3).
Second step: In 2010 we adapted the search strategies and performed another search in MEDLINE (November 2008 to August 2010, search strategy see Appendix 4) and CENTRAL (the Cochrane Library 2010 issue 8, search strategy see Appendix 5). The Embase search was not updated because our account for this database ended in the meantime.
To keep the review up to date we used the adapted search strategies and performed another search in MEDLINE (August 2010 to March 2017, search strategy see Appendix 6) and CENTRAL (the Cochrane Library 2017 issue 03, search strategy see Appendix 7).
Searching other resources
For the primary review, we conducted the search for the years 1990 until August 2010. We searched those years which were included in CENTRAL via CENTRAL. For the updated review we searched the conference proceedings of annual meetings of the following societies for abstracts:
-
American Society of Clinical Oncology (ASCO) (up to the issue of 2016);
-
American Society of Hematology (ASH) (up to the issue of 2016);
-
European Hematology Association (EHA) (up to the issue of 2016);
-
International Symposium on Hodgkin Lymphoma (ISHL) (up to the issue of 2016).
Moreover, we tried to identify trials with the following methods.
-
Handsearching of references
-
Citations from identified trials and relevant review articles.
-
-
We checked references of all identified trials, relevant review articles and current treatment guidelines for further literature.
-
Personal contacts
-
We contacted experts in the field in order to locate other trials.
-
-
Databases of ongoing trials:
-
Meta‐register of controlled trials: http://www.controlled‐trials.com/mrct/
-
-
We also searched a number of databases and websites of relevant institutions, agencies, organisations (e.g. study groups), societies and registries for (ongoing) trials (August 2016):
-
-
Register of controlled trials: www.controlled‐trials.com
-
EU clinical trials register: www.clinicaltrialsregister.eu/ctr‐search/search
-
Clinicaltrials.gov: clinicaltrials.gov
-
www.eortc.be
-
www.ghsg.org
-
www.ctc.usyd.edu.au
-
www.trialscentral.org/index.html
-
Data collection and analysis
Selection of studies
Two review authors (AW, NS) independently screened titles and abstracts of studies identified from the sources listed above for potentially relevant studies. First, we screened and discarded studies that were clearly ineligible. We assessed selected studies with an eligibility form to determine whether they met the inclusion criteria. We resolved any disagreement between the two review authors by discussion. We would have sought further information from the authors, whose articles contained insufficient data to make a decision about eligibility. The eligibility form contained the following questions.
-
Is the study described as a randomised trial for patients?
-
Were the participants newly diagnosed with early unfavourable or advanced stage Hogdkin lymphoma?
-
Were the participants in the intervention group treated with at least two cycles of escalated BEACOPP?
-
Were the participants in the control group treated with at least four cycles of ABVD?
To be eligible, studies had to meet all of the criteria stated above. We also identified duplicate reports.
We obtained all full‐text versions of all eligible studies for quality assessment and data collection. At every stage of searching and screening of the literature, we documented the overall number of studies identified, excluded and included with reasons in a flow diagram (Moher 2009). We resolved disagreements arising at any stage by discussion and consensus. If an agreement had not been reached, we would have asked a third review author (content expert) to give his or her opinion, in accordance with Chapter 7 of the Cochrane Handbook for Systematic Reviews of Interventions (Higgins 2011), but this procedure was not necessary.
Data extraction and management
We used both full‐text versions and abstracts (if full‐text was not published) of eligible studies to retrieve the data. In case these did not provide sufficient information, we contacted authors of individual studies for additional details (e.g. HD 2000; GHSG HD9; GHSG HD14). We conducted data extraction according to the guidelines proposed by Cochrane. For this review, two review authors (AW, NS) extracted data independently from the studies using a standardised data extraction form containing the following items.
-
General information: first author of the publication, title of study, study ID, author's contact address (if available), source, publication date, country, language.
-
Quality and 'Risk of bias' assessment: sequence generation, allocation concealment, blinding (participants, personnel, outcome assessors), incomplete outcome data, selective outcome reporting, other sources of bias.
-
Trial details: trial design, objectives of the trial, types of outcomes reported, location, setting, sample size calculation, randomisation, treatment allocation, inclusion/exclusion criteria, reasons for exclusion, comparability of groups, length of follow‐up, stratification, stopping rules described, statistical analysis, results, power calculation, recruitment period, funding.
-
Characteristics of participants: age, gender, ethnicity, total number recruited/randomised/analysed (total and for each arm), stage of the disease (Ann Arbor stage, B‐symptoms and risk factors), tumour response (if it was a criteria for randomisation), lost to follow‐up, dropouts by trial arm and reasons.
-
Interventions: type of chemotherapy (name, dose and frequency of drugs from the chemotherapy regimen), number of cycles, length of a cycle and route of interventions, compliance to interventions, supportive therapy given, failure to maintain dose intensity, protocol violations, additional radiotherapy (dosage, field).
-
Outcomes measured: overall survival (OS), progression‐free survival (PFS) or similar tumour control outcomes, treatment‐related mortality, secondary neoplasms (including overall secondary malignancies and AML and MDS), infertility, adverse events, especially haematological toxicity, cardiopulmonary toxicity, quality of life, response rate, freedom from treatment failure (FFTF), number of patients evaluated for each outcome, length of follow‐up for survival outcomes and definitions of the outcomes.
We extracted trials reported in more than one publication on one form only. We resolved potential disagreements by consensus. If an agreement had not been reached, we would have asked a third review author (content expert) to give his or her opinion, but this procedure was not necessary.
Assessment of risk of bias in included studies
Two review authors (AW, NS) assessed eligible studies obtained in the process of study selection as described above for methodological quality. To assess quality, we used the Cochrane 'Risk of bias' table. To improve transparency of judgements, we included quotations from the full‐text article or from supplemental information from the author in the notes section of the 'Risk of bias' table.
We included the following items in the 'Risk of bias' assessment for randomised trials. For details of bias assessment we referred to Chapter 8 of the Cochrane Handbook for Systematic Reviews of Interventions (Higgins 2011a).
There are three categories: yes (low risk of bias), unclear, and no (high risk of bias) in response to the following questions.
-
Sequence generation
-
Allocation concealment
-
Blinding (participants, personnel, outcome assessors)
-
Incomplete outcome data
-
Selective outcome reporting
-
Other potential sources of bias
Measures of treatment effect
For binary variables, we estimated treatment effect measures of individual studies as relative effect measures risk ratio (RR) with corresponding 95% confidence intervals by using the Mantel‐Haenszel method in a fixed‐effect model. For time‐to‐event variables, we estimated treatment effects as hazard ratio (HR) with corresponding 95% confidence intervals by using the generic inverse variance method in a fixed‐effect model. For each trial, we extracted information about time‐to‐event outcome using the methods described by Tierney (Parmar 1998; Tierney 2007).
Dealing with missing data
We dealt with missing data as suggested in Chapter 16 of the Cochrane Handbook for Systematic Reviews of Interventions (Higgins 2011b), We contacted the original investigators to request missing data and received additional information from Mournier and colleagues. We performed sensitivity analysis to assess how sensitive results were to reasonable changes in the assumptions that had been made. We addressed the potential impact of missing data on the findings of the review in the discussion.
Assessment of heterogeneity
We assessed heterogeneity of treatment effects between trials by using a Chi2 test with a significance level at P < 0.1. We used the I² statistic to quantify possible heterogeneity (30% < I² < 75%: moderate heterogeneity, 75% < I²: considerable heterogeneity) (Deeks 2011).
We explored potential causes of heterogeneity by performing sensitivity and subgroup analysis.
Assessment of reporting biases
In a meta‐analysis with more than 10 trials, we would have explored potential reporting bias by generating a funnel plot and statistically testing this by conducting a linear regression test (Sterne 2011). A P value less than 0.1 would have been considered significant for this test. However, we only included five trials so this test was not done.
Data synthesis
According to the recommendations of Cochrane (Deeks 2011), we performed meta‐analyses by using a fixed‐effect model (i.e. generic inverse variance method for time‐to‐event outcomes and a Mantel‐Haenszel method for dichotomous outcomes).
We performed analyses according to the recommendations of Cochrane using the Review Manager (Review Manager 5.3) and listed the predefined outcomes OS, PFS, the adverse events treatment‐related mortality, secondary malignancies, secondary AML/ MDS, and infertility, and quality of life in a 'Summary of findings' table summary of findings Table for the main comparison on absolute risks in each group with the help of GRADE pro 2014.
Subgroup analysis and investigation of heterogeneity
We planned to take the following parameters into consideration for subgroup analysis of the primary outcomes:
-
stage of the disease (early unfavourable versus advanced);
-
age (e.g. children versus adults ≤ 50 years versus adults > 50 years, or depending on the median age of the trial);
-
treatment regimens (i.e. only ABVD regimen versus chemotherapy including ABVD regimen);
-
length of therapy (e.g. four versus eight cycles of chemotherapy);
-
number of cycles of escalated BEACOPP (i.e. two versus four versus eight);
-
radiotherapy (with or without radiotherapy);
-
sequence (e.g. BEACOPP followed by other agents versus other chemotherapeutic agents followed by BEACOPP);
-
length of follow‐up (i.e. long follow‐up (more than five years) versus short follow‐up (five years or less);
-
same total number of cycles of chemotherapy for the control and intervention groups (yes versus no).
We did not conduct planned subgroup analysis by "age", "length of therapy", "sequence", and "total number of cycles of chemotherapy" because the included studies were similar with regard to these characteristics.
We did a test for subgroup differences and considered a P‐value of less than 0.05 as statistical significant for all the outcomes mentioned in the 'Summary of findings' table.
Sensitivity analysis
We would have assessed robustness of the results of the primary outcomes by analyses of the kind of publication (full‐text publications/abstracts) and the type of results (preliminary results/mature results). However, all included trials have been published as full texts.
Results
Description of studies
Results of the search
In total, we screened 790 for the primary review and for the updated version 1006 potentially relevant records up to March 2017 (1796 references after duplicates removed). Of these, 1706 were excluded at the initial stage of screening because they did not fulfil our predefined inclusion criteria. The remaining 90 publications were retrieved as full‐text publications or abstract publications for detailed evaluation. Of these 90 references, 37 were excluded. Five eligible trials (all published) were identified and finally all five trials (53 publications) with 3427 patients were formally included in the main analyses of this review (see Figure 1).
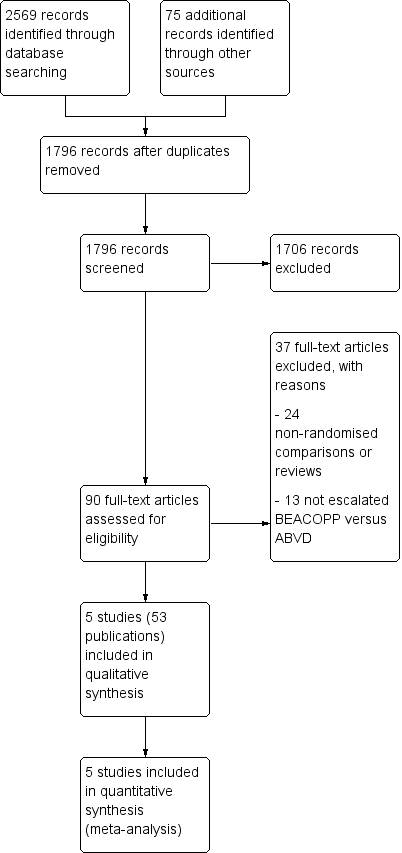
Study flow diagram.
Included studies
Five trials (EORTC 20012; GHSG HD9; GHSG HD14; GSM‐HD 2008; HD 2000) were included in the review. We extracted data from full‐text publications for all five trials. Furthermore, we received additional information from Gianni and colleagues and Borchmann and colleagues to complete the outcome data as well as additional information of patient characteristics of the published abstracts.
See also the table Characteristics of included studies.
Design
Of the five included trials, three trials were two‐armed randomised controlled trials (EORTC 20012; GHSG HD14; GSM‐HD 2008) and two trials were three‐armed randomised controlled trials (GHSG HD9; HD 2000). One of these trials recruited patients from 1993 to 1998 (GHSG HD9), and the others within a period between 2000 to 2008.
Participants
A total of 4124 patients with newly confirmed diagnosis of early unfavourable (GHSG HD14 N = 1655) or advanced stage HL (EORTC 20012 N = 549; GHSG HD9 N = 1282; GSM‐HD 2008 N = 331; HD 2000 N = 307) were randomised within the five trials, but only 3427 of these could be included in this review as they received regimens including escalated BEACOPP or ABVD (EORTC 20012 N = 549; GHSG HD9 N = 727; GHSG HD14 N = 1623; GSM‐HD 2008 N = 3142; HD 2000 N = 197).
All five studies had different eligibility criteria for age (EORTC 20012: 16 to 60 years GHSG HD9: 16 to 65 years; GHSG HD14: 16 to 60 years; GSM‐HD 2008: up to 60 years of age; HD 2000: older than 16 years of age. Only three trials reported data regarding the median age of included patients in these studies (EORTC 20012: 35.2 years; GHSG HD9: 32 years; HD 2000: 29 years). The proportion of the patients being older than 45 or 50 years was between 15% to 26% in the three reporting trials (GHSG HD9: escalated BEACOPP: 15% of 466 patients 50 to 65 years old; standard BEACOPP: 18% of 469 patients 50 to 65 years old; COPP/ABVD: 16% of 260 patients 50 to 65 years old; GSM‐HD 2008: escalated BEACOPP 20% of 155 patients at least 45 years; ABVD 23% of 166 patients at least 45 years); HD 2000: escalated BEACOPP: 17% of 98 patients at least 45 years); CEC: 26% of 98 patients at least 45 years; ABVD: 18% of 99 patients at least 45 years.
Location
The included trials were co‐ordinated from Europe. Two were performed by the German Hodgkin Study Group (GHSG HD9; GHSG HD14), two others were provided by Italian study groups (GSM‐HD 2008; HD 2000), the EORTC 20012 trial had its headquarter in Belgium.
Intervention
Patients from the included trials were either treated with chemotherapy including escalated BEACOPP or with chemotherapy including ABVD as primary treatment for HL. The included trials used the following regimens: four escalated plus two standard courses of BEACOPP versus six courses of ABVD versus six courses of CEC (cyclophosphamide, lomustine, vindesine, melphalan, prednisone, epidoxorubicin, vincristine, procarbazine, vinblastine, and bleomycin) (HD 2000); two escalated courses of BEACOPP plus two courses of ABVD versus four courses of ABVD (GHSG HD14), eight escalated courses of BEACOPP versus eight courses of cyclophosphamide, vincristine, procarbazine, and prednisone (COPP) alternating with ABVD (GHSG HD9), four escalated plus four standard courses of BEACOPP versus six to eight courses of ABVD EORTC 20012 and GSM‐HD 2008. Three of these trials scheduled radiotherapy after chemotherapy for sites of previous bulky disease and slowly or partially responding sites with 30 to 40 Gray (GHSG HD9; GSM‐HD 2008; HD 2000). In the GHSG HD14 trial, all patients received involved‐field radiotherapy of 30 Gray. In the EORTC 20012 trial, none of the patients had received radiotherapy.
Outcomes
Primary outcome measure
All included trials analysed overall survival (OS). The median observation times for OS were as follows: 10 years for two trials (GHSG HD9; HD 2000), however, as no hazard ratios (HRs) were provided for HD 2000, only the short‐term data could be analysed. The median observation time was six years for one trial (GSM‐HD 2008); three to 3.5 years for two trials (EORTC 20012; GHSG HD14). Progression‐free survival (PFS) or similar outcomes (for further information see 'Types of outcome measures, Primary outcomes') were analysed by all included trials. The median observation times for these outcomes were the same as for OS.
Secondary outcome measures
Four trials (EORTC 20012; GHSG HD9; GSM‐HD 2008; HD 2000) reported complete response (CR) rates. Analysable information with regard to adverse events was reported by the following studies: haematological grade III or IV toxicity by three studies (GHSG HD9; GHSG HD14; HD 2000), secondary malignancies by three studies (GHSG HD9; GHSG HD14; HD 2000), treatment‐related mortality was reported by one study (HD 2000), and respiratory toxicity by one study (GHSG HD9). Time to progression was reported by one study (GSM‐HD 2008) and data regarding infertility was reported only by one study (GHSG HD9).
Excluded studies
A total of 37 articles were excluded after detailed evaluation of full‐text publications. The main reasons for exclusion were:
-
24 non‐randomised comparisons or reviews;
-
14 did not evaluate escalated BEACOPP versus ABVD.
These publications are described under Characteristics of excluded studies.
Ongoing studies
The only ongoing study noticed in the primary review, EORTC 20012 , has been published and included in this review. We could not identify any further ongoing trial addressing the objective of this review.
Risk of bias in included studies
Further details on the 'Risk of bias' assessment are shown in Figure 2 and Figure 2.

Risk of bias summary: review authors' judgements about each risk of bias item for each included study.
Allocation
The GHSG HD9 and EORTC 20012 trials reported that treatment allocation of patients was performed at a central trials office and sequence was generated by computer (low risk of bias). The other trials did not state any information with respect to these issues, therefore we judged as unclear risk of bias.
Blinding
None of the trials reported information about blinding. Results with respect to OS are judged not to be influenced by this source of bias, because to define the status of a patient as dead or alive is not a question of individual judgement. With regard to the remaining outcomes all trials were judged "high" for the question of blinding, as it is known that blinding is not feasible in this setting and might influence the outcomes.
Incomplete outcome data
HD 2000, GHSG HD9 and GHSG HD14 described missing outcome data in detail. The GHSG HD9 trial excluded 80 patients because they did not fulfil the inclusion criteria of the study and five patients due to other reasons. HD 2000 excluded all in all eight patients. Missing outcome data in both trials were balanced in numbers across intervention groups (see 'Risk of bias' tables for further details). GHSG HD14 did not include 32 of 1655 patients in the analyses, but missing outcome data were balanced in numbers across both groups (see 'Risk of bias' tables for further details). GSM‐HD 2008 and EORTC 20012 analysed all randomised patients. However, due to the small proportion of missing data in most trials and the detailed descriptions in two of them, we do not believe that bias was introduced into the meta‐analysis by missing data. Therefore we judged attrition bias "low" for all studies.
Selective reporting
As all the outcomes are reported for the GSM‐HD 2008 trials as published in the protocol, we judge the risk of bias as low. HD 2000 is registered in a clinical study registry, but no outcomes are reported, therefore we judge the potential risk of bias as unclear. We could not identify protocols for GHSG HD14 and GHSG HD9 and judge the risk of bias as being unclear. In the study registry it is mentioned that EORTC 20012 evaluated quality of life, but this outcomes is not published, therefore we judge potential risk of bias as high.
Other potential sources of bias
In the GHSG HD9 trial, randomisation to the escalated BEACOPP arm started later than the randomisation to the ABVD arm and the standard BEACOPP arm. Furthermore, randomisation to the COPP/ABVD arm was stopped after the first interim analysis due to the fact that both BEACOPP groups together were significantly superior to COPP/ABVD in terms of the rate of freedom from treatment failure (FFTF) (Diehl 2003). According to this potential risk of bias, the analyses of OS and PFS were based on data of patients recruited within the same time period. J. Franklin, statistician for the HD9 trial, recalculated HRs with confidence intervals (CI) for OS und PFS by considering only patients who where randomised in the same time‐period (between date 1 and date 2). He had a direct access to the individual patient data. It means he considered 265 patients for the escalated BEACOPP arm and 177 patients for the COPP/ABVD arm. We generally judged the risk of other potential sources as "unclear".
The HD 2000 trial was initially designed to examine the myelotoxicity of CEC and BEACOPP regimens compared to ABVD, but the protocol was amended after the first 18 months to test the effect of BEACOPP regimen versus ABVD and CEC, respectively. To calculate the power of the study a one‐sided test was used to consider the expected superiority of BEACOPP in terms of failure‐free survival (FFS). To use a one‐sided test might have led to an underpowered design of the study which leads to an estimate of "high" risk.
Effects of interventions
See: Summary of findings for the main comparison Escalated BEACOPP versus chemotherapy including ABVD
Primary outcome: overall survival (OS)
Participants
All five trials provided information regarding this outcome. To avoid the introduction of potential risk of bias that might have been caused by the GHSG HD9 trial, patients of this trial had to be recruited in a parallel time period to be considered in the analyses (Other potential sources of bias). Together with the patients randomised in the four other trials, this analysis included 3142 participants.
Results
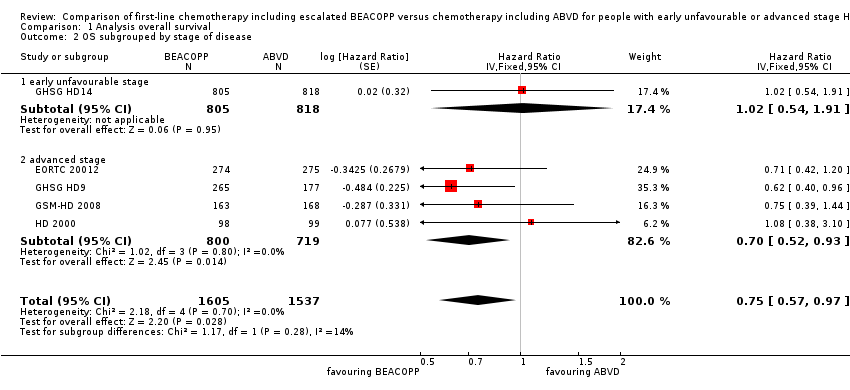
In the main analysis, there was a statistically significant difference between treatment with escalated BEACOPP or ABVD on OS favouring BEACOPP: hazard ratio (HR) 0.74 (95% confidence interval (CI) 0.57 to 0.97, P = 0.03). There was no statistical heterogeneity between the trials, with an I2 = 0% (see Figure 3).
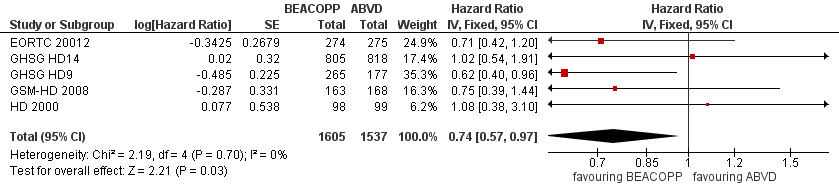
Forest plot of comparison: 1 Analysis of Overall Survival, outcome: 1.1 OS ‐ all ‐ same recruitment period between the 2 arms (HD9).
Subgroup analysis
We conducted subgroup analysis to explore the underlying clinical heterogeneity in order to assess the influence of clinical differences between the studies.
The "test for subgroup differences" showed no statistical differences between the following subgroups:
-
different stages of disease (P = 0.28, early unfavourable: one trial, N = 1623; advanced: four trials, N = 1519); Analysis 1.2
-
different types of treatment regimens (P = 0.29, only ABVD: four trials, N = 2700; ABVD including regimen: one trial, N = 442); Analysis 1.3
-
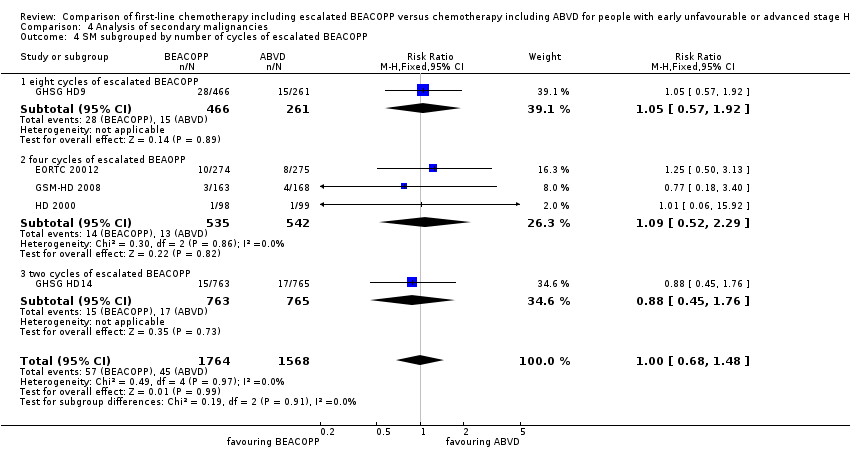
different numbers of cycles of escalated BEACOPP (P = 0.43, eight cycles: one trial, N = 442; four cycles: three trials, N = 1077; two cycles: one trial, N = 1623); Analysis 1.4
-
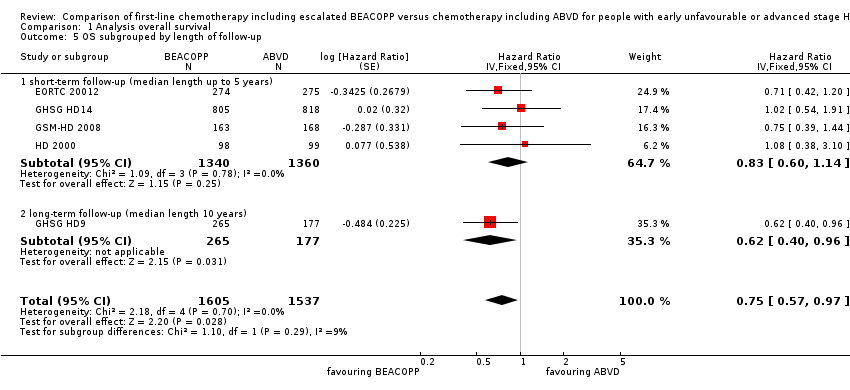
different length of follow‐up (P = 0.29, short‐term follow‐up: four trials, N = 2700, long‐term follow‐up: one trial, N = 442); Analysis 1.5
-
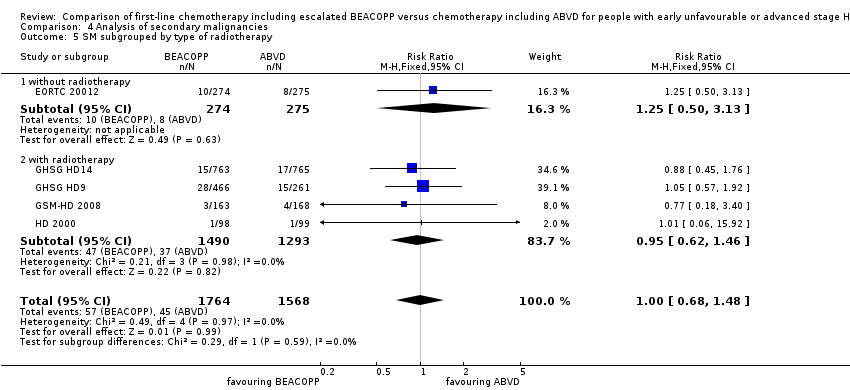
radiotherapy: (P = 0.84, without radiotherapy: one trial, N = 549; with radiotherapy: four trials, N = 2583); Analysis 1.6.
Subgroup analyses in terms of "age", "length of therapy", "sequence", and "same total number of cycles of chemotherapy" were not performed, because the identified studies showed no differences due to these study characteristics (see Subgroup analysis and investigation of heterogeneity).
Sensitivity analysis
We also performed a sensitivity analysis for all recruited patients with potential risk of bias due to different time periods of recruitment in GHSG HD9. This analysis showed also statistically significant effect favouring BEACOPP escalated (HR 0.66, 95% CI 0.52 to 0.84, N = 3427); Analysis 1.7.
Primary outcome: progression‐free survival
Participants
All five trials provided information regarding this outcome. Similar to the procedure for participants of OS, we used the data of patients who were recruited in the GHSG HD9 trial in parallel with the other three trials to perform the main analysis of PFS. This was to avoid the introduction of potential risk of bias (Other potential sources of bias). This analyses included data of 3142 patients from all five studies.
Results
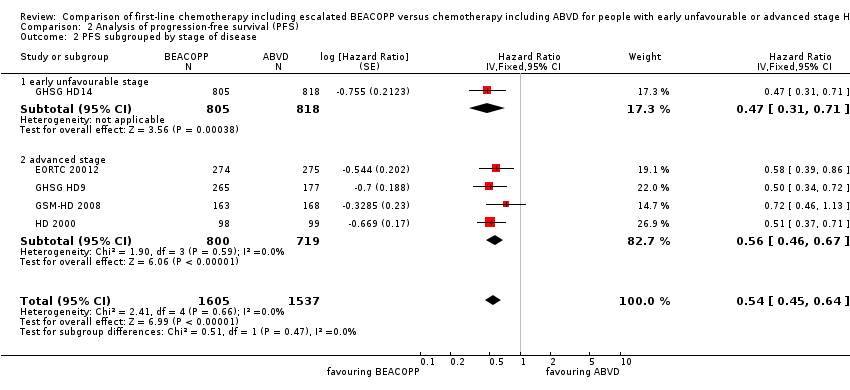
The main analysis of PFS showed a statistically significant improved outcome for patients with escalated BEACOPP: HR was 0.54 (95% CI 0.45 to 0.64), see Figure 4. There was no heterogeneity between trials (I2 = 0%).
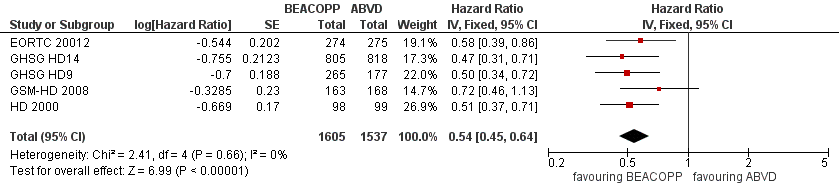
Forest plot of comparison: 2 Analysis of Progression Free Survival, outcome: 2.1 PFS ‐ all ‐ same recruitment period between the 2 arms (HD9).
Subgroup analysis
We conducted subgroup analysis to explore the potential underlying clinical heterogeneity between the studies. The "test for subgroup differences" showed no statistical differences between the following subgroups:
-
different stages of disease (P = 0.47, early unfavourable: one trial, N = 1623; advanced: four trials, N = 1519); Analysis 2.2
-
different types of treatment regimens (P = 0.62, only ABVD: four trials, N = 2700; ABVD including regimen: one trial, N = 442); Analysis 2.3
-
different numbers of cycles of escalated BEACOPP (P = 0.61, eight cycles: one trial, N = 442; four cycles: three trials, N = 1077; two cycles: one trial, N = 1623); Analysis 2.4
-
different length of follow‐up (P = 0.62, short‐term follow‐up: four trials, N = 2700; long‐term follow‐up: one trial, N = 442); Analysis 2.5
-
radiotherapy: (P = 0.69, without radiotherapy: one trial, N = 549; with radiotherapy: four trials, N = 2593); Analysis 2.6.
As explained above, subgroup analyses in terms of "age", "length of therapy", "sequence", and "same total number of cycles of chemotherapy" were not performed (see Subgroup analysis and investigation of heterogeneity).
Sensitivity analysis
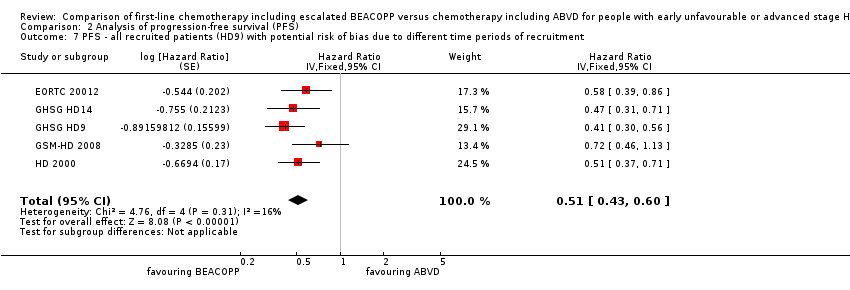
We also performed a sensitivity analysis for all recruited patients with potential risk of bias due to different time periods of recruitment in GHSG HD9. This analysis showed also statistically significant effect favouring BEACOPP escalated (HR 0.51, 95% CI 0.43 to 0.60, N = 3427); Analysis 2.7.
Secondary outcome: treatment‐related mortality
Participants
Data of the treatment‐related mortality was available from the four trials EORTC 20012HD 2000, GSM‐HD 2008 and GHSG HD14 including 2700 participants.
Results
Escalated BEACOPP showed no clear evidence for a difference in terms of treatment‐related mortality, but might be increased with BEACOPP escalated (four trials, N = 2700, (risk ratio (RR) 2.15, 95% CI 0.93 to 4.95) as shown in Analysis 3.1
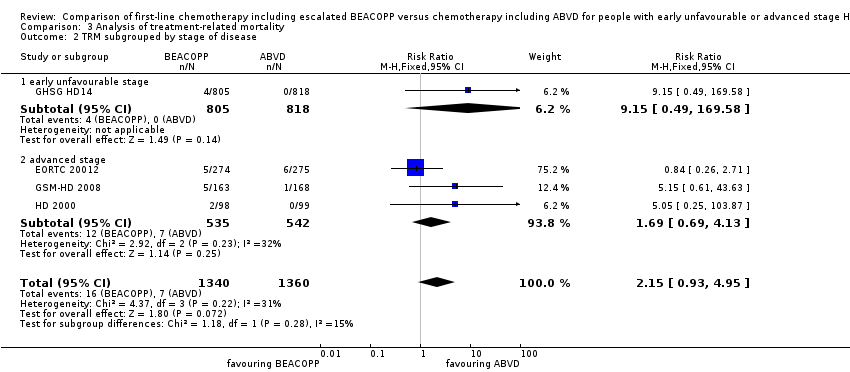
We conducted subgroup analysis to explore the potential underlying clinical heterogeneity between the studies. The "test for subgroup differences" showed no statistical differences between the following subgroups:
-
different stages of disease (P = 0.28, early unfavourable: one trial, N = 1623; advanced: three trials, N = 1077); Analysis 3.2
-
different numbers of cycles of escalated BEACOPP (P = 0.28, early unfavourable: one trial, N = 1623; advanced: three trials, N = 1077); Analysis 3.3
The subgroup analysis for addition of radiotherapy showed a statistical significant subgroup difference (P = 0.04). We did not find evidence for a difference between both intervention arms, if no radiotherapy was applied (RR 0.84, 95% CI 0.26 to 2.71, one trial), but an advantage for the ABVD arm, if additional radiotherapy was administered (RR 6.13, 95% CI 1.38 to 27.26, three trials); Analysis 3.4. However, due to the low number of events results needs to be confirmed before final conclusions can be drawn.
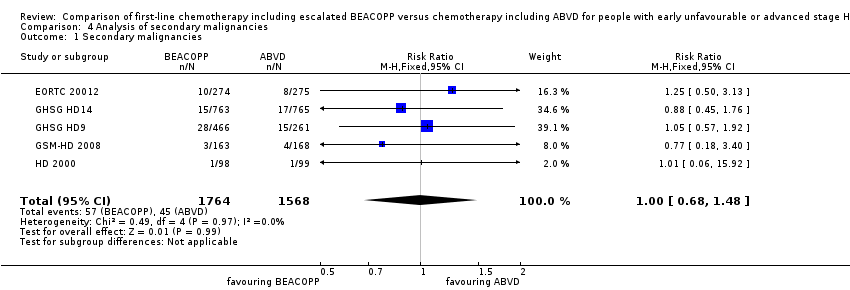
Secondary outcome: secondary malignancies
Participants
The number of secondary malignancies was reported by all trials (EORTC 20012; GHSG HD9; GHSG HD14; HD 2000; GSM‐HD 2008), including 3332 patients.
Results
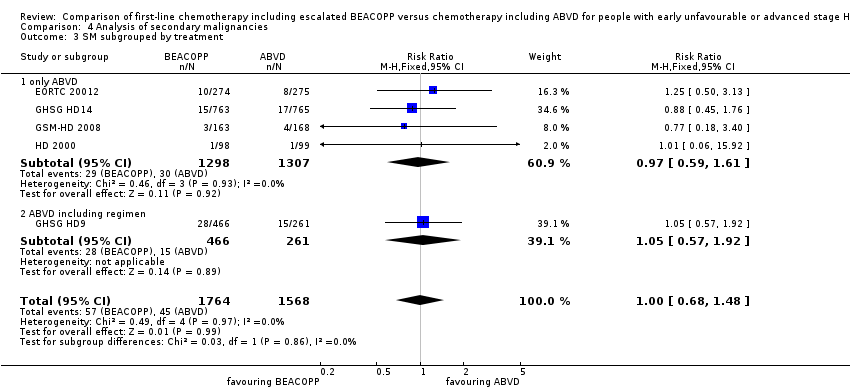
There was no evidence for a difference between both regimens in terms of total rate of secondary malignancies (five trials, N = 3332, RR 1.00, 95% CI 0.68 to 1.48, P = 0.92); Analysis 4.1
The "test for subgroup differences" showed no statistical differences between the following subgroups: different stages of disease, different types of treatment regimens, different numbers of cycles of escalated BEACOPP, different length of follow‐up and whether additional radiotherapy was applied (see Analysis 4.2; Analysis 4.3; Analysis 4.4; Analysis 4.5; Analysis 4.6).
Secondary outcome: secondary AML or MDS
Participants
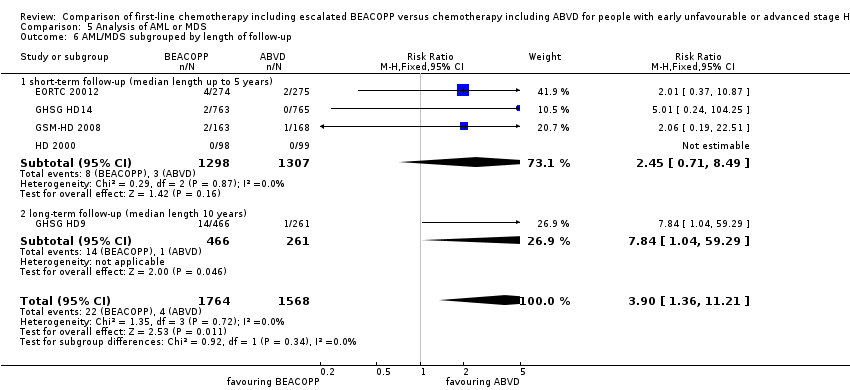
All trials (EORTC 20012; GHSG HD14;GHSG HD9; GSM‐HD 2008;HD 2000) reported occurrence of MDS or AML, N = 3332.
Results
There was a statistically significantly increased occurrence of MDS or AML in BEACOPP included regimens (five trials, N = 3332, RR 3.90, 95% CI 1.36 to 11.21, P = 0.02); Analysis 5.1
We did not identify any statistical differences between the following subgroups: different stages of disease, different types of treatment regimens, different numbers of cycles of escalated BEACOPP, different length of follow‐up and whether additional radiotherapy was applied (see Analysis 5.2; Analysis 5.3; Analysis 5.4; Analysis 5.5; Analysis 5.6).
Secondary outcome: infertility
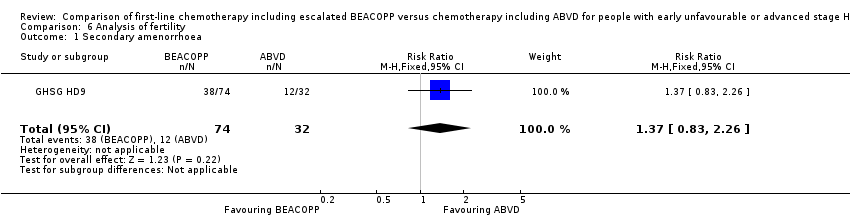
Data regarding infertility were only applied for 106 women of the GHSG HD9 trial.
Results
Secondary amenorrhoea was evaluated as a quantity of infertility, without evidence for a difference between both arms (one trial, N = 106, RR 1.37 0.83 to 2.26, P = 0.22); Analysis 6.1
As only one trial was included, subgroup analyses were not possible
Secondary outcome: adverse events
Participants
Data for the majority of acute adverse effects WHO grade III or IV (i.e. anaemia, infection, thrombocytopenia, mucositis, nausea/vomiting, neurologic toxicity, leucopenia, alopecia, pain) were reported by three trials (GHSG HD14; GHSG HD9; HD 2000) including 2425 participants. Respiratory adverse events were reported by the GHSG HD14, GHSG HD9 and GSM‐HD 2008 trial. The following adverse events were reported by two trials each: neutropenia (GSM‐HD 2008; HD 2000; N = 519), constipation (GHSG HD9; HD 2000; N = 923), analysis of skin (GHSG HD14; GHSG HD9; N = 2227) and heart (GHSG HD14; GSM‐HD 2008; N = 1823),
Due to the low number of included trials we did not perform subgroup analyses.
Results
The escalated BEACOPP regimen caused statistically significantly more acute adverse effects WHO grade III or IV in terms of:
-
anaemia (three trials, N = 2425, RR 10.67, 95% CI 7.14 to 15.93, P < 0.00001); Analysis 7.1
-
infection (three trials, N = 2425, RR 3.73, 95% CI 2.58 to 5.38, P < 0.00001); Analysis 8.1
-
neutropenia (two trials, N = 519, RR 1.80, 95% CI 1.52 to 2.13, P < 0.00001); Analysis 9.1
-
thrombocytopenia (three trials, N = 2425, RR 18.12, 95% CI 11.77 to 27.92, P < 0.00001); Analysis 10.1
-
alopecia (three trials, N = 2425, RR 1.98 95% CI 1.78 to 2.21, P < 0.00001); Analysis 11.1
-
mucositis (three trials, N = 2425, RR 8.04, 95% CI 3.72 to 17.38, P = 0.0005); Analysis 13.1
-
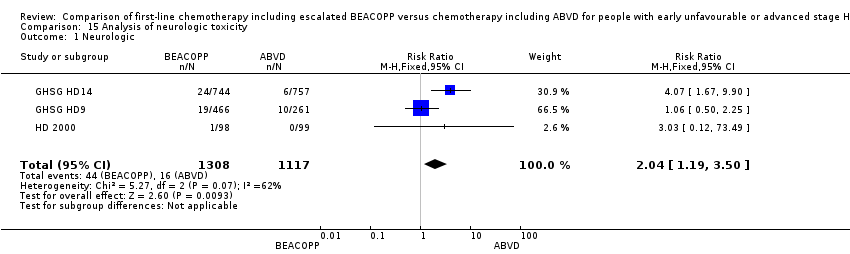
neurologic toxicity (three trials, N = 2425, RR 2.04, 95% CI 1.19 to 3.50, P = 0.009); Analysis 15.1
-
acute adverse effect of the respiratory tract (three trials, N = 2549, RR 1.80, 95% CI 1.01 to 3.20, P = 0.05); Analysis 17.1
-
pain (three trials, N = 2425, RR 2.62, 95% CI 1.76 to 3.90, P < 0.00001); Analysis 16.1
No statistically significant differences between escalated BEACOPP and ABVD‐like regimens were found for:
-
constipation (two trials, N = 923, RR 1.19, 95% CI 0.56 to 2.55, P = 0.65); Analysis 12.1
-
nausea/vomiting (three trials, N = 2425, RR 0.83, 95% CI 0.68 to 1.01, P = 0.06); Analysis 14.1
-
effects on skin (two trials, N = 2227, RR 1.02 95% CI 0.45 to 2.34, P = 0.96); Analysis 18.1
-
effects on heart (two trials, N = 1823, RR 1.04 95% CI 0.21 to 5.10, P = 0.96); Analysis 19.1
One trial (GSM‐HD 2008) reported severe adverse events grade 3 or 4 split in haematological and non‐haematological events during initial chemotherapy. In the BEACOPP arm there were 81% (127/156) participants and in the ABVD arm 43% (72/166) participants affected with haematological events. Non‐haematological events could be seen in 19% (30/156) participants from the BEACOPP group and 7% (12/166) of the people belonging to the ABVD group.
There were a number of adverse events which we did not evaluate in this review, however, these are presented in Table 2.
| Name of trial | Adverse event | Experimental arm (N) | Control arm (N) |
| Gastrointestinal, others | 43/744 | 14/757 | |
| Urogenital tract | 0/744 | 2/757 | |
| Drug fever | 17/744 | 6/757 | |
| Allergy | 12/744 | 2/757 | |
| Gastrointestinal, others | 9/156 | 3/166 | |
| Fever of unknown reason | 2/156 | 1/166 | |
| Others | 16/156 | 1/166 |
Secondary outcome: quality of life
Quality of life was not reported by any of the included trials. One trial (EORTC 20012) stated in the study protocol that quality of life would be assessed, however, there are no results reported.
Secondary outcome: complete response (CR) rate
Participants
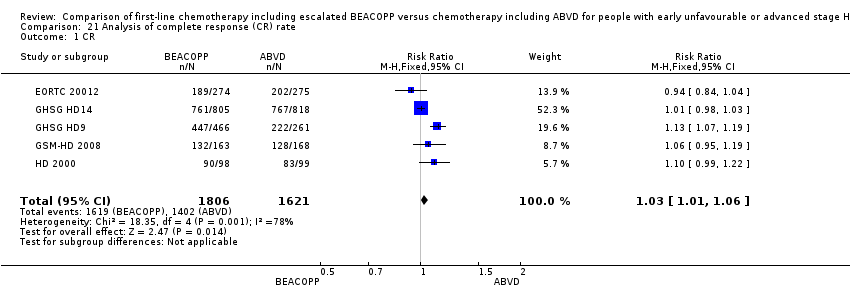
CR rate data were available from five trials (EORTC 20012; GHSG HD14; GHSG HD9; GSM‐HD 2008; HD 2000) that included 3427 participants. Data from the parallel randomisation period of the GHSG HD9 trial were not available so we used the provided CR results of all included patients of this trial.
Results
The overall estimate of CR rate showed no evidence for a difference (RR 1.03, 95% CI 1.01 to 1.06, P = 0.01, I² = 0%) (see Analysis 21.1).
Secondary outcome: freedom from first progression
Participants
Data of the freedom from first progression was only available from the GSM‐HD 2008 trial with 331 participants.
Results
There was a statistically significant evidence for a difference favouring escalated BEACOPP with regard to freedom from first progression (one trial, N = 331, RR 0.46, 95% CI 0.27 to 0.78, P = 0.004) see Analysis 20.1.
Discussion
Summary of main results
In this systematic review we analysed the efficacy and safety of escalated BEACOPP and ABVD chemotherapies for the treatment of early unfavourable or advanced stage Hodgkin lymphoma (HL). The results are summarised in the summary of findings Table for the main comparison. The findings emerging from these meta‐analyses are as follows.
-
In contrast to the first version of this review, the present meta‐analysis shows evidence for a difference in overall survival (OS), favouring BEACOPP escalated.
-
The meta‐analysis also showed evidence for an improvement in progression‐free survival (PFS) for patients who received BEACOPP escalated.
-
There is no evidence for a difference for treatment‐related mortality, but it might be higher with BEACOPP escalated.
-
The meta‐analysis showed a statistically significant higher number of myeloid dysplastic syndrome (MDS) or acute myeloid leukaemia (AML in patients) with advanced HL treated with escalated BEACOPP, but there is no evidence for a difference for overall rate of secondary malignancies between the comparators.
-
So far there is not enough evidence to judge the effects of both regimens on infertility. However, available data showed no evidence for a difference between the treatments in patients with advanced HL.
-
Treatment with escalated BEACOPP presents evidence for an increase in haematological toxicities WHO grade III or VI, such as anaemia, neutropenia, thrombocytopenia, and infection and non‐haematological adverse events like alopecia, mucositis and pain.
-
Furthermore, there is no evidence on quality of life due to a lack of data.
Overall completeness and applicability of evidence
All five identified eligible trials have been published, including more than 3000 patients. The trials included adults between 16 and 65 years of age (GHSG HD9: 16 to 65 years; EORTC 20012 and GHSG HD14: 16 to 60 years; GSM‐HD 2008: up to 60 years of age; HD 2000: older than 16 years of age) with unfavourable or advanced stage of HL. They provided sufficient evidence with regard to survival outcomes and adverse events but data on long‐term toxicity (e.g. infertility, pulmonary and cardiac toxicity) are still insufficient.
Three trials (GSM‐HD 2008, HD 2000 and GHSG HD9) had follow‐ups of more than five years. However, long‐term data from HD 2000 could not be included in the meta‐analyses as the time‐to‐event outcomes have not been reported as hazard ratios (HRs) for each arm and authors did not provide detailed data. Moreover, long‐term secondary malignancies could only be evaluated from HD 2000 as the analysis did not adhere to intention‐to‐treat analysis.
Unfortunately, quality of life was not reported, although evaluated in one trial.
Quality of the evidence
The overall risk of performance and detection bias was low for OS, but was high for other outcomes, as therapy blinding was not feasible. The remaining 'Risk of bias' domains were low and unclear.
The quality of evidence is high for OS, with enough events and precise results allowing meaningful statements. The quality of evidence is moderate for PFS, as the open‐label design of the included trials could lead to performance or detection biases. We downgraded by one level for this outcome. The quality of evidence is low for adverse events, due to the small number of events leading to highly imprecise results (downgraded by two points). The quality of evidence for treatment‐related mortality and secondary AML or MDS is judged at low, due to a very small number of events leading to very high imprecision (downgraded by two points). The quality of evidence for secondary malignancies is low, downgraded by one point due to small number of events leading to imprecision and downgraded by one point due to indirect results because of the short follow‐up period. To detect meaningful differences in terms of secondary malignancies, the follow‐up period should be at least 15 years.
The quality of evidence is very low quality for infertility, due to high imprecision, resulting in downgrading by two points. We downgraded one point for indirectness as secondary amenorrhoea was measured instead of infertility. Moreover, no trial reported results for male fertility.
We did not identify risk of publication bias, as all registered trials are published and we are not aware of further ongoing studies or completed studies that have not been published.
Potential biases in the review process
To prevent bias within the review, only randomised controlled trials (RCTs) were considered. In addition, all important conference proceedings were searched up to their latest issues. We tried to avoid bias by performing all relevant processes in duplicate. We are not aware of any obvious deficiencies in our review process. However, the small number of trials included in this analysis could lead to publication bias, as we could not generate a funnel plot. However, as mentioned before, we did not identify risk of publication bias, as all registered trials are published and we are not aware of further ongoing studies or completed studies that have not been published.
One concern associated with the GHSG HD9 trial was that randomisation to the escalated BEACOPP arm started later than the randomisation to the other two arms. Furthermore, randomisation to the COPP/ABVD arm was stopped after the first interim analysis due to the fact that both BEACOPP groups together were statistically significantly superior to COPP/ABVD in terms of the rate of freedom from treatment failure (Diehl 2003). According to this potential risk of bias, the analyses of OS and PFS were based on data of patients recruited within the same time period (COOPP/ABVD N = 177, BEACOPP N = 265).
In summary, there is maximum likelihood that all relevant studies were identified, all relevant data could be obtained and the review process (searching, data collection, analysis) did not introduce bias into the review.
Agreements and disagreements with other studies or reviews
Within this context two trials (Eich 2010; Ferme 2007a), examined the treatment with four to six cycles ABVD compared to four cycles BEACOPP baseline. Neither showed an advantage of BEACOPP baseline regarding response, freedom from treatment failure/event‐free survival, nor OS. However, following the rationale to aim at improved outcomes by dose escalation, the HD14 trial was designed to examine the even more intensive regimen of two cycles of escalated BEACOPP, plus two cycles of ABVD compared to four cycles of ABVD, both followed by 30 Gray involved field radiotherapy (IF‐RT) for early unfavourable HL. This further intensification might be a success, because after a median follow‐up of 3.5 years the trial showed an improved freedom from treatment failure for patients who received escalated BEACOPP (HR 0.49, 95% CI 0.34 to 0.71), even if a difference with regard to OS was not detectible within this short period (GHSG HD14).
The discussion on pros and cons of escalated BEACOPP compared to other treatment options, especially ABVD, for HL patients with advanced‐stage disease is active since the GHSG HD9 trial has been published. All included trials in this review that examined patients with newly diagnosed unfavourable or advanced stage HL showed an improved PFS with BEACOPP escalated compared to ABVD. With the inclusion of the recently completed trial EORTC 20012 in the meta‐analysis, this increased PFS is now also translated in an overall survival advantage with BEACOPP escalated. This result is in line with a comprehensive network meta‐analysis in advanced stage HL patients, favouring BEACOPP escalated over ABVD (Skoetz 2013).

Study flow diagram.

Risk of bias summary: review authors' judgements about each risk of bias item for each included study.

Forest plot of comparison: 1 Analysis of Overall Survival, outcome: 1.1 OS ‐ all ‐ same recruitment period between the 2 arms (HD9).

Forest plot of comparison: 2 Analysis of Progression Free Survival, outcome: 2.1 PFS ‐ all ‐ same recruitment period between the 2 arms (HD9).
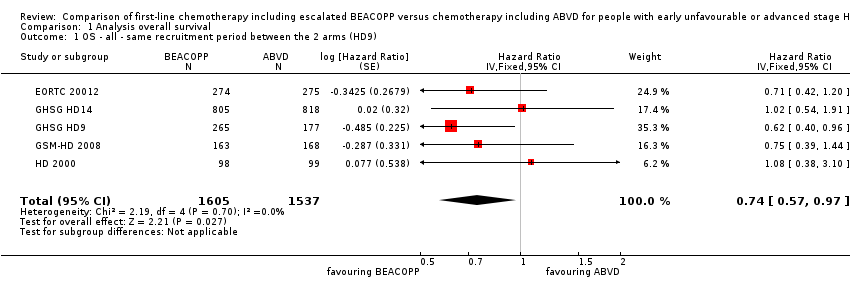
Comparison 1 Analysis overall survival, Outcome 1 OS ‐ all ‐ same recruitment period between the 2 arms (HD9).
Comparison 1 Analysis overall survival, Outcome 2 OS subgrouped by stage of disease.

Comparison 1 Analysis overall survival, Outcome 3 OS subgrouped by treatment.

Comparison 1 Analysis overall survival, Outcome 4 OS subgrouped by number of cycles of escalated BEACOPP.
Comparison 1 Analysis overall survival, Outcome 5 OS subgrouped by length of follow‐up.

Comparison 1 Analysis overall survival, Outcome 6 OS subgrouped by radiotherapy.

Comparison 1 Analysis overall survival, Outcome 7 OS ‐ all recruited patients (HD9) with potential risk of bias due to different time periods of recruitment.

Comparison 2 Analysis of progression‐free survival (PFS), Outcome 1 PFS ‐ all ‐ same recruitment period between the 2 arms (HD9).
Comparison 2 Analysis of progression‐free survival (PFS), Outcome 2 PFS subgrouped by stage of disease.

Comparison 2 Analysis of progression‐free survival (PFS), Outcome 3 PFS subgrouped by treatment.

Comparison 2 Analysis of progression‐free survival (PFS), Outcome 4 PFS subgrouped by number of cycles of escalated BEACOPP.

Comparison 2 Analysis of progression‐free survival (PFS), Outcome 5 PFS subgrouped by length of follow‐up.

Comparison 2 Analysis of progression‐free survival (PFS), Outcome 6 PFS subgrouped by type of radiotherapy.
Comparison 2 Analysis of progression‐free survival (PFS), Outcome 7 PFS ‐ all recruited patients (HD9) with potential risk of bias due to different time periods of recruitment.
Comparison 3 Analysis of treatment‐related mortality, Outcome 1 Treatment‐related mortality.
Comparison 3 Analysis of treatment‐related mortality, Outcome 2 TRM subgrouped by stage of disease.

Comparison 3 Analysis of treatment‐related mortality, Outcome 3 TRM subgrouped by number of cycles of escalated BEACOPP.

Comparison 3 Analysis of treatment‐related mortality, Outcome 4 TRM subgrouped by type of radiotherapy.
Comparison 4 Analysis of secondary malignancies, Outcome 1 Secondary malignancies.

Comparison 4 Analysis of secondary malignancies, Outcome 2 SM subgrouped by stage of disease.
Comparison 4 Analysis of secondary malignancies, Outcome 3 SM subgrouped by treatment.
Comparison 4 Analysis of secondary malignancies, Outcome 4 SM subgrouped by number of cycles of escalated BEACOPP.
Comparison 4 Analysis of secondary malignancies, Outcome 5 SM subgrouped by type of radiotherapy.

Comparison 4 Analysis of secondary malignancies, Outcome 6 SM subgrouped by length of follow‐up.

Comparison 5 Analysis of AML or MDS, Outcome 1 AML or MDS.

Comparison 5 Analysis of AML or MDS, Outcome 2 AML/MDS subgrouped by stage of disease.

Comparison 5 Analysis of AML or MDS, Outcome 3 AML/MDS subgrouped by treatment.

Comparison 5 Analysis of AML or MDS, Outcome 4 AML/MDS subgrouped by number of cycles of escalated BEACOPP.

Comparison 5 Analysis of AML or MDS, Outcome 5 AML/MDS subgrouped by type of radiotherapy.
Comparison 5 Analysis of AML or MDS, Outcome 6 AML/MDS subgrouped by length of follow‐up.
Comparison 6 Analysis of fertility, Outcome 1 Secondary amenorrhoea.

Comparison 7 Analysis of anaemia, Outcome 1 Anaemia.

Comparison 8 Analysis of infection, Outcome 1 Infection.
Comparison 9 Analysis of neutropenia, Outcome 1 Neutropenia.

Comparison 10 Analysis of thrombocytopenia, Outcome 1 Thrombocytopenia.

Comparison 11 Analysis of alopecia, Outcome 1 Alopecia.

Comparison 12 Analysis of constipation, Outcome 1 Constipation.

Comparison 13 Analysis of mucositis, Outcome 1 Mucositis.

Comparison 14 Analysis of nausea/vomiting, Outcome 1 Nausea/vomiting.
Comparison 15 Analysis of neurologic toxicity, Outcome 1 Neurologic.

Comparison 16 Analysis of pain, Outcome 1 Pain.

Comparison 17 Analysis of respiratory, Outcome 1 Respiratory.

Comparison 18 Analysis of skin, Outcome 1 Skin.

Comparison 19 Analysis of heart disease, Outcome 1 heart.

Comparison 20 Analysis of freedom from first progression, Outcome 1 Freedom from first progression.
Comparison 21 Analysis of complete response (CR) rate, Outcome 1 CR.
| Comparison of chemotherapy including escalated BEACOPP versus chemotherapy including ABVD for people with early unfavourable or advanced stage Hodgkin lymphoma | ||||||
| Patient or population: Patients with early unfavourable or advanced stage HL | ||||||
| Outcomes | Anticipated absolute effects* (95% CI) | Relative effect | № of participants | Quality of the evidence | Comments | |
| Risk with ABVD | Risk with BEACOPP | |||||
| Mortality | Study population1 | HR 0.74 | 3142 | ⊕⊕⊕⊕ | To provide correct results by using the GRADE software, we calculated mortality instead of overall survival | |
| 120 per 1000 | 90 per 1000 | |||||
| Progression, relapse or death | Study population3 | HR 0.54 | 3142 | ⊕⊕⊕⊝ | To provide correct results by using the GRADE software, we calculated progression, relapse or death instead of progression‐free survival | |
| 250 per 1000 | 144 per 1000 | |||||
| Adverse event: treatment‐related mortality follow up median 5 years | Study population | RR 2.15 | 2700 | ⊕⊕⊝⊝ | ||
| 5 per 1000 | 11 per 1000 | |||||
| Adverse event: secondary malignancies follow up median 5 years | Study population | RR 1.00 | 3332 | ⊕⊕⊝⊝ | ||
| 29 per 1000 | 29 per 1000 | |||||
| Adverse event: secondary malignancies: AML or MDS | Study population | RR 3.90 | 3332 | ⊕⊕⊝⊝ | ||
| 3 per 1000 | 10 per 1000 | |||||
| Adverse event: infertility (secondary amenorrhoea) follow up median 5 years | Study population | RR 1.37 | 106 | ⊕⊝⊝⊝ | In the text referred to as infertility. | |
| 375 per 1000 | 514 per 1000 | |||||
| Quality of life | Not reported | |||||
| *The risk in the intervention group (and its 95% confidence interval) is based on the assumed risk in the comparison group and the relative effect of the intervention (and its 95% CI). | ||||||
| GRADE Working Group grades of evidence | ||||||
| 1 we estimated the risk of mortality after 5 years in the ABVD arm as being 12% 2 we estimated the risk of progress, relapse or mortality after 5 years in the ABVD arm as being 25% 3 one level down due to the open‐label design of the included trials which could lead to performance or detection biases 4 two levels down due to very few events and wide confidence intervals (imprecision) 5 one level down due to few events and wide confidence intervals (imprecision) 6 one level down due to indirect results (follow‐up period not long enough to detect meaningful differences) 7 one level down due to indirect results (secondary amenorrhoea measured instead of infertility) (indirectness) | ||||||
| Drug | Single Dose (mg/m2) | Route | Days given* |
| Bleomycin | 10 | IV | 8 |
| Etoposide | 200 | IV | 1 to 3 |
| Doxorubicin | 35 | IV | 1 |
| Cyclophosphamide | 1200 | IV | 1 |
| Vincristine | 1.4 | IV | 8 |
| Procarbazine | 100 | P.O. | 1 to 7 |
| Prednisone | 40 | P.O. | 1 to 14 |
| G‐CSF | SC | from day 8 | |
| *the regimen was repeated on day 22 IV: intravenously, P.O.: orally, SC: subcutaneous | |||
| Name of trial | Adverse event | Experimental arm (N) | Control arm (N) |
| Gastrointestinal, others | 43/744 | 14/757 | |
| Urogenital tract | 0/744 | 2/757 | |
| Drug fever | 17/744 | 6/757 | |
| Allergy | 12/744 | 2/757 | |
| Gastrointestinal, others | 9/156 | 3/166 | |
| Fever of unknown reason | 2/156 | 1/166 | |
| Others | 16/156 | 1/166 |
| Outcome or subgroup title | No. of studies | No. of participants | Statistical method | Effect size |
| 1 OS ‐ all ‐ same recruitment period between the 2 arms (HD9) Show forest plot | 5 | 3142 | Hazard Ratio (Fixed, 95% CI) | 0.74 [0.57, 0.97] |
| 2 OS subgrouped by stage of disease Show forest plot | 5 | 3142 | Hazard Ratio (Fixed, 95% CI) | 0.75 [0.57, 0.97] |
| 2.1 early unfavourable stage | 1 | 1623 | Hazard Ratio (Fixed, 95% CI) | 1.02 [0.54, 1.91] |
| 2.2 advanced stage | 4 | 1519 | Hazard Ratio (Fixed, 95% CI) | 0.70 [0.52, 0.93] |
| 3 OS subgrouped by treatment Show forest plot | 5 | 3142 | Hazard Ratio (Fixed, 95% CI) | 0.75 [0.57, 0.97] |
| 3.1 only ABVD regimen | 4 | 2700 | Hazard Ratio (Fixed, 95% CI) | 0.83 [0.60, 1.14] |
| 3.2 ABVD including regimen | 1 | 442 | Hazard Ratio (Fixed, 95% CI) | 0.62 [0.40, 0.96] |
| 4 OS subgrouped by number of cycles of escalated BEACOPP Show forest plot | 5 | 3142 | Hazard Ratio (Fixed, 95% CI) | 0.75 [0.57, 0.97] |
| 4.1 eight cycles of escalated BEACOPP | 1 | 442 | Hazard Ratio (Fixed, 95% CI) | 0.62 [0.40, 0.96] |
| 4.2 four cycles of escalated BEACOPP | 3 | 1077 | Hazard Ratio (Fixed, 95% CI) | 0.76 [0.52, 1.12] |
| 4.3 two cycles of escalated BEACOPP | 1 | 1623 | Hazard Ratio (Fixed, 95% CI) | 1.02 [0.54, 1.91] |
| 5 OS subgrouped by length of follow‐up Show forest plot | 5 | 3142 | Hazard Ratio (Fixed, 95% CI) | 0.75 [0.57, 0.97] |
| 5.1 short‐term follow‐up (median length up to 5 years) | 4 | 2700 | Hazard Ratio (Fixed, 95% CI) | 0.83 [0.60, 1.14] |
| 5.2 long‐term follow‐up (median length 10 years) | 1 | 442 | Hazard Ratio (Fixed, 95% CI) | 0.62 [0.40, 0.96] |
| 6 OS subgrouped by radiotherapy Show forest plot | 5 | 3132 | Hazard Ratio (Fixed, 95% CI) | 0.75 [0.57, 0.97] |
| 6.1 without radiotherapy | 1 | 549 | Hazard Ratio (Fixed, 95% CI) | 0.71 [0.42, 1.20] |
| 6.2 with radiotherapy | 4 | 2583 | Hazard Ratio (Fixed, 95% CI) | 0.76 [0.56, 1.02] |
| 7 OS ‐ all recruited patients (HD9) with potential risk of bias due to different time periods of recruitment Show forest plot | 5 | Hazard Ratio (Fixed, 95% CI) | 0.66 [0.52, 0.84] | |
| Outcome or subgroup title | No. of studies | No. of participants | Statistical method | Effect size |
| 1 PFS ‐ all ‐ same recruitment period between the 2 arms (HD9) Show forest plot | 5 | 3142 | Hazard Ratio (Fixed, 95% CI) | 0.54 [0.45, 0.64] |
| 2 PFS subgrouped by stage of disease Show forest plot | 5 | 3142 | Hazard Ratio (Fixed, 95% CI) | 0.54 [0.45, 0.64] |
| 2.1 early unfavourable stage | 1 | 1623 | Hazard Ratio (Fixed, 95% CI) | 0.47 [0.31, 0.71] |
| 2.2 advanced stage | 4 | 1519 | Hazard Ratio (Fixed, 95% CI) | 0.56 [0.46, 0.67] |
| 3 PFS subgrouped by treatment Show forest plot | 5 | 3142 | Hazard Ratio (Fixed, 95% CI) | 0.54 [0.45, 0.64] |
| 3.1 only ABVD regimen | 4 | 2700 | Hazard Ratio (Fixed, 95% CI) | 0.55 [0.45, 0.67] |
| 3.2 ABVD including regimen | 1 | 442 | Hazard Ratio (Fixed, 95% CI) | 0.50 [0.34, 0.72] |
| 4 PFS subgrouped by number of cycles of escalated BEACOPP Show forest plot | 5 | 3142 | Hazard Ratio (Fixed, 95% CI) | 0.54 [0.45, 0.64] |
| 4.1 eight cycles of escalated BEACOPP | 1 | 442 | Hazard Ratio (Fixed, 95% CI) | 0.50 [0.34, 0.72] |
| 4.2 four cycles of escalated BEACOPP | 3 | 1077 | Hazard Ratio (Fixed, 95% CI) | 0.58 [0.46, 0.72] |
| 4.3 two cycles of escalated BEACOPP | 1 | 1623 | Hazard Ratio (Fixed, 95% CI) | 0.47 [0.31, 0.71] |
| 5 PFS subgrouped by length of follow‐up Show forest plot | 5 | 3142 | Hazard Ratio (Fixed, 95% CI) | 0.54 [0.45, 0.64] |
| 5.1 short‐term follow‐up (median length up to 5 years) | 4 | 2700 | Hazard Ratio (Fixed, 95% CI) | 0.55 [0.45, 0.67] |
| 5.2 long‐term follow‐up (median length 10 years) | 1 | 442 | Hazard Ratio (Fixed, 95% CI) | 0.50 [0.34, 0.72] |
| 6 PFS subgrouped by type of radiotherapy Show forest plot | 5 | Hazard Ratio (Fixed, 95% CI) | 0.54 [0.45, 0.64] | |
| 6.1 without radiotherapy | 1 | Hazard Ratio (Fixed, 95% CI) | 0.58 [0.39, 0.86] | |
| 6.2 with radiotherapy | 4 | Hazard Ratio (Fixed, 95% CI) | 0.53 [0.44, 0.64] | |
| 7 PFS ‐ all recruited patients (HD9) with potential risk of bias due to different time periods of recruitment Show forest plot | 5 | Hazard Ratio (Fixed, 95% CI) | 0.51 [0.43, 0.60] | |
| Outcome or subgroup title | No. of studies | No. of participants | Statistical method | Effect size |
| 1 Treatment‐related mortality Show forest plot | 4 | 2700 | Risk Ratio (M‐H, Fixed, 95% CI) | 2.15 [0.93, 4.95] |
| 2 TRM subgrouped by stage of disease Show forest plot | 4 | 2700 | Risk Ratio (M‐H, Fixed, 95% CI) | 2.15 [0.93, 4.95] |
| 2.1 early unfavourable stage | 1 | 1623 | Risk Ratio (M‐H, Fixed, 95% CI) | 9.15 [0.49, 169.58] |
| 2.2 advanced stage | 3 | 1077 | Risk Ratio (M‐H, Fixed, 95% CI) | 1.69 [0.69, 4.13] |
| 3 TRM subgrouped by number of cycles of escalated BEACOPP Show forest plot | 4 | 2700 | Risk Ratio (M‐H, Fixed, 95% CI) | 2.15 [0.93, 4.95] |
| 3.1 four cycles of escalated BEAOPP | 3 | 1077 | Risk Ratio (M‐H, Fixed, 95% CI) | 1.69 [0.69, 4.13] |
| 3.2 two cycles of escalated BEACOPP | 1 | 1623 | Risk Ratio (M‐H, Fixed, 95% CI) | 9.15 [0.49, 169.58] |
| 4 TRM subgrouped by type of radiotherapy Show forest plot | 4 | 2700 | Risk Ratio (M‐H, Fixed, 95% CI) | 2.15 [0.93, 4.95] |
| 4.1 without radiotherapy | 1 | 549 | Risk Ratio (M‐H, Fixed, 95% CI) | 0.84 [0.26, 2.71] |
| 4.2 with radiotherapy | 3 | 2151 | Risk Ratio (M‐H, Fixed, 95% CI) | 6.13 [1.38, 27.26] |
| Outcome or subgroup title | No. of studies | No. of participants | Statistical method | Effect size |
| 1 Secondary malignancies Show forest plot | 5 | 3332 | Risk Ratio (M‐H, Fixed, 95% CI) | 1.00 [0.68, 1.48] |
| 2 SM subgrouped by stage of disease Show forest plot | 5 | 3332 | Risk Ratio (M‐H, Fixed, 95% CI) | 1.00 [0.68, 1.48] |
| 2.1 early unfavourable stage | 1 | 1528 | Risk Ratio (M‐H, Fixed, 95% CI) | 0.88 [0.45, 1.76] |
| 2.2 advanced stage | 4 | 1804 | Risk Ratio (M‐H, Fixed, 95% CI) | 1.06 [0.66, 1.70] |
| 3 SM subgrouped by treatment Show forest plot | 5 | 3332 | Risk Ratio (M‐H, Fixed, 95% CI) | 1.00 [0.68, 1.48] |
| 3.1 only ABVD | 4 | 2605 | Risk Ratio (M‐H, Fixed, 95% CI) | 0.97 [0.59, 1.61] |
| 3.2 ABVD including regimen | 1 | 727 | Risk Ratio (M‐H, Fixed, 95% CI) | 1.05 [0.57, 1.92] |
| 4 SM subgrouped by number of cycles of escalated BEACOPP Show forest plot | 5 | 3332 | Risk Ratio (M‐H, Fixed, 95% CI) | 1.00 [0.68, 1.48] |
| 4.1 eight cycles of escalated BEACOPP | 1 | 727 | Risk Ratio (M‐H, Fixed, 95% CI) | 1.05 [0.57, 1.92] |
| 4.2 four cycles of escalated BEAOPP | 3 | 1077 | Risk Ratio (M‐H, Fixed, 95% CI) | 1.09 [0.52, 2.29] |
| 4.3 two cycles of escalated BEACOPP | 1 | 1528 | Risk Ratio (M‐H, Fixed, 95% CI) | 0.88 [0.45, 1.76] |
| 5 SM subgrouped by type of radiotherapy Show forest plot | 5 | 3332 | Risk Ratio (M‐H, Fixed, 95% CI) | 1.00 [0.68, 1.48] |
| 5.1 without radiotherapy | 1 | 549 | Risk Ratio (M‐H, Fixed, 95% CI) | 1.25 [0.50, 3.13] |
| 5.2 with radiotherapy | 4 | 2783 | Risk Ratio (M‐H, Fixed, 95% CI) | 0.95 [0.62, 1.46] |
| 6 SM subgrouped by length of follow‐up Show forest plot | 5 | 3332 | Risk Ratio (M‐H, Fixed, 95% CI) | 1.00 [0.68, 1.48] |
| 6.1 short‐term follow‐up (median length up to 5 years) | 4 | 2605 | Risk Ratio (M‐H, Fixed, 95% CI) | 0.97 [0.59, 1.61] |
| 6.2 long‐term follow‐up (median length 10 years) | 1 | 727 | Risk Ratio (M‐H, Fixed, 95% CI) | 1.05 [0.57, 1.92] |
| Outcome or subgroup title | No. of studies | No. of participants | Statistical method | Effect size |
| 1 AML or MDS Show forest plot | 5 | 3332 | Risk Ratio (M‐H, Fixed, 95% CI) | 3.90 [1.36, 11.21] |
| 2 AML/MDS subgrouped by stage of disease Show forest plot | 5 | 3332 | Risk Ratio (M‐H, Fixed, 95% CI) | 3.90 [1.36, 11.21] |
| 2.1 early unfavourable stage | 1 | 1528 | Risk Ratio (M‐H, Fixed, 95% CI) | 5.01 [0.24, 104.25] |
| 2.2 advanced stage | 4 | 1804 | Risk Ratio (M‐H, Fixed, 95% CI) | 3.77 [1.22, 11.64] |
| 3 AML/MDS subgrouped by treatment Show forest plot | 5 | 3332 | Risk Ratio (M‐H, Fixed, 95% CI) | 3.90 [1.36, 11.21] |
| 3.1 only ABVD | 4 | 2605 | Risk Ratio (M‐H, Fixed, 95% CI) | 2.45 [0.71, 8.49] |
| 3.2 ABVD including regimen | 1 | 727 | Risk Ratio (M‐H, Fixed, 95% CI) | 7.84 [1.04, 59.29] |
| 4 AML/MDS subgrouped by number of cycles of escalated BEACOPP Show forest plot | 5 | 3332 | Risk Ratio (M‐H, Fixed, 95% CI) | 3.90 [1.36, 11.21] |
| 4.1 eight cycles of escalated BEACOPP | 1 | 727 | Risk Ratio (M‐H, Fixed, 95% CI) | 7.84 [1.04, 59.29] |
| 4.2 four cycles of escalated BEAOPP | 3 | 1077 | Risk Ratio (M‐H, Fixed, 95% CI) | 2.03 [0.51, 8.05] |
| 4.3 two cycles of escalated BEACOPP | 1 | 1528 | Risk Ratio (M‐H, Fixed, 95% CI) | 5.01 [0.24, 104.25] |
| 5 AML/MDS subgrouped by type of radiotherapy Show forest plot | 5 | 3332 | Risk Ratio (M‐H, Fixed, 95% CI) | 3.90 [1.36, 11.21] |
| 5.1 without radiotherapy | 1 | 549 | Risk Ratio (M‐H, Fixed, 95% CI) | 2.01 [0.37, 10.87] |
| 5.2 with radiotherapy | 4 | 2783 | Risk Ratio (M‐H, Fixed, 95% CI) | 5.27 [1.34, 20.74] |
| 6 AML/MDS subgrouped by length of follow‐up Show forest plot | 5 | 3332 | Risk Ratio (M‐H, Fixed, 95% CI) | 3.90 [1.36, 11.21] |
| 6.1 short‐ term follow‐up (median length up to 5 years) | 4 | 2605 | Risk Ratio (M‐H, Fixed, 95% CI) | 2.45 [0.71, 8.49] |
| 6.2 long‐ term follow‐up (median length 10 years) | 1 | 727 | Risk Ratio (M‐H, Fixed, 95% CI) | 7.84 [1.04, 59.29] |
| Outcome or subgroup title | No. of studies | No. of participants | Statistical method | Effect size |
| 1 Secondary amenorrhoea Show forest plot | 1 | 106 | Risk Ratio (M‐H, Fixed, 95% CI) | 1.37 [0.83, 2.26] |
| Outcome or subgroup title | No. of studies | No. of participants | Statistical method | Effect size |
| 1 Anaemia Show forest plot | 3 | 2425 | Risk Ratio (M‐H, Fixed, 95% CI) | 10.67 [7.14, 15.93] |
| Outcome or subgroup title | No. of studies | No. of participants | Statistical method | Effect size |
| 1 Infection Show forest plot | 3 | 2425 | Risk Ratio (M‐H, Fixed, 95% CI) | 3.73 [2.58, 5.38] |
| Outcome or subgroup title | No. of studies | No. of participants | Statistical method | Effect size |
| 1 Neutropenia Show forest plot | 2 | 519 | Risk Ratio (M‐H, Fixed, 95% CI) | 1.80 [1.52, 2.13] |
| Outcome or subgroup title | No. of studies | No. of participants | Statistical method | Effect size |
| 1 Thrombocytopenia Show forest plot | 3 | 2425 | Risk Ratio (M‐H, Fixed, 95% CI) | 18.12 [11.77, 27.92] |
| Outcome or subgroup title | No. of studies | No. of participants | Statistical method | Effect size |
| 1 Alopecia Show forest plot | 3 | 2425 | Risk Ratio (M‐H, Fixed, 95% CI) | 1.98 [1.78, 2.21] |
| Outcome or subgroup title | No. of studies | No. of participants | Statistical method | Effect size |
| 1 Constipation Show forest plot | 2 | 923 | Risk Ratio (M‐H, Fixed, 95% CI) | 1.19 [0.56, 2.55] |
| Outcome or subgroup title | No. of studies | No. of participants | Statistical method | Effect size |
| 1 Mucositis Show forest plot | 3 | 2425 | Risk Ratio (M‐H, Fixed, 95% CI) | 8.04 [3.72, 17.38] |
| Outcome or subgroup title | No. of studies | No. of participants | Statistical method | Effect size |
| 1 Nausea/vomiting Show forest plot | 3 | 2425 | Risk Ratio (M‐H, Fixed, 95% CI) | 0.83 [0.68, 1.01] |
| Outcome or subgroup title | No. of studies | No. of participants | Statistical method | Effect size |
| 1 Neurologic Show forest plot | 3 | 2425 | Risk Ratio (M‐H, Fixed, 95% CI) | 2.04 [1.19, 3.50] |
| Outcome or subgroup title | No. of studies | No. of participants | Statistical method | Effect size |
| 1 Pain Show forest plot | 3 | 2425 | Risk Ratio (M‐H, Fixed, 95% CI) | 2.62 [1.76, 3.90] |
| Outcome or subgroup title | No. of studies | No. of participants | Statistical method | Effect size |
| 1 Respiratory Show forest plot | 3 | 2549 | Risk Ratio (M‐H, Fixed, 95% CI) | 1.80 [1.01, 3.20] |
| Outcome or subgroup title | No. of studies | No. of participants | Statistical method | Effect size |
| 1 Skin Show forest plot | 2 | 2227 | Risk Ratio (M‐H, Fixed, 95% CI) | 1.02 [0.45, 2.34] |
| Outcome or subgroup title | No. of studies | No. of participants | Statistical method | Effect size |
| 1 heart Show forest plot | 2 | 1823 | Risk Ratio (M‐H, Fixed, 95% CI) | 1.04 [0.21, 5.10] |
| Outcome or subgroup title | No. of studies | No. of participants | Statistical method | Effect size |
| 1 Freedom from first progression Show forest plot | 1 | 331 | Hazard Ratio (Fixed, 95% CI) | 0.46 [0.27, 0.78] |
| Outcome or subgroup title | No. of studies | No. of participants | Statistical method | Effect size |
| 1 CR Show forest plot | 5 | 3427 | Risk Ratio (M‐H, Fixed, 95% CI) | 1.03 [1.01, 1.06] |