Comparaison de la chimiothérapie incluant un régime croissant de BEACOPP à la chimiothérapie incluant un régime de ABVD chez les patients atteints de lymphome de Hodgkin au stade précoce défavorable ou avancé
Appendices
Appendix 1. MEDLINE search strategy
-
Lymphoma/
-
exp Hodgkin Disease/
-
Germinoblastom$.tw,kf,ot.
-
Reticulolymphosarcom$.tw,kf,ot.
-
Hodgkin$.tw,kf,ot.
-
(malignan$ adj2 (lymphogranulom$ or granulom$)).tw,kf,ot.
-
or/1‐6
-
beacopp$.tw,kf,ot,nm.
-
beacopp protocol.nm.
-
or/8‐9
-
Doxorubicin/ or (doxorubi?in$ or adriamycin$).tw,kf,ot,nm.
-
Bleomycin/ or bleomy?in$.tw,kf,ot,nm.
-
Etoposide/ or etoposid$.tw,kf,ot,nm.
-
Cyclophosphamide/ or (cyclophosphamid$ or cyclofosfamid$).tw,kf,ot,nm.
-
Procarbazine/ or procarba##n$.tw,kf,ot,nm.
-
Vincristine/ or (vincristin$ or onocovin$).tw,kf,ot,nm.
-
Prednisone/ or predniso$.tw,kf,ot,nm.
-
and/11‐17
-
10 or 18
-
7 and 19
Appendix 2. EMBASE search strategy
-
Lymphoma/
-
exp Hodgkin Disease/
-
Germinoblastom$.tw.
-
Reticulolymphosarcom$.tw.
-
Hodgkin$.tw.
-
(malignan$ adj2 (lymphogranulom$ or granulom$)).tw.
-
or/1‐6
-
beacopp$.tw.
-
beacopp protocol$.tw.
-
or/8‐9
-
Doxorubicin/ or (doxorubi?in$ or adriamycin$).tw.
-
Bleomycin/ or bleomy?in$.tw.
-
Etoposide/ or etoposid$.tw.
-
Cyclophosphamide/ or (cyclophosphamid$ or cyclofosfamid$).tw.
-
Procarbazine/ or procarba##n$.tw.
-
Vincristine/ or (vincristin$ or onocovin$).tw.
-
Prednisone/ or predniso$.tw.
-
and/11‐17
-
10 or 18
-
7 and 19
Appendix 3. CENTRAL search strategy
-
MeSH descriptor Lymphoma explode all trees
-
MeSH descriptor Hodgkin Disease explode all trees
-
Germinoblastom* in All Text
-
Reticulolymphosarcom* in All Text
-
Hodgkin* in All Text
-
(malignan* in All Text near/2 lymphogranulom* in All Text)
-
(malignan* in All Text near/2 granulom* in All Text)
-
(#1 or #2 or #3 or #4 or #5 or #6 or #7)
-
MeSH descriptor Doxorubicin explode all trees
-
(doxorubi*in* in All Text or adriamycin* in All Text)
-
MeSH descriptor Bleomycin explode all trees
-
bleomy*in* in All Text
-
MeSH descriptor Etoposide explode all trees
-
etoposid* in All Text
-
MeSH descriptor Cyclophosphamide explode all trees
-
(cyclophosphamid* in All Text or cyclofosfamid* in All Text)
-
MeSH descriptor Vincristine explode all trees
-
(vincristin* in All Text or onocovin* in All Text)
-
MeSH descriptor Procarbazine explode all trees
-
procarba* in All Text
-
MeSH descriptor Prednisone explode all trees
-
predniso* in All Text
-
(#9 or #10)
-
(#11 or #12)
-
(#13 or #14)
-
(#15 or #16)
-
(#17 or #18)
-
(#19 or #20)
-
(#21 or #22)
-
(#23 and #24 and #25 and #26 and #27 and #28 and #29)
-
beacopp* in All Text
-
(#30 or #31)
-
(#8 and #32)
Appendix 4. MEDLINE updated search strategy
-
MeSH descriptor Lymphoma explode all trees
-
MeSH descriptor Hodgkin Disease explode all trees
-
Germinoblastom*
-
Reticulolymphosarcom*
-
Hodgkin*
-
(malignan* NEAR/2 lymphogranulom*) or (malignan* NEAR/2 granulom*)
-
(#1 OR #2 OR #3 OR #4 OR #5 OR #6)
-
beacopp*
-
beacopp protocol*
-
(#8 OR #9)
-
MeSH descriptor Doxorubicin explode all trees
-
doxorubi*in*
-
(adriamycin* or adriablastin*)
-
hydroxydaunorubincin*
-
(doxo cell or doxo‐cell or dox sl or dox‐sl)
-
(doxotec* or doxolem* or doxil*)
-
(rubex* or ribodox* or onkodox*)
-
(myeocet* or caelyx*)
-
Farmiblastin*
-
(#11 OR #12 OR #13 OR #14 OR #15 OR #16 OR #17 OR #18 OR #19)
-
MeSH descriptor Bleomycin explode all trees
-
bleomy*in*
-
bleomicin*
-
(blenoxan* or blanoxan* or bleolem*)
-
(bleo cell or bleocell)
-
(#21 OR #22 OR #23 OR #24 OR #25)
-
MeSH descriptor Etoposide explode all trees
-
etoposid*
-
(eposid* or etomedac* or etopophos* or eposin* or etopos*)
-
(eto‐gry or exitop* or lastet* or toposar* or celltop*)
-
(vepesid* or onkoposid* or riboposid*)
-
(#27 OR #28 OR #29 OR #30 OR #31)
-
MeSH descriptor Cyclophosphamide explode all trees
-
(cyclophosphamid* or cyclofosfamid* or ciclofosfamid* or cytophosphan* or cyclophosphan*)
-
(cyclophosphamid* or cyclofosfamid* or ciclofosfamid* or cytophosphan* or cyclophosphan* or citofosfan*)
-
(b‐518 or b518)
-
(cytoxan* or citoxan* or endoxan* or sendoxan* or procytox* or genuxal*)
-
(neosar* or revimmune*)#
-
(#33 OR #34 OR #35 OR #36 OR #37 OR #38)
-
MeSH descriptor Procarbazine explode all trees
-
procarba*
-
(matulan* or natulan* or indicarb*)
-
(#40 OR #41 OR #42)
-
MeSH descriptor Vincristine explode all trees
-
(vincristin* or vintec* or vincrisul* or vincasar*)
-
(oncovin* or onkocristin* or cellcristin* or citom*d* or farmistin* or leurocristin*)
-
(#44 OR #45 OR #46)
-
MeSH descriptor Prednisone explode all trees
-
predniso*
-
(winpred* ) or (sterapred* ) or (prednidib*) or (predniment* pronisone*)
-
(cartancyl* or cortan* or kortancyl* or encorton* or enkortolon* or decortisyl* orrectodelt*)
-
(panafcort* or panasol* or meticorten* or dacortin* or orason* or cutason*)
-
(#48 OR #49 OR #50 OR #51 OR #52)
-
(#20 AND #26 AND #32 AND #39 AND #43 AND #47 AND #53)
-
(#10 OR #54)
-
(#7 AND #55)
-
(#56), from 2008 to 2010
Appendix 5. CENTRAL updated search strategy
-
Lymphoma/
-
exp Hodgkin Disease/
-
Germinoblastom$.tw,kf,ot.
-
Reticulolymphosarcom$.tw,kf,ot.
-
Hodgkin$.tw,kf,ot.
-
(malignan$ adj2 (lymphogranulom$ or granulom$)).tw,kf,ot.
-
or/1‐6
-
beacopp$.tw,kf,ot,nm.
-
beacopp protocol.nm.
-
or/8‐9
-
exp Doxorubicin/
-
doxorubi?in$.tw,kf,ot,nm.
-
(adriamycin$ or adriablastin$).tw,kf,ot.
-
hydroxydaunorubincin$.tw,kf,ot.
-
(doxo cell or doxo‐cell or dox sl or dox‐sl).tw,kf,ot.
-
(doxotec$ or doxolem$ or doxil$).tw,kf,ot.
-
(rubex$ or ribodox$ or onkodox$).tw,kf,ot.
-
(myeocet$ or caelyx$).tw,kf,ot.
-
Farmiblastin$.tw,kf,ot.
-
or/11‐19
-
exp Bleomycin/
-
bleomy?in$.tw,kf,ot,nm.
-
bleomicin$.tw,kf,ot.
-
(blenoxan$ or blanoxan$ or bleolem$).tw,kf,ot.
-
(bleo cell or bleocell).tw,kf,ot.
-
or/21‐25
-
Etoposide/
-
etoposid$.tw,kf,ot,nm.
-
(eposid$ or etomedac$ or etopophos$ or eposin$ or etopos).tw,kf,ot.
-
(eto‐gry or exitop$ or lastet$ or toposar$ or celltop$).tw,kf,ot.
-
(vepesid$ or onkoposid$ or riboposid$).tw,kf,ot.
-
or/27‐31
-
exp Cyclophosphamide/
-
(cyclophosphamid$ or cyclofosfamid$ or ciclofosfamid$ or cytophosphan$ or cyclophosphan$).tw,kf,ot,nm.
-
(cyclophosphamid$ or cyclofosfamid$ or ciclofosfamid$ or cytophosphan$ or cyclophosphan$ or citofosfan$).tw,kf,ot,nm.
-
(b‐518 or b518).tw,kf,ot,nm.
-
(cytoxan$ or citoxan$ or endoxan$ or sendoxan$ or procytox$ or genuxal$).tw,kf,ot.
-
(neosar$ or revimmune$).tw,kf,ot.
-
or/33‐38
-
Procarbazine/
-
procarba##n$.tw,kf,ot,nm.
-
(matulan$ or natulan$ or indicarb$).tw,kf,ot.
-
or/40‐42
-
Vincristine/
-
(vincristin$ or vintec$ or vincrisul$ or vincasar$).tw,kf,ot,nm.
-
(oncovin$ or onkocristin$).tw,kf,ot.
-
(cellcristin$ or citom#d$ or farmistin$ or leurocristin$).tw,kf,ot.
-
or/44‐47
-
Prednisone/
-
predniso$.tw,kf,ot,nm.
-
(winpred$ or sterapred$ or prednidib$ or predniment$ pronisone$).tw,kf,ot.
-
(cartancyl$ or cortan$ or kortancyl$ or encorton$ or enkortolon$ or decortisyl$ orrectodelt$).tw,kf,ot.
-
(panafcort$ or panasol$ or meticorten$ or dacortin$ or orason$ or cutason$).tw,kf,ot.
-
or/49‐53
-
20 and 26 and 32 and 39 and 43 and 48 and 54
-
10 or 55
-
56 and 7
-
limit 57 to ed=20081128‐20100407
-
from 58 keep 1‐25

Study flow diagram.

Forest plot of comparison: 1 Analysis of Overall Survival, outcome: 1.1 OS ‐ all ‐ same recruitment period between the 2 arms (HD9).

Forest plot of comparison: 2 Analysis of Progression Free Survival, outcome: 2.1 PFS ‐ all ‐ same recruitment period between the 2 arms (HD9).
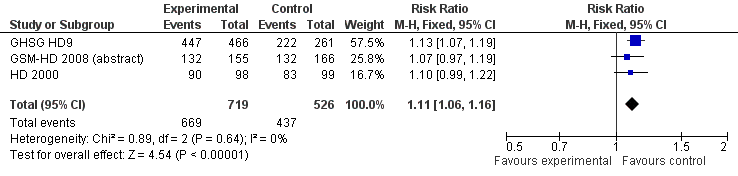
Forest plot of comparison: 3 Analysis of complete response (CR) rate, outcome: 3.1 CR.

Comparison 1 Analysis overall survival, Outcome 1 OS ‐ all ‐ same recruitment period between the 2 arms (HD9).

Comparison 1 Analysis overall survival, Outcome 2 OS subgrouped by stage of disease.
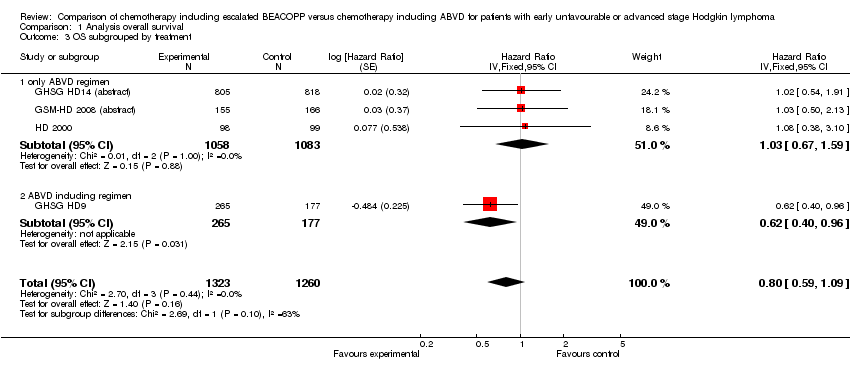
Comparison 1 Analysis overall survival, Outcome 3 OS subgrouped by treatment.

Comparison 1 Analysis overall survival, Outcome 4 OS subgrouped by number of cycles of escalated BEACOPP.

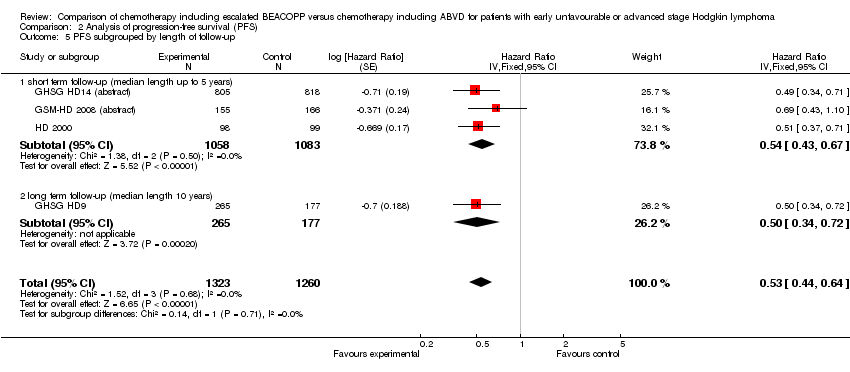
Comparison 1 Analysis overall survival, Outcome 5 OS subgrouped by length of follow‐up.
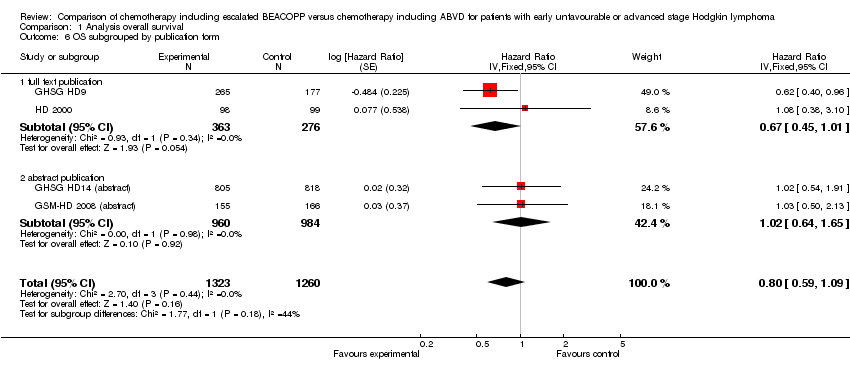
Comparison 1 Analysis overall survival, Outcome 6 OS subgrouped by publication form.

Comparison 1 Analysis overall survival, Outcome 7 OS subgrouped by type of results.

Comparison 1 Analysis overall survival, Outcome 8 OS ‐ all recruited patients (HD9) with potential risk of bias due to different time periods of recruitment.

Comparison 2 Analysis of progression‐free survival (PFS), Outcome 1 PFS ‐ all ‐ same recruitment period between the 2 arms (HD9).

Comparison 2 Analysis of progression‐free survival (PFS), Outcome 2 PFS subgrouped by stage of disease.

Comparison 2 Analysis of progression‐free survival (PFS), Outcome 3 PFS subgrouped by treatment.

Comparison 2 Analysis of progression‐free survival (PFS), Outcome 4 PFS subgrouped by number of cycles of escalated BEACOPP.
Comparison 2 Analysis of progression‐free survival (PFS), Outcome 5 PFS subgrouped by length of follow‐up.
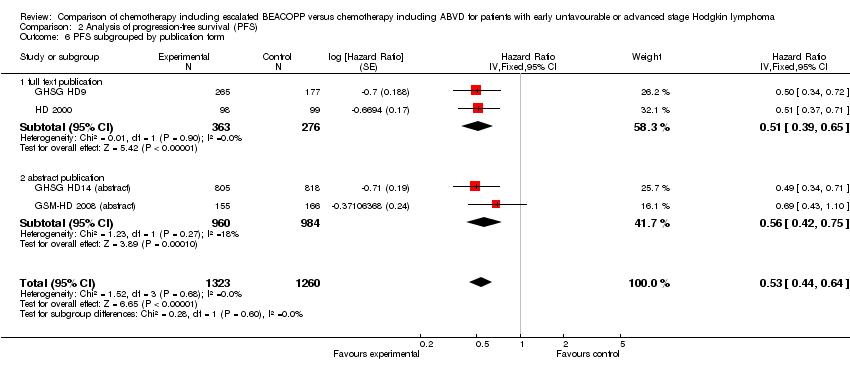
Comparison 2 Analysis of progression‐free survival (PFS), Outcome 6 PFS subgrouped by publication form.
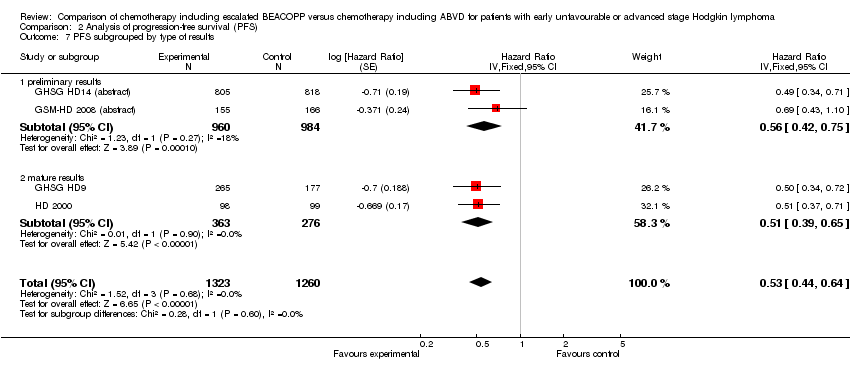
Comparison 2 Analysis of progression‐free survival (PFS), Outcome 7 PFS subgrouped by type of results.
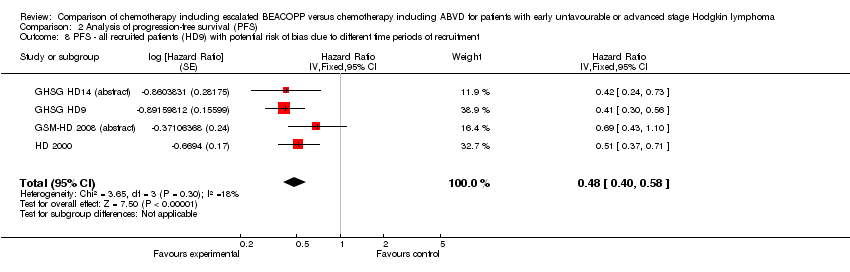
Comparison 2 Analysis of progression‐free survival (PFS), Outcome 8 PFS ‐ all recruited patients (HD9) with potential risk of bias due to different time periods of recruitment.

Comparison 3 Analysis of complete response (CR) rate, Outcome 1 CR.

Comparison 3 Analysis of complete response (CR) rate, Outcome 2 CR subgrouped by treatment.

Comparison 3 Analysis of complete response (CR) rate, Outcome 3 CR subgrouped by number of cycles of escalated BEACOPP.
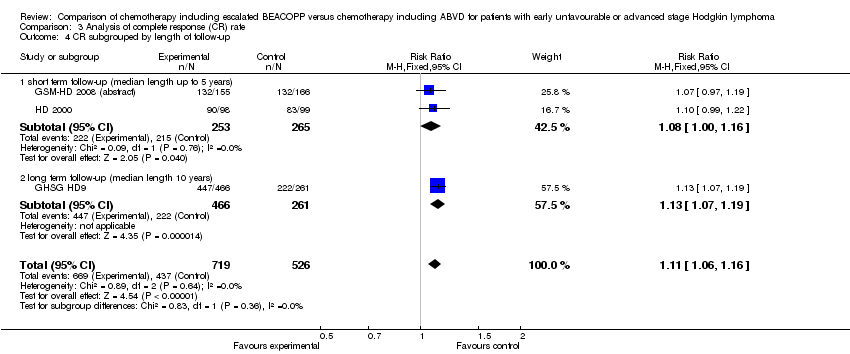
Comparison 3 Analysis of complete response (CR) rate, Outcome 4 CR subgrouped by length of follow‐up.

Comparison 3 Analysis of complete response (CR) rate, Outcome 5 CR subgrouped by publication form.

Comparison 4 Analysis of freedom from first progression, Outcome 1 Freedom from first progression.
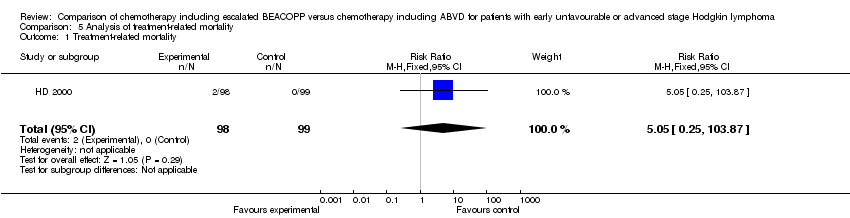
Comparison 5 Analysis of treatment‐related mortality, Outcome 1 Treatment‐related mortality.

Comparison 6 Analysis of secondary malignancies, Outcome 1 Secondary malignancies.

Comparison 6 Analysis of secondary malignancies, Outcome 2 Secondary malignancies subgrouped by stage of disease.
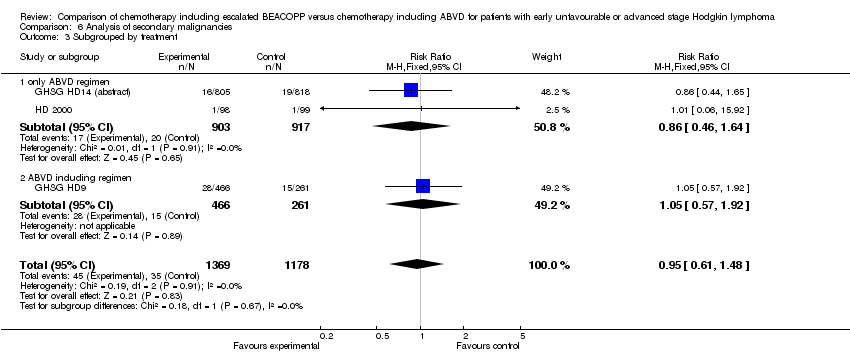
Comparison 6 Analysis of secondary malignancies, Outcome 3 Subgrouped by treatment.

Comparison 6 Analysis of secondary malignancies, Outcome 4 Subgrouped by number of cycles of escalated BEACOPP.

Comparison 6 Analysis of secondary malignancies, Outcome 5 Subgrouped by length of follow‐up.
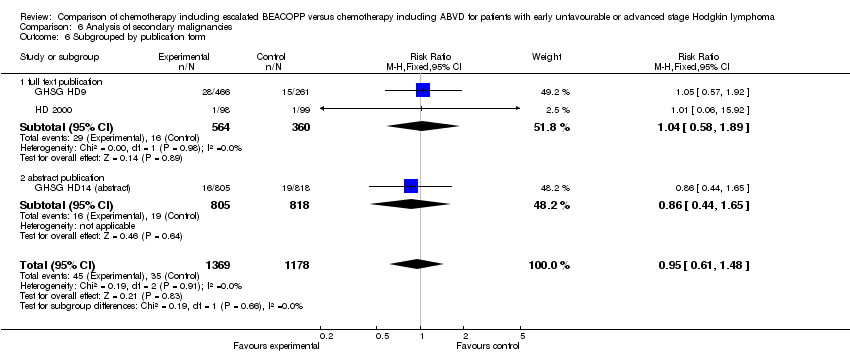
Comparison 6 Analysis of secondary malignancies, Outcome 6 Subgrouped by publication form.

Comparison 6 Analysis of secondary malignancies, Outcome 7 Subgrouped by type of results.
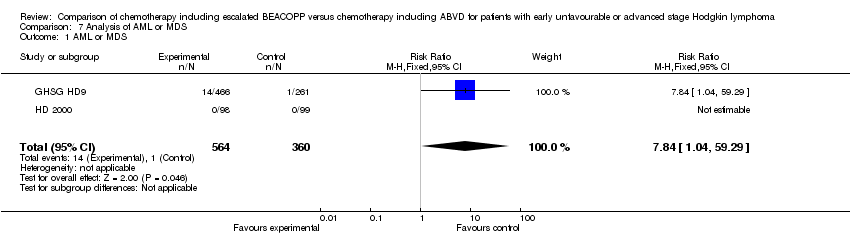
Comparison 7 Analysis of AML or MDS, Outcome 1 AML or MDS.

Comparison 8 Analysis of fertility, Outcome 1 Secondary amenorrhoea.

Comparison 9 Analysis of anaemia, Outcome 1 Anaemia.
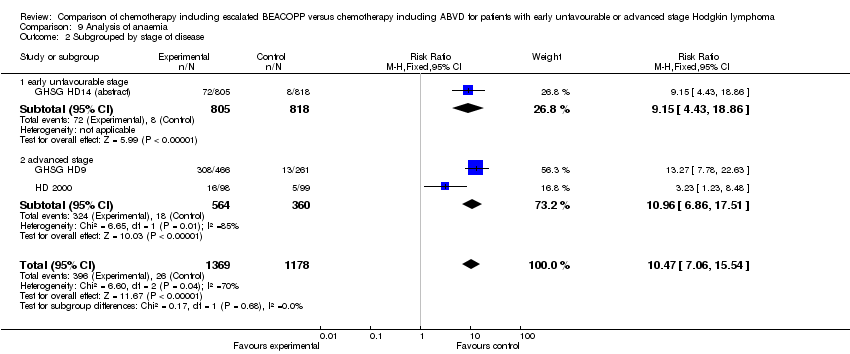
Comparison 9 Analysis of anaemia, Outcome 2 Subgrouped by stage of disease.
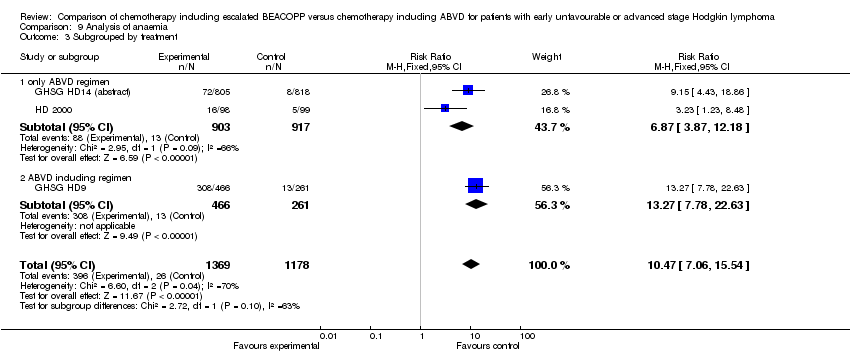
Comparison 9 Analysis of anaemia, Outcome 3 Subgrouped by treatment.

Comparison 9 Analysis of anaemia, Outcome 4 Subgrouped by number of cycles of escalated BEACOPP.
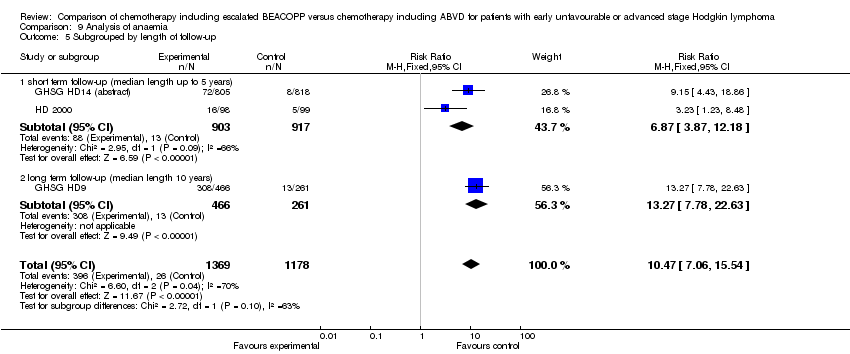
Comparison 9 Analysis of anaemia, Outcome 5 Subgrouped by length of follow‐up.

Comparison 9 Analysis of anaemia, Outcome 6 Subgrouped by publication form.

Comparison 9 Analysis of anaemia, Outcome 7 Subgrouped by type of results.

Comparison 10 Analysis of infection, Outcome 1 Infection.

Comparison 10 Analysis of infection, Outcome 2 Subgrouped by stage of disease.

Comparison 10 Analysis of infection, Outcome 3 Subgrouped by treatment.
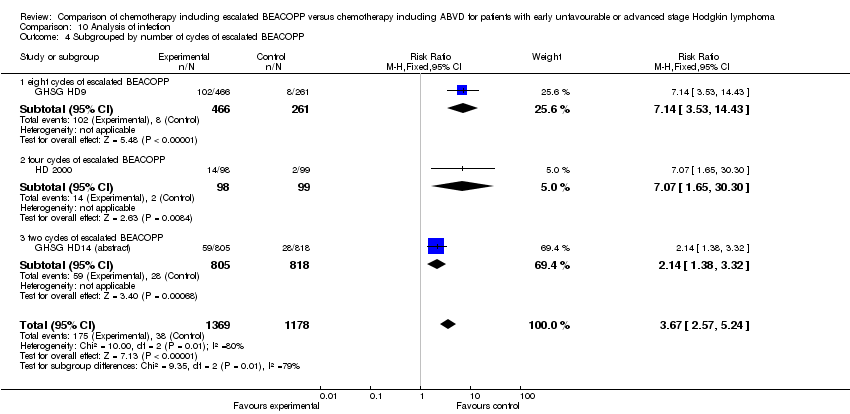
Comparison 10 Analysis of infection, Outcome 4 Subgrouped by number of cycles of escalated BEACOPP.
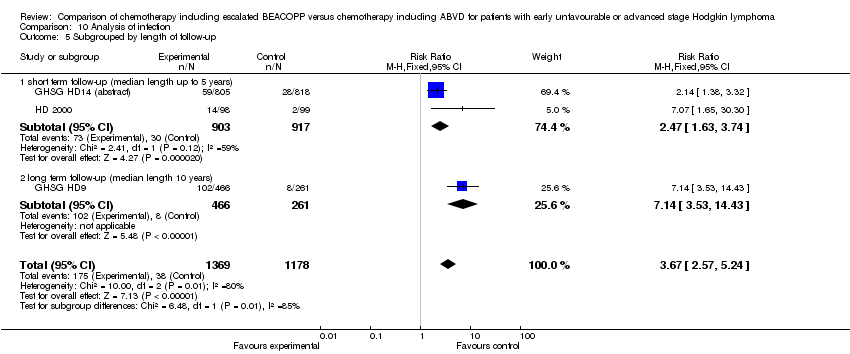
Comparison 10 Analysis of infection, Outcome 5 Subgrouped by length of follow‐up.
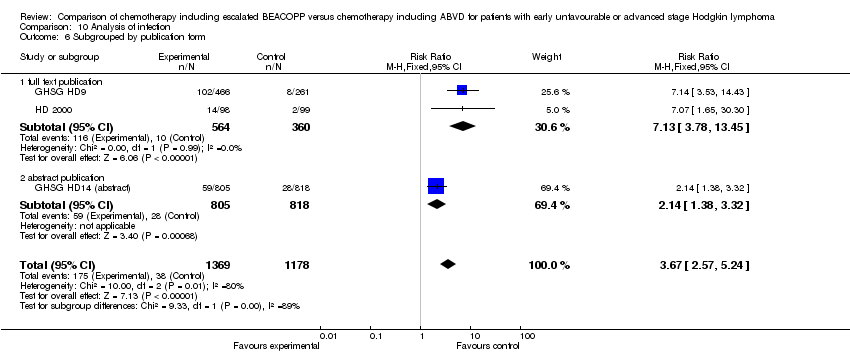
Comparison 10 Analysis of infection, Outcome 6 Subgrouped by publication form.
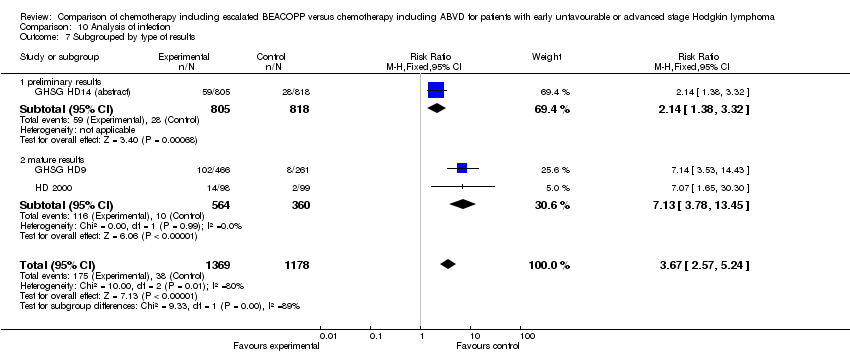
Comparison 10 Analysis of infection, Outcome 7 Subgrouped by type of results.
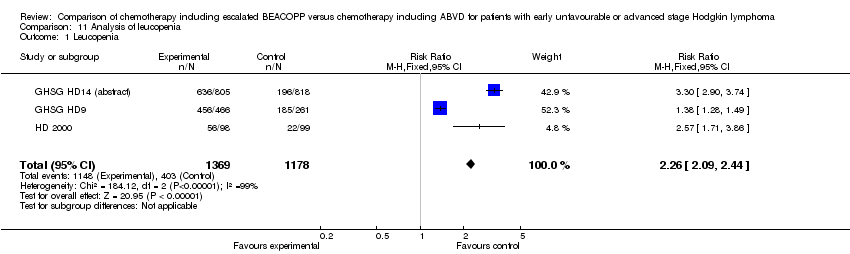
Comparison 11 Analysis of leucopenia, Outcome 1 Leucopenia.
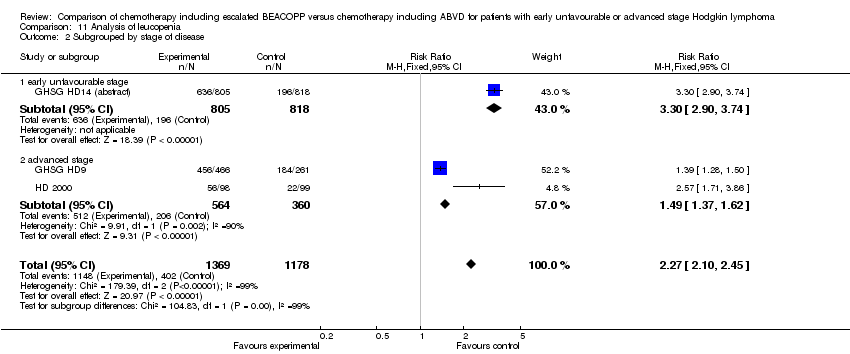
Comparison 11 Analysis of leucopenia, Outcome 2 Subgrouped by stage of disease.

Comparison 11 Analysis of leucopenia, Outcome 3 Subgrouped by treatment.

Comparison 11 Analysis of leucopenia, Outcome 4 Subgrouped by number of cycles of escalated BEACOPP.
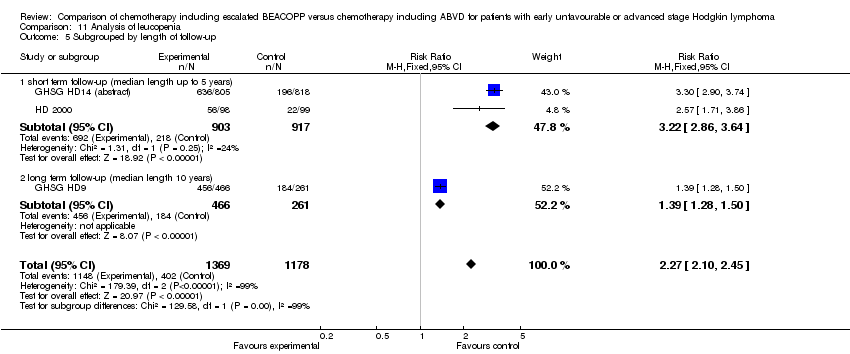
Comparison 11 Analysis of leucopenia, Outcome 5 Subgrouped by length of follow‐up.
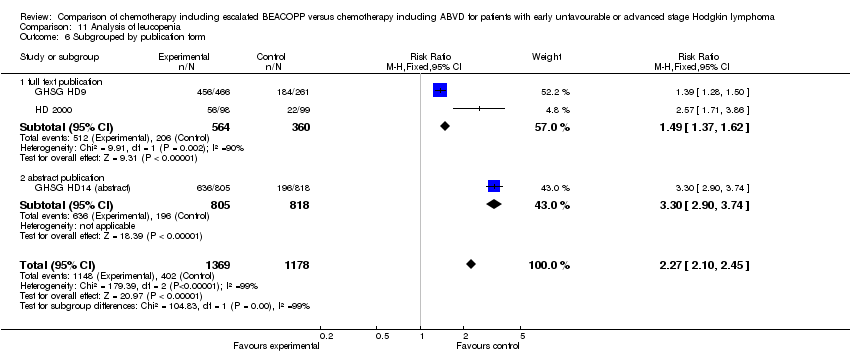
Comparison 11 Analysis of leucopenia, Outcome 6 Subgrouped by publication form.

Comparison 11 Analysis of leucopenia, Outcome 7 Subgrouped by type of results.

Comparison 12 Analysis of neutropenia, Outcome 1 Neutropenia.

Comparison 13 Analysis of thrombocytopenia, Outcome 1 Thrombocytopenia.
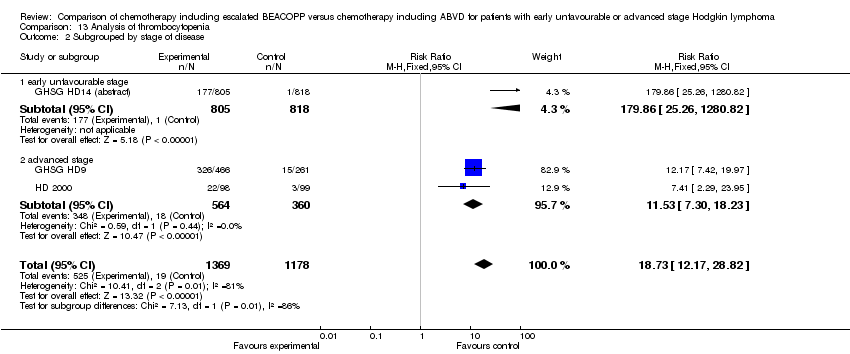
Comparison 13 Analysis of thrombocytopenia, Outcome 2 Subgrouped by stage of disease.

Comparison 13 Analysis of thrombocytopenia, Outcome 3 Subgrouped by treatment.

Comparison 13 Analysis of thrombocytopenia, Outcome 4 Subgrouped by number of cycles of escalated BEACOPP.

Comparison 13 Analysis of thrombocytopenia, Outcome 5 Subgrouped by length of follow‐up.

Comparison 13 Analysis of thrombocytopenia, Outcome 6 Subgrouped by publication form.

Comparison 13 Analysis of thrombocytopenia, Outcome 7 Subgrouped by type of results.
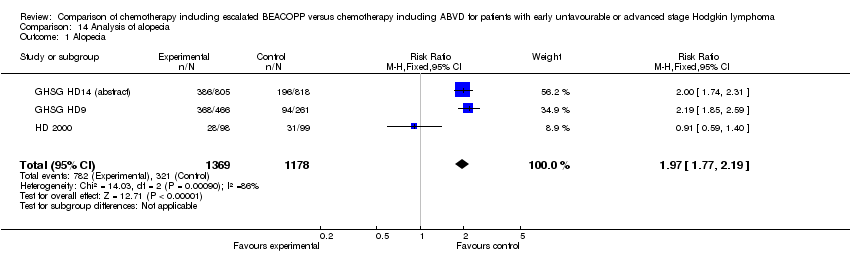
Comparison 14 Analysis of alopecia, Outcome 1 Alopecia.
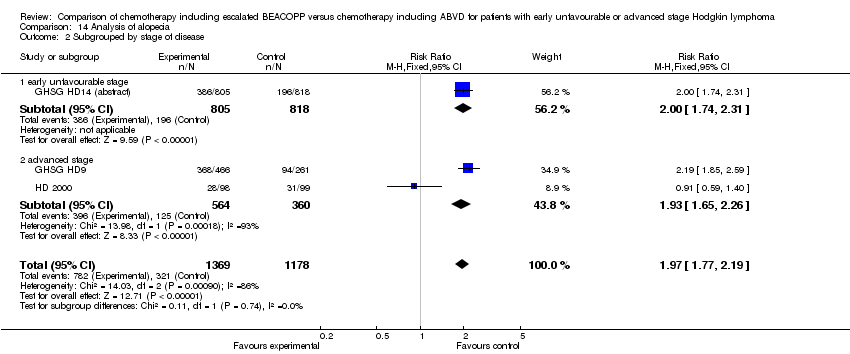
Comparison 14 Analysis of alopecia, Outcome 2 Subgrouped by stage of disease.
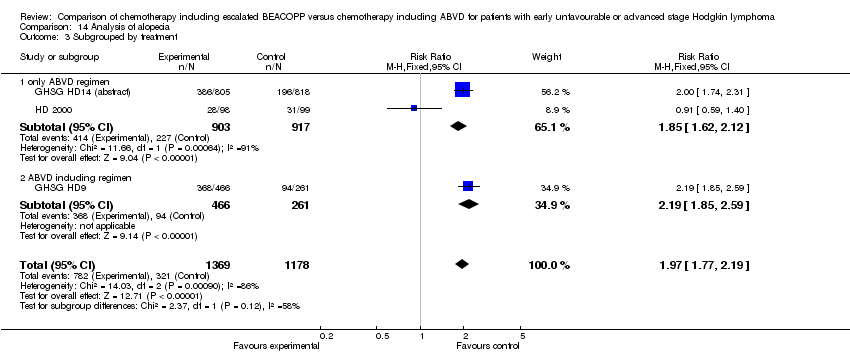
Comparison 14 Analysis of alopecia, Outcome 3 Subgrouped by treatment.

Comparison 14 Analysis of alopecia, Outcome 4 Subgrouped by number of cycles of escalated BEACOPP.

Comparison 14 Analysis of alopecia, Outcome 5 Subgrouped by length of follow‐up.
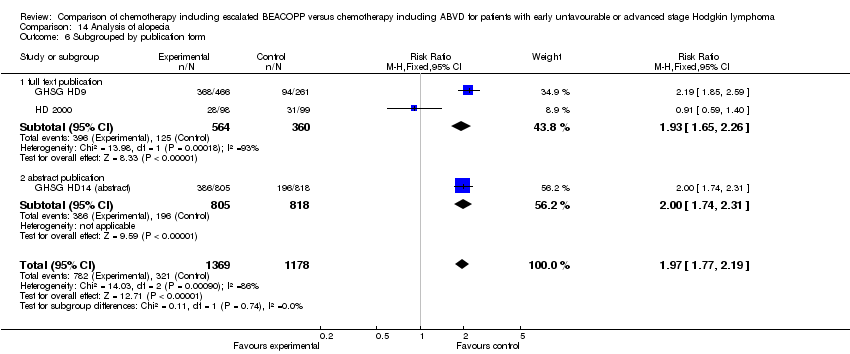
Comparison 14 Analysis of alopecia, Outcome 6 Subgrouped by publication form.

Comparison 14 Analysis of alopecia, Outcome 7 Subgrouped by type of results.

Comparison 15 Analysis of constipation, Outcome 1 Constipation.
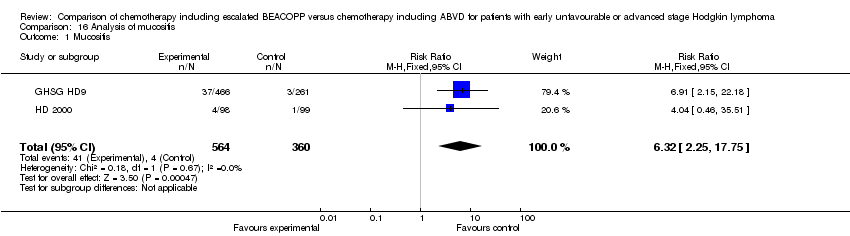
Comparison 16 Analysis of mucositis, Outcome 1 Mucositis.

Comparison 17 Analysis of nausea/vomiting, Outcome 1 Nausea/vomiting.

Comparison 18 Analysis of neurologic, Outcome 1 Neurologic.
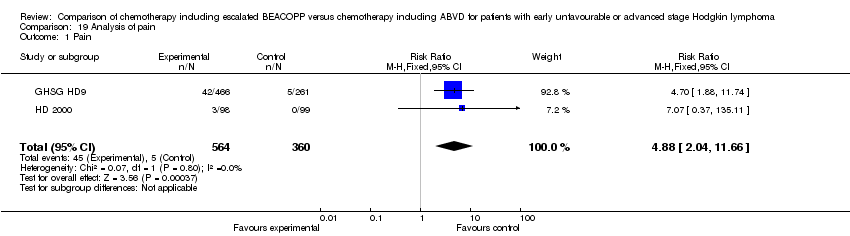
Comparison 19 Analysis of pain, Outcome 1 Pain.
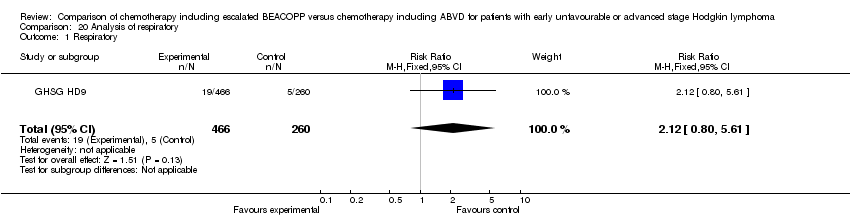
Comparison 20 Analysis of respiratory, Outcome 1 Respiratory.

Comparison 21 Analysis of skin, Outcome 1 Skin.
| Chemotherapy including escalated BEACOPP compared with chemotherapy including ABVD for patients with early unfavourable or advanced stage Hodgkin lymphoma | ||||||
| Patient or population: patients with early unfavourable or advanced stage Hodgkin lymphoma Intervention: chemotherapy including escalated BEACOPP Comparison: chemotherapy including ABVD | ||||||
| Outcomes | Illustrative comparative risks* (95% CI) | Relative effect | No of Participants | Quality of the evidence | Comments | |
| Assumed risk | Corresponding risk | |||||
| ABVD | escalated BEACOPP | |||||
| OS | Low risk population1 | HR 0.80 [0.59 to 1.09] | 2586 | +++O | ||
| 100 deaths per 1000 | 81 per 1000 | |||||
| High risk population2 | ||||||
| 250 deaths per 1000 | 206 per 1000 | |||||
| PFS | Low risk population3 | HR 0.53 [0.44 to 0.64] | 2586 | +++O | ||
| 100 progressions or relapses per 1000 | 54 per 1000 | |||||
| High risk population2 | ||||||
| 330 progressions or relapses per 1000 | 191 per 1000 | |||||
| CR rate | High risk population2 | RR 1.11 [1.06 to 1.16] | 1245 | ++++ | ||
| 831 complete responses per 1000 | 922 per 1000 | |||||
| Adverse events WHO grade III or IV | See comment | See comment | See comment | 2547 | +++O6 | Escalated BEACOPP regimens cause more haematological toxicities, infections, alopecia, mucositis and pain. No differences were found for constipation, nausea, neurologic toxicity. |
| Incidence of secondary malignancies | Low risk population2 | RR 0.95 (0.61 to 1.48) | 2547 | ++OO | As most of the trials had a median observation of less than 10 years, sufficient long term information on secondary malignancies cannot be expected. | |
| 2 per 1000 | 2 per 1000 (2 to 2) | |||||
| High risk population2 | ||||||
| 44 per 1000 | 42 per 1000 | |||||
| Incidence of infertility | 375 per 1000 | 514 per 1000 (311 to 847) | RR 1.37 [0.83 to 2.26] | 106 | +OOO | The subset of only 106 out of 608 eligible women of the HD9 were available for analyses regarding infertility. Reasons for availability are unknown and might have introduced bias in the results. |
| Treatment related mortality | See comment | See comment | RR 5.05 (0.25 to 103.87) | 197 | +OOO | No participant died in the control group and 2 died in the intervention group of the only study that reported this outcome. |
| *The basis for the assumed risk (e.g. the median control group risk across studies) is provided in footnotes. The corresponding risk (and its 95% confidence interval) is based on the assumed risk in the comparison group and the relative effect of the intervention (and its 95% CI). | ||||||
| GRADE Working Group grades of evidence | ||||||
| 1The risk for the "low risk population" (i.e. patients with early unfavourable HL) was taken from the GHSG HD8 trial, because the HD14 trial did not provide sufficient information regarding the control risk. 2The risk for the "high risk population" (i.e. patients with advanced stage of HL) was approximately the risk of the GHSG HD9 trial. 3The risk for the "low risk population" (i.e. patients with early unfavourable HL) was taken from the GHSG HD14 trial. 4 The median follow‐up varied between the trials. Longer follow‐ups and the inclusion of the EORTC 20012 trial will lead to a more precise estimate of the effect. This uncertainty causes the downgrading here. 5The definition of how to assess progression of disease varied between the trials. These heterogeneous definitions lead to an imprecise estimate of the effect that causes the downgrading here. 6So far two of the four trials reported results regarding adverse effects. The inclusion of further trials might lead to a more precise estimate of the effect. This uncertainty causes the downgrading here. 7 So far two of the four trials reported results regarding secondary malignancies. Furthermore, as most of the trials had a median observation of less than 10 years, sufficient long term information on secondary malignancies cannot be expected. The inclusion of further trials and results of longer follow‐up might lead to a more precise estimate of the effect. This uncertainty causes the downgrading here. 8 So far only 106 patients of the HD9 were analysed regarding infertility. The inclusion of further trials will lead to a more precise estimate of the effect.This uncertainty causes the downgrading here. 9 So far one of the four trials reported results regarding treatment‐related mortality. The inclusion of further trials will lead to a more precise estimate of the effect.This uncertainty causes the downgrading here. | ||||||
| Outcome or subgroup title | No. of studies | No. of participants | Statistical method | Effect size |
| 1 OS ‐ all ‐ same recruitment period between the 2 arms (HD9) Show forest plot | 4 | 2583 | Hazard Ratio (Fixed, 95% CI) | 0.80 [0.59, 1.09] |
| 2 OS subgrouped by stage of disease Show forest plot | 4 | 2583 | Hazard Ratio (Fixed, 95% CI) | 0.80 [0.59, 1.09] |
| 2.1 early unfavourable stage | 1 | 1623 | Hazard Ratio (Fixed, 95% CI) | 1.02 [0.54, 1.91] |
| 2.2 advanced stage | 3 | 960 | Hazard Ratio (Fixed, 95% CI) | 0.74 [0.52, 1.06] |
| 3 OS subgrouped by treatment Show forest plot | 4 | 2583 | Hazard Ratio (Fixed, 95% CI) | 0.80 [0.59, 1.09] |
| 3.1 only ABVD regimen | 3 | 2141 | Hazard Ratio (Fixed, 95% CI) | 1.03 [0.67, 1.59] |
| 3.2 ABVD including regimen | 1 | 442 | Hazard Ratio (Fixed, 95% CI) | 0.62 [0.40, 0.96] |
| 4 OS subgrouped by number of cycles of escalated BEACOPP Show forest plot | 4 | 2583 | Hazard Ratio (Fixed, 95% CI) | 0.80 [0.59, 1.09] |
| 4.1 eight cycles of escalated BEACOPP | 1 | 442 | Hazard Ratio (Fixed, 95% CI) | 0.62 [0.40, 0.96] |
| 4.2 four cycles of escalated BEACOPP | 2 | 518 | Hazard Ratio (Fixed, 95% CI) | 1.05 [0.58, 1.90] |
| 4.3 two cycles of escalated BEACOPP | 1 | 1623 | Hazard Ratio (Fixed, 95% CI) | 1.02 [0.54, 1.91] |
| 5 OS subgrouped by length of follow‐up Show forest plot | 4 | 2583 | Hazard Ratio (Fixed, 95% CI) | 0.80 [0.59, 1.09] |
| 5.1 short term follow‐up (median length up to 5 years) | 3 | 2141 | Hazard Ratio (Fixed, 95% CI) | 1.03 [0.67, 1.59] |
| 5.2 long term follow‐up (median length 10 years) | 1 | 442 | Hazard Ratio (Fixed, 95% CI) | 0.62 [0.40, 0.96] |
| 6 OS subgrouped by publication form Show forest plot | 4 | 2583 | Hazard Ratio (Fixed, 95% CI) | 0.80 [0.59, 1.09] |
| 6.1 full text publication | 2 | 639 | Hazard Ratio (Fixed, 95% CI) | 0.67 [0.45, 1.01] |
| 6.2 abstract publication | 2 | 1944 | Hazard Ratio (Fixed, 95% CI) | 1.02 [0.64, 1.65] |
| 7 OS subgrouped by type of results Show forest plot | 4 | 2583 | Hazard Ratio (Fixed, 95% CI) | 0.80 [0.59, 1.09] |
| 7.1 preliminary results | 2 | 1944 | Hazard Ratio (Fixed, 95% CI) | 1.02 [0.64, 1.65] |
| 7.2 mature results | 2 | 639 | Hazard Ratio (Fixed, 95% CI) | 0.67 [0.45, 1.01] |
| 8 OS ‐ all recruited patients (HD9) with potential risk of bias due to different time periods of recruitment Show forest plot | 4 | Hazard Ratio (Fixed, 95% CI) | 0.66 [0.50, 0.88] | |
| Outcome or subgroup title | No. of studies | No. of participants | Statistical method | Effect size |
| 1 PFS ‐ all ‐ same recruitment period between the 2 arms (HD9) Show forest plot | 4 | 2583 | Hazard Ratio (Fixed, 95% CI) | 0.53 [0.44, 0.64] |
| 2 PFS subgrouped by stage of disease Show forest plot | 4 | 2583 | Hazard Ratio (Fixed, 95% CI) | 0.53 [0.44, 0.64] |
| 2.1 early unfavourable stage | 1 | 1623 | Hazard Ratio (Fixed, 95% CI) | 0.49 [0.34, 0.71] |
| 2.2 advanced stage | 3 | 960 | Hazard Ratio (Fixed, 95% CI) | 0.54 [0.43, 0.67] |
| 3 PFS subgrouped by treatment Show forest plot | 4 | 2583 | Hazard Ratio (Fixed, 95% CI) | 0.53 [0.44, 0.64] |
| 3.1 only ABVD regimen | 3 | 2141 | Hazard Ratio (Fixed, 95% CI) | 0.54 [0.43, 0.67] |
| 3.2 ABVD including regimen | 1 | 442 | Hazard Ratio (Fixed, 95% CI) | 0.50 [0.34, 0.72] |
| 4 PFS subgrouped by number of cycles of escalated BEACOPP Show forest plot | 4 | 2583 | Hazard Ratio (Fixed, 95% CI) | 0.53 [0.44, 0.64] |
| 4.1 eight cycles of escalated BEACOPP | 1 | 442 | Hazard Ratio (Fixed, 95% CI) | 0.50 [0.34, 0.72] |
| 4.2 four cycles of escalated BEACOPP | 2 | 518 | Hazard Ratio (Fixed, 95% CI) | 0.57 [0.43, 0.74] |
| 4.3 two cycles of escalated BEACOPP | 1 | 1623 | Hazard Ratio (Fixed, 95% CI) | 0.49 [0.34, 0.71] |
| 5 PFS subgrouped by length of follow‐up Show forest plot | 4 | 2583 | Hazard Ratio (Fixed, 95% CI) | 0.53 [0.44, 0.64] |
| 5.1 short term follow‐up (median length up to 5 years) | 3 | 2141 | Hazard Ratio (Fixed, 95% CI) | 0.54 [0.43, 0.67] |
| 5.2 long term follow‐up (median length 10 years) | 1 | 442 | Hazard Ratio (Fixed, 95% CI) | 0.50 [0.34, 0.72] |
| 6 PFS subgrouped by publication form Show forest plot | 4 | 2583 | Hazard Ratio (Fixed, 95% CI) | 0.53 [0.44, 0.64] |
| 6.1 full text publication | 2 | 639 | Hazard Ratio (Fixed, 95% CI) | 0.51 [0.39, 0.65] |
| 6.2 abstract publication | 2 | 1944 | Hazard Ratio (Fixed, 95% CI) | 0.56 [0.42, 0.75] |
| 7 PFS subgrouped by type of results Show forest plot | 4 | 2583 | Hazard Ratio (Fixed, 95% CI) | 0.53 [0.44, 0.64] |
| 7.1 preliminary results | 2 | 1944 | Hazard Ratio (Fixed, 95% CI) | 0.56 [0.42, 0.75] |
| 7.2 mature results | 2 | 639 | Hazard Ratio (Fixed, 95% CI) | 0.51 [0.39, 0.65] |
| 8 PFS ‐ all recruited patients (HD9) with potential risk of bias due to different time periods of recruitment Show forest plot | 4 | Hazard Ratio (Fixed, 95% CI) | 0.48 [0.40, 0.58] | |
| Outcome or subgroup title | No. of studies | No. of participants | Statistical method | Effect size |
| 1 CR Show forest plot | 3 | 1245 | Risk Ratio (M‐H, Fixed, 95% CI) | 1.11 [1.06, 1.16] |
| 2 CR subgrouped by treatment Show forest plot | 3 | 1245 | Risk Ratio (M‐H, Fixed, 95% CI) | 1.11 [1.06, 1.16] |
| 2.1 only ABVD regimen | 2 | 518 | Risk Ratio (M‐H, Fixed, 95% CI) | 1.08 [1.00, 1.16] |
| 2.2 ABVD including regimen | 1 | 727 | Risk Ratio (M‐H, Fixed, 95% CI) | 1.13 [1.07, 1.19] |
| 3 CR subgrouped by number of cycles of escalated BEACOPP Show forest plot | 3 | 1245 | Risk Ratio (M‐H, Fixed, 95% CI) | 1.11 [1.06, 1.16] |
| 3.1 eight cycles of escalated BEACOPP | 1 | 727 | Risk Ratio (M‐H, Fixed, 95% CI) | 1.13 [1.07, 1.19] |
| 3.2 four cycles of escalated BEACOPP | 2 | 518 | Risk Ratio (M‐H, Fixed, 95% CI) | 1.08 [1.00, 1.16] |
| 4 CR subgrouped by length of follow‐up Show forest plot | 3 | 1245 | Risk Ratio (M‐H, Fixed, 95% CI) | 1.11 [1.06, 1.16] |
| 4.1 short term follow‐up (median length up to 5 years) | 2 | 518 | Risk Ratio (M‐H, Fixed, 95% CI) | 1.08 [1.00, 1.16] |
| 4.2 long term follow‐up (median length 10 years) | 1 | 727 | Risk Ratio (M‐H, Fixed, 95% CI) | 1.13 [1.07, 1.19] |
| 5 CR subgrouped by publication form Show forest plot | 3 | 1245 | Risk Ratio (M‐H, Fixed, 95% CI) | 1.11 [1.06, 1.16] |
| 5.1 full text publication | 2 | 924 | Risk Ratio (M‐H, Fixed, 95% CI) | 1.12 [1.07, 1.18] |
| 5.2 abstract publication | 1 | 321 | Risk Ratio (M‐H, Fixed, 95% CI) | 1.07 [0.97, 1.19] |
| Outcome or subgroup title | No. of studies | No. of participants | Statistical method | Effect size |
| 1 Freedom from first progression Show forest plot | 1 | 321 | Hazard Ratio (Fixed, 95% CI) | 0.51 [0.31, 0.85] |
| Outcome or subgroup title | No. of studies | No. of participants | Statistical method | Effect size |
| 1 Treatment‐related mortality Show forest plot | 1 | 197 | Risk Ratio (M‐H, Fixed, 95% CI) | 5.05 [0.25, 103.87] |
| Outcome or subgroup title | No. of studies | No. of participants | Statistical method | Effect size |
| 1 Secondary malignancies Show forest plot | 3 | 2547 | Risk Ratio (M‐H, Fixed, 95% CI) | 0.95 [0.61, 1.48] |
| 2 Secondary malignancies subgrouped by stage of disease Show forest plot | 3 | 2547 | Risk Ratio (M‐H, Fixed, 95% CI) | 0.95 [0.61, 1.48] |
| 2.1 early unfavourable stage | 1 | 1623 | Risk Ratio (M‐H, Fixed, 95% CI) | 0.86 [0.44, 1.65] |
| 2.2 advanced stage | 2 | 924 | Risk Ratio (M‐H, Fixed, 95% CI) | 1.04 [0.58, 1.89] |
| 3 Subgrouped by treatment Show forest plot | 3 | 2547 | Risk Ratio (M‐H, Fixed, 95% CI) | 0.95 [0.61, 1.48] |
| 3.1 only ABVD regimen | 2 | 1820 | Risk Ratio (M‐H, Fixed, 95% CI) | 0.86 [0.46, 1.64] |
| 3.2 ABVD including regimen | 1 | 727 | Risk Ratio (M‐H, Fixed, 95% CI) | 1.05 [0.57, 1.92] |
| 4 Subgrouped by number of cycles of escalated BEACOPP Show forest plot | 3 | 2547 | Risk Ratio (M‐H, Fixed, 95% CI) | 0.95 [0.61, 1.48] |
| 4.1 eight cycles of escalated BEACOPP | 1 | 727 | Risk Ratio (M‐H, Fixed, 95% CI) | 1.05 [0.57, 1.92] |
| 4.2 four cycles of escalated BEACOPP | 1 | 197 | Risk Ratio (M‐H, Fixed, 95% CI) | 1.01 [0.06, 15.92] |
| 4.3 two cycles of escalated BEACOPP | 1 | 1623 | Risk Ratio (M‐H, Fixed, 95% CI) | 0.86 [0.44, 1.65] |
| 5 Subgrouped by length of follow‐up Show forest plot | 3 | 2547 | Risk Ratio (M‐H, Fixed, 95% CI) | 0.95 [0.61, 1.48] |
| 5.1 short term follow‐up (median length up to 5 years) | 2 | 1820 | Risk Ratio (M‐H, Fixed, 95% CI) | 0.86 [0.46, 1.64] |
| 5.2 long term follow‐up (median length 10 years) | 1 | 727 | Risk Ratio (M‐H, Fixed, 95% CI) | 1.05 [0.57, 1.92] |
| 6 Subgrouped by publication form Show forest plot | 3 | 2547 | Risk Ratio (M‐H, Fixed, 95% CI) | 0.95 [0.61, 1.48] |
| 6.1 full text publication | 2 | 924 | Risk Ratio (M‐H, Fixed, 95% CI) | 1.04 [0.58, 1.89] |
| 6.2 abstract publication | 1 | 1623 | Risk Ratio (M‐H, Fixed, 95% CI) | 0.86 [0.44, 1.65] |
| 7 Subgrouped by type of results Show forest plot | 3 | 2547 | Risk Ratio (M‐H, Fixed, 95% CI) | 0.95 [0.61, 1.48] |
| 7.1 preliminary results | 1 | 1623 | Risk Ratio (M‐H, Fixed, 95% CI) | 0.86 [0.44, 1.65] |
| 7.2 mature results | 2 | 924 | Risk Ratio (M‐H, Fixed, 95% CI) | 1.04 [0.58, 1.89] |
| Outcome or subgroup title | No. of studies | No. of participants | Statistical method | Effect size |
| 1 AML or MDS Show forest plot | 2 | 924 | Risk Ratio (M‐H, Fixed, 95% CI) | 7.84 [1.04, 59.29] |
| Outcome or subgroup title | No. of studies | No. of participants | Statistical method | Effect size |
| 1 Secondary amenorrhoea Show forest plot | 1 | 106 | Risk Ratio (M‐H, Fixed, 95% CI) | 1.37 [0.83, 2.26] |
| Outcome or subgroup title | No. of studies | No. of participants | Statistical method | Effect size |
| 1 Anaemia Show forest plot | 3 | 2547 | Risk Ratio (M‐H, Fixed, 95% CI) | 10.47 [7.06, 15.54] |
| 2 Subgrouped by stage of disease Show forest plot | 3 | 2547 | Risk Ratio (M‐H, Fixed, 95% CI) | 10.47 [7.06, 15.54] |
| 2.1 early unfavourable stage | 1 | 1623 | Risk Ratio (M‐H, Fixed, 95% CI) | 9.15 [4.43, 18.86] |
| 2.2 advanced stage | 2 | 924 | Risk Ratio (M‐H, Fixed, 95% CI) | 10.96 [6.86, 17.51] |
| 3 Subgrouped by treatment Show forest plot | 3 | 2547 | Risk Ratio (M‐H, Fixed, 95% CI) | 10.47 [7.06, 15.54] |
| 3.1 only ABVD regimen | 2 | 1820 | Risk Ratio (M‐H, Fixed, 95% CI) | 6.87 [3.87, 12.18] |
| 3.2 ABVD including regimen | 1 | 727 | Risk Ratio (M‐H, Fixed, 95% CI) | 13.27 [7.78, 22.63] |
| 4 Subgrouped by number of cycles of escalated BEACOPP Show forest plot | 3 | 2547 | Risk Ratio (M‐H, Fixed, 95% CI) | 10.47 [7.06, 15.54] |
| 4.1 eight cycles of escalated BEACOPP | 1 | 727 | Risk Ratio (M‐H, Fixed, 95% CI) | 13.27 [7.78, 22.63] |
| 4.2 four cycles of escalated BEACOPP | 1 | 197 | Risk Ratio (M‐H, Fixed, 95% CI) | 3.23 [1.23, 8.48] |
| 4.3 two cycles of escalated BEACOPP | 1 | 1623 | Risk Ratio (M‐H, Fixed, 95% CI) | 9.15 [4.43, 18.86] |
| 5 Subgrouped by length of follow‐up Show forest plot | 3 | 2547 | Risk Ratio (M‐H, Fixed, 95% CI) | 10.47 [7.06, 15.54] |
| 5.1 short term follow‐up (median length up to 5 years) | 2 | 1820 | Risk Ratio (M‐H, Fixed, 95% CI) | 6.87 [3.87, 12.18] |
| 5.2 long term follow‐up (median length 10 years) | 1 | 727 | Risk Ratio (M‐H, Fixed, 95% CI) | 13.27 [7.78, 22.63] |
| 6 Subgrouped by publication form Show forest plot | 3 | 2547 | Risk Ratio (M‐H, Fixed, 95% CI) | 10.47 [7.06, 15.54] |
| 6.1 full text publication | 2 | 924 | Risk Ratio (M‐H, Fixed, 95% CI) | 10.96 [6.86, 17.51] |
| 6.2 abstract publication | 1 | 1623 | Risk Ratio (M‐H, Fixed, 95% CI) | 9.15 [4.43, 18.86] |
| 7 Subgrouped by type of results Show forest plot | 3 | 2547 | Risk Ratio (M‐H, Fixed, 95% CI) | 10.47 [7.06, 15.54] |
| 7.1 preliminary results | 1 | 1623 | Risk Ratio (M‐H, Fixed, 95% CI) | 9.15 [4.43, 18.86] |
| 7.2 mature results | 2 | 924 | Risk Ratio (M‐H, Fixed, 95% CI) | 10.96 [6.86, 17.51] |
| Outcome or subgroup title | No. of studies | No. of participants | Statistical method | Effect size |
| 1 Infection Show forest plot | 3 | 2547 | Risk Ratio (M‐H, Fixed, 95% CI) | 3.67 [2.57, 5.24] |
| 2 Subgrouped by stage of disease Show forest plot | 3 | 2547 | Risk Ratio (M‐H, Fixed, 95% CI) | 3.67 [2.57, 5.24] |
| 2.1 early unfavourable stage | 1 | 1623 | Risk Ratio (M‐H, Fixed, 95% CI) | 2.14 [1.38, 3.32] |
| 2.2 advanced stage | 2 | 924 | Risk Ratio (M‐H, Fixed, 95% CI) | 7.13 [3.78, 13.45] |
| 3 Subgrouped by treatment Show forest plot | 3 | 2547 | Risk Ratio (M‐H, Fixed, 95% CI) | 3.67 [2.57, 5.24] |
| 3.1 only ABVD regimen | 2 | 1820 | Risk Ratio (M‐H, Fixed, 95% CI) | 2.47 [1.63, 3.74] |
| 3.2 ABVD including regimen | 1 | 727 | Risk Ratio (M‐H, Fixed, 95% CI) | 7.14 [3.53, 14.43] |
| 4 Subgrouped by number of cycles of escalated BEACOPP Show forest plot | 3 | 2547 | Risk Ratio (M‐H, Fixed, 95% CI) | 3.67 [2.57, 5.24] |
| 4.1 eight cycles of escalated BEACOPP | 1 | 727 | Risk Ratio (M‐H, Fixed, 95% CI) | 7.14 [3.53, 14.43] |
| 4.2 four cycles of escalated BEACOPP | 1 | 197 | Risk Ratio (M‐H, Fixed, 95% CI) | 7.07 [1.65, 30.30] |
| 4.3 two cycles of escalated BEACOPP | 1 | 1623 | Risk Ratio (M‐H, Fixed, 95% CI) | 2.14 [1.38, 3.32] |
| 5 Subgrouped by length of follow‐up Show forest plot | 3 | 2547 | Risk Ratio (M‐H, Fixed, 95% CI) | 3.67 [2.57, 5.24] |
| 5.1 short term follow‐up (median length up to 5 years) | 2 | 1820 | Risk Ratio (M‐H, Fixed, 95% CI) | 2.47 [1.63, 3.74] |
| 5.2 long term follow‐up (median length 10 years) | 1 | 727 | Risk Ratio (M‐H, Fixed, 95% CI) | 7.14 [3.53, 14.43] |
| 6 Subgrouped by publication form Show forest plot | 3 | 2547 | Risk Ratio (M‐H, Fixed, 95% CI) | 3.67 [2.57, 5.24] |
| 6.1 full text publication | 2 | 924 | Risk Ratio (M‐H, Fixed, 95% CI) | 7.13 [3.78, 13.45] |
| 6.2 abstract publication | 1 | 1623 | Risk Ratio (M‐H, Fixed, 95% CI) | 2.14 [1.38, 3.32] |
| 7 Subgrouped by type of results Show forest plot | 3 | 2547 | Risk Ratio (M‐H, Fixed, 95% CI) | 3.67 [2.57, 5.24] |
| 7.1 preliminary results | 1 | 1623 | Risk Ratio (M‐H, Fixed, 95% CI) | 2.14 [1.38, 3.32] |
| 7.2 mature results | 2 | 924 | Risk Ratio (M‐H, Fixed, 95% CI) | 7.13 [3.78, 13.45] |
| Outcome or subgroup title | No. of studies | No. of participants | Statistical method | Effect size |
| 1 Leucopenia Show forest plot | 3 | 2547 | Risk Ratio (M‐H, Fixed, 95% CI) | 2.26 [2.09, 2.44] |
| 2 Subgrouped by stage of disease Show forest plot | 3 | 2547 | Risk Ratio (M‐H, Fixed, 95% CI) | 2.27 [2.10, 2.45] |
| 2.1 early unfavourable stage | 1 | 1623 | Risk Ratio (M‐H, Fixed, 95% CI) | 3.30 [2.90, 3.74] |
| 2.2 advanced stage | 2 | 924 | Risk Ratio (M‐H, Fixed, 95% CI) | 1.49 [1.37, 1.62] |
| 3 Subgrouped by treatment Show forest plot | 3 | 2547 | Risk Ratio (M‐H, Fixed, 95% CI) | 2.27 [2.10, 2.45] |
| 3.1 only ABVD regimen | 2 | 1820 | Risk Ratio (M‐H, Fixed, 95% CI) | 3.22 [2.86, 3.64] |
| 3.2 ABVD including regimen | 1 | 727 | Risk Ratio (M‐H, Fixed, 95% CI) | 1.39 [1.28, 1.50] |
| 4 Subgrouped by number of cycles of escalated BEACOPP Show forest plot | 3 | 2547 | Risk Ratio (M‐H, Fixed, 95% CI) | 2.27 [2.10, 2.45] |
| 4.1 eight cycles of escalated BEACOPP | 1 | 727 | Risk Ratio (M‐H, Fixed, 95% CI) | 1.39 [1.28, 1.50] |
| 4.2 two cycles of escalated BEACOPP | 1 | 197 | Risk Ratio (M‐H, Fixed, 95% CI) | 2.57 [1.71, 3.86] |
| 4.3 two cycles of escalated BEACOPP | 1 | 1623 | Risk Ratio (M‐H, Fixed, 95% CI) | 3.30 [2.90, 3.74] |
| 5 Subgrouped by length of follow‐up Show forest plot | 3 | 2547 | Risk Ratio (M‐H, Fixed, 95% CI) | 2.27 [2.10, 2.45] |
| 5.1 short term follow‐up (median length up to 5 years) | 2 | 1820 | Risk Ratio (M‐H, Fixed, 95% CI) | 3.22 [2.86, 3.64] |
| 5.2 long term follow‐up (median length 10 years) | 1 | 727 | Risk Ratio (M‐H, Fixed, 95% CI) | 1.39 [1.28, 1.50] |
| 6 Subgrouped by publication form Show forest plot | 3 | 2547 | Risk Ratio (M‐H, Fixed, 95% CI) | 2.27 [2.10, 2.45] |
| 6.1 full text publication | 2 | 924 | Risk Ratio (M‐H, Fixed, 95% CI) | 1.49 [1.37, 1.62] |
| 6.2 abstract publication | 1 | 1623 | Risk Ratio (M‐H, Fixed, 95% CI) | 3.30 [2.90, 3.74] |
| 7 Subgrouped by type of results Show forest plot | 3 | 2547 | Risk Ratio (M‐H, Fixed, 95% CI) | 2.27 [2.10, 2.45] |
| 7.1 preliminary results | 1 | 1623 | Risk Ratio (M‐H, Fixed, 95% CI) | 3.30 [2.90, 3.74] |
| 7.2 mature results | 2 | 924 | Risk Ratio (M‐H, Fixed, 95% CI) | 1.49 [1.37, 1.62] |
| Outcome or subgroup title | No. of studies | No. of participants | Statistical method | Effect size |
| 1 Neutropenia Show forest plot | 1 | 197 | Risk Ratio (M‐H, Fixed, 95% CI) | 1.57 [1.13, 2.19] |
| Outcome or subgroup title | No. of studies | No. of participants | Statistical method | Effect size |
| 1 Thrombocytopenia Show forest plot | 3 | 2547 | Risk Ratio (M‐H, Fixed, 95% CI) | 18.73 [12.17, 28.82] |
| 2 Subgrouped by stage of disease Show forest plot | 3 | 2547 | Risk Ratio (M‐H, Fixed, 95% CI) | 18.73 [12.17, 28.82] |
| 2.1 early unfavourable stage | 1 | 1623 | Risk Ratio (M‐H, Fixed, 95% CI) | 179.86 [25.26, 1280.82] |
| 2.2 advanced stage | 2 | 924 | Risk Ratio (M‐H, Fixed, 95% CI) | 11.53 [7.30, 18.23] |
| 3 Subgrouped by treatment Show forest plot | 3 | 2547 | Risk Ratio (M‐H, Fixed, 95% CI) | 18.73 [12.17, 28.82] |
| 3.1 only ABVD regimen | 2 | 1820 | Risk Ratio (M‐H, Fixed, 95% CI) | 50.43 [18.84, 134.96] |
| 3.2 ABVD including regimen | 1 | 727 | Risk Ratio (M‐H, Fixed, 95% CI) | 12.17 [7.42, 19.97] |
| 4 Subgrouped by number of cycles of escalated BEACOPP Show forest plot | 3 | 2547 | Risk Ratio (M‐H, Fixed, 95% CI) | 18.73 [12.17, 28.82] |
| 4.1 eight cycles of escalated BEACOPP | 1 | 727 | Risk Ratio (M‐H, Fixed, 95% CI) | 12.17 [7.42, 19.97] |
| 4.2 four cycles of escalated BEACOPP | 1 | 197 | Risk Ratio (M‐H, Fixed, 95% CI) | 7.41 [2.29, 23.95] |
| 4.3 two cycles of escalated BEACOPP | 1 | 1623 | Risk Ratio (M‐H, Fixed, 95% CI) | 179.86 [25.26, 1280.82] |
| 5 Subgrouped by length of follow‐up Show forest plot | 3 | 2547 | Risk Ratio (M‐H, Fixed, 95% CI) | 18.73 [12.17, 28.82] |
| 5.1 short term follow‐up (median length up to 5 years) | 2 | 1820 | Risk Ratio (M‐H, Fixed, 95% CI) | 50.43 [18.84, 134.96] |
| 5.2 long term follow‐up (median length 10 years) | 1 | 727 | Risk Ratio (M‐H, Fixed, 95% CI) | 12.17 [7.42, 19.97] |
| 6 Subgrouped by publication form Show forest plot | 3 | 2547 | Risk Ratio (M‐H, Fixed, 95% CI) | 18.73 [12.17, 28.82] |
| 6.1 full text publication | 2 | 924 | Risk Ratio (M‐H, Fixed, 95% CI) | 11.53 [7.30, 18.23] |
| 6.2 abstract publication | 1 | 1623 | Risk Ratio (M‐H, Fixed, 95% CI) | 179.86 [25.26, 1280.82] |
| 7 Subgrouped by type of results Show forest plot | 3 | 2547 | Risk Ratio (M‐H, Fixed, 95% CI) | 18.73 [12.17, 28.82] |
| 7.1 preliminary results | 1 | 1623 | Risk Ratio (M‐H, Fixed, 95% CI) | 179.86 [25.26, 1280.82] |
| 7.2 mature results | 2 | 924 | Risk Ratio (M‐H, Fixed, 95% CI) | 11.53 [7.30, 18.23] |
| Outcome or subgroup title | No. of studies | No. of participants | Statistical method | Effect size |
| 1 Alopecia Show forest plot | 3 | 2547 | Risk Ratio (M‐H, Fixed, 95% CI) | 1.97 [1.77, 2.19] |
| 2 Subgrouped by stage of disease Show forest plot | 3 | 2547 | Risk Ratio (M‐H, Fixed, 95% CI) | 1.97 [1.77, 2.19] |
| 2.1 early unfavourable stage | 1 | 1623 | Risk Ratio (M‐H, Fixed, 95% CI) | 2.00 [1.74, 2.31] |
| 2.2 advanced stage | 2 | 924 | Risk Ratio (M‐H, Fixed, 95% CI) | 1.93 [1.65, 2.26] |
| 3 Subgrouped by treatment Show forest plot | 3 | 2547 | Risk Ratio (M‐H, Fixed, 95% CI) | 1.97 [1.77, 2.19] |
| 3.1 only ABVD regimen | 2 | 1820 | Risk Ratio (M‐H, Fixed, 95% CI) | 1.85 [1.62, 2.12] |
| 3.2 ABVD including regimen | 1 | 727 | Risk Ratio (M‐H, Fixed, 95% CI) | 2.19 [1.85, 2.59] |
| 4 Subgrouped by number of cycles of escalated BEACOPP Show forest plot | 3 | 2547 | Risk Ratio (M‐H, Fixed, 95% CI) | 1.97 [1.77, 2.19] |
| 4.1 eight cycles of escalated BEACOPP | 1 | 727 | Risk Ratio (M‐H, Fixed, 95% CI) | 2.19 [1.85, 2.59] |
| 4.2 four cycles of escalated BEACOPP | 1 | 197 | Risk Ratio (M‐H, Fixed, 95% CI) | 0.91 [0.59, 1.40] |
| 4.3 two cycles of escalated BEACOPP | 1 | 1623 | Risk Ratio (M‐H, Fixed, 95% CI) | 2.00 [1.74, 2.31] |
| 5 Subgrouped by length of follow‐up Show forest plot | 3 | 2547 | Risk Ratio (M‐H, Fixed, 95% CI) | 1.97 [1.77, 2.19] |
| 5.1 short term follow‐up (median length up to 5 years) | 2 | 1820 | Risk Ratio (M‐H, Fixed, 95% CI) | 1.85 [1.62, 2.12] |
| 5.2 long term follow‐up (median length 10 years) | 1 | 727 | Risk Ratio (M‐H, Fixed, 95% CI) | 2.19 [1.85, 2.59] |
| 6 Subgrouped by publication form Show forest plot | 3 | 2547 | Risk Ratio (M‐H, Fixed, 95% CI) | 1.97 [1.77, 2.19] |
| 6.1 full text publication | 2 | 924 | Risk Ratio (M‐H, Fixed, 95% CI) | 1.93 [1.65, 2.26] |
| 6.2 abstract publication | 1 | 1623 | Risk Ratio (M‐H, Fixed, 95% CI) | 2.00 [1.74, 2.31] |
| 7 Subgrouped by type of results Show forest plot | 3 | 2547 | Risk Ratio (M‐H, Fixed, 95% CI) | 1.97 [1.77, 2.19] |
| 7.1 preliminary results | 1 | 1623 | Risk Ratio (M‐H, Fixed, 95% CI) | 2.00 [1.74, 2.31] |
| 7.2 mature results | 2 | 924 | Risk Ratio (M‐H, Fixed, 95% CI) | 1.93 [1.65, 2.26] |
| Outcome or subgroup title | No. of studies | No. of participants | Statistical method | Effect size |
| 1 Constipation Show forest plot | 2 | 923 | Risk Ratio (M‐H, Fixed, 95% CI) | 1.19 [0.56, 2.55] |
| Outcome or subgroup title | No. of studies | No. of participants | Statistical method | Effect size |
| 1 Mucositis Show forest plot | 2 | 924 | Risk Ratio (M‐H, Fixed, 95% CI) | 6.32 [2.25, 17.75] |
| Outcome or subgroup title | No. of studies | No. of participants | Statistical method | Effect size |
| 1 Nausea/vomiting Show forest plot | 2 | 924 | Risk Ratio (M‐H, Fixed, 95% CI) | 0.94 [0.71, 1.25] |
| Outcome or subgroup title | No. of studies | No. of participants | Statistical method | Effect size |
| 1 Neurologic Show forest plot | 2 | 924 | Risk Ratio (M‐H, Fixed, 95% CI) | 1.14 [0.55, 2.35] |
| Outcome or subgroup title | No. of studies | No. of participants | Statistical method | Effect size |
| 1 Pain Show forest plot | 2 | 924 | Risk Ratio (M‐H, Fixed, 95% CI) | 4.88 [2.04, 11.66] |
| Outcome or subgroup title | No. of studies | No. of participants | Statistical method | Effect size |
| 1 Respiratory Show forest plot | 1 | 726 | Risk Ratio (M‐H, Fixed, 95% CI) | 2.12 [0.80, 5.61] |
| Outcome or subgroup title | No. of studies | No. of participants | Statistical method | Effect size |
| 1 Skin Show forest plot | 1 | 726 | Risk Ratio (M‐H, Fixed, 95% CI) | 2.60 [0.76, 8.98] |