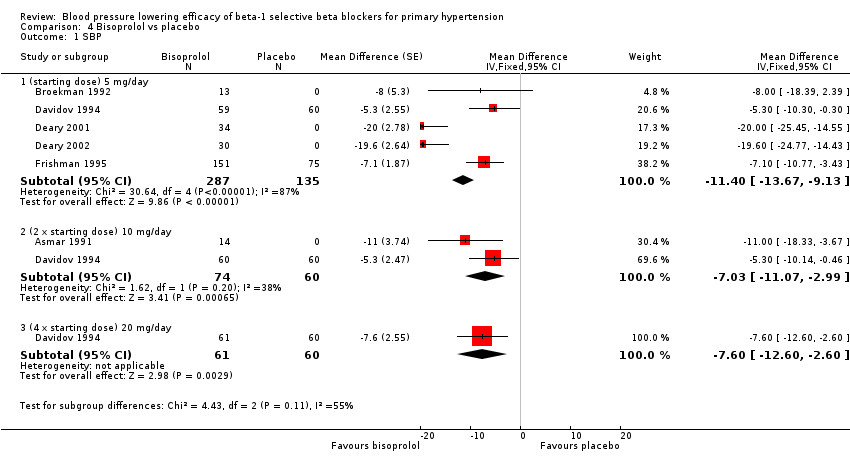
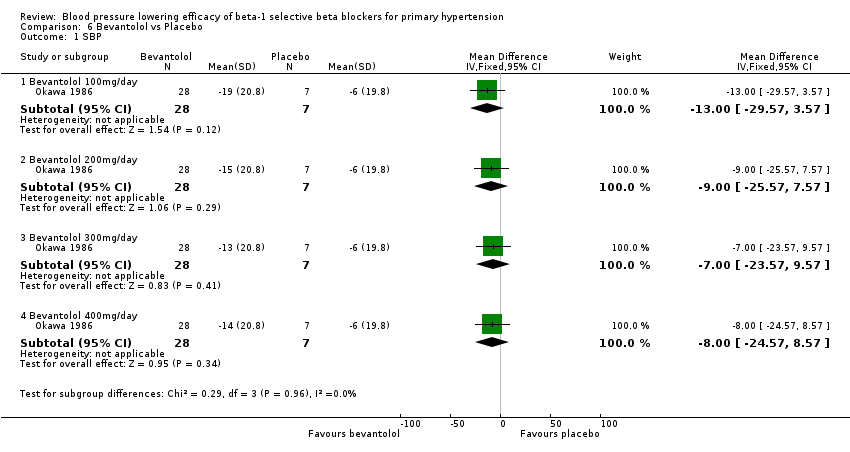
| 1 SBP Show forest plot | 13 | | Mean Difference (Fixed, 95% CI) | Subtotals only |
|
| 1.1 (0.25 x starting dose) 1.0 & 1.25 mg/day | 3 | 366 | Mean Difference (Fixed, 95% CI) | ‐4.49 [‐7.15, ‐1.83] |
| 1.2 (0.5 x starting dose) 2.5 mg/day | 3 | 415 | Mean Difference (Fixed, 95% CI) | ‐4.96 [‐7.66, ‐2.26] |
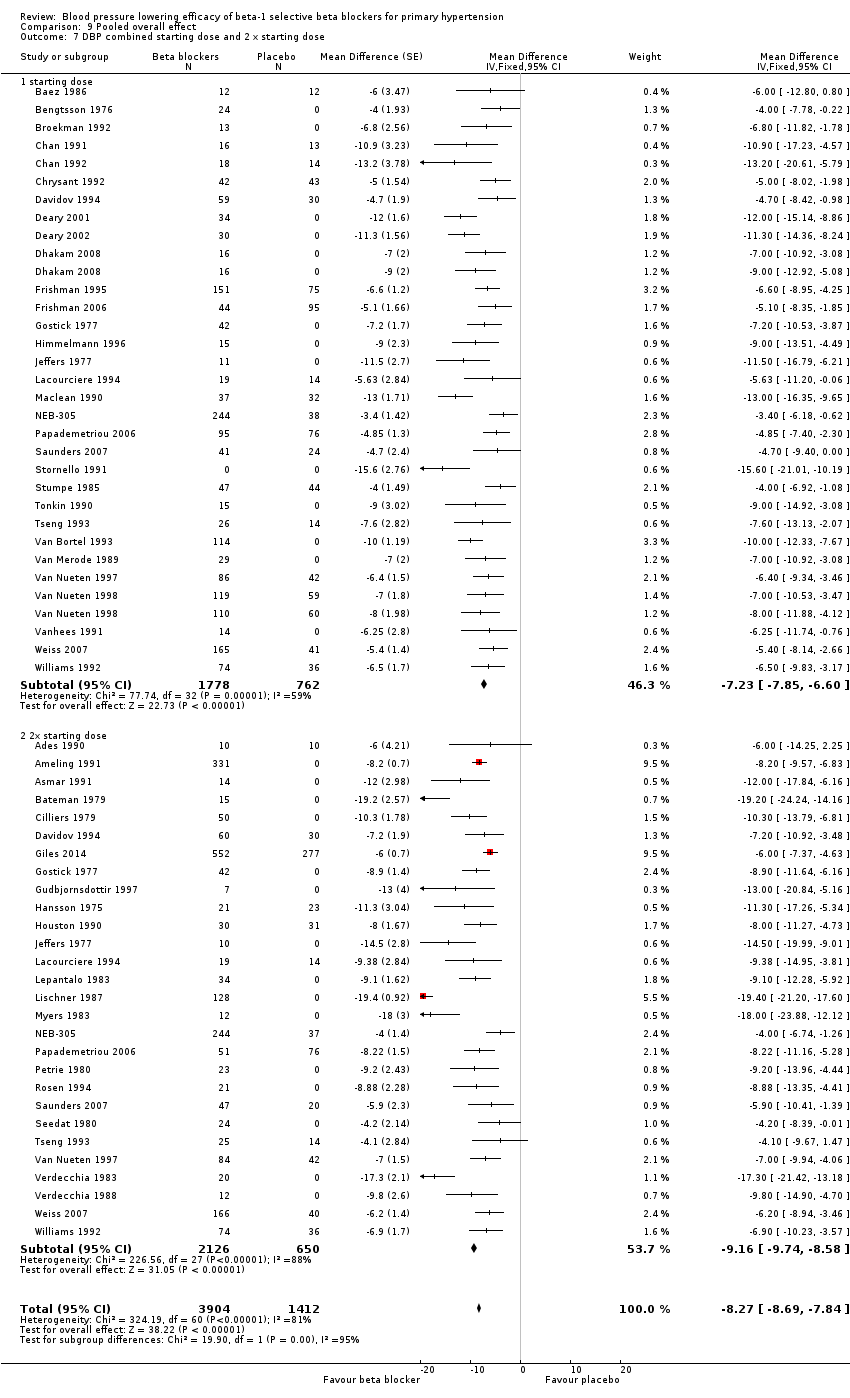
| 1.3 (starting dose) 5 mg/day | 12 | 1280 | Mean Difference (Fixed, 95% CI) | ‐8.81 [‐10.23, ‐7.40] |
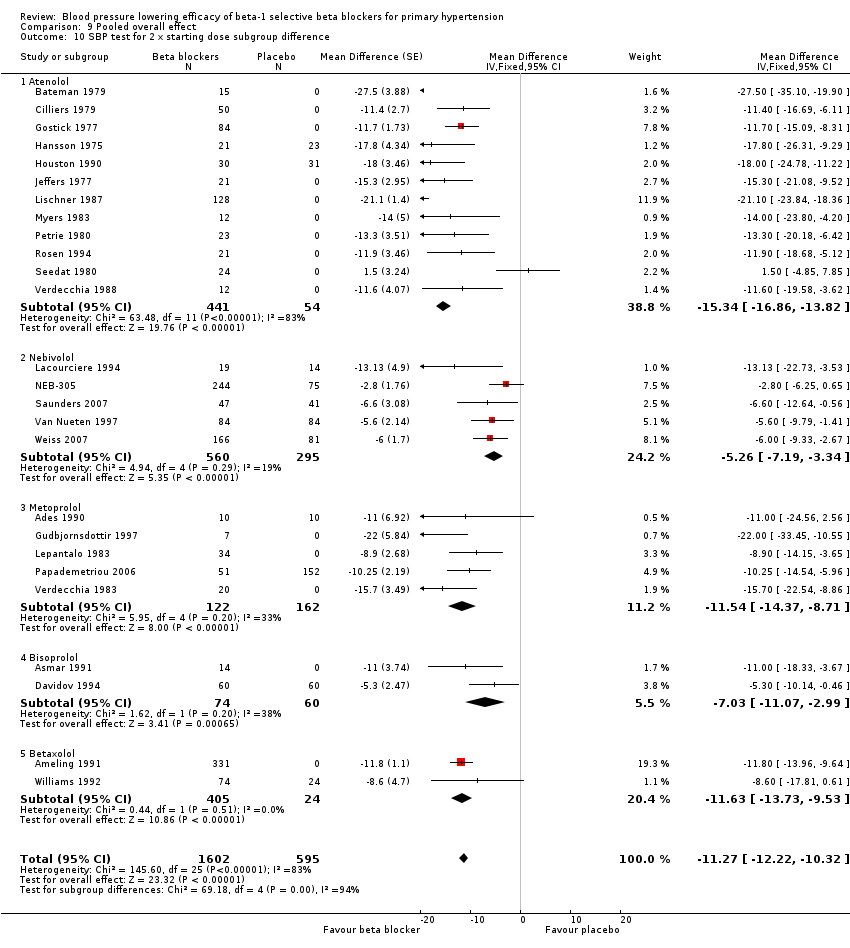
| 1.4 (2 x starting dose) 10 mg/day | 6 | 1684 | Mean Difference (Fixed, 95% CI) | ‐6.04 [‐7.47, ‐4.60] |
| 1.5 (4 x starting dose) 20 mg/day | 3 | 652 | Mean Difference (Fixed, 95% CI) | ‐6.95 [‐9.26, ‐4.63] |
| 1.6 (8 x starting dose) 30, 40 mg/day | 3 | 1155 | Mean Difference (Fixed, 95% CI) | ‐8.10 [‐9.84, ‐6.36] |
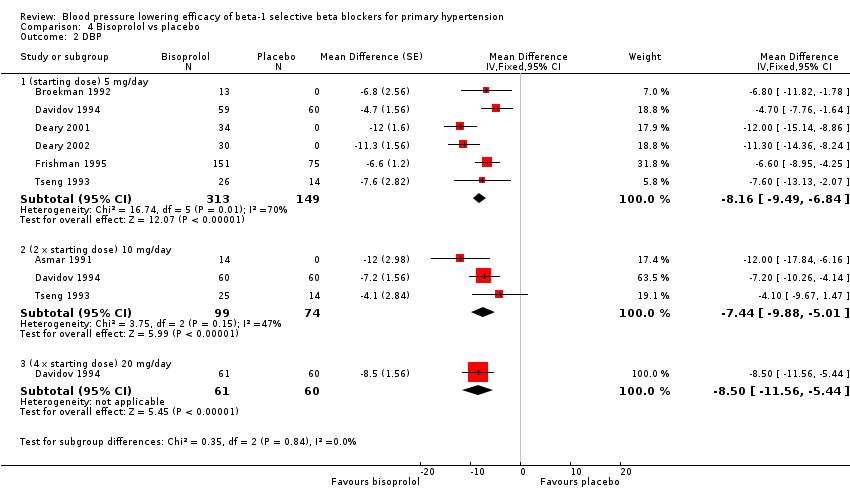
| 2 DBP Show forest plot | 13 | | Mean Difference (Fixed, 95% CI) | Subtotals only |
|
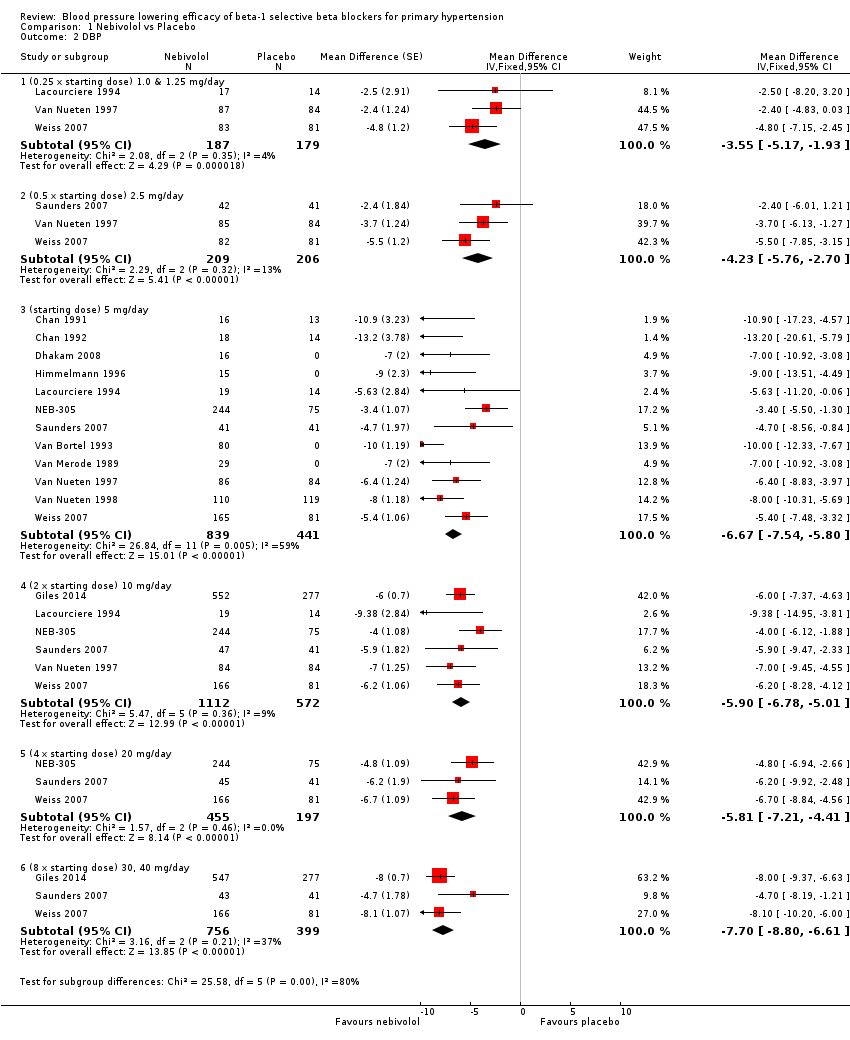
| 2.1 (0.25 x starting dose) 1.0 & 1.25 mg/day | 3 | 366 | Mean Difference (Fixed, 95% CI) | ‐3.55 [‐5.17, ‐1.93] |
| 2.2 (0.5 x starting dose) 2.5 mg/day | 3 | 415 | Mean Difference (Fixed, 95% CI) | ‐4.23 [‐5.76, ‐2.70] |
| 2.3 (starting dose) 5 mg/day | 12 | 1280 | Mean Difference (Fixed, 95% CI) | ‐6.67 [‐7.54, ‐5.80] |
| 2.4 (2 x starting dose) 10 mg/day | 6 | 1684 | Mean Difference (Fixed, 95% CI) | ‐5.90 [‐6.78, ‐5.01] |
| 2.5 (4 x starting dose) 20 mg/day | 3 | 652 | Mean Difference (Fixed, 95% CI) | ‐5.81 [‐7.21, ‐4.41] |
| 2.6 (8 x starting dose) 30, 40 mg/day | 3 | 1155 | Mean Difference (Fixed, 95% CI) | ‐7.70 [‐8.80, ‐6.61] |
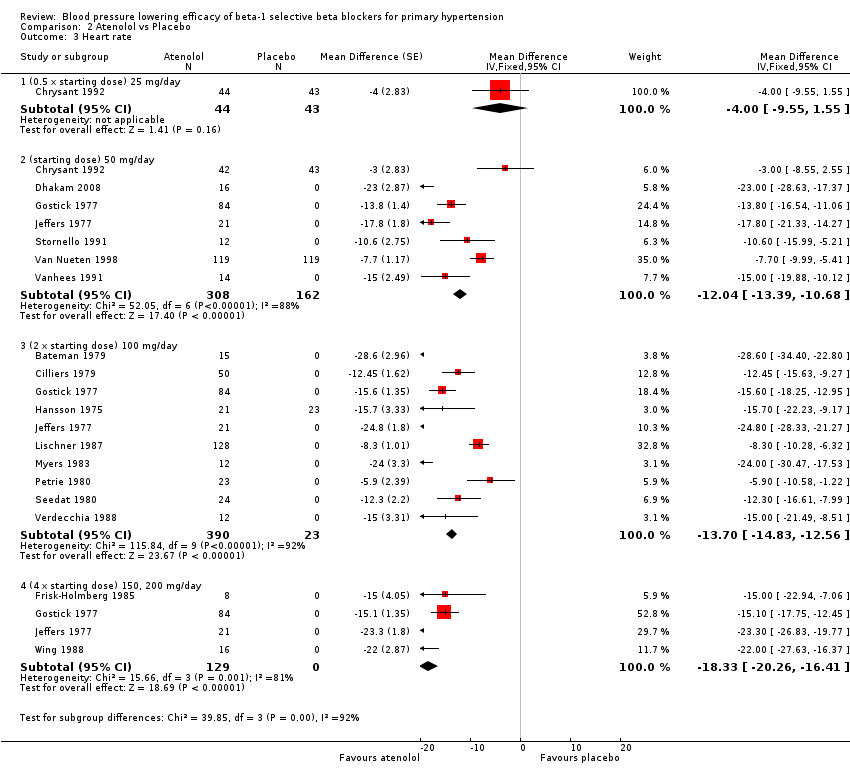
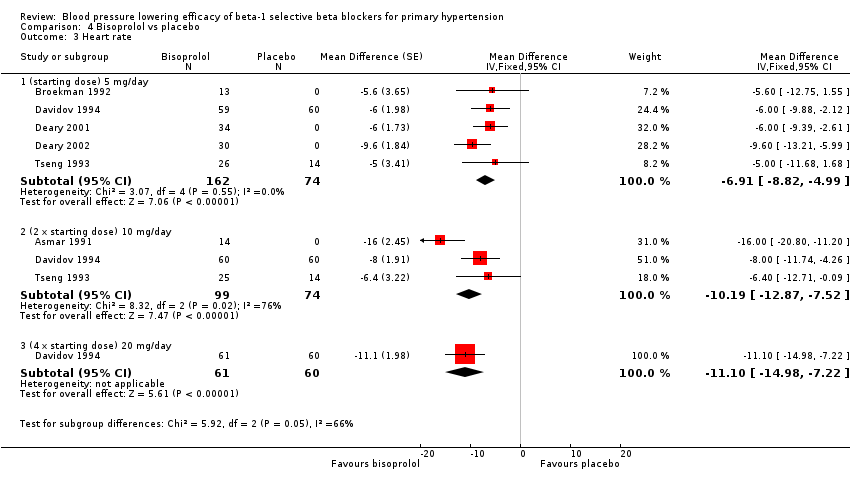
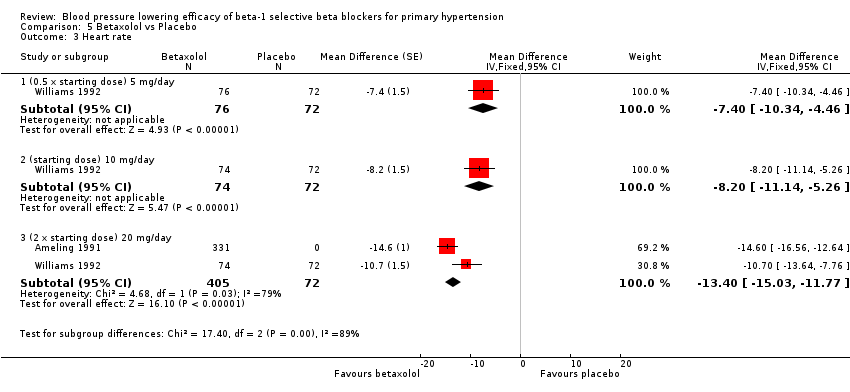
| 3 Heart rate Show forest plot | 8 | | Mean Difference (Fixed, 95% CI) | Subtotals only |
|
| 3.1 (0.25 x starting dose) 1.25 mg/day | 1 | 136 | Mean Difference (Fixed, 95% CI) | ‐2.9 [‐5.86, 0.06] |
| 3.2 (0.5 x starting dose) 2.5 mg/day | 2 | 218 | Mean Difference (Fixed, 95% CI) | ‐3.89 [‐6.18, ‐1.61] |
| 3.3 (starting dose) 5 mg/day | 7 | 487 | Mean Difference (Fixed, 95% CI) | ‐8.21 [‐9.66, ‐6.76] |
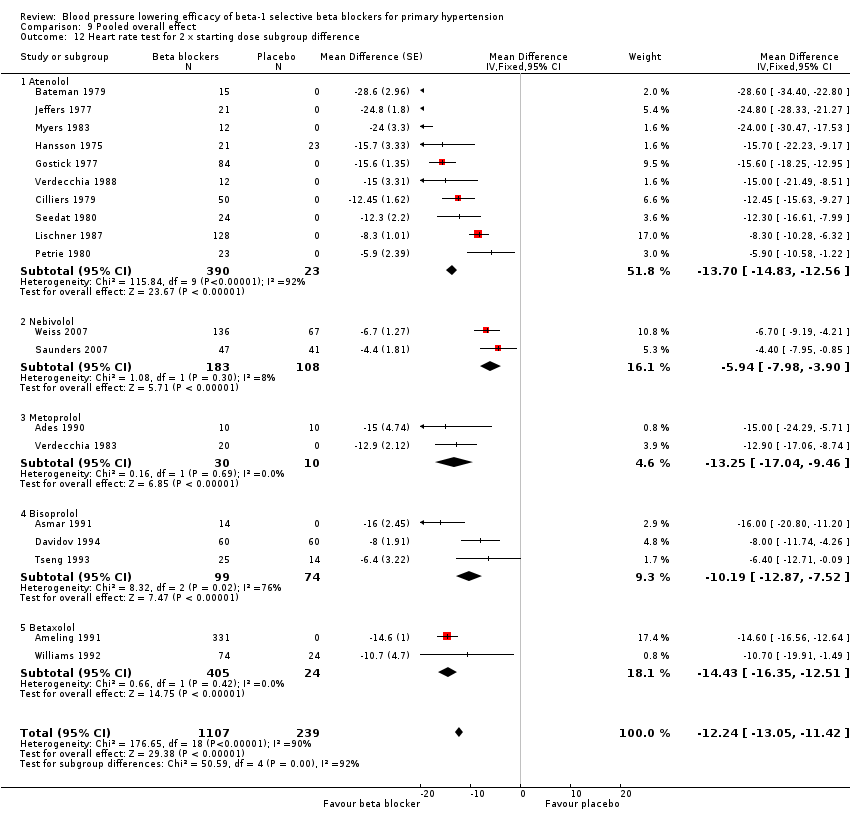
| 3.4 (2 x starting dose) 10 mg/day | 3 | 1120 | Mean Difference (Fixed, 95% CI) | ‐7.23 [‐8.48, ‐5.99] |
| 3.5 (4 x starting dose) 20 mg/day | 2 | 298 | Mean Difference (Fixed, 95% CI) | ‐8.43 [‐10.48, ‐6.38] |
| 3.6 (8 x starting dose) 30, 40 mg/day | 3 | 1155 | Mean Difference (Fixed, 95% CI) | ‐10.94 [‐12.18, ‐9.71] |
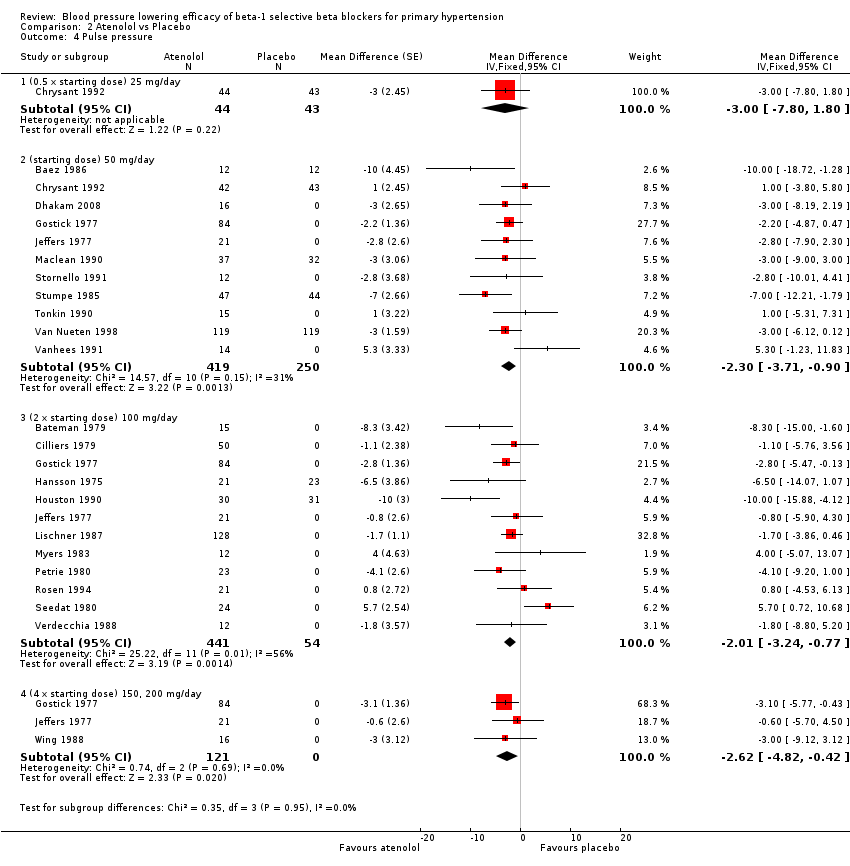
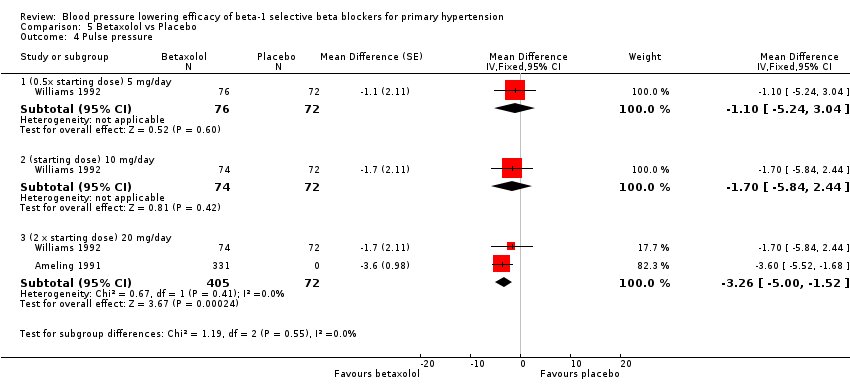
| 4 Pulse Pressure Show forest plot | 13 | | Mean Difference (Fixed, 95% CI) | Subtotals only |
|
| 4.1 (0.25 x starting dose) 1.0 & 1.25 mg/day | 3 | 366 | Mean Difference (Fixed, 95% CI) | ‐0.88 [‐3.21, 1.45] |
| 4.2 (0.5 x starting dose) 2.5 mg/day | 3 | 415 | Mean Difference (Fixed, 95% CI) | ‐0.95 [‐3.32, 1.41] |
| 4.3 (starting dose) 5 mg/day | 12 | 1314 | Mean Difference (Fixed, 95% CI) | ‐1.62 [‐2.83, ‐0.41] |
| 4.4 (2 x starting dose) 10 mg/day | 6 | 1684 | Mean Difference (Fixed, 95% CI) | ‐0.19 [‐1.47, 1.08] |
| 4.5 (4 x starting dose) 20 mg/day | 3 | 652 | Mean Difference (Fixed, 95% CI) | ‐1.25 [‐3.38, 0.89] |
| 4.6 (8 x starting dose) 30, 40 mg/day | 3 | 1155 | Mean Difference (Fixed, 95% CI) | ‐0.37 [‐1.94, 1.20] |
| 5 Peak vs Trough SBP Show forest plot | 4 | | Mean Difference (Fixed, 95% CI) | Subtotals only |
|
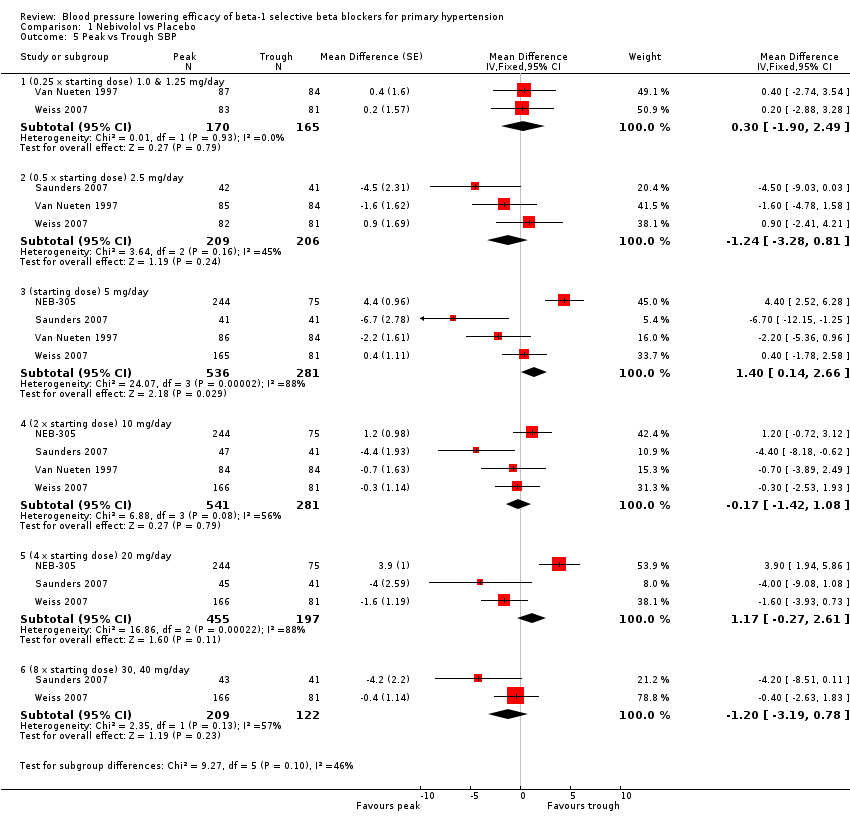
| 5.1 (0.25 x starting dose) 1.0 & 1.25 mg/day | 2 | 335 | Mean Difference (Fixed, 95% CI) | 0.30 [‐1.90, 2.49] |
| 5.2 (0.5 x starting dose) 2.5 mg/day | 3 | 415 | Mean Difference (Fixed, 95% CI) | ‐1.24 [‐3.28, 0.81] |
| 5.3 (starting dose) 5 mg/day | 4 | 817 | Mean Difference (Fixed, 95% CI) | 1.40 [0.14, 2.66] |
| 5.4 (2 x starting dose) 10 mg/day | 4 | 822 | Mean Difference (Fixed, 95% CI) | ‐0.17 [‐1.42, 1.08] |
| 5.5 (4 x starting dose) 20 mg/day | 3 | 652 | Mean Difference (Fixed, 95% CI) | 1.17 [‐0.27, 2.61] |
| 5.6 (8 x starting dose) 30, 40 mg/day | 2 | 331 | Mean Difference (Fixed, 95% CI) | ‐1.20 [‐3.19, 0.78] |
| 6 Peak vs Trough DBP Show forest plot | 4 | 3372 | Mean Difference (Fixed, 95% CI) | ‐1.53 [‐1.95, ‐1.11] |
|
| 6.1 (0.25 x starting dose) 1.0 & 1.25 mg/day | 2 | 335 | Mean Difference (Fixed, 95% CI) | ‐0.95 [‐2.38, 0.48] |
| 6.2 (0.5 x starting dose) 2.5 mg/day | 3 | 415 | Mean Difference (Fixed, 95% CI) | ‐1.88 [‐3.12, ‐0.64] |
| 6.3 (starting dose) 5 mg/day | 4 | 817 | Mean Difference (Fixed, 95% CI) | ‐1.54 [‐2.52, ‐0.57] |
| 6.4 (2 x starting dose) 10 mg/day | 4 | 822 | Mean Difference (Fixed, 95% CI) | ‐1.06 [‐1.86, ‐0.26] |
| 6.5 (4 x starting dose) 20 mg/day | 3 | 652 | Mean Difference (Fixed, 95% CI) | ‐1.53 [‐2.41, ‐0.65] |
| 6.6 (8 x starting dose) 30, 40 mg/day | 2 | 331 | Mean Difference (Fixed, 95% CI) | ‐2.73 [‐3.98, ‐1.49] |