Eficacia hipotensora de los betabloqueantes selectivos beta 1 en la hipertensión primaria
Referencias
Referencias de los estudios incluidos en esta revisión
Referencias de los estudios excluidos de esta revisión
Referencias adicionales
Characteristics of studies
Characteristics of included studies [ordered by study ID]
Ir a:
| Methods | Randomised, double‐blinded, placebo‐controlled parallel study, 11‐week treatment period | |
| Participants | N = 30, 22 men, mean age = 47 years, mean baseline BP 145/94 mmHg, primary hypertension | |
| Interventions | Metoprolol 100 mg once daily, propranolol 80 mg once daily, placebo | |
| Outcomes | SBP, DBP, heart rate, exercise training, cardiac output, echocardiogram, muscle biopsy | |
| Notes | ||
| Risk of bias | ||
| Bias | Authors' judgement | Support for judgement |
| Random sequence generation (selection bias) | Unclear risk | No information |
| Allocation concealment (selection bias) | Unclear risk | No information |
| Blinding of participants and personnel (performance bias) | Unclear risk | Placebo was used |
| Blinding of outcome assessment (detection bias) | Unclear risk | No information |
| Incomplete outcome data (attrition bias) | Low risk | No dropouts |
| Selective reporting (reporting bias) | Unclear risk | Did not report withdrawal due to adverse effects |
| Methods | Randomised, double‐blinded, placebo‐controlled, cross‐over study. Patients were seen for the first two weeks and BP was measured in every visit. Patients who were eligible, were randomised after week 2. Each treatment period lasted for four weeks and then patients crossed‐over to another treatment for another four weeks. BP was measured in two‐week intervals during the treatment period | |
| Participants | Previously undiagnosed patients who had mean office DBP > 95 mmHg in two office visits, during the first two weeks, were included in the study. The study randomised 331 patients (188, 56.8% male) to betaxolol or placebo. Mean age = 50 years. Baseline SBP = 167.4 mmHg, DBP = 104.7 mmHg, heart rate = 80.3 bpm Exclusion criteria: age < 20 years or > 70 years; SBP > 190 mmHg or DBP > 125 mmHg; use of any medication that may affect BP; pregnancy; use of oral contraceptive; heart failure; bradycardia; chronic hepatic, renal or metabolic diseases; bronchial asthma; chronic pulmonary diseases | |
| Interventions | Participants were randomised to betaxolol 20 mg once daily fixed dose (N = 163) or placebo (N = 168) for four weeks, and then crossed over. | |
| Outcomes | Quality of life SBP, DBP, heart rate Withdrawal due to adverse effects | |
| Notes | SD of BP measurements were not reported. SD were imputed using the weighted mean SD of studies in this review | |
| Risk of bias | ||
| Bias | Authors' judgement | Support for judgement |
| Random sequence generation (selection bias) | Unclear risk | No information |
| Allocation concealment (selection bias) | Unclear risk | No information |
| Blinding of participants and personnel (performance bias) | Low risk | Placebo was used |
| Blinding of outcome assessment (detection bias) | High risk | "Subjects who were withdrawn from the study had no systematic follow up of their Quality of life assessment." There was no information about the follow up on SBP, DBP or heart rate data. |
| Incomplete outcome data (attrition bias) | Low risk | Withdrawal due to adverse effects was reported |
| Selective reporting (reporting bias) | Low risk | SBP, DBP, heart rate were reported without SD |
| Methods | Randomised, double‐blinded, placebo‐controlled cross‐over study. Four‐week treatment period | |
| Participants | N = 14, 7 men, mean age = 53, baseline BP 156/101, primary hypertensive patients | |
| Interventions | Bisoprolol 10 mg once daily, placebo | |
| Outcomes | Resting BP, heart rate, haemodynamic parameters, pulse wave velocity determinations | |
| Notes | ||
| Risk of bias | ||
| Bias | Authors' judgement | Support for judgement |
| Random sequence generation (selection bias) | Unclear risk | No information |
| Allocation concealment (selection bias) | Unclear risk | No information |
| Blinding of participants and personnel (performance bias) | Low risk | Placebo and automated machine was used |
| Blinding of outcome assessment (detection bias) | Low risk | Automated machine was used |
| Incomplete outcome data (attrition bias) | Unclear risk | No information on dropouts |
| Selective reporting (reporting bias) | Low risk | All outcomes reported |
| Methods | Randomised, double‐blinded, placebo‐controlled parallel study. Three‐week run in, 10‐week treatment periods | |
| Participants | N = 36, 24 men, age 33 years to 68 years Exclusion: haematological, renal, hepatic, gastrointestinal, autoimmune or cardiac diseases | |
| Interventions | Atenolol 50 mg, 100 mg once daily (only 50 mg data used), doxazosin 16 mg once daily, placebo | |
| Outcomes | SBP, DBP, lab analysis | |
| Notes | ||
| Risk of bias | ||
| Bias | Authors' judgement | Support for judgement |
| Random sequence generation (selection bias) | Unclear risk | No information |
| Allocation concealment (selection bias) | Unclear risk | No information |
| Blinding of participants and personnel (performance bias) | Low risk | Placebo was used |
| Blinding of outcome assessment (detection bias) | High risk | Did not use automated machine |
| Incomplete outcome data (attrition bias) | Low risk | No dropouts |
| Selective reporting (reporting bias) | Low risk | All outcomes reported |
| Methods | Randomised, double‐blinded, placebo‐controlled cross‐over study, four‐week treatment periods | |
| Participants | N = 15, 11 men, age range 31 years to 64 years. Primary hypertension, without history of gout, chronic obstructive pulmonary disease, diabetes, ischaemic heart disease | |
| Interventions | Atenolol 100 mg once daily, chlorthalidone 25 mg once daily, combination of two drugs, placebo | |
| Outcomes | SBP, DBP, ambulatory blood pressure monitoring, biochemical analysis | |
| Notes | ||
| Risk of bias | ||
| Bias | Authors' judgement | Support for judgement |
| Random sequence generation (selection bias) | Unclear risk | No information |
| Allocation concealment (selection bias) | Low risk | All tablets were identical in appearance and taste |
| Blinding of participants and personnel (performance bias) | Low risk | Placebo was used |
| Blinding of outcome assessment (detection bias) | High risk | Did not use automated machine |
| Incomplete outcome data (attrition bias) | Low risk | Dropouts were not included in the analysis |
| Selective reporting (reporting bias) | Low risk | All outcomes reported |
| Methods | Randomised, double‐blinded, placebo‐controlled cross‐over study, four‐week treatment period | |
| Participants | N = 24, all women, mean age is 56 years, mean baseline BP 183/107 mmHg. Primary hypertension with normal renal function | |
| Interventions | Metoprolol 40 mg thrice daily or placebo | |
| Outcomes | SBP, DBP, heart rate, lab parameters | |
| Notes | ||
| Risk of bias | ||
| Bias | Authors' judgement | Support for judgement |
| Random sequence generation (selection bias) | Unclear risk | No information |
| Allocation concealment (selection bias) | Unclear risk | No information |
| Blinding of participants and personnel (performance bias) | Low risk | Placebo was used |
| Blinding of outcome assessment (detection bias) | High risk | Did not use automated machine |
| Incomplete outcome data (attrition bias) | Low risk | No dropouts, 96% of tablets were taken |
| Selective reporting (reporting bias) | Low risk | All outcomes reported |
| Methods | Randomised, double‐blinded, parallel study, four‐week wash out, four‐week treatment | |
| Participants | N = 31, 24 male, mean age = 51.4 years, BP range 150‐200/100‐115 mmHg | |
| Interventions | Pafenolol 25mg or 50 mg once daily, placebo | |
| Outcomes | Casual BP, heart rate, 24 hour BP | |
| Notes | ||
| Risk of bias | ||
| Bias | Authors' judgement | Support for judgement |
| Random sequence generation (selection bias) | Low risk | No information, but baseline was balanced |
| Allocation concealment (selection bias) | Unclear risk | No information |
| Blinding of participants and personnel (performance bias) | Low risk | Placebo was used, but no description on placebo tablet |
| Blinding of outcome assessment (detection bias) | High risk | Did not use automated machine |
| Incomplete outcome data (attrition bias) | Low risk | No dropouts |
| Selective reporting (reporting bias) | Low risk | Did not mention withdrawal due to adverse effects as outcome, however, no patients dropped out |
| Methods | Randomised, double‐blinded, cross‐over study. six‐week treatment period | |
| Participants | N = 13, all men, mean age 51.2 years | |
| Interventions | Bisoprolol 5 mg once daily, placebo | |
| Outcomes | SBP, DBP, heart rate, sexual information | |
| Notes | Group 1 only | |
| Risk of bias | ||
| Bias | Authors' judgement | Support for judgement |
| Random sequence generation (selection bias) | Unclear risk | No information |
| Allocation concealment (selection bias) | Unclear risk | No information |
| Blinding of participants and personnel (performance bias) | Low risk | Placebo was used |
| Blinding of outcome assessment (detection bias) | Unclear risk | No information |
| Incomplete outcome data (attrition bias) | Unclear risk | No information |
| Selective reporting (reporting bias) | Low risk | Did not report baseline. Other outcomes were reported |
| Methods | Randomised, double‐blinded, placebo‐controlled parallel study. four‐week run in, week four‐treatment period | |
| Participants | N = 29, seven men, mean age = 46 years, mean baseline BP 163/106 mmHg, primary hypertension, normal renal function, without insulin dependent diabetes and secondary hypertension | |
| Interventions | Nebivolol 5 mg once daily, placebo | |
| Outcomes | BP, heart rate biochemistry, chest X‐ray, electrocardiography, quality of life | |
| Notes | ||
| Risk of bias | ||
| Bias | Authors' judgement | Support for judgement |
| Random sequence generation (selection bias) | Unclear risk | No information |
| Allocation concealment (selection bias) | Unclear risk | No information |
| Blinding of participants and personnel (performance bias) | Low risk | Matching placebo was used |
| Blinding of outcome assessment (detection bias) | High risk | Did not use automated machine |
| Incomplete outcome data (attrition bias) | Low risk | No dropouts |
| Selective reporting (reporting bias) | Low risk | All outcomes reported |
| Methods | Randomised, double‐blinded, placebo‐controlled parallel study. four‐week run‐in, four‐week treatment period | |
| Participants | N = 32, eight men, mean age = 47 years, mean baseline BP = 164/105.8 mmHg. Primary hypertension, without renal disease, diabetes, secondary hypertension | |
| Interventions | Nebivolol 5 mg once daily, placebo | |
| Outcomes | Rest SBP, DBP, heart rate, plasma biochemistry, plasma renin and hormone level | |
| Notes | ||
| Risk of bias | ||
| Bias | Authors' judgement | Support for judgement |
| Random sequence generation (selection bias) | Unclear risk | No information |
| Allocation concealment (selection bias) | Unclear risk | No information |
| Blinding of participants and personnel (performance bias) | Low risk | Matching placebo tablet was used |
| Blinding of outcome assessment (detection bias) | High risk | Did not use automated machine |
| Incomplete outcome data (attrition bias) | Low risk | No dropouts |
| Selective reporting (reporting bias) | Low risk | All outcomes reported |
| Methods | Randomised, double‐blinded, placebo‐controlled parallel study, three‐week run in, four‐week treatment period | |
| Participants | N = 256, 120 men, mean age 53 years, mean baseline BP 152.5/103 mmHg. Primary hypertension without renal failure, congestive heart failure, lung diseases, liver diseases or blood diseases. Women of child bearing age were excluded | |
| Interventions | Atenolol 25 mg, 50 mg once daily, hydrochlorothiazide 25 mg/triamterene 50 mg once daily, their combinations, placebo | |
| Outcomes | SBP, DBP, heart rate, withdrawal due to adverse effects | |
| Notes | Withdrawal due to adverse effects not reported according to treatment groups | |
| Risk of bias | ||
| Bias | Authors' judgement | Support for judgement |
| Random sequence generation (selection bias) | Unclear risk | No information |
| Allocation concealment (selection bias) | Unclear risk | No information |
| Blinding of participants and personnel (performance bias) | Unclear risk | Placebo was used |
| Blinding of outcome assessment (detection bias) | Unclear risk | No information |
| Incomplete outcome data (attrition bias) | Low risk | Eight withdrawals in total |
| Selective reporting (reporting bias) | Low risk | All outcomes reported |
| Methods | Randomised, double‐blinded, placebo‐controlled cross‐over study, four‐week treatment periods | |
| Participants | N = 50, 29 men, mean age 47 years, mean baseline BP 165.8/107.7 mmHg. Primary hypertension, never‐been‐treated patients | |
| Interventions | Atenolol 100 mg once daily, placebo | |
| Outcomes | SBP, DBP, heart rate, withdrawal due to adverse effects | |
| Notes | ||
| Risk of bias | ||
| Bias | Authors' judgement | Support for judgement |
| Random sequence generation (selection bias) | Unclear risk | No information |
| Allocation concealment (selection bias) | Unclear risk | No information |
| Blinding of participants and personnel (performance bias) | Low risk | Placebo was used |
| Blinding of outcome assessment (detection bias) | High risk | Did not used automated machine |
| Incomplete outcome data (attrition bias) | Low risk | Nine dropouts, three withdrawal due to adverse effects |
| Selective reporting (reporting bias) | Low risk | All outcomes reported |
| Methods | Multicenter, randomised, double‐blinded, parallel studies, four‐week run in, four‐week treatment | |
| Participants | N = 23, 12 men, mean age = 49 years, primary hypertensive, mean BP 164/109 mmHg | |
| Interventions | Pafenolol 50 mg or 100 mg once daily, placebo | |
| Outcomes | Rest and exercise BP, heart rate, dropouts | |
| Notes | ||
| Risk of bias | ||
| Bias | Authors' judgement | Support for judgement |
| Random sequence generation (selection bias) | Low risk | No information, but baseline groups were balanced |
| Allocation concealment (selection bias) | Unclear risk | No information |
| Blinding of participants and personnel (performance bias) | Low risk | Placebo was used. But no description on the placebo tablet |
| Blinding of outcome assessment (detection bias) | High risk | Did not use automated machine |
| Incomplete outcome data (attrition bias) | Unclear risk | All patients were accounted for. Did not mention the procedure to process dropout patients |
| Selective reporting (reporting bias) | Low risk | All outcomes reported |
| Methods | Multi‐center, randomised, double‐blinded, placebo‐controlled parallel study. Four‐week to six‐week run in period, four‐week treatment period | |
| Participants | N = 276, 70% men, mean age = 53 years, mean baseline BP 149/100 mmHg, primary hypertension without any condition that might influence blood pressure | |
| Interventions | Bisoprolol 5 mg, 10 mg, 20 mg once daily, placebo | |
| Outcomes | SBP, DBP, heart rate | |
| Notes | ||
| Risk of bias | ||
| Bias | Authors' judgement | Support for judgement |
| Random sequence generation (selection bias) | Low risk | No information but baseline was balanced |
| Allocation concealment (selection bias) | Unclear risk | No information |
| Blinding of participants and personnel (performance bias) | Low risk | Placebo was used |
| Blinding of outcome assessment (detection bias) | High risk | Did not use automated machine |
| Incomplete outcome data (attrition bias) | Unclear risk | No information on withdrawal |
| Selective reporting (reporting bias) | High risk | Did not report withdrawals due to adverse effects |
| Methods | Randomised, double‐blinded, placebo‐controlled cross‐over study, two‐week run in, six‐week treatment | |
| Participants | N = 34, 25 men, mean age= 47 years, DBP between 95 and 110 mmHg in three readings in 3 months. | |
| Interventions | Bisoprolol 5 mg once daily, amlodipine 5 mg once daily, doxazosin 1 mg to 4 mg once daily, lisinopril 2.5 mg to 10 mg once daily, bendrofluazide 2.5 mg once daily, placebo | |
| Outcomes | Resting BP, quality of life, ambulatory blood pressure monitoring, left ventricular function | |
| Notes | ||
| Risk of bias | ||
| Bias | Authors' judgement | Support for judgement |
| Random sequence generation (selection bias) | Low risk | "randomized with Latin square" |
| Allocation concealment (selection bias) | Unclear risk | No information |
| Blinding of participants and personnel (performance bias) | High risk | Physician determined which "best" treatment was repeated |
| Blinding of outcome assessment (detection bias) | Low risk | Automated machine was used |
| Incomplete outcome data (attrition bias) | Low risk | No dropouts |
| Selective reporting (reporting bias) | Low risk | All outcomes reported |
| Methods | Randomised, double‐blinded, placebo‐controlled, cross‐over study. Two‐week run‐in, six‐week treatment | |
| Participants | N = 30, 22 men, DBP > 95 mmHg after run in | |
| Interventions | Bisoprolol 5 mg once daily, amlodipine 5 mg once daily, doxazosin 4 mg once daily, lisinopril 10 mg once daily, bendrofluazide 2.5 mg once daily, placebo | |
| Outcomes | BP, heart rate, central BP, plasma atrial natriuretic peptide, pulse wave analysis | |
| Notes | ||
| Risk of bias | ||
| Bias | Authors' judgement | Support for judgement |
| Random sequence generation (selection bias) | Unclear risk | No information |
| Allocation concealment (selection bias) | Unclear risk | No information |
| Blinding of participants and personnel (performance bias) | High risk | The best treatment was repeated after rotation |
| Blinding of outcome assessment (detection bias) | Low risk | Automated machine was used |
| Incomplete outcome data (attrition bias) | Unclear risk | No information |
| Selective reporting (reporting bias) | Low risk | All outcomes reported |
| Methods | Randomised, double‐blinded, placebo‐controlled cross‐over study, two‐week run in, five‐week treatment period | |
| Participants | N = 16, 10 men, mean age 70 years, mean baseline BP 158/84 mmHg. Never‐treated subjects without secondary hypertension, diabetes, renal impairment | |
| Interventions | Atenolol 50 mg once daily, nebivolol 5 mg once daily, placebo | |
| Outcomes | SBP, DBP, heart rate, aortic augmentation index, biochemical analysis | |
| Notes | Isolated systolic hypertension | |
| Risk of bias | ||
| Bias | Authors' judgement | Support for judgement |
| Random sequence generation (selection bias) | Unclear risk | No information |
| Allocation concealment (selection bias) | Unclear risk | No information |
| Blinding of participants and personnel (performance bias) | Low risk | Placebo was used |
| Blinding of outcome assessment (detection bias) | Low risk | Automated machine was used |
| Incomplete outcome data (attrition bias) | High risk | Did not mention dropouts |
| Selective reporting (reporting bias) | Low risk | Did not report withdrawal due to adverse effects |
| Methods | Multi‐centre, randomised, double‐blinded placebo‐controlled parallel study. Four‐week to six‐week run in period, four‐week treatment period | |
| Participants | N = 509, 245 men, mean baseline BP = 151/100 mmHg, primary hypertension, no more than 10% below or 35% above ideal weight | |
| Interventions | Bisoprolol 5 mg once daily, hydrochlorothiazide 25 mg once daily, B5/H25 combination, placebo | |
| Outcomes | SBP, DBP, heart rate, withdrawal due to adverse effects | |
| Notes | It was unclear to which group participants who withdrew due to adverse effects belonged. | |
| Risk of bias | ||
| Bias | Authors' judgement | Support for judgement |
| Random sequence generation (selection bias) | Low risk | No information, but baseline was balanced |
| Allocation concealment (selection bias) | Unclear risk | No information |
| Blinding of participants and personnel (performance bias) | Low risk | Placebo tablet was used at the same frequency |
| Blinding of outcome assessment (detection bias) | High risk | Did not use automated machine |
| Incomplete outcome data (attrition bias) | Low risk | Did not report how they dealt with dropouts, but dropout rate was low |
| Selective reporting (reporting bias) | High risk | Withdrawal due to adverse effects was not reported based on treatment group |
| Methods | Randomised, double‐blinded, placebo‐controlled parallel study, four‐week to five‐week run in, nine‐week treatment period | |
| Participants | N = 1092, 57% men, mean age = 54, mean baseline BP 152.6/99.9 mmHg, primary hypertension without previous cardiovascular event or contraindication to beta blockers | |
| Interventions | Metoprolol 25 mg, 100 mg, 400 mg once daily, felodipine 2.5 mg, 10 mg, 20 mg, any of the combination of metoprolol and felodipine listed or placebo | |
| Outcomes | Rest trough SBP, DBP, safety | |
| Notes | ||
| Risk of bias | ||
| Bias | Authors' judgement | Support for judgement |
| Random sequence generation (selection bias) | Low risk | Computer‐generated randomisation |
| Allocation concealment (selection bias) | Low risk | Each centre has blocks of patients randomised to a group |
| Blinding of participants and personnel (performance bias) | Low risk | Double dummy design |
| Blinding of outcome assessment (detection bias) | High risk | Did not use automated machine |
| Incomplete outcome data (attrition bias) | Low risk | 11% of all patients dropouts. ITT analysis |
| Selective reporting (reporting bias) | Low risk | All outcomes reported, did not report withdrawal due to adverse effects according to treatment groups |
| Methods | Randomised, double‐blinded, placebo‐controlled cross‐over study, three‐week run in, six‐week treatment periods | |
| Participants | N = 8, all men, primary hypertension | |
| Interventions | Atenolol 100 mg twice daily, placebo | |
| Outcomes | Exercise/rest haemodynamic, metabolic effect | |
| Notes | Did not report SBP, DBP | |
| Risk of bias | ||
| Bias | Authors' judgement | Support for judgement |
| Random sequence generation (selection bias) | Unclear risk | No information |
| Allocation concealment (selection bias) | Unclear risk | No information |
| Blinding of participants and personnel (performance bias) | Low risk | Placebo was used |
| Blinding of outcome assessment (detection bias) | High risk | Did not use automated machine |
| Incomplete outcome data (attrition bias) | High risk | Did not mention dropouts |
| Selective reporting (reporting bias) | High risk | Did not report SBP, DBP, withdrawal due to adverse effects |
| Methods | Randomised, double‐blinded, placebo‐controlled parallel study, six‐week run in, eight‐week treatment period | |
| Participants | Mean SBP/DBP is 155/100 mmHg, mean age 51 years, mild to moderate hypertensive patients. 4161 randomized, 1386 to monotherapy groups | |
| Interventions | Nebivolol 10 mg/day and 40 mg/day, valsartan 160 mg/day and 320 mg/day, nebivolol and valsartan combination 10/160 mg/day, 10/320 mg/day, 20/320 mg/day and placebo | |
| Outcomes | Change of SBP, DBP and heart rate, withdrawal due to adverse effects | |
| Notes | ||
| Risk of bias | ||
| Bias | Authors' judgement | Support for judgement |
| Random sequence generation (selection bias) | Low risk | "Randomisation codes were generated by the Statistical Programming Department at the Forest Research Institute (Jersey City, NJ, USA) and implemented (including the maintenance of masking) by a 24‐h interactive web response system." |
| Allocation concealment (selection bias) | Unclear risk | No information |
| Blinding of participants and personnel (performance bias) | Low risk | "Tablets were identical in appearance, taste, and smell, and participants and research staff were masked to study drug treatment for the duration of the trial." |
| Blinding of outcome assessment (detection bias) | Low risk | Automated machine was used |
| Incomplete outcome data (attrition bias) | Low risk | Attrition was less than 10% |
| Selective reporting (reporting bias) | Low risk | All relevant outcomes were reported |
| Methods | Randomised, double‐blinded, placebo‐controlled cross‐over study, 12‐week run in, four‐week treatment period each | |
| Participants | N = 98, 84 were available for analysis, mean age 50.1 years, mean baseline BP 165.6/101.9 mmHg. Mild to moderate hypertension | |
| Interventions | Atenolol 50 mg, 100 mg, 200 mg once daily, placebo | |
| Outcomes | SBP, DBP, heart rate, blood urea, uric acid, serum electrolytes | |
| Notes | ||
| Risk of bias | ||
| Bias | Authors' judgement | Support for judgement |
| Random sequence generation (selection bias) | Low risk | Latin square design |
| Allocation concealment (selection bias) | Unclear risk | No information |
| Blinding of participants and personnel (performance bias) | Low risk | Placebo was used |
| Blinding of outcome assessment (detection bias) | High risk | Did not use automated machine |
| Incomplete outcome data (attrition bias) | Low risk | 14 dropouts, all patients accounted for |
| Selective reporting (reporting bias) | Low risk | All outcomes reported |
| Methods | Randomised, double‐blinded, placebo‐controlled cross‐over study, three‐week run in, six‐week treatment period | |
| Participants | N = 7, four men, mean age = 52 years, mean baseline BP 154/97. Primary hypertension diagnosed for at least one year, normal ECG, blood count, serum electrolyte, normal liver and renal function | |
| Interventions | Metoprolol 100 mg twice daily, placebo | |
| Outcomes | SBP, DBP, blood glucose, hormone | |
| Notes | ||
| Risk of bias | ||
| Bias | Authors' judgement | Support for judgement |
| Random sequence generation (selection bias) | Unclear risk | No information |
| Allocation concealment (selection bias) | Unclear risk | No information |
| Blinding of participants and personnel (performance bias) | Low risk | Placebo was used |
| Blinding of outcome assessment (detection bias) | High risk | Did not use automated machine |
| Incomplete outcome data (attrition bias) | Unclear risk | No information |
| Selective reporting (reporting bias) | High risk | Did not report dropouts |
| Methods | Randomised, double‐blinded, placebo‐controlled parallel study, 16‐week treatment periods (data for weeks 4, 8 and 12 were reported and used in analysis) | |
| Participants | N = 45, 26 men, mean age 46 years, mean baseline BP 169/106 mmHg. Primary hypertension | |
| Interventions | Atenolol 50 mg twice daily, placebo | |
| Outcomes | SBP, DBP, heart rate, withdrawal due to adverse effects | |
| Notes | ||
| Risk of bias | ||
| Bias | Authors' judgement | Support for judgement |
| Random sequence generation (selection bias) | Unclear risk | No information |
| Allocation concealment (selection bias) | Unclear risk | No information |
| Blinding of participants and personnel (performance bias) | Low risk | Placebo was used |
| Blinding of outcome assessment (detection bias) | High risk | Did not use automated machine |
| Incomplete outcome data (attrition bias) | Low risk | One patient withdrew |
| Selective reporting (reporting bias) | Low risk | All outcomes reported |
| Methods | Randomised, double‐blinded, placebo‐controlled cross‐over study. Four‐week run in, four‐week treatment period | |
| Participants | N = 14. 12 men and 3 women, mean age 50 years, 95 < DBP < 110 mmHg, primary hypertension | |
| Interventions | Nebivolol 5 mg once daily, placebo | |
| Outcomes | SBP, DBP, heart rate, ambulatory blood pressure monitoring, blood chemistry | |
| Notes | ||
| Risk of bias | ||
| Bias | Authors' judgement | Support for judgement |
| Random sequence generation (selection bias) | Unclear risk | No information |
| Allocation concealment (selection bias) | Unclear risk | No information |
| Blinding of participants and personnel (performance bias) | Low risk | Placebo was used |
| Blinding of outcome assessment (detection bias) | Unclear risk | Did not use machine |
| Incomplete outcome data (attrition bias) | Unclear risk | Did not mention dropouts |
| Selective reporting (reporting bias) | High risk | Withdrawal due to adverse effects was not reported |
| Methods | Randomised, double‐blinded, placebo‐controlled parallel study, two‐week to four‐week run in, eight‐week treatment period | |
| Participants | N = 92, 61% men, mean age 48 years, mean baseline BP 140/96.5 mmHg. Primary hypertension without renal, hepatic disease, neoplastic or peripheral vascular diseases | |
| Interventions | Atenolol 25 mg, 50 mg twice daily (only 50 mg twice daily result was available), clonidine 0.1 mg, 0.2 mg twice daily, placebo | |
| Outcomes | SBP, DBP, serum lipid | |
| Notes | ||
| Risk of bias | ||
| Bias | Authors' judgement | Support for judgement |
| Allocation concealment (selection bias) | Low risk | |
| Blinding of participants and personnel (performance bias) | Low risk | |
| Blinding of outcome assessment (detection bias) | High risk | |
| Selective reporting (reporting bias) | High risk | |
| Methods | Randomised, double‐blinded, placebo‐controlled parallel study, two‐week run in, four‐week treatment period. This publication contained two studies with two sets of patients, we combined their data as one RCT | |
| Participants | N = 99, 45 men, mean age = 59 years, mean baseline BP 169/101 mmHg, primary hypertension, without heart failure, diabetes and asthma | |
| Interventions | Metoprolol 50 mg once daily, placebo | |
| Outcomes | SBP, DBP, heart rate, response rate, safety | |
| Notes | ||
| Risk of bias | ||
| Bias | Authors' judgement | Support for judgement |
| Random sequence generation (selection bias) | Unclear risk | No information |
| Allocation concealment (selection bias) | Unclear risk | No information |
| Blinding of participants and personnel (performance bias) | Low risk | Placebo was used |
| Blinding of outcome assessment (detection bias) | High risk | Did not use automated machine |
| Incomplete outcome data (attrition bias) | Low risk | Did not report dropouts, but only three patients' data were missing at the end |
| Selective reporting (reporting bias) | High risk | Did not report withdrawal due to adverse effects |
| Methods | Randomised, double‐blinded, placebo‐controlled cross‐over study, four‐week run in, four‐week treatment period | |
| Participants | N = 21, eight men, mean age 53 years, mean baseline BP 161.7/111.5 mmHg | |
| Interventions | Atenolol 50 mg, 100 mg, 200 mg once daily, placebo | |
| Outcomes | SBP, DBP, heart rate | |
| Notes | ||
| Risk of bias | ||
| Bias | Authors' judgement | Support for judgement |
| Random sequence generation (selection bias) | Low risk | Order of administration was determined by a random code |
| Allocation concealment (selection bias) | Low risk | Participant received pre‐packed container |
| Blinding of participants and personnel (performance bias) | Low risk | Placebo was used |
| Blinding of outcome assessment (detection bias) | Low risk | Automated machine was used |
| Incomplete outcome data (attrition bias) | Low risk | Two participants dropped out |
| Selective reporting (reporting bias) | Low risk | Withdrawal due to adverse effects was reported but not according to treatment group |
| Methods | Randomised, double‐blinded, placebo‐controlled parallel study. Eight‐week run‐in, 12‐week treatment period | |
| Participants | N = 240 (226 completed), 95 < DBP < 110 mmHg, mild to moderate primary hypertension | |
| Interventions | Nebivolol 1 mg, 5 mg, 10 mg once daily, Hydrochlorothiazide 12.5 mg, 25, mg once daily, every possible combination of the two drugs, placebo | |
| Outcomes | SBP, DBP, lipids, lipoprotein, apolipoprotein, routine lab parameters | |
| Notes | ||
| Risk of bias | ||
| Bias | Authors' judgement | Support for judgement |
| Random sequence generation (selection bias) | Unclear risk | No information |
| Allocation concealment (selection bias) | Unclear risk | No information |
| Blinding of participants and personnel (performance bias) | Low risk | Placebo was used |
| Blinding of outcome assessment (detection bias) | High risk | Did not use automated machine |
| Incomplete outcome data (attrition bias) | Low risk | Did not report the procedure to deal with dropout data. But only 6% patients dropped out |
| Selective reporting (reporting bias) | Low risk | Did not report withdrawal due to adverse effects or heart rate |
| Methods | Randomised, double‐blinded, placebo‐controlled cross‐over study. Four‐week run in, four‐week treatment period | |
| Participants | N = 34, 17 men, mean age = 54.1 years, mean baseline BP 160/100, primary hypertension | |
| Interventions | Metoprolol 100 mg twice daily, propranolol 80 mg twice daily, placebo | |
| Outcomes | SBP, DBP, peripheral vascular resistance | |
| Notes | ||
| Risk of bias | ||
| Bias | Authors' judgement | Support for judgement |
| Random sequence generation (selection bias) | Unclear risk | No information |
| Allocation concealment (selection bias) | Unclear risk | No information |
| Blinding of participants and personnel (performance bias) | Low risk | Placebo was used |
| Blinding of outcome assessment (detection bias) | High risk | Did not use automated machine |
| Incomplete outcome data (attrition bias) | Low risk | No dropouts |
| Selective reporting (reporting bias) | Unclear risk | Did not report withdrawal due to adverse effects |
| Methods | Randomised, double‐blinded, placebo‐controlled cross‐over study, two‐week run in, four‐week treatment periods | |
| Participants | N = 128, 60 men, mean age 54 years for women, 52 years for men, mean baseline BP 167/111.3 mmHg. Primary hypertension without hepatic or renal diseases, obesity | |
| Interventions | Atenolol 100 mg once daily, amiloride 5 mg/hydrochlorothiazide 50 mg once daily, placebo | |
| Outcomes | SBP, DBP, heart rate | |
| Notes | Data for women and men were reported separately. We combined the data according to the recommendation of the Cochrane Handbook for Systematic Reviews of Interventions | |
| Risk of bias | ||
| Bias | Authors' judgement | Support for judgement |
| Random sequence generation (selection bias) | Unclear risk | No information |
| Allocation concealment (selection bias) | Unclear risk | No information |
| Blinding of participants and personnel (performance bias) | Low risk | Placebo was used |
| Blinding of outcome assessment (detection bias) | High risk | Did not use automated machine |
| Incomplete outcome data (attrition bias) | Low risk | Data of withdrawn patients were not included |
| Selective reporting (reporting bias) | Low risk | All outcomes reported |
| Methods | Randomised, double‐blinded, placebo‐controlled parallel study, three‐week run in, six‐week treatment period | |
| Participants | N = 136, primary hypertensive patients. Exclusion: renal or hepatic impairment, COPD, diabetes, peripheral vascular diseases, heart failure, heart block, myocardial infarction | |
| Interventions | Atenolol 50 mg once daily, nitrendipine 20 mg once daily, atenolol 50 mg/nitrendipine 20 mg, placebo | |
| Outcomes | SBP, DBP, adverse effects | |
| Notes | ||
| Risk of bias | ||
| Bias | Authors' judgement | Support for judgement |
| Random sequence generation (selection bias) | Unclear risk | No information |
| Allocation concealment (selection bias) | Low risk | Double dummy design |
| Blinding of participants and personnel (performance bias) | Low risk | Placebo was used |
| Blinding of outcome assessment (detection bias) | High risk | Did not use automated machine |
| Incomplete outcome data (attrition bias) | Low risk | 11 patients dropped out. All reasons were stated |
| Selective reporting (reporting bias) | Low risk | All outcomes reported |
| Methods | Randomised, double‐blinded, placebo‐controlled cross‐over study, six‐week treatment period | |
| Participants | N = 12, eight men, mean age 52.8 years, mean baseline BP 173/109 mmHg. Primary hypertension, without atrioventricular block, history of hepatic or renal diseases, diabetes, alcoholism, asthma, myocardial infarction, stroke, congestive heart failure, bradycardia. | |
| Interventions | Atenolol 100 mg once daily, hydrochlorothiazide 50 mg once daily, placebo | |
| Outcomes | SBP, DBP, heart rate, biochemical test | |
| Notes | ||
| Risk of bias | ||
| Bias | Authors' judgement | Support for judgement |
| Random sequence generation (selection bias) | Unclear risk | No information |
| Allocation concealment (selection bias) | Unclear risk | No information |
| Blinding of participants and personnel (performance bias) | Low risk | Double dummy design |
| Blinding of outcome assessment (detection bias) | Low risk | Did not use automated machine |
| Incomplete outcome data (attrition bias) | Low risk | Three patients dropped out, their data were not included in analysis |
| Selective reporting (reporting bias) | High risk | Dropouts were reported, but did not provide reason |
| Methods | Multi‐center, randomised, double‐blinded, placebo‐controlled, parallel study, 12‐week treatment period | |
| Participants | N = 807, 53.5% men, mean age = 53.4 years, mean baseline BP 151/99 mmHg. Primary hypertension, without asthma and COPD, renal and liver diseases, insulin dependent diabetes | |
| Interventions | Nebivolol 5 mg, 10 mg, 20 mg once daily, placebo | |
| Outcomes | Rest peak/trough SBP, DBP, withdrawal due to adverse effects, response rate | |
| Notes | ||
| Risk of bias | ||
| Bias | Authors' judgement | Support for judgement |
| Random sequence generation (selection bias) | Low risk | No information, however, the baseline demographic was similar in each group |
| Allocation concealment (selection bias) | Unclear risk | No information |
| Blinding of participants and personnel (performance bias) | Unclear risk | Placebo was used |
| Blinding of outcome assessment (detection bias) | High risk | Did not use automated machine |
| Incomplete outcome data (attrition bias) | Low risk | All patients accounted for. Analysis was ITT LOCF |
| Selective reporting (reporting bias) | Low risk | All outcomes reported |
| Methods | Randomised, double‐blinded, placebo‐controlled parallel study. After four weeks of placebo washout, patients were randomised to treatment. During the first two weeks of treatment, patients randomised to high dose were force titrated to respective dosage. After that, doses were fixed for the duration of next six weeks | |
| Participants | N = 139 (87 male) 100 mmHg < DBP < 120 mmHg | |
| Interventions | Bevantolol 50 mg twice daily, 100 mg twice daily, 150 mg twice daily, 200 mg twice daily or placebo | |
| Outcomes | SBP, DBP, heart rate, withdrawal due to adverse effects, adverse effect, clinical lab | |
| Notes | Three withdrawalw due to adverse effects in bevantolol, none in placebo | |
| Risk of bias | ||
| Bias | Authors' judgement | Support for judgement |
| Random sequence generation (selection bias) | Low risk | No information, but baseline was balanced |
| Allocation concealment (selection bias) | Unclear risk | No information |
| Blinding of participants and personnel (performance bias) | Low risk | Placebos were given at the same frequency as active treatment |
| Blinding of outcome assessment (detection bias) | Unclear risk | No information on follow up |
| Incomplete outcome data (attrition bias) | Low risk | Withdrawal due to adverse effects were reported |
| Selective reporting (reporting bias) | Low risk | Haemodynamic data were primary outcomes, withdrawal due to adverse effects were reported in detail |
| Methods | Multicenter, randomised, double‐blinded, placebo‐controlled, parallel study. Four‐week to five‐week run in, eight‐week treatment period | |
| Participants | N = 1571, 51% men, mean age = 53 years, mean baseline BP 151/100 mmHg. Primary hypertension without heart failure, recent MI, contraindication for beta blockers | |
| Interventions | Metoprolol 25 mg, 50 mg, 100 mg, 200 mg once daily, Hydrochlorothiazide 6.25 mg, 12.5 mg, 25 mg once daily, any combination of the two drugs, placebo | |
| Outcomes | Trough SBP, DBP, haematology, lipid, urinalysis, ECG | |
| Notes | ||
| Risk of bias | ||
| Bias | Authors' judgement | Support for judgement |
| Random sequence generation (selection bias) | Low risk | Central, computer‐generated random sequence |
| Allocation concealment (selection bias) | Low risk | Interactive voice response system allocated patients to treatment groups |
| Blinding of participants and personnel (performance bias) | Low risk | Double dummy design |
| Blinding of outcome assessment (detection bias) | High risk | Did not use automated machine |
| Incomplete outcome data (attrition bias) | Low risk | 2.9% withdrawal due to adverse effects, ITT analysis |
| Selective reporting (reporting bias) | High risk | Peak pressure was mentioned in protocol but not reported, withdrawal due to adverse effects was not reported according to treatment groups |
| Methods | Randomised, double‐blinded, placebo‐controlled cross‐over study. After 14 days of washout period, patients were randomised to a sequence of four‐week treatments | |
| Participants | N = 24 (13 male) 105 < DBP < 125 mmHg Exclusion: recent MI, evidence of heart failure, heart block, gross ischaemia, grade III or IV retinopathy, diabetes, gout, impaired liver function, or creatinine clearance less than 60 ml/min or if they were on any other drug treatment | |
| Interventions | Methyldopa 250 mg thrice daily, practolol 200 mg thrice daily, propranolol 80 mg thrice daily, methyldopa 250 mg and propranolol 80 mg thrice daily, methyldopa 250 mg and practolol 200 mg thrice daily or placebo | |
| Outcomes | SBP, DBP, heart rate, quality of life | |
| Notes | SD were imputed using the average of other studies that provided SD | |
| Risk of bias | ||
| Bias | Authors' judgement | Support for judgement |
| Random sequence generation (selection bias) | Unclear risk | No information |
| Allocation concealment (selection bias) | Low risk | Drug packages were pre‐packed |
| Blinding of participants and personnel (performance bias) | Low risk | Participants took the same number of pills |
| Blinding of outcome assessment (detection bias) | Low risk | |
| Incomplete outcome data (attrition bias) | Low risk | No dropouts |
| Selective reporting (reporting bias) | High risk | SD were not reported |
| Methods | Randomised, double‐blinded, placebo‐controlled cross‐over study, four‐week run in, four‐week treatment periods | |
| Participants | N = 23, 12 men, mean age 40.9 years, mean baseline BP 155/109.4 mmHg. | |
| Interventions | Atenolol 100 mg once daily, oxprenolol 160 mg once daily, propranolol 160 mg once daily, placebo | |
| Outcomes | SBP, DBP | |
| Notes | ||
| Risk of bias | ||
| Bias | Authors' judgement | Support for judgement |
| Random sequence generation (selection bias) | Unclear risk | No information |
| Allocation concealment (selection bias) | Unclear risk | No information |
| Blinding of participants and personnel (performance bias) | Low risk | Placebo was used |
| Blinding of outcome assessment (detection bias) | High risk | Did not use automated machine |
| Incomplete outcome data (attrition bias) | High risk | Did not report dropouts |
| Selective reporting (reporting bias) | High risk | Did not report withdrawal due to adverse effects |
| Methods | Randomised, double‐blinded, placebo‐controlled cross‐over study, four‐week run in, four‐week treatment periods | |
| Participants | N = 21, all men, age range 31 years to 70 years, mean baseline BP 157/101.9 mmHg | |
| Interventions | Atenolol 100 mg once daily, propranolol 80 mg twice daily, alpha‐methyldopa 500 mg twice daily, hydrochlorothiazide/triamterene 50 mg/25 mg twice daily, placebo | |
| Outcomes | SBP, DBP, sleep assessment, sexual function questionnaire | |
| Notes | 8 of 21 patients withdrew from the study | |
| Risk of bias | ||
| Bias | Authors' judgement | Support for judgement |
| Random sequence generation (selection bias) | Low risk | Modified Latin square |
| Allocation concealment (selection bias) | Unclear risk | No information |
| Blinding of participants and personnel (performance bias) | High risk | No indication that placebo was used at same frequency |
| Blinding of outcome assessment (detection bias) | High risk | Did not use automated machine |
| Incomplete outcome data (attrition bias) | High risk | 40% of patient dropouts |
| Selective reporting (reporting bias) | Low risk | All outcomes reported |
| Methods | Multi‐center, randomised, double‐blinded, placebo‐controlled, parallel study. Four‐week run‐in, 12‐week treatment period | |
| Participants | N = 300, 45.3% men, mean age = 50.9 years, mean baseline BP 152.2/100.2 mmHg. Primary hypertensive, BMI < 40, no cardiovascular condition or diabetes | |
| Interventions | Nebivolol 2.5 mg, 5 mg, 10 mg, 20 mg, 40 mg once daily, placebo | |
| Outcomes | Rest peak/trough SBP, DBP, heart rate, ECG, lab parameters | |
| Notes | ||
| Risk of bias | ||
| Bias | Authors' judgement | Support for judgement |
| Random sequence generation (selection bias) | Unclear risk | No information |
| Allocation concealment (selection bias) | Unclear risk | No information |
| Blinding of participants and personnel (performance bias) | Low risk | Placebo was used |
| Blinding of outcome assessment (detection bias) | High risk | Did not use automated machine |
| Incomplete outcome data (attrition bias) | Low risk | ITT LOCF was used for analysis |
| Selective reporting (reporting bias) | Low risk | All outcomes reported |
| Methods | Randomised, double‐blinded, placebo‐controlled cross‐over study, four‐week treatment period | |
| Participants | N = 24, Africans with primary hypertension. Exclusion criteria: heart failure, asthma, MI, heart block, pregnancy, impaired renal and hepatic function | |
| Interventions | Atenolol 100 mg once daily, chlorthalidone 25 mg once daily, combination of two drugs, placebo | |
| Outcomes | SBP, DBP, heart rate, plasma renin activity, serum potassium | |
| Notes | ||
| Risk of bias | ||
| Bias | Authors' judgement | Support for judgement |
| Random sequence generation (selection bias) | Unclear risk | No information |
| Allocation concealment (selection bias) | Unclear risk | No information |
| Blinding of participants and personnel (performance bias) | Low risk | Placebo was used |
| Blinding of outcome assessment (detection bias) | High risk | Did not use automated machine |
| Incomplete outcome data (attrition bias) | Unclear risk | Did not mention dropouts |
| Selective reporting (reporting bias) | High risk | Withdrawal due to adverse effects was not mentioned |
| Methods | Randomised, double‐blinded, placebo‐controlled cross‐over study, three‐week run in, six‐week treatment periods | |
| Participants | N = 12, four men, mean age 51.9 years, primary hypertension with non–insulin‐dependent diabetes mellitus, persistent aluminuria, no evidence of urinary tract infection, other kidney disease | |
| Interventions | Atenolol 50 mg once daily, enalapril 20 mg once daily, chlorthalidone 12.5 mg once daily, placebo | |
| Outcomes | SBP, DBP, Heart rate, renal vascular resistance, filtration fraction, blood chemistry | |
| Notes | ||
| Risk of bias | ||
| Bias | Authors' judgement | Support for judgement |
| Random sequence generation (selection bias) | Unclear risk | No information |
| Allocation concealment (selection bias) | Unclear risk | No information |
| Blinding of participants and personnel (performance bias) | Low risk | Placebo was used |
| Blinding of outcome assessment (detection bias) | Low risk | Automated machine was used |
| Incomplete outcome data (attrition bias) | Low risk | No dropouts |
| Selective reporting (reporting bias) | Low risk | All outcomes reported |
| Methods | Randomised, double‐blinded, placebo‐controlled parallel study, four‐week run in, four‐week treatment periods | |
| Participants | N = 232. Exclusion: history of heart disease or asthma | |
| Interventions | Atenolol 50 mg once daily, celiprolol 200 mg, 400 mg, 600 mg once daily, placebo | |
| Outcomes | SBP, DBP | |
| Notes | ||
| Risk of bias | ||
| Bias | Authors' judgement | Support for judgement |
| Random sequence generation (selection bias) | Unclear risk | No information |
| Allocation concealment (selection bias) | Low risk | Double dummy design |
| Blinding of participants and personnel (performance bias) | Low risk | Placebo was used |
| Blinding of outcome assessment (detection bias) | High risk | Did not use automated machine |
| Incomplete outcome data (attrition bias) | Unclear risk | Did not report dropout rate |
| Selective reporting (reporting bias) | High risk | Did not report withdrawal due to adverse effects |
| Methods | Randomised, double‐blinded, placebo‐controlled cross‐over study, four‐week run in, four‐week treatment periods | |
| Participants | N = 15, seven men, median age 61 years, primary hypertension patients. Exclusion criteria: diabetes, cardiac disease, COPD, impaired renal or hepatic function | |
| Interventions | Atenolol 50 mg once daily, diltiazem 60 mg once daily, combination of two drugs, placebo | |
| Outcomes | SBP, DBP, ECG, haematology, adverse events | |
| Notes | ||
| Risk of bias | ||
| Bias | Authors' judgement | Support for judgement |
| Random sequence generation (selection bias) | Low risk | 4 x 4 Latin square design |
| Allocation concealment (selection bias) | Unclear risk | No information |
| Blinding of participants and personnel (performance bias) | Low risk | Placebo was used |
| Blinding of outcome assessment (detection bias) | High risk | Did not use automated machine |
| Incomplete outcome data (attrition bias) | Low risk | 2 dropouts |
| Selective reporting (reporting bias) | Low risk | All outcomes reported |
| Methods | Randomised, double‐blinded, placebo‐controlled parallel study. Two‐ week to four‐week run in period, three‐week treatment period | |
| Participants | N = 65, 35 men, mean age = 51 years, mean baseline BP 160/101 mmHg, primary hypertension without any co‐morbidity | |
| Interventions | Bisoprolol 5 mg, 10 mg once daily or placebo | |
| Outcomes | DBP, heart rate, response rate, biochemical haematological change, ECG | |
| Notes | ||
| Risk of bias | ||
| Bias | Authors' judgement | Support for judgement |
| Random sequence generation (selection bias) | Low risk | No information, but baseline was balanced |
| Allocation concealment (selection bias) | Unclear risk | No information |
| Blinding of participants and personnel (performance bias) | Low risk | Placebo was used |
| Blinding of outcome assessment (detection bias) | High risk | Did not use automated machine |
| Incomplete outcome data (attrition bias) | High risk | Did not report dropouts |
| Selective reporting (reporting bias) | High risk | Did not report SBP |
| Methods | Randomised, double‐blinded, placebo‐controlled cross‐over study. Four‐week run in, four‐week treatment period | |
| Participants | N = 114, 76 men, mean age = 54, 95 < DBP < 120 mmHg, primary hypertension, normal liver and renal function, no history of heart failure, severe vascular disease, uncontrolled diabetes | |
| Interventions | Nebivolol 5 mg once daily, placebo | |
| Outcomes | BP, heart rate, quality of life, ECG, lab parameters | |
| Notes | Only 80 patients randomised to cross‐over group | |
| Risk of bias | ||
| Bias | Authors' judgement | Support for judgement |
| Random sequence generation (selection bias) | Unclear risk | No information |
| Allocation concealment (selection bias) | Unclear risk | No information |
| Blinding of participants and personnel (performance bias) | Low risk | Placebo was used |
| Blinding of outcome assessment (detection bias) | High risk | Did not use automated machine |
| Incomplete outcome data (attrition bias) | Low risk | No dropouts |
| Selective reporting (reporting bias) | Low risk | All outcomes reported |
| Methods | Randomised, double‐blinded, placebo‐controlled cross‐over study, four‐week treatment period | |
| Participants | N = 8, mean age = 34 years | |
| Interventions | Metoprolol 100 mg thrice daily, propranolol 80 mg thrice daily, placebo | |
| Outcomes | Rest and adrenaline infused SBP, DBP, heart rate | |
| Notes | ||
| Risk of bias | ||
| Bias | Authors' judgement | Support for judgement |
| Random sequence generation (selection bias) | Unclear risk | No information |
| Allocation concealment (selection bias) | Unclear risk | No information |
| Blinding of participants and personnel (performance bias) | Low risk | Placebo was used |
| Blinding of outcome assessment (detection bias) | High risk | Did not use automated machine |
| Incomplete outcome data (attrition bias) | Low risk | No dropouts |
| Selective reporting (reporting bias) | Low risk | All outcomes reported |
| Methods | Randomised, double‐blinded, placebo‐controlled cross‐over study. Four‐week run in, four‐week treatment period | |
| Participants | N = 29, 21 men, primary hypertension with normal kidney and liver functions | |
| Interventions | Nebivolol 5 mg once daily, placebo | |
| Outcomes | SBP, DBP, pulse pressure, carotid diameter and compliance | |
| Notes | ||
| Risk of bias | ||
| Bias | Authors' judgement | Support for judgement |
| Random sequence generation (selection bias) | Unclear risk | No information |
| Allocation concealment (selection bias) | Unclear risk | No information |
| Blinding of participants and personnel (performance bias) | Low risk | Identical placebo was used |
| Blinding of outcome assessment (detection bias) | Low risk | Automated machine was used |
| Incomplete outcome data (attrition bias) | Unclear risk | Did not mention dropout |
| Selective reporting (reporting bias) | High risk | Did not report withdrawal due to adverse effects |
| Methods | Multi‐centered, randomised, double‐blinded, placebo‐controlled, parallel study. Four‐week run in, four‐week treatment period | |
| Participants | N = 509, 53% men, baseline mean BP 158.4/102.7 mmHg. Exclusion criteria: secondary hypertension, asthma and COPD, bradycardia, AV block, insulin dependent diabetes, MI or stroke in past six months, heart failure, renal hepatic disease, 50% over weight base on BMI | |
| Interventions | Nebivolol 0.5 mg, 1 mg, 2.5 mg, 5 mg, 10 mg once daily, placebo | |
| Outcomes | Rest peak/trough BP, ECG, lab parameters, symptom score, withdrawal due to adverse effects | |
| Notes | ||
| Risk of bias | ||
| Bias | Authors' judgement | Support for judgement |
| Random sequence generation (selection bias) | Low risk | Computer‐generated random sequence |
| Allocation concealment (selection bias) | Unclear risk | No information |
| Blinding of participants and personnel (performance bias) | Low risk | Placebo tablets were identical in appearance and taste |
| Blinding of outcome assessment (detection bias) | High risk | Did not use automated machine |
| Incomplete outcome data (attrition bias) | Low risk | All dropouts reported, dropout rate was low |
| Selective reporting (reporting bias) | Low risk | All outcomes reported |
| Methods | Randomised, double‐blinded, placebo‐controlled parallel study, four‐week run in, four‐week treatment period | |
| Participants | N = 364, 191 men, mean age = 55 years, mean baseline BP 166.5/104 mmHg. Primary hypertension, previously untreated or responded poorly to previous treatment | |
| Interventions | Nebivolol 5 mg once daily, Atenolol 50 mg once daily, placebo | |
| Outcomes | SBP, DBP, adverse event, ECG, blood chemistry, haematology, urine test | |
| Notes | ||
| Risk of bias | ||
| Bias | Authors' judgement | Support for judgement |
| Random sequence generation (selection bias) | Low risk | Computer‐generated randomisation |
| Allocation concealment (selection bias) | Unclear risk | No information |
| Blinding of participants and personnel (performance bias) | Low risk | All tablets were identical |
| Blinding of outcome assessment (detection bias) | High risk | Did not use automated machine |
| Incomplete outcome data (attrition bias) | Low risk | 4 patients were lost to follow‐up at the end |
| Selective reporting (reporting bias) | High risk | Did not report withdrawal due to adverse effects |
| Methods | Randomised, double‐blinded, placebo‐controlled cross‐over study, three‐week run in, three‐week treatment periods | |
| Participants | N = 15, all men, mean age 39.4 years, mean baseline BP 166/93 | |
| Interventions | Atenolol 50 mg once daily, verapamil 240 mg once daily, enalapril 10 mg once daily, matching placebo | |
| Outcomes | Exercise tolerance, rest SBP, DBP, exercise parameters, urine and blood analysis | |
| Notes | ||
| Risk of bias | ||
| Bias | Authors' judgement | Support for judgement |
| Random sequence generation (selection bias) | Unclear risk | No information |
| Allocation concealment (selection bias) | Unclear risk | No information |
| Blinding of participants and personnel (performance bias) | Low risk | Placebo was used |
| Blinding of outcome assessment (detection bias) | High risk | Did not use automated machine |
| Incomplete outcome data (attrition bias) | Low risk | Dropouts were accounted for |
| Selective reporting (reporting bias) | Low risk | All outcomes reported |
| Methods | Randomised, double‐blinded, placebo‐controlled cross‐over study, two‐week placebo, four‐week treatment period | |
| Participants | N = 20, 14 men, mean age = 44 years, mean baseline BP 165.5/108.3, primary hypertension with normal ECG | |
| Interventions | Metoprolol 200 mg once daily, placebo | |
| Outcomes | SBP, DBP, heart rate, systolic time interval | |
| Notes | ||
| Risk of bias | ||
| Bias | Authors' judgement | Support for judgement |
| Random sequence generation (selection bias) | Unclear risk | No information |
| Allocation concealment (selection bias) | Unclear risk | No information |
| Blinding of participants and personnel (performance bias) | Low risk | Placebo was used |
| Blinding of outcome assessment (detection bias) | High risk | Did not use automated machine |
| Incomplete outcome data (attrition bias) | Low risk | No dropouts |
| Selective reporting (reporting bias) | Low risk | All outcomes reported |
| Methods | Randomised, double‐blinded, placebo‐controlled cross‐over study, three‐week run in, four‐week treatment periods | |
| Participants | N = 12, five men, mean age 48.6 years, primary hypertension | |
| Interventions | Atenolol 100 mg once daily, placebo | |
| Outcomes | SBP, DBP, heart rate, ambulatory blood pressure monitoring, withdrawal due to adverse effects | |
| Notes | ||
| Risk of bias | ||
| Bias | Authors' judgement | Support for judgement |
| Random sequence generation (selection bias) | Low risk | 4 x 4 Latin square design |
| Allocation concealment (selection bias) | Unclear risk | No information |
| Blinding of participants and personnel (performance bias) | Low risk | Placebo was used |
| Blinding of outcome assessment (detection bias) | High risk | Did not use automated machine |
| Incomplete outcome data (attrition bias) | Low risk | No dropouts |
| Selective reporting (reporting bias) | Low risk | All outcomes reported |
| Methods | Multi‐center, randomised, double‐blinded, placebo‐controlled, parallel study. Two‐week run‐in, 12‐week treatment period | |
| Participants | N = 909, 57% men, mean age = 54.7 years, mean baseline BP 153.1/99.5 mmHg. Primary hypertensive, BMI < 35, no history of cardiovascular disease or diabetes | |
| Interventions | Nebivolol 1.25 mg, 2.5mg , 5 mg, 10 mg, 20 mg, 40 mg once daily, placebo | |
| Outcomes | Rest peak/trough SBP, DBP, heart rate, safety | |
| Notes | Not all patients in 40 mg group took 40 mg, therefore we excluded this group | |
| Risk of bias | ||
| Bias | Authors' judgement | Support for judgement |
| Random sequence generation (selection bias) | Unclear risk | No information |
| Allocation concealment (selection bias) | Unclear risk | No information |
| Blinding of participants and personnel (performance bias) | Low risk | Placebo was used |
| Blinding of outcome assessment (detection bias) | High risk | Did not use automated machine |
| Incomplete outcome data (attrition bias) | Low risk | Data was presented as ITT LOCF |
| Selective reporting (reporting bias) | Low risk | All data reported |
| Methods | Randomised, double‐blinded, placebo‐controlled parallel study. Participants entered a three‐week to four‐week placebo run in period, during which they were instructed to take the capsule at 10 am every morning. Patients who met the entry criteria were randomised to one of the 4 treatment groups for another five weeks. After the fixed dose period, there was a one‐week follow‐up period | |
| Participants | N = 317 Patients with mean DBP between 95 mmHg and 110 mmHg during the run in period were eligible for randomization | |
| Interventions | Betaxolol 5 mg, 10 mg, 20 mg once daily or placebo | |
| Outcomes | SBP, DBP, heart rate, withdrawal, adverse effects | |
| Notes | ||
| Risk of bias | ||
| Bias | Authors' judgement | Support for judgement |
| Random sequence generation (selection bias) | Low risk | No information, but baseline was balanced |
| Allocation concealment (selection bias) | Unclear risk | No information |
| Blinding of participants and personnel (performance bias) | Low risk | Placebo capsules were used in same frequency |
| Blinding of outcome assessment (detection bias) | Low risk | Withdrawn were accounted for and not included in analysis |
| Incomplete outcome data (attrition bias) | Low risk | All reasons for withdrawal were reported |
| Selective reporting (reporting bias) | Low risk | All outcomes reported |
| Methods | Randomised, double‐blinded, placebo‐controlled cross‐over study, four‐week run in, four‐week treatment periods | |
| Participants | N = 16, six men, mean age 59 years. Primary hypertension without target organ damage | |
| Interventions | Atenolol 50 mg once daily, enalapril 20 mg once daily, atenolol/enalapril combination, placebo | |
| Outcomes | SBP, DBP, heart rate, blood chemical analysis | |
| Notes | ||
| Risk of bias | ||
| Bias | Authors' judgement | Support for judgement |
| Random sequence generation (selection bias) | Low risk | 4 x 4 Latin square design |
| Allocation concealment (selection bias) | Unclear risk | No information |
| Blinding of participants and personnel (performance bias) | Low risk | Placebo was used |
| Blinding of outcome assessment (detection bias) | High risk | Did not use automated machine |
| Incomplete outcome data (attrition bias) | Unclear risk | No information on dropouts |
| Selective reporting (reporting bias) | High risk | Did not report withdrawal due to adverse effects |
Characteristics of excluded studies [ordered by study ID]
Ir a:
| Study | Reason for exclusion |
| Non‐hypertensive and hypertensive participants were mixed and randomised. The data of hypertensive patients were not reported separately |
Data and analyses
| Outcome or subgroup title | No. of studies | No. of participants | Statistical method | Effect size |
| 1 SBP Show forest plot | 13 | Mean Difference (Fixed, 95% CI) | Subtotals only | |
| Analysis 1.1  Comparison 1 Nebivolol vs Placebo, Outcome 1 SBP. | ||||
| 1.1 (0.25 x starting dose) 1.0 & 1.25 mg/day | 3 | 366 | Mean Difference (Fixed, 95% CI) | ‐4.49 [‐7.15, ‐1.83] |
| 1.2 (0.5 x starting dose) 2.5 mg/day | 3 | 415 | Mean Difference (Fixed, 95% CI) | ‐4.96 [‐7.66, ‐2.26] |
| 1.3 (starting dose) 5 mg/day | 12 | 1280 | Mean Difference (Fixed, 95% CI) | ‐8.81 [‐10.23, ‐7.40] |
| 1.4 (2 x starting dose) 10 mg/day | 6 | 1684 | Mean Difference (Fixed, 95% CI) | ‐6.04 [‐7.47, ‐4.60] |
| 1.5 (4 x starting dose) 20 mg/day | 3 | 652 | Mean Difference (Fixed, 95% CI) | ‐6.95 [‐9.26, ‐4.63] |
| 1.6 (8 x starting dose) 30, 40 mg/day | 3 | 1155 | Mean Difference (Fixed, 95% CI) | ‐8.10 [‐9.84, ‐6.36] |
| 2 DBP Show forest plot | 13 | Mean Difference (Fixed, 95% CI) | Subtotals only | |
| Analysis 1.2  Comparison 1 Nebivolol vs Placebo, Outcome 2 DBP. | ||||
| 2.1 (0.25 x starting dose) 1.0 & 1.25 mg/day | 3 | 366 | Mean Difference (Fixed, 95% CI) | ‐3.55 [‐5.17, ‐1.93] |
| 2.2 (0.5 x starting dose) 2.5 mg/day | 3 | 415 | Mean Difference (Fixed, 95% CI) | ‐4.23 [‐5.76, ‐2.70] |
| 2.3 (starting dose) 5 mg/day | 12 | 1280 | Mean Difference (Fixed, 95% CI) | ‐6.67 [‐7.54, ‐5.80] |
| 2.4 (2 x starting dose) 10 mg/day | 6 | 1684 | Mean Difference (Fixed, 95% CI) | ‐5.90 [‐6.78, ‐5.01] |
| 2.5 (4 x starting dose) 20 mg/day | 3 | 652 | Mean Difference (Fixed, 95% CI) | ‐5.81 [‐7.21, ‐4.41] |
| 2.6 (8 x starting dose) 30, 40 mg/day | 3 | 1155 | Mean Difference (Fixed, 95% CI) | ‐7.70 [‐8.80, ‐6.61] |
| 3 Heart rate Show forest plot | 8 | Mean Difference (Fixed, 95% CI) | Subtotals only | |
| Analysis 1.3  Comparison 1 Nebivolol vs Placebo, Outcome 3 Heart rate. | ||||
| 3.1 (0.25 x starting dose) 1.25 mg/day | 1 | 136 | Mean Difference (Fixed, 95% CI) | ‐2.9 [‐5.86, 0.06] |
| 3.2 (0.5 x starting dose) 2.5 mg/day | 2 | 218 | Mean Difference (Fixed, 95% CI) | ‐3.89 [‐6.18, ‐1.61] |
| 3.3 (starting dose) 5 mg/day | 7 | 487 | Mean Difference (Fixed, 95% CI) | ‐8.21 [‐9.66, ‐6.76] |
| 3.4 (2 x starting dose) 10 mg/day | 3 | 1120 | Mean Difference (Fixed, 95% CI) | ‐7.23 [‐8.48, ‐5.99] |
| 3.5 (4 x starting dose) 20 mg/day | 2 | 298 | Mean Difference (Fixed, 95% CI) | ‐8.43 [‐10.48, ‐6.38] |
| 3.6 (8 x starting dose) 30, 40 mg/day | 3 | 1155 | Mean Difference (Fixed, 95% CI) | ‐10.94 [‐12.18, ‐9.71] |
| 4 Pulse Pressure Show forest plot | 13 | Mean Difference (Fixed, 95% CI) | Subtotals only | |
| Analysis 1.4  Comparison 1 Nebivolol vs Placebo, Outcome 4 Pulse Pressure. | ||||
| 4.1 (0.25 x starting dose) 1.0 & 1.25 mg/day | 3 | 366 | Mean Difference (Fixed, 95% CI) | ‐0.88 [‐3.21, 1.45] |
| 4.2 (0.5 x starting dose) 2.5 mg/day | 3 | 415 | Mean Difference (Fixed, 95% CI) | ‐0.95 [‐3.32, 1.41] |
| 4.3 (starting dose) 5 mg/day | 12 | 1314 | Mean Difference (Fixed, 95% CI) | ‐1.62 [‐2.83, ‐0.41] |
| 4.4 (2 x starting dose) 10 mg/day | 6 | 1684 | Mean Difference (Fixed, 95% CI) | ‐0.19 [‐1.47, 1.08] |
| 4.5 (4 x starting dose) 20 mg/day | 3 | 652 | Mean Difference (Fixed, 95% CI) | ‐1.25 [‐3.38, 0.89] |
| 4.6 (8 x starting dose) 30, 40 mg/day | 3 | 1155 | Mean Difference (Fixed, 95% CI) | ‐0.37 [‐1.94, 1.20] |
| 5 Peak vs Trough SBP Show forest plot | 4 | Mean Difference (Fixed, 95% CI) | Subtotals only | |
| Analysis 1.5  Comparison 1 Nebivolol vs Placebo, Outcome 5 Peak vs Trough SBP. | ||||
| 5.1 (0.25 x starting dose) 1.0 & 1.25 mg/day | 2 | 335 | Mean Difference (Fixed, 95% CI) | 0.30 [‐1.90, 2.49] |
| 5.2 (0.5 x starting dose) 2.5 mg/day | 3 | 415 | Mean Difference (Fixed, 95% CI) | ‐1.24 [‐3.28, 0.81] |
| 5.3 (starting dose) 5 mg/day | 4 | 817 | Mean Difference (Fixed, 95% CI) | 1.40 [0.14, 2.66] |
| 5.4 (2 x starting dose) 10 mg/day | 4 | 822 | Mean Difference (Fixed, 95% CI) | ‐0.17 [‐1.42, 1.08] |
| 5.5 (4 x starting dose) 20 mg/day | 3 | 652 | Mean Difference (Fixed, 95% CI) | 1.17 [‐0.27, 2.61] |
| 5.6 (8 x starting dose) 30, 40 mg/day | 2 | 331 | Mean Difference (Fixed, 95% CI) | ‐1.20 [‐3.19, 0.78] |
| 6 Peak vs Trough DBP Show forest plot | 4 | 3372 | Mean Difference (Fixed, 95% CI) | ‐1.53 [‐1.95, ‐1.11] |
| Analysis 1.6  Comparison 1 Nebivolol vs Placebo, Outcome 6 Peak vs Trough DBP. | ||||
| 6.1 (0.25 x starting dose) 1.0 & 1.25 mg/day | 2 | 335 | Mean Difference (Fixed, 95% CI) | ‐0.95 [‐2.38, 0.48] |
| 6.2 (0.5 x starting dose) 2.5 mg/day | 3 | 415 | Mean Difference (Fixed, 95% CI) | ‐1.88 [‐3.12, ‐0.64] |
| 6.3 (starting dose) 5 mg/day | 4 | 817 | Mean Difference (Fixed, 95% CI) | ‐1.54 [‐2.52, ‐0.57] |
| 6.4 (2 x starting dose) 10 mg/day | 4 | 822 | Mean Difference (Fixed, 95% CI) | ‐1.06 [‐1.86, ‐0.26] |
| 6.5 (4 x starting dose) 20 mg/day | 3 | 652 | Mean Difference (Fixed, 95% CI) | ‐1.53 [‐2.41, ‐0.65] |
| 6.6 (8 x starting dose) 30, 40 mg/day | 2 | 331 | Mean Difference (Fixed, 95% CI) | ‐2.73 [‐3.98, ‐1.49] |
| Outcome or subgroup title | No. of studies | No. of participants | Statistical method | Effect size |
| 1 SBP Show forest plot | 22 | Mean Difference (Fixed, 95% CI) | Subtotals only | |
| Analysis 2.1  Comparison 2 Atenolol vs Placebo, Outcome 1 SBP. | ||||
| 1.1 (0.5 x starting dose) 25 mg/day | 1 | 87 | Mean Difference (Fixed, 95% CI) | ‐7.0 [‐12.55, ‐1.45] |
| 1.2 (starting dose) 50 mg/day | 11 | 669 | Mean Difference (Fixed, 95% CI) | ‐10.28 [‐11.94, ‐8.62] |
| 1.3 (2 x starting dose) 100 mg/day | 12 | 495 | Mean Difference (Fixed, 95% CI) | ‐15.34 [‐16.86, ‐13.82] |
| 1.4 (4 x starting dose) 150 & 200 mg/day | 3 | 121 | Mean Difference (Fixed, 95% CI) | ‐11.29 [‐14.03, ‐8.55] |
| 2 DBP Show forest plot | 22 | Mean Difference (Fixed, 95% CI) | Subtotals only | |
| Analysis 2.2  Comparison 2 Atenolol vs Placebo, Outcome 2 DBP. | ||||
| 2.1 (0.5 x starting dose) 25 mg/day | 1 | 87 | Mean Difference (Fixed, 95% CI) | ‐4.0 [‐6.76, ‐1.24] |
| 2.2 (starting dose) 50 mg/day | 11 | 657 | Mean Difference (Fixed, 95% CI) | ‐7.78 [‐8.80, ‐6.76] |
| 2.3 (2 x starting dose) 100 mg/day | 12 | 495 | Mean Difference (Fixed, 95% CI) | ‐12.91 [‐13.89, ‐11.93] |
| 2.4 (4 x starting dose) 150, 200 mg/day | 3 | 121 | Mean Difference (Fixed, 95% CI) | ‐8.76 [‐10.56, ‐6.95] |
| 3 Heart rate Show forest plot | 17 | Mean Difference (Fixed, 95% CI) | Subtotals only | |
| Analysis 2.3  Comparison 2 Atenolol vs Placebo, Outcome 3 Heart rate. | ||||
| 3.1 (0.5 x starting dose) 25 mg/day | 1 | 87 | Mean Difference (Fixed, 95% CI) | ‐4.0 [‐9.55, 1.55] |
| 3.2 (starting dose) 50 mg/day | 7 | 470 | Mean Difference (Fixed, 95% CI) | ‐12.04 [‐13.39, ‐10.68] |
| 3.3 (2 x starting dose) 100 mg/day | 10 | 413 | Mean Difference (Fixed, 95% CI) | ‐13.70 [‐14.83, ‐12.56] |
| 3.4 (4 x starting dose) 150, 200 mg/day | 4 | 129 | Mean Difference (Fixed, 95% CI) | ‐18.33 [‐20.26, ‐16.41] |
| 4 Pulse pressure Show forest plot | 22 | Mean Difference (Fixed, 95% CI) | Subtotals only | |
| Analysis 2.4  Comparison 2 Atenolol vs Placebo, Outcome 4 Pulse pressure. | ||||
| 4.1 (0.5 x starting dose) 25 mg/day | 1 | 87 | Mean Difference (Fixed, 95% CI) | ‐3.0 [‐7.80, 1.80] |
| 4.2 (starting dose) 50 mg/day | 11 | 669 | Mean Difference (Fixed, 95% CI) | ‐2.30 [‐3.71, ‐0.90] |
| 4.3 (2 x starting dose) 100 mg/day | 12 | 495 | Mean Difference (Fixed, 95% CI) | ‐2.01 [‐3.24, ‐0.77] |
| 4.4 (4 x starting dose) 150, 200 mg/day | 3 | 121 | Mean Difference (Fixed, 95% CI) | ‐2.62 [‐4.82, ‐0.42] |
| Outcome or subgroup title | No. of studies | No. of participants | Statistical method | Effect size |
| 1 SBP Show forest plot | 9 | Mean Difference (Fixed, 95% CI) | Subtotals only | |
| Analysis 3.1  Comparison 3 Metoprolol vs Placebo, Outcome 1 SBP. | ||||
| 1.1 (0.25 x starting dose) 25 mg/day | 2 | 424 | Mean Difference (Fixed, 95% CI) | ‐6.33 [‐9.22, ‐3.44] |
| 1.2 (0.5 x starting dose) 50 mg/day | 2 | 339 | Mean Difference (Fixed, 95% CI) | ‐6.30 [‐9.47, ‐3.13] |
| 1.3 (starting dose) 100 mg/day | 3 | 410 | Mean Difference (Fixed, 95% CI) | ‐5.35 [‐8.12, ‐2.58] |
| 1.4 (2 x starting dose) 200 mg/day | 5 | 284 | Mean Difference (Fixed, 95% CI) | ‐11.54 [‐14.37, ‐8.71] |
| 1.5 (4 x starting dose) 400 mg/day | 2 | 193 | Mean Difference (Fixed, 95% CI) | ‐10.91 [‐15.42, ‐6.40] |
| 2 DBP Show forest plot | 9 | Mean Difference (Fixed, 95% CI) | Subtotals only | |
| Analysis 3.2  Comparison 3 Metoprolol vs Placebo, Outcome 2 DBP. | ||||
| 2.1 (0.25 x starting dose) 25 mg/day | 2 | 424 | Mean Difference (Fixed, 95% CI) | ‐3.64 [‐5.44, ‐1.85] |
| 2.2 (0.5 x starting dose) 50 mg/day | 2 | 339 | Mean Difference (Fixed, 95% CI) | ‐4.56 [‐6.42, ‐2.70] |
| 2.3 (starting dose) 100 & 120 mg/day | 3 | 410 | Mean Difference (Fixed, 95% CI) | ‐4.74 [‐6.50, ‐2.98] |
| 2.4 (2 x starting dose) 200 mg/day | 5 | 284 | Mean Difference (Fixed, 95% CI) | ‐10.25 [‐11.99, ‐8.51] |
| 2.5 (4 x starting dose) 400 mg/day | 2 | 193 | Mean Difference (Fixed, 95% CI) | ‐7.71 [‐10.72, ‐4.69] |
| 3 Heart rate Show forest plot | 5 | Mean Difference (Fixed, 95% CI) | Subtotals only | |
| Analysis 3.3  Comparison 3 Metoprolol vs Placebo, Outcome 3 Heart rate. | ||||
| 3.1 (0.5 x starting dose) 50 mg/day | 1 | 94 | Mean Difference (Fixed, 95% CI) | ‐5.6 [‐10.03, ‐1.17] |
| 3.2 (starting dose) 100 & 120 mg/day | 1 | 24 | Mean Difference (Fixed, 95% CI) | ‐15.0 [‐18.92, ‐11.08] |
| 3.3 (2 x starting dose) 200 mg/day | 2 | 40 | Mean Difference (Fixed, 95% CI) | ‐13.25 [‐17.04, ‐9.46] |
| 3.4 (4 x starting dose) 400 mg/day | 1 | 8 | Mean Difference (Fixed, 95% CI) | ‐20.00 [‐25.88, ‐14.12] |
| 4 Pulse pressure Show forest plot | 9 | Mean Difference (Fixed, 95% CI) | Subtotals only | |
| Analysis 3.4  Comparison 3 Metoprolol vs Placebo, Outcome 4 Pulse pressure. | ||||
| 4.1 (0.25 x starting dose) 25 mg/day | 2 | 424 | Mean Difference (Fixed, 95% CI) | ‐2.70 [‐5.23, ‐0.17] |
| 4.2 (0.5 x starting dose) 50 mg/day | 2 | 339 | Mean Difference (Fixed, 95% CI) | ‐1.74 [‐4.52, 1.04] |
| 4.3 (starting dose) 100 mg/day | 3 | 410 | Mean Difference (Fixed, 95% CI) | ‐0.58 [‐3.01, 1.85] |
| 4.4 (2 x starting dose) 200 mg/day | 5 | 284 | Mean Difference (Fixed, 95% CI) | ‐1.22 [‐3.62, 1.18] |
| 4.5 (4 x starting dose) 400 mg/day | 2 | 193 | Mean Difference (Fixed, 95% CI) | ‐3.30 [‐7.29, 0.69] |
| Outcome or subgroup title | No. of studies | No. of participants | Statistical method | Effect size |
| 1 SBP Show forest plot | 6 | Mean Difference (Fixed, 95% CI) | Subtotals only | |
| Analysis 4.1  Comparison 4 Bisoprolol vs placebo, Outcome 1 SBP. | ||||
| 1.1 (starting dose) 5 mg/day | 5 | 422 | Mean Difference (Fixed, 95% CI) | ‐11.40 [‐13.67, ‐9.13] |
| 1.2 (2 x starting dose) 10 mg/day | 2 | 134 | Mean Difference (Fixed, 95% CI) | ‐7.03 [‐11.07, ‐2.99] |
| 1.3 (4 x starting dose) 20 mg/day | 1 | 121 | Mean Difference (Fixed, 95% CI) | ‐7.6 [‐12.60, ‐2.60] |
| 2 DBP Show forest plot | 7 | Mean Difference (Fixed, 95% CI) | Subtotals only | |
| Analysis 4.2  Comparison 4 Bisoprolol vs placebo, Outcome 2 DBP. | ||||
| 2.1 (starting dose) 5 mg/day | 6 | 462 | Mean Difference (Fixed, 95% CI) | ‐8.16 [‐9.49, ‐6.84] |
| 2.2 (2 x starting dose) 10 mg/day | 3 | 173 | Mean Difference (Fixed, 95% CI) | ‐7.44 [‐9.88, ‐5.01] |
| 2.3 (4 x starting dose) 20 mg/day | 1 | 121 | Mean Difference (Fixed, 95% CI) | ‐8.5 [‐11.56, ‐5.44] |
| 3 Heart rate Show forest plot | 6 | Mean Difference (Fixed, 95% CI) | Subtotals only | |
| Analysis 4.3  Comparison 4 Bisoprolol vs placebo, Outcome 3 Heart rate. | ||||
| 3.1 (starting dose) 5 mg/day | 5 | 236 | Mean Difference (Fixed, 95% CI) | ‐6.91 [‐8.82, ‐4.99] |
| 3.2 (2 x starting dose) 10 mg/day | 3 | 173 | Mean Difference (Fixed, 95% CI) | ‐10.19 [‐12.87, ‐7.52] |
| 3.3 (4 x starting dose) 20 mg/day | 1 | 121 | Mean Difference (Fixed, 95% CI) | ‐11.1 [‐14.98, ‐7.22] |
| 4 Pulse pressure Show forest plot | 6 | Mean Difference (Fixed, 95% CI) | Subtotals only | |
| Analysis 4.4  Comparison 4 Bisoprolol vs placebo, Outcome 4 Pulse pressure. | ||||
| 4.1 (starting dose) 5 mg/day | 5 | 422 | Mean Difference (Fixed, 95% CI) | ‐3.35 [‐5.32, ‐1.38] |
| 4.2 (2 x starting dose) 10 mg/day | 2 | 134 | Mean Difference (Fixed, 95% CI) | 1.65 [‐1.96, 5.26] |
| 4.3 (4 x starting dose) 20 mg/day | 1 | 121 | Mean Difference (Fixed, 95% CI) | 0.9 [‐3.45, 5.25] |
| Outcome or subgroup title | No. of studies | No. of participants | Statistical method | Effect size |
| 1 SBP Show forest plot | 2 | Mean Difference (Fixed, 95% CI) | Subtotals only | |
| Analysis 5.1  Comparison 5 Betaxolol vs Placebo, Outcome 1 SBP. | ||||
| 1.1 (0.5 x starting dose) 5 mg/day | 1 | 148 | Mean Difference (Fixed, 95% CI) | ‐5.81 [‐10.55, ‐1.07] |
| 1.2 (starting dose) 10 mg/day | 1 | 146 | Mean Difference (Fixed, 95% CI) | ‐8.2 [‐12.94, ‐3.46] |
| 1.3 (2 x starting dose) 20 mg/day | 2 | 477 | Mean Difference (Fixed, 95% CI) | ‐11.25 [‐13.21, ‐9.29] |
| 2 DBP Show forest plot | 2 | Mean Difference (Fixed, 95% CI) | Subtotals only | |
| Analysis 5.2  Comparison 5 Betaxolol vs Placebo, Outcome 2 DBP. | ||||
| 2.1 (0.5 x starting dose) 5 mg/day | 1 | 148 | Mean Difference (Fixed, 95% CI) | ‐3.8 [‐6.54, ‐1.06] |
| 2.2 (starting dose) 10 mg/day | 1 | 146 | Mean Difference (Fixed, 95% CI) | ‐6.5 [‐9.24, ‐3.76] |
| 2.3 (2 x starting dose) 20 mg/day | 2 | 477 | Mean Difference (Fixed, 95% CI) | ‐7.94 [‐9.17, ‐6.71] |
| 3 Heart rate Show forest plot | 2 | Mean Difference (Fixed, 95% CI) | Subtotals only | |
| Analysis 5.3  Comparison 5 Betaxolol vs Placebo, Outcome 3 Heart rate. | ||||
| 3.1 (0.5 x starting dose) 5 mg/day | 1 | 148 | Mean Difference (Fixed, 95% CI) | ‐7.4 [‐10.34, ‐4.46] |
| 3.2 (starting dose) 10 mg/day | 1 | 146 | Mean Difference (Fixed, 95% CI) | ‐8.2 [‐11.14, ‐5.26] |
| 3.3 (2 x starting dose) 20 mg/day | 2 | 477 | Mean Difference (Fixed, 95% CI) | ‐13.40 [‐15.03, ‐11.77] |
| 4 Pulse pressure Show forest plot | 2 | Mean Difference (Fixed, 95% CI) | Subtotals only | |
| Analysis 5.4  Comparison 5 Betaxolol vs Placebo, Outcome 4 Pulse pressure. | ||||
| 4.1 (0.5x starting dose) 5 mg/day | 1 | 148 | Mean Difference (Fixed, 95% CI) | ‐1.1 [‐5.24, 3.04] |
| 4.2 (starting dose) 10 mg/day | 1 | 146 | Mean Difference (Fixed, 95% CI) | ‐1.7 [‐5.84, 2.44] |
| 4.3 (2 x starting dose) 20 mg/day | 2 | 477 | Mean Difference (Fixed, 95% CI) | ‐3.26 [‐5.00, ‐1.52] |
| Outcome or subgroup title | No. of studies | No. of participants | Statistical method | Effect size |
| 1 SBP Show forest plot | 1 | Mean Difference (IV, Fixed, 95% CI) | Subtotals only | |
| Analysis 6.1  Comparison 6 Bevantolol vs Placebo, Outcome 1 SBP. | ||||
| 1.1 Bevantolol 100mg/day | 1 | 35 | Mean Difference (IV, Fixed, 95% CI) | ‐13.0 [‐29.57, 3.57] |
| 1.2 Bevantolol 200mg/day | 1 | 35 | Mean Difference (IV, Fixed, 95% CI) | ‐9.0 [‐25.57, 7.57] |
| 1.3 Bevantolol 300mg/day | 1 | 35 | Mean Difference (IV, Fixed, 95% CI) | ‐7.0 [‐23.57, 9.57] |
| 1.4 Bevantolol 400mg/day | 1 | 35 | Mean Difference (IV, Fixed, 95% CI) | ‐8.0 [‐24.57, 8.57] |
| 2 DBP Show forest plot | 1 | Mean Difference (IV, Fixed, 95% CI) | Subtotals only | |
| Analysis 6.2  Comparison 6 Bevantolol vs Placebo, Outcome 2 DBP. | ||||
| 2.1 Bevantolol 100mg/day | 1 | 35 | Mean Difference (IV, Fixed, 95% CI) | ‐5.0 [‐15.52, 5.52] |
| 2.2 Bevantolol 200mg/day | 1 | 35 | Mean Difference (IV, Fixed, 95% CI) | ‐9.0 [‐19.52, 1.52] |
| 2.3 Bevantolol 300mg/day | 1 | 35 | Mean Difference (IV, Fixed, 95% CI) | ‐9.0 [‐19.52, 1.52] |
| 2.4 Bevantolol 400mg/day | 1 | 35 | Mean Difference (IV, Fixed, 95% CI) | ‐10.0 [‐20.52, 0.52] |
| 3 Heart rate Show forest plot | 1 | Mean Difference (IV, Fixed, 95% CI) | Subtotals only | |
| Analysis 6.3  Comparison 6 Bevantolol vs Placebo, Outcome 3 Heart rate. | ||||
| 3.1 Bevantolol 100mg/day | 1 | 35 | Mean Difference (IV, Fixed, 95% CI) | ‐13.0 [‐29.57, 3.57] |
| 3.2 Bevantolol 200mg/day | 1 | 35 | Mean Difference (IV, Fixed, 95% CI) | ‐9.0 [‐25.57, 7.57] |
| 3.3 Bevantolol 300mg/day | 1 | 35 | Mean Difference (IV, Fixed, 95% CI) | ‐7.0 [‐23.57, 9.57] |
| 3.4 Bevantolol 400mg/day | 1 | 35 | Mean Difference (IV, Fixed, 95% CI) | ‐8.0 [‐24.57, 8.57] |
| 4 Pulse pressure Show forest plot | 1 | Mean Difference (Fixed, 95% CI) | Subtotals only | |
| Analysis 6.4  Comparison 6 Bevantolol vs Placebo, Outcome 4 Pulse pressure. | ||||
| 4.1 Bevantolol 100mg/day | 1 | Mean Difference (Fixed, 95% CI) | ‐8.0 [‐22.52, 6.52] | |
| 4.2 Bevantolol 200mg/day | 1 | Mean Difference (Fixed, 95% CI) | 0.0 [‐14.52, 14.52] | |
| 4.3 Bevantolol 300mg/day | 1 | Mean Difference (Fixed, 95% CI) | 2.0 [‐12.56, 16.56] | |
| 4.4 Bevantolol 400mg/day | 1 | Mean Difference (Fixed, 95% CI) | 2.0 [‐12.52, 16.52] | |
| Outcome or subgroup title | No. of studies | No. of participants | Statistical method | Effect size |
| 1 SBP Show forest plot | 2 | Mean Difference (IV, Fixed, 95% CI) | Subtotals only | |
| Analysis 7.1  Comparison 7 Pafenolol vs Placebo, Outcome 1 SBP. | ||||
| 1.1 25 mg/day | 1 | 21 | Mean Difference (IV, Fixed, 95% CI) | 3.0 [‐11.79, 17.79] |
| 1.2 50 mg/day | 2 | 33 | Mean Difference (IV, Fixed, 95% CI) | ‐5.94 [‐17.57, 5.68] |
| 1.3 100 mg/day | 1 | 14 | Mean Difference (IV, Fixed, 95% CI) | ‐6.0 [‐22.94, 10.94] |
| 2 DBP Show forest plot | 2 | Mean Difference (IV, Fixed, 95% CI) | Subtotals only | |
| Analysis 7.2  Comparison 7 Pafenolol vs Placebo, Outcome 2 DBP. | ||||
| 2.1 25 mg/day | 1 | 21 | Mean Difference (IV, Fixed, 95% CI) | ‐8.0 [‐16.73, 0.73] |
| 2.2 50 mg/day | 2 | 33 | Mean Difference (IV, Fixed, 95% CI) | ‐4.41 [‐11.22, 2.40] |
| 2.3 100 mg/day | 1 | 14 | Mean Difference (IV, Fixed, 95% CI) | ‐2.0 [‐12.75, 8.75] |
| 3 Heart rate Show forest plot | 2 | Mean Difference (IV, Fixed, 95% CI) | Subtotals only | |
| Analysis 7.3  Comparison 7 Pafenolol vs Placebo, Outcome 3 Heart rate. | ||||
| 3.1 25 mg/day | 1 | 21 | Mean Difference (IV, Fixed, 95% CI) | ‐3.0 [‐12.93, 6.93] |
| 3.2 50 mg/day | 2 | 33 | Mean Difference (IV, Fixed, 95% CI) | ‐8.14 [‐15.91, ‐0.36] |
| 3.3 100 mg/day | 1 | 14 | Mean Difference (IV, Fixed, 95% CI) | ‐20.0 [‐32.60, ‐7.40] |
| 4 Pulse pressure Show forest plot | 2 | Mean Difference (Fixed, 95% CI) | Subtotals only | |
| Analysis 7.4  Comparison 7 Pafenolol vs Placebo, Outcome 4 Pulse pressure. | ||||
| 4.1 25 mg/day | 1 | 21 | Mean Difference (Fixed, 95% CI) | 11.0 [‐1.82, 23.82] |
| 4.2 50 mg/day | 2 | 33 | Mean Difference (Fixed, 95% CI) | ‐1.75 [‐11.86, 8.37] |
| 4.3 100 mg/day | 1 | 14 | Mean Difference (Fixed, 95% CI) | ‐4.0 [‐18.86, 10.86] |
| Outcome or subgroup title | No. of studies | No. of participants | Statistical method | Effect size |
| 1 SBP Show forest plot | 1 | 24 | Mean Difference (Fixed, 95% CI) | ‐21.2 [‐29.31, ‐13.09] |
| Analysis 8.1  Comparison 8 Practolol vs Placebo, Outcome 1 SBP. | ||||
| 1.1 Practolol 600mg/day | 1 | 24 | Mean Difference (Fixed, 95% CI) | ‐21.2 [‐29.31, ‐13.09] |
| 2 DBP Show forest plot | 1 | 24 | Mean Difference (Fixed, 95% CI) | ‐13.9 [‐17.00, ‐8.80] |
| Analysis 8.2  Comparison 8 Practolol vs Placebo, Outcome 2 DBP. | ||||
| 2.1 Practolol 600mg/day | 1 | 24 | Mean Difference (Fixed, 95% CI) | ‐13.9 [‐17.00, ‐8.80] |
| 3 Heart rate Show forest plot | 1 | 24 | Mean Difference (Fixed, 95% CI) | ‐14.0 [‐21.45, ‐6.55] |
| Analysis 8.3  Comparison 8 Practolol vs Placebo, Outcome 3 Heart rate. | ||||
| 3.1 Practolol 600mg/day | 1 | 24 | Mean Difference (Fixed, 95% CI) | ‐14.0 [‐21.45, ‐6.55] |
| 4 Pulse pressure Show forest plot | 1 | 24 | Mean Difference (Fixed, 95% CI) | ‐7.30 [‐14.41, ‐0.19] |
| Analysis 8.4  Comparison 8 Practolol vs Placebo, Outcome 4 Pulse pressure. | ||||
| 4.1 Practolol 600mg/day | 1 | 24 | Mean Difference (Fixed, 95% CI) | ‐7.30 [‐14.41, ‐0.19] |
| Outcome or subgroup title | No. of studies | No. of participants | Statistical method | Effect size |
| 1 SBP Show forest plot | 50 | Mean Difference (Fixed, 95% CI) | Subtotals only | |
| Analysis 9.1  Comparison 9 Pooled overall effect, Outcome 1 SBP. | ||||
| 1.1 0.25 x starting dose | 5 | 790 | Mean Difference (Fixed, 95% CI) | ‐5.34 [‐7.29, ‐3.38] |
| 1.2 0.5 x starting dose | 7 | 941 | Mean Difference (Fixed, 95% CI) | ‐5.71 [‐7.59, ‐3.82] |
| 1.3 starting dose | 30 | 2879 | Mean Difference (Fixed, 95% CI) | ‐9.29 [‐10.21, ‐8.38] |
| 1.4 2 x starting dose | 27 | 3026 | Mean Difference (Fixed, 95% CI) | ‐10.58 [‐11.45, ‐9.71] |
| 1.5 4 x starting dose | 9 | 1087 | Mean Difference (Fixed, 95% CI) | ‐8.90 [‐10.47, ‐7.34] |
| 1.6 8 x starting dose | 2 | 331 | Mean Difference (Fixed, 95% CI) | ‐8.29 [‐11.24, ‐5.35] |
| 2 DBP Show forest plot | 51 | Mean Difference (Fixed, 95% CI) | Subtotals only | |
| Analysis 9.2  Comparison 9 Pooled overall effect, Outcome 2 DBP. | ||||
| 2.1 0.25 x starting dose | 5 | 790 | Mean Difference (Fixed, 95% CI) | ‐3.59 [‐4.79, ‐2.39] |
| 2.2 0.5 x starting dose | 7 | 941 | Mean Difference (Fixed, 95% CI) | ‐4.27 [‐5.31, ‐3.22] |
| 2.3 starting dose | 31 | 2907 | Mean Difference (Fixed, 95% CI) | ‐7.06 [‐7.62, ‐6.51] |
| 2.4 2 x starting dose | 28 | 3065 | Mean Difference (Fixed, 95% CI) | ‐8.92 [‐9.47, ‐8.38] |
| 2.5 4 x starting dose | 9 | 1087 | Mean Difference (Fixed, 95% CI) | ‐7.17 [‐8.15, ‐6.18] |
| 2.6 8 x starting dose | 2 | 331 | Mean Difference (Fixed, 95% CI) | ‐7.20 [‐8.99, ‐5.40] |
| 3 Heart rate Show forest plot | 37 | Mean Difference (Fixed, 95% CI) | Subtotals only | |
| Analysis 9.3  Comparison 9 Pooled overall effect, Outcome 3 Heart rate. | ||||
| 3.1 0.25 x starting dose | 1 | 136 | Mean Difference (Fixed, 95% CI) | ‐2.9 [‐5.86, 0.06] |
| 3.2 0.5 x starting dose | 5 | 499 | Mean Difference (Fixed, 95% CI) | ‐4.34 [‐6.21, ‐2.47] |
| 3.3 starting dose | 20 | 1315 | Mean Difference (Fixed, 95% CI) | ‐9.80 [‐10.65, ‐8.94] |
| 3.4 2 x starting dose | 20 | 2175 | Mean Difference (Fixed, 95% CI) | ‐11.33 [‐12.06, ‐10.61] |
| 3.5 4 x starting dose | 8 | 556 | Mean Difference (Fixed, 95% CI) | ‐13.71 [‐15.00, ‐12.43] |
| 3.6 8 x starting dose | 2 | 331 | Mean Difference (Fixed, 95% CI) | ‐9.19 [‐11.21, ‐7.18] |
| 4 Pulse pressure Show forest plot | 50 | Mean Difference (Fixed, 95% CI) | Subtotals only | |
| Analysis 9.4  Comparison 9 Pooled overall effect, Outcome 4 Pulse pressure. | ||||
| 4.1 0.25 x starting dose | 5 | 790 | Mean Difference (Fixed, 95% CI) | ‐1.72 [‐3.43, ‐0.00] |
| 4.2 0.5 x starting dose | 7 | 941 | Mean Difference (Fixed, 95% CI) | ‐1.48 [‐3.13, 0.17] |
| 4.3 starting dose | 30 | 2913 | Mean Difference (Fixed, 95% CI) | 0.00 [‐2.78, ‐1.22] |
| 4.4 2 x starting dose | 27 | 3026 | Mean Difference (Fixed, 95% CI) | ‐1.39 [‐2.14, ‐0.65] |
| 4.5 4 x starting dose | 9 | 1087 | Mean Difference (Fixed, 95% CI) | ‐1.80 [‐3.16, ‐0.44] |
| 4.6 8 x starting dose | 2 | 331 | Mean Difference (Fixed, 95% CI) | ‐1.04 [‐3.67, 1.60] |
| 5 WDAE Show forest plot | 3 | 2618 | Risk Ratio (M‐H, Fixed, 95% CI) | 0.85 [0.50, 1.45] |
| Analysis 9.5  Comparison 9 Pooled overall effect, Outcome 5 WDAE. | ||||
| 6 SBP combined starting dose and 2 x starting dose Show forest plot | 47 | 5246 | Mean Difference (Fixed, 95% CI) | ‐10.42 [‐11.11, ‐9.72] |
| Analysis 9.6  Comparison 9 Pooled overall effect, Outcome 6 SBP combined starting dose and 2 x starting dose. | ||||
| 6.1 starting dose | 30 | 2509 | Mean Difference (Fixed, 95% CI) | ‐9.71 [‐10.75, ‐8.67] |
| 6.2 2 x starting dose | 27 | 2737 | Mean Difference (Fixed, 95% CI) | ‐10.99 [‐11.93, ‐10.06] |
| 7 DBP combined starting dose and 2 x starting dose Show forest plot | 48 | 5316 | Mean Difference (Fixed, 95% CI) | ‐8.27 [‐8.69, ‐7.84] |
| Analysis 9.7  Comparison 9 Pooled overall effect, Outcome 7 DBP combined starting dose and 2 x starting dose. | ||||
| 7.1 starting dose | 31 | 2540 | Mean Difference (Fixed, 95% CI) | ‐7.23 [‐7.85, ‐6.60] |
| 7.2 2x starting dose | 28 | 2776 | Mean Difference (Fixed, 95% CI) | ‐9.16 [‐9.74, ‐8.58] |
| 8 Heart rate combined starting dose and 2 x starting dose Show forest plot | 33 | 3407 | Mean Difference (Fixed, 95% CI) | ‐10.93 [‐11.48, ‐10.37] |
| Analysis 9.8  Comparison 9 Pooled overall effect, Outcome 8 Heart rate combined starting dose and 2 x starting dose. | ||||
| 8.1 starting dose | 20 | 1268 | Mean Difference (Fixed, 95% CI) | ‐10.03 [‐10.90, ‐9.17] |
| 8.2 2 x starting dose | 20 | 2139 | Mean Difference (Fixed, 95% CI) | ‐11.57 [‐12.30, ‐10.84] |
| 9 Pulse pressure combined starting dose and 2 x starting dose Show forest plot | 47 | 5246 | Mean Difference (Fixed, 95% CI) | ‐1.76 [‐2.34, ‐1.19] |
| Analysis 9.9  Comparison 9 Pooled overall effect, Outcome 9 Pulse pressure combined starting dose and 2 x starting dose. | ||||
| 9.1 starting dose | 30 | 2509 | Mean Difference (Fixed, 95% CI) | ‐2.09 [‐2.94, ‐1.23] |
| 9.2 2 x starting dose | 27 | 2737 | Mean Difference (Fixed, 95% CI) | ‐1.49 [‐2.27, ‐0.71] |
| 10 SBP test for 2 x starting dose subgroup difference Show forest plot | 26 | 2197 | Mean Difference (Fixed, 95% CI) | ‐11.27 [‐12.22, ‐10.32] |
| Analysis 9.10  Comparison 9 Pooled overall effect, Outcome 10 SBP test for 2 x starting dose subgroup difference. | ||||
| 10.1 Atenolol | 12 | 495 | Mean Difference (Fixed, 95% CI) | ‐15.34 [‐16.86, ‐13.82] |
| 10.2 Nebivolol | 5 | 855 | Mean Difference (Fixed, 95% CI) | ‐5.26 [‐7.19, ‐3.34] |
| 10.3 Metoprolol | 5 | 284 | Mean Difference (Fixed, 95% CI) | ‐11.54 [‐14.37, ‐8.71] |
| 10.4 Bisoprolol | 2 | 134 | Mean Difference (Fixed, 95% CI) | ‐7.03 [‐11.07, ‐2.99] |
| 10.5 Betaxolol | 2 | 429 | Mean Difference (Fixed, 95% CI) | ‐11.63 [‐13.73, ‐9.53] |
| 11 DBP test for 2 x starting dose subgroup difference Show forest plot | 27 | 2236 | Mean Difference (Fixed, 95% CI) | ‐9.47 [‐10.06, ‐8.88] |
| Analysis 9.11  Comparison 9 Pooled overall effect, Outcome 11 DBP test for 2 x starting dose subgroup difference. | ||||
| 11.1 Atenolol | 12 | 495 | Mean Difference (Fixed, 95% CI) | ‐12.91 [‐13.89, ‐11.93] |
| 11.2 Nebivolol | 5 | 855 | Mean Difference (Fixed, 95% CI) | ‐5.82 [‐6.99, ‐4.65] |
| 11.3 Metoprolol | 5 | 284 | Mean Difference (Fixed, 95% CI) | ‐10.25 [‐11.99, ‐8.51] |
| 11.4 Bisoprolol | 3 | 173 | Mean Difference (Fixed, 95% CI) | ‐7.44 [‐9.88, ‐5.01] |
| 11.5 Betaxolol | 2 | 429 | Mean Difference (Fixed, 95% CI) | ‐8.08 [‐9.39, ‐6.77] |
| 12 Heart rate test for 2 x starting dose subgroup difference Show forest plot | 19 | 1346 | Mean Difference (Fixed, 95% CI) | ‐12.24 [‐13.05, ‐11.42] |
| Analysis 9.12  Comparison 9 Pooled overall effect, Outcome 12 Heart rate test for 2 x starting dose subgroup difference. | ||||
| 12.1 Atenolol | 10 | 413 | Mean Difference (Fixed, 95% CI) | ‐13.70 [‐14.83, ‐12.56] |
| 12.2 Nebivolol | 2 | 291 | Mean Difference (Fixed, 95% CI) | ‐5.94 [‐7.98, ‐3.90] |
| 12.3 Metoprolol | 2 | 40 | Mean Difference (Fixed, 95% CI) | ‐13.25 [‐17.04, ‐9.46] |
| 12.4 Bisoprolol | 3 | 173 | Mean Difference (Fixed, 95% CI) | ‐10.19 [‐12.87, ‐7.52] |
| 12.5 Betaxolol | 2 | 429 | Mean Difference (Fixed, 95% CI) | ‐14.43 [‐16.35, ‐12.51] |

PRISMA study flow diagram
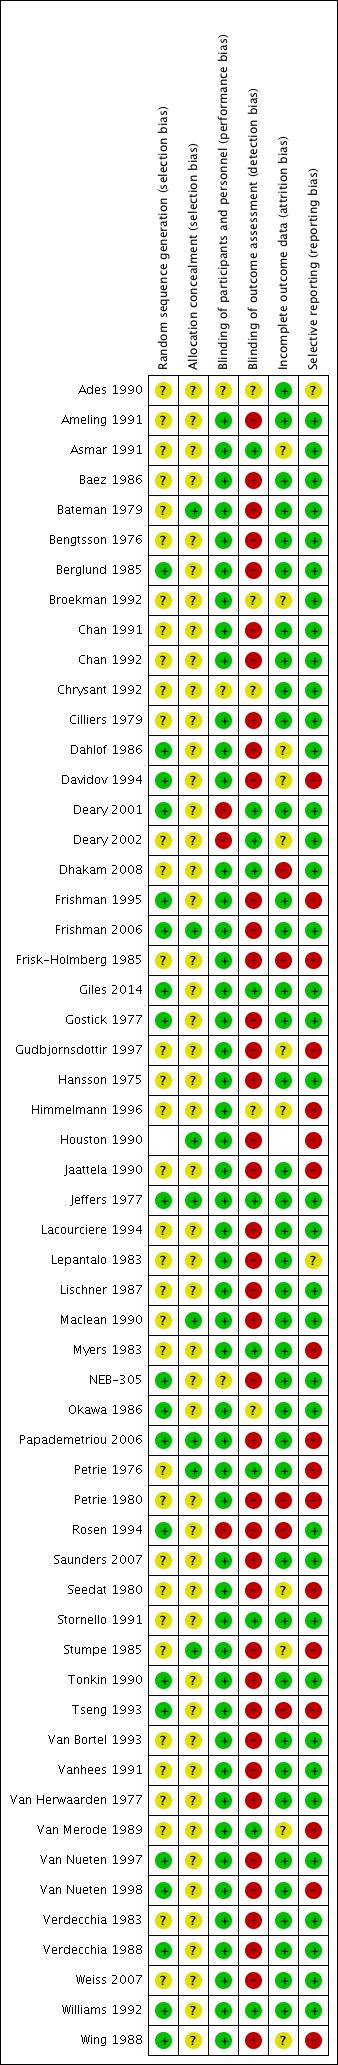
Risk of bias summary: review authors' judgements about each risk of bias item for each included study.
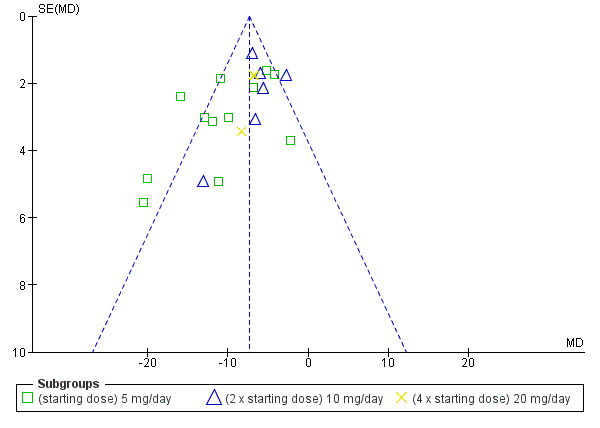
Funnel plot of nebivolol 5 mg to 20 mg (SBP)

Funnel plot of nebivolol 5 mg to 20 mg (DBP)

Comparison 1 Nebivolol vs Placebo, Outcome 1 SBP.
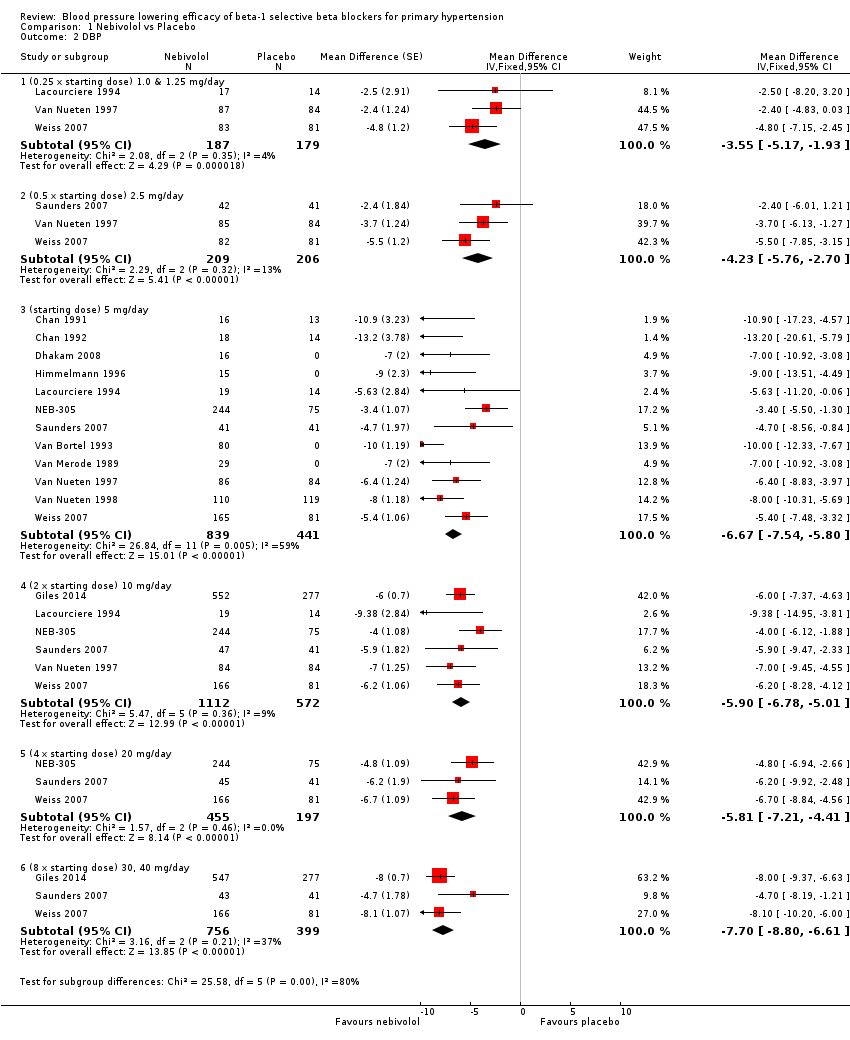
Comparison 1 Nebivolol vs Placebo, Outcome 2 DBP.

Comparison 1 Nebivolol vs Placebo, Outcome 3 Heart rate.

Comparison 1 Nebivolol vs Placebo, Outcome 4 Pulse Pressure.
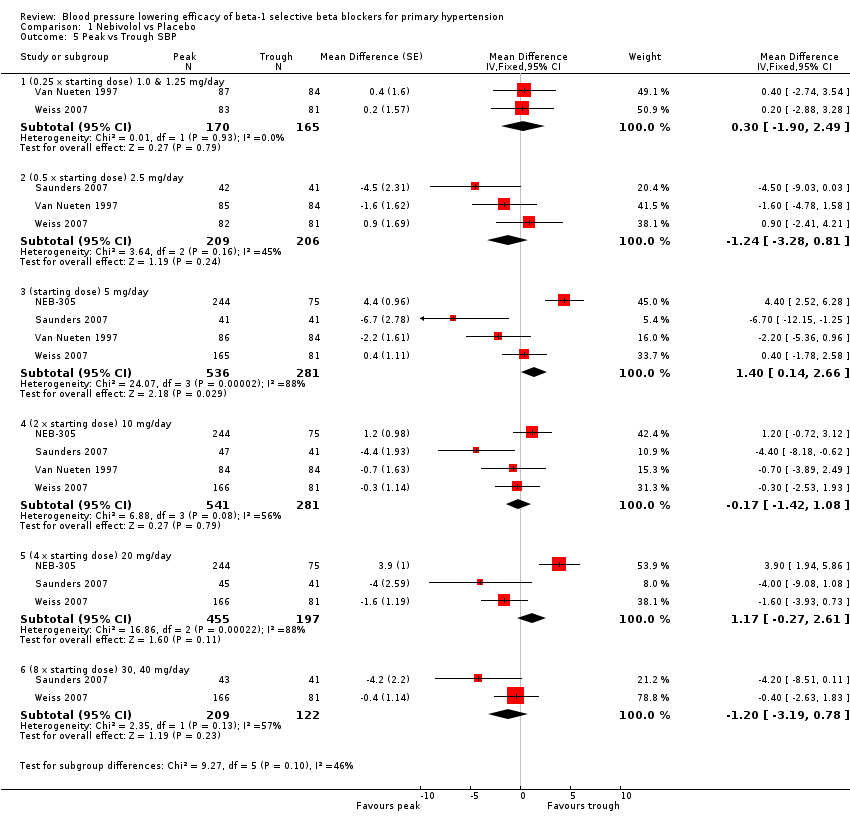
Comparison 1 Nebivolol vs Placebo, Outcome 5 Peak vs Trough SBP.

Comparison 1 Nebivolol vs Placebo, Outcome 6 Peak vs Trough DBP.

Comparison 2 Atenolol vs Placebo, Outcome 1 SBP.

Comparison 2 Atenolol vs Placebo, Outcome 2 DBP.
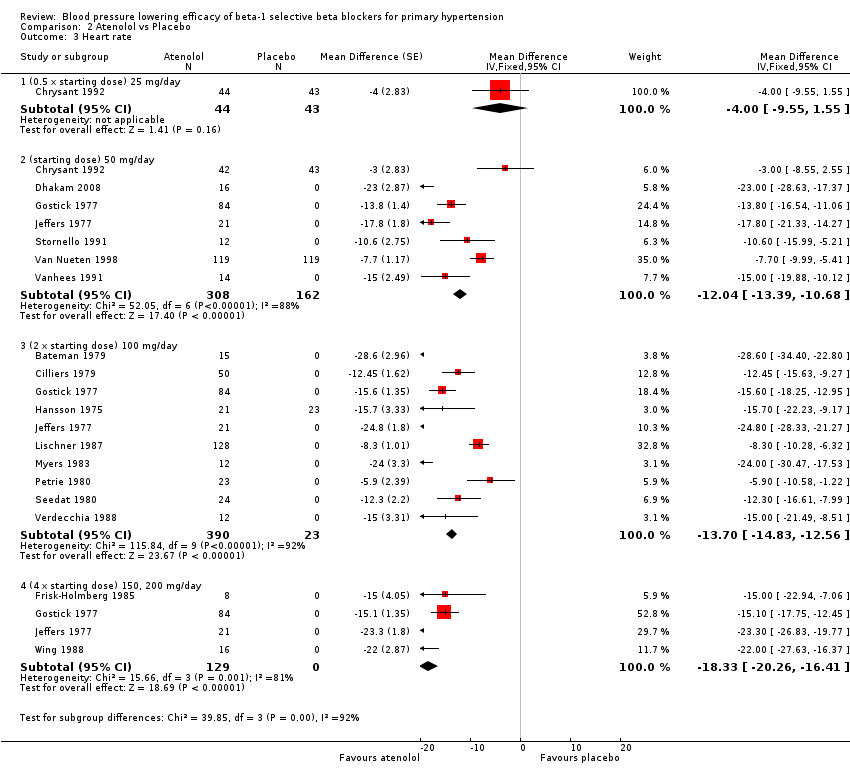
Comparison 2 Atenolol vs Placebo, Outcome 3 Heart rate.
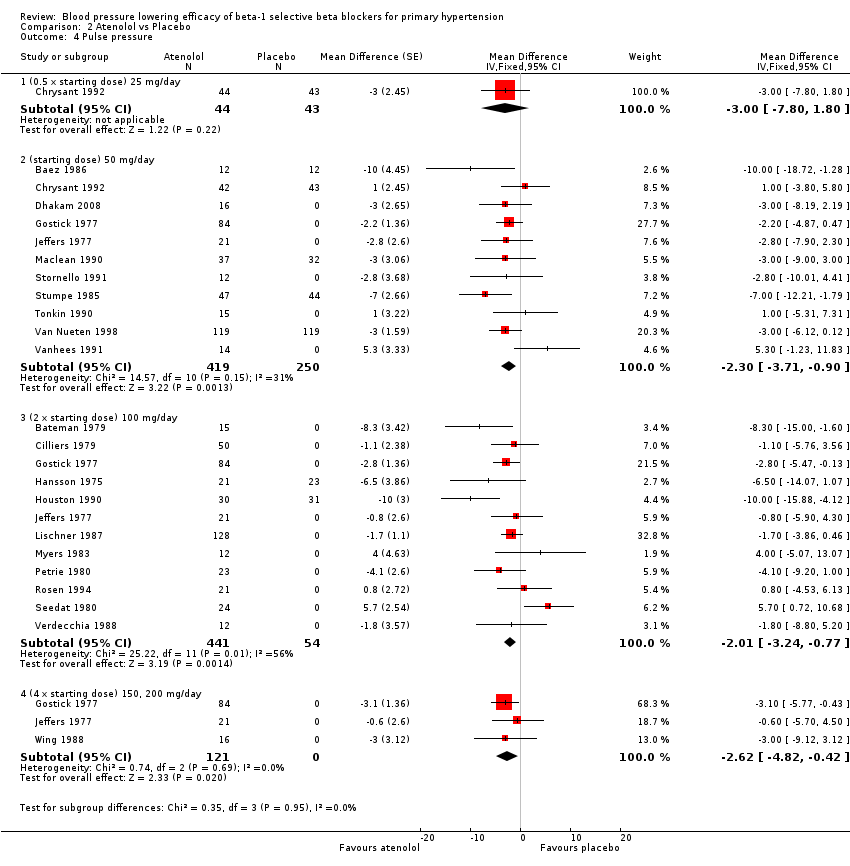
Comparison 2 Atenolol vs Placebo, Outcome 4 Pulse pressure.

Comparison 3 Metoprolol vs Placebo, Outcome 1 SBP.

Comparison 3 Metoprolol vs Placebo, Outcome 2 DBP.

Comparison 3 Metoprolol vs Placebo, Outcome 3 Heart rate.

Comparison 3 Metoprolol vs Placebo, Outcome 4 Pulse pressure.
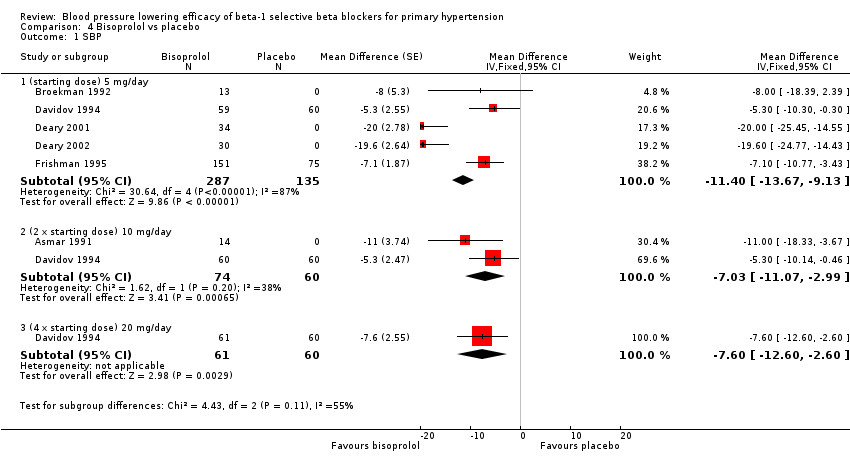
Comparison 4 Bisoprolol vs placebo, Outcome 1 SBP.
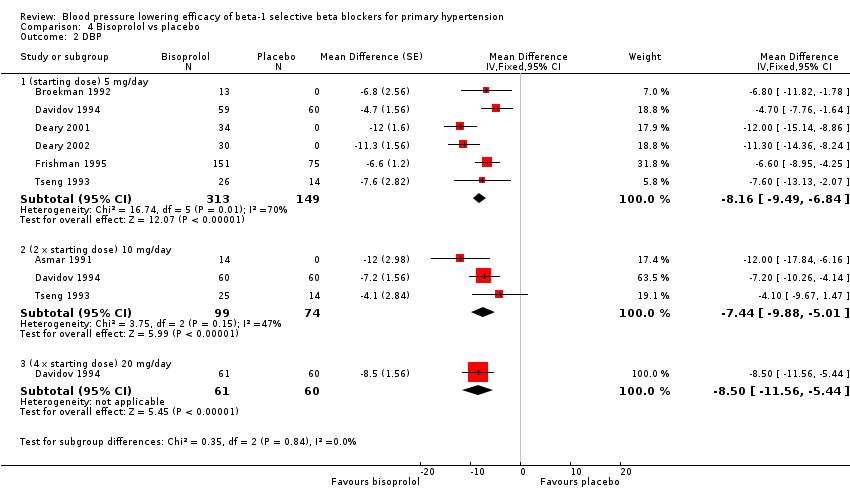
Comparison 4 Bisoprolol vs placebo, Outcome 2 DBP.
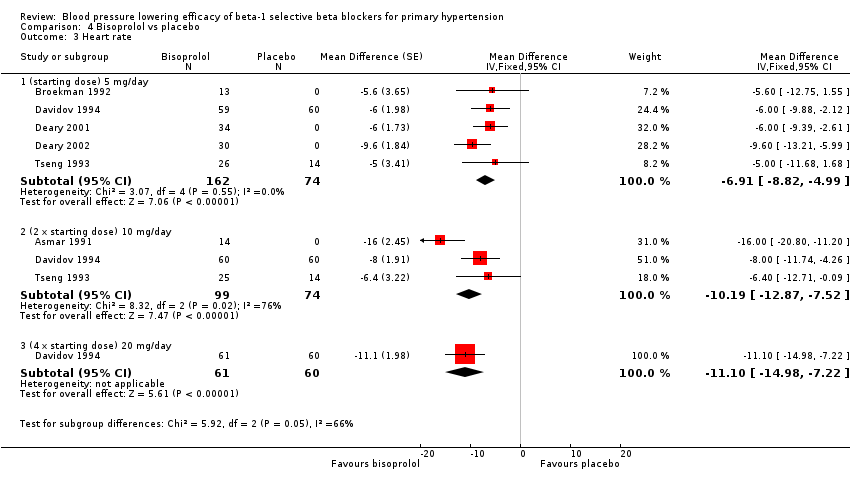
Comparison 4 Bisoprolol vs placebo, Outcome 3 Heart rate.

Comparison 4 Bisoprolol vs placebo, Outcome 4 Pulse pressure.

Comparison 5 Betaxolol vs Placebo, Outcome 1 SBP.

Comparison 5 Betaxolol vs Placebo, Outcome 2 DBP.
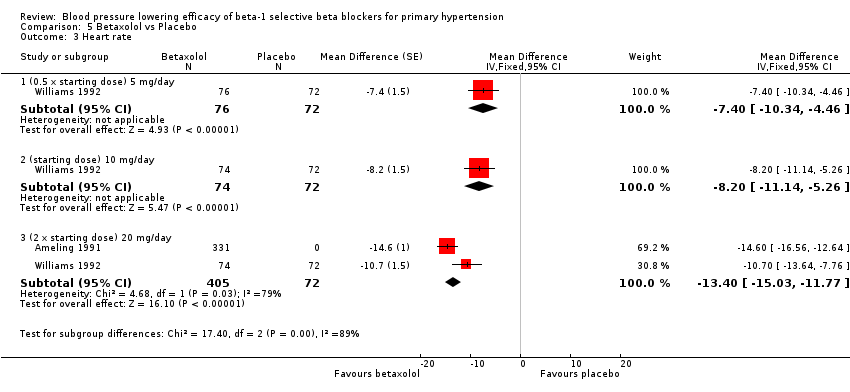
Comparison 5 Betaxolol vs Placebo, Outcome 3 Heart rate.
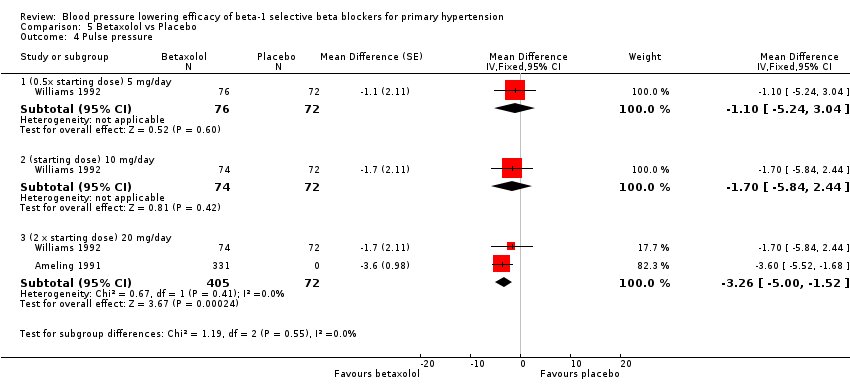
Comparison 5 Betaxolol vs Placebo, Outcome 4 Pulse pressure.
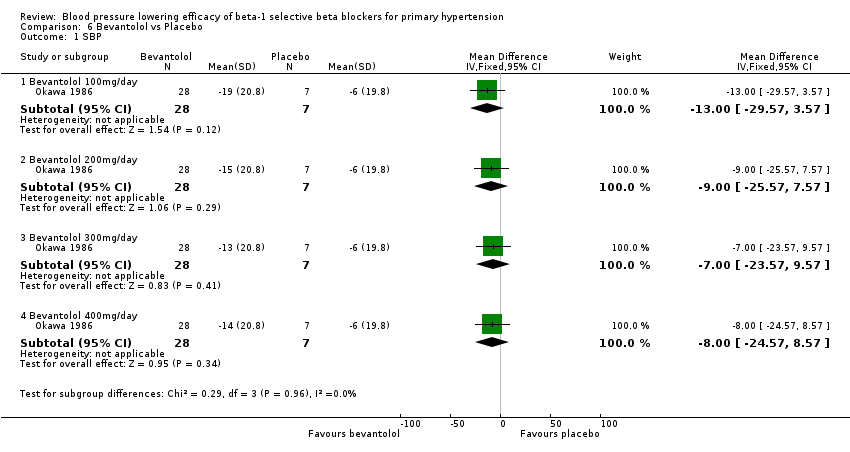
Comparison 6 Bevantolol vs Placebo, Outcome 1 SBP.

Comparison 6 Bevantolol vs Placebo, Outcome 2 DBP.

Comparison 6 Bevantolol vs Placebo, Outcome 3 Heart rate.
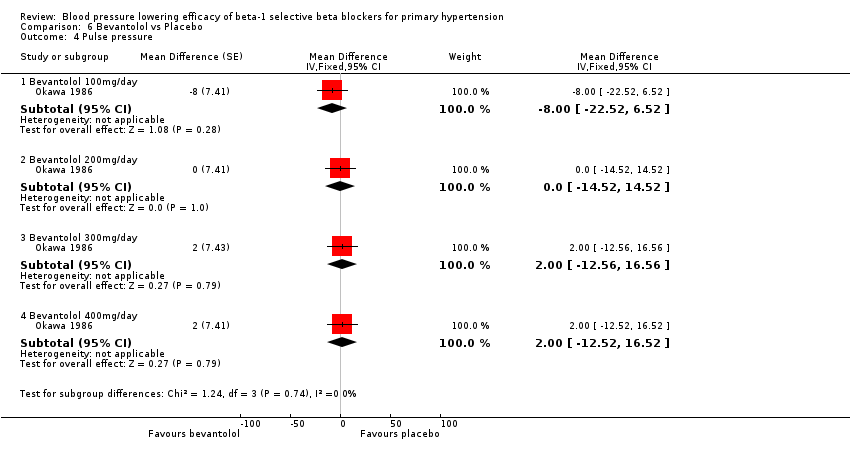
Comparison 6 Bevantolol vs Placebo, Outcome 4 Pulse pressure.
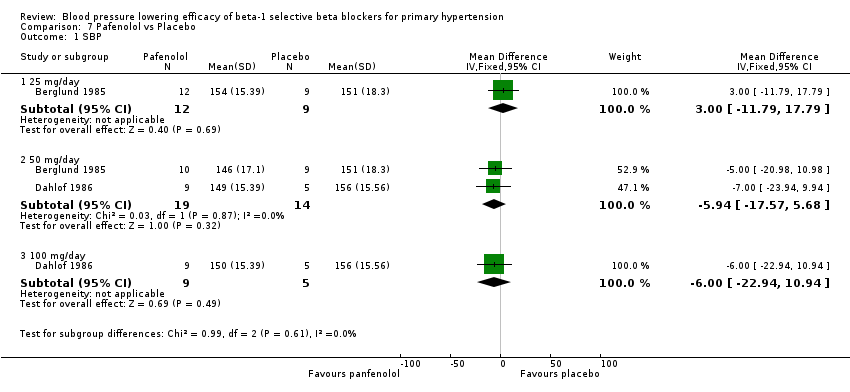
Comparison 7 Pafenolol vs Placebo, Outcome 1 SBP.

Comparison 7 Pafenolol vs Placebo, Outcome 2 DBP.
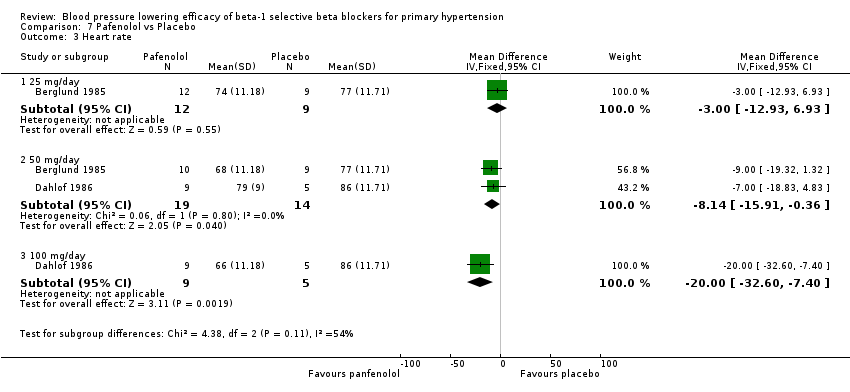
Comparison 7 Pafenolol vs Placebo, Outcome 3 Heart rate.
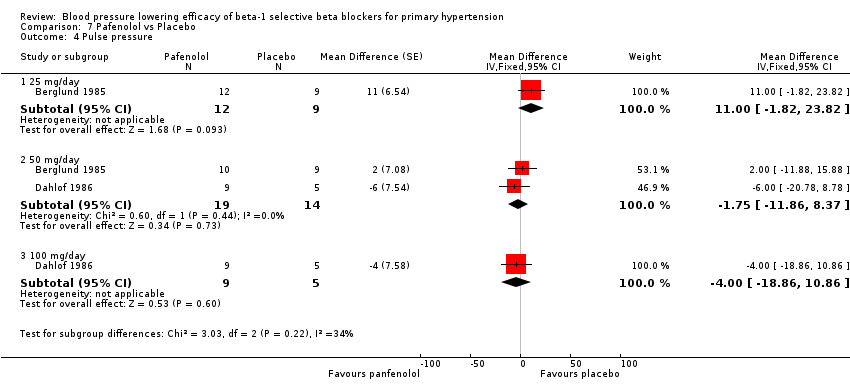
Comparison 7 Pafenolol vs Placebo, Outcome 4 Pulse pressure.
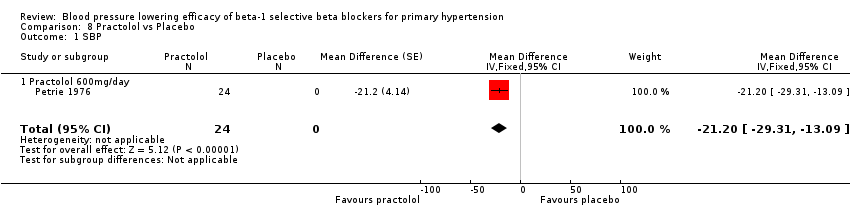
Comparison 8 Practolol vs Placebo, Outcome 1 SBP.

Comparison 8 Practolol vs Placebo, Outcome 2 DBP.

Comparison 8 Practolol vs Placebo, Outcome 3 Heart rate.
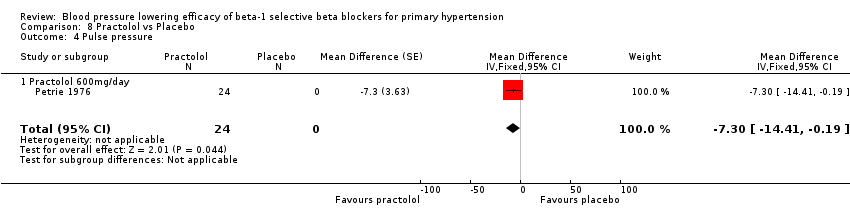
Comparison 8 Practolol vs Placebo, Outcome 4 Pulse pressure.

Comparison 9 Pooled overall effect, Outcome 1 SBP.

Comparison 9 Pooled overall effect, Outcome 2 DBP.

Comparison 9 Pooled overall effect, Outcome 3 Heart rate.

Comparison 9 Pooled overall effect, Outcome 4 Pulse pressure.
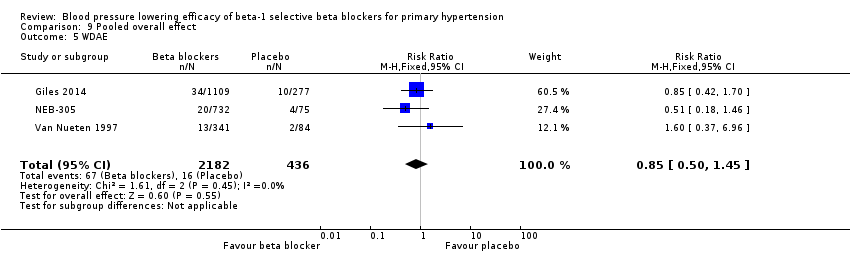
Comparison 9 Pooled overall effect, Outcome 5 WDAE.

Comparison 9 Pooled overall effect, Outcome 6 SBP combined starting dose and 2 x starting dose.
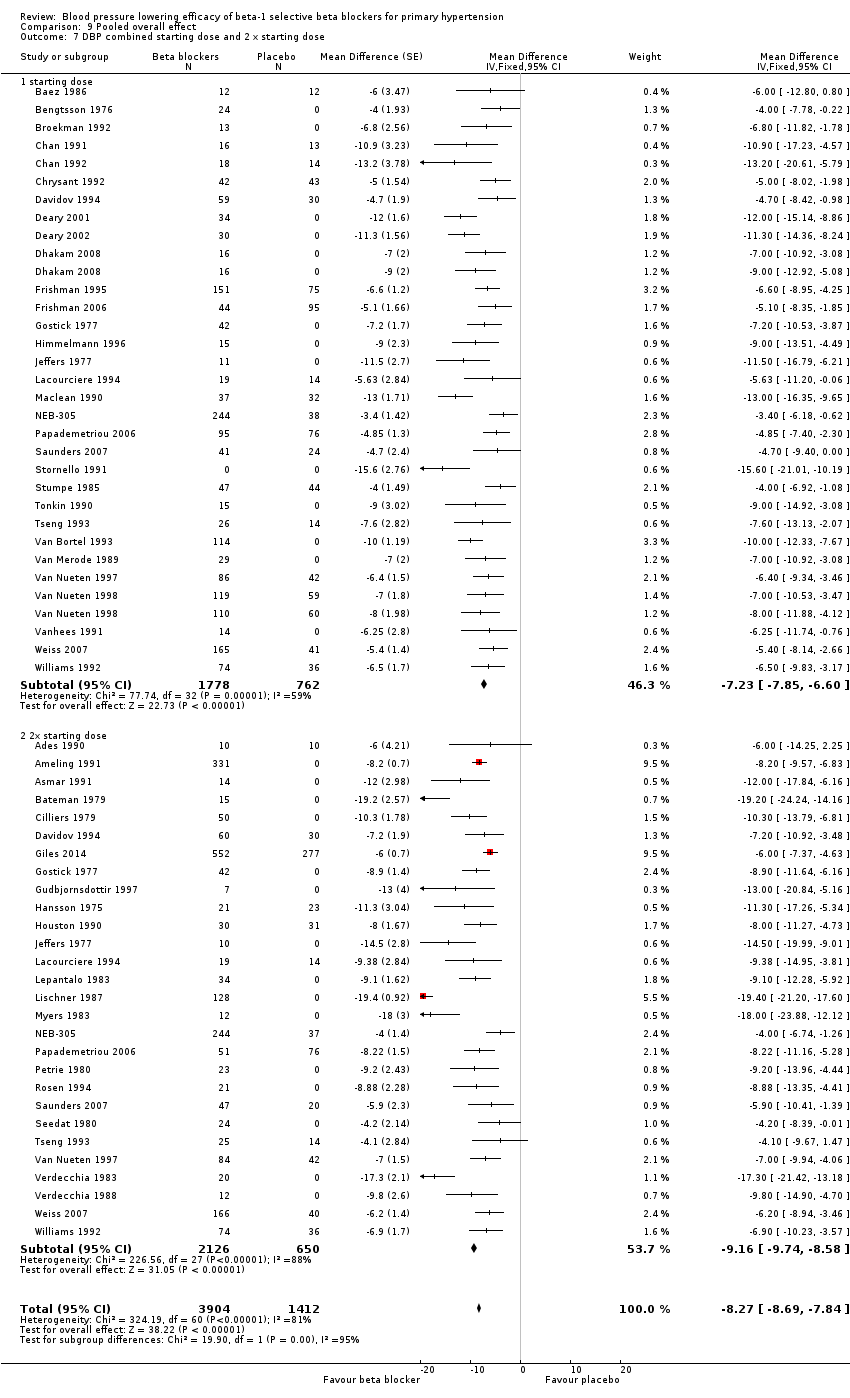
Comparison 9 Pooled overall effect, Outcome 7 DBP combined starting dose and 2 x starting dose.

Comparison 9 Pooled overall effect, Outcome 8 Heart rate combined starting dose and 2 x starting dose.

Comparison 9 Pooled overall effect, Outcome 9 Pulse pressure combined starting dose and 2 x starting dose.
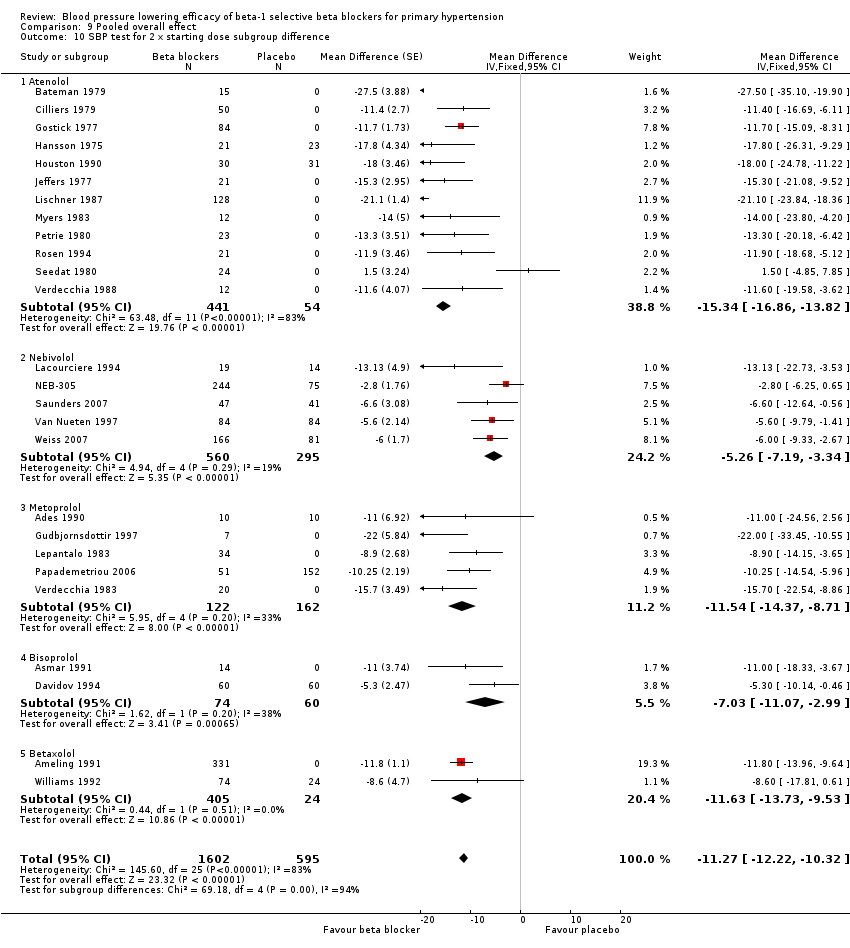
Comparison 9 Pooled overall effect, Outcome 10 SBP test for 2 x starting dose subgroup difference.

Comparison 9 Pooled overall effect, Outcome 11 DBP test for 2 x starting dose subgroup difference.
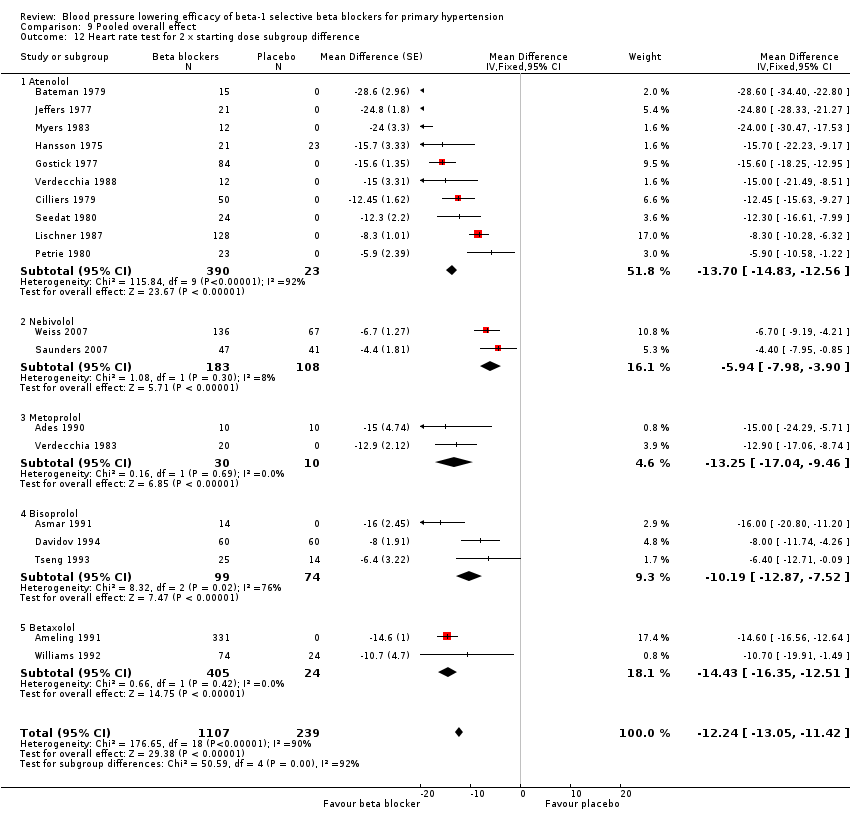
Comparison 9 Pooled overall effect, Outcome 12 Heart rate test for 2 x starting dose subgroup difference.
| Blood pressure lowering effects of beta‐1 blockers compared with placebo for primary hypertension | |||
| Patient or population: People with primary hypertension Intervention: Beta‐1 selective blockers Comparison: Placebo | |||
| Outcomes | mean estimates of combining 1x and 2x starting dose | No of Participants | Quality of the evidence |
| Systolic blood pressure | ‐10.4 (‐11.1, ‐9.7)1,2,3 | 5246 (47) | Low4,5 |
| Diastolic blood pressure | ‐8.3 (‐8.7, ‐7.8)1,2,3 | 5316 (48) | Low4,5 |
| Heart rate | ‐10.9 (‐11.5, ‐10.4)1,2 | 3407 (33) | Low4,5 |
| Pulse pressure | ‐1.8 [‐2.3, ‐1.2]1,2 | 5246 (47) | Very low4,5,6 |
| WDAE | 0.9 (0.5, 1.5) | 2618 (3) | Low7,8 |
| 95% CI: 95% confident interval; WDAE: Withdrawal due to adverse effect. | |||
| GRADE Working Group grades of evidence | |||
| Footnotes | |||
|
| |||
| Outcome or subgroup title | No. of studies | No. of participants | Statistical method | Effect size |
| 1 SBP Show forest plot | 13 | Mean Difference (Fixed, 95% CI) | Subtotals only | |
| 1.1 (0.25 x starting dose) 1.0 & 1.25 mg/day | 3 | 366 | Mean Difference (Fixed, 95% CI) | ‐4.49 [‐7.15, ‐1.83] |
| 1.2 (0.5 x starting dose) 2.5 mg/day | 3 | 415 | Mean Difference (Fixed, 95% CI) | ‐4.96 [‐7.66, ‐2.26] |
| 1.3 (starting dose) 5 mg/day | 12 | 1280 | Mean Difference (Fixed, 95% CI) | ‐8.81 [‐10.23, ‐7.40] |
| 1.4 (2 x starting dose) 10 mg/day | 6 | 1684 | Mean Difference (Fixed, 95% CI) | ‐6.04 [‐7.47, ‐4.60] |
| 1.5 (4 x starting dose) 20 mg/day | 3 | 652 | Mean Difference (Fixed, 95% CI) | ‐6.95 [‐9.26, ‐4.63] |
| 1.6 (8 x starting dose) 30, 40 mg/day | 3 | 1155 | Mean Difference (Fixed, 95% CI) | ‐8.10 [‐9.84, ‐6.36] |
| 2 DBP Show forest plot | 13 | Mean Difference (Fixed, 95% CI) | Subtotals only | |
| 2.1 (0.25 x starting dose) 1.0 & 1.25 mg/day | 3 | 366 | Mean Difference (Fixed, 95% CI) | ‐3.55 [‐5.17, ‐1.93] |
| 2.2 (0.5 x starting dose) 2.5 mg/day | 3 | 415 | Mean Difference (Fixed, 95% CI) | ‐4.23 [‐5.76, ‐2.70] |
| 2.3 (starting dose) 5 mg/day | 12 | 1280 | Mean Difference (Fixed, 95% CI) | ‐6.67 [‐7.54, ‐5.80] |
| 2.4 (2 x starting dose) 10 mg/day | 6 | 1684 | Mean Difference (Fixed, 95% CI) | ‐5.90 [‐6.78, ‐5.01] |
| 2.5 (4 x starting dose) 20 mg/day | 3 | 652 | Mean Difference (Fixed, 95% CI) | ‐5.81 [‐7.21, ‐4.41] |
| 2.6 (8 x starting dose) 30, 40 mg/day | 3 | 1155 | Mean Difference (Fixed, 95% CI) | ‐7.70 [‐8.80, ‐6.61] |
| 3 Heart rate Show forest plot | 8 | Mean Difference (Fixed, 95% CI) | Subtotals only | |
| 3.1 (0.25 x starting dose) 1.25 mg/day | 1 | 136 | Mean Difference (Fixed, 95% CI) | ‐2.9 [‐5.86, 0.06] |
| 3.2 (0.5 x starting dose) 2.5 mg/day | 2 | 218 | Mean Difference (Fixed, 95% CI) | ‐3.89 [‐6.18, ‐1.61] |
| 3.3 (starting dose) 5 mg/day | 7 | 487 | Mean Difference (Fixed, 95% CI) | ‐8.21 [‐9.66, ‐6.76] |
| 3.4 (2 x starting dose) 10 mg/day | 3 | 1120 | Mean Difference (Fixed, 95% CI) | ‐7.23 [‐8.48, ‐5.99] |
| 3.5 (4 x starting dose) 20 mg/day | 2 | 298 | Mean Difference (Fixed, 95% CI) | ‐8.43 [‐10.48, ‐6.38] |
| 3.6 (8 x starting dose) 30, 40 mg/day | 3 | 1155 | Mean Difference (Fixed, 95% CI) | ‐10.94 [‐12.18, ‐9.71] |
| 4 Pulse Pressure Show forest plot | 13 | Mean Difference (Fixed, 95% CI) | Subtotals only | |
| 4.1 (0.25 x starting dose) 1.0 & 1.25 mg/day | 3 | 366 | Mean Difference (Fixed, 95% CI) | ‐0.88 [‐3.21, 1.45] |
| 4.2 (0.5 x starting dose) 2.5 mg/day | 3 | 415 | Mean Difference (Fixed, 95% CI) | ‐0.95 [‐3.32, 1.41] |
| 4.3 (starting dose) 5 mg/day | 12 | 1314 | Mean Difference (Fixed, 95% CI) | ‐1.62 [‐2.83, ‐0.41] |
| 4.4 (2 x starting dose) 10 mg/day | 6 | 1684 | Mean Difference (Fixed, 95% CI) | ‐0.19 [‐1.47, 1.08] |
| 4.5 (4 x starting dose) 20 mg/day | 3 | 652 | Mean Difference (Fixed, 95% CI) | ‐1.25 [‐3.38, 0.89] |
| 4.6 (8 x starting dose) 30, 40 mg/day | 3 | 1155 | Mean Difference (Fixed, 95% CI) | ‐0.37 [‐1.94, 1.20] |
| 5 Peak vs Trough SBP Show forest plot | 4 | Mean Difference (Fixed, 95% CI) | Subtotals only | |
| 5.1 (0.25 x starting dose) 1.0 & 1.25 mg/day | 2 | 335 | Mean Difference (Fixed, 95% CI) | 0.30 [‐1.90, 2.49] |
| 5.2 (0.5 x starting dose) 2.5 mg/day | 3 | 415 | Mean Difference (Fixed, 95% CI) | ‐1.24 [‐3.28, 0.81] |
| 5.3 (starting dose) 5 mg/day | 4 | 817 | Mean Difference (Fixed, 95% CI) | 1.40 [0.14, 2.66] |
| 5.4 (2 x starting dose) 10 mg/day | 4 | 822 | Mean Difference (Fixed, 95% CI) | ‐0.17 [‐1.42, 1.08] |
| 5.5 (4 x starting dose) 20 mg/day | 3 | 652 | Mean Difference (Fixed, 95% CI) | 1.17 [‐0.27, 2.61] |
| 5.6 (8 x starting dose) 30, 40 mg/day | 2 | 331 | Mean Difference (Fixed, 95% CI) | ‐1.20 [‐3.19, 0.78] |
| 6 Peak vs Trough DBP Show forest plot | 4 | 3372 | Mean Difference (Fixed, 95% CI) | ‐1.53 [‐1.95, ‐1.11] |
| 6.1 (0.25 x starting dose) 1.0 & 1.25 mg/day | 2 | 335 | Mean Difference (Fixed, 95% CI) | ‐0.95 [‐2.38, 0.48] |
| 6.2 (0.5 x starting dose) 2.5 mg/day | 3 | 415 | Mean Difference (Fixed, 95% CI) | ‐1.88 [‐3.12, ‐0.64] |
| 6.3 (starting dose) 5 mg/day | 4 | 817 | Mean Difference (Fixed, 95% CI) | ‐1.54 [‐2.52, ‐0.57] |
| 6.4 (2 x starting dose) 10 mg/day | 4 | 822 | Mean Difference (Fixed, 95% CI) | ‐1.06 [‐1.86, ‐0.26] |
| 6.5 (4 x starting dose) 20 mg/day | 3 | 652 | Mean Difference (Fixed, 95% CI) | ‐1.53 [‐2.41, ‐0.65] |
| 6.6 (8 x starting dose) 30, 40 mg/day | 2 | 331 | Mean Difference (Fixed, 95% CI) | ‐2.73 [‐3.98, ‐1.49] |
| Outcome or subgroup title | No. of studies | No. of participants | Statistical method | Effect size |
| 1 SBP Show forest plot | 22 | Mean Difference (Fixed, 95% CI) | Subtotals only | |
| 1.1 (0.5 x starting dose) 25 mg/day | 1 | 87 | Mean Difference (Fixed, 95% CI) | ‐7.0 [‐12.55, ‐1.45] |
| 1.2 (starting dose) 50 mg/day | 11 | 669 | Mean Difference (Fixed, 95% CI) | ‐10.28 [‐11.94, ‐8.62] |
| 1.3 (2 x starting dose) 100 mg/day | 12 | 495 | Mean Difference (Fixed, 95% CI) | ‐15.34 [‐16.86, ‐13.82] |
| 1.4 (4 x starting dose) 150 & 200 mg/day | 3 | 121 | Mean Difference (Fixed, 95% CI) | ‐11.29 [‐14.03, ‐8.55] |
| 2 DBP Show forest plot | 22 | Mean Difference (Fixed, 95% CI) | Subtotals only | |
| 2.1 (0.5 x starting dose) 25 mg/day | 1 | 87 | Mean Difference (Fixed, 95% CI) | ‐4.0 [‐6.76, ‐1.24] |
| 2.2 (starting dose) 50 mg/day | 11 | 657 | Mean Difference (Fixed, 95% CI) | ‐7.78 [‐8.80, ‐6.76] |
| 2.3 (2 x starting dose) 100 mg/day | 12 | 495 | Mean Difference (Fixed, 95% CI) | ‐12.91 [‐13.89, ‐11.93] |
| 2.4 (4 x starting dose) 150, 200 mg/day | 3 | 121 | Mean Difference (Fixed, 95% CI) | ‐8.76 [‐10.56, ‐6.95] |
| 3 Heart rate Show forest plot | 17 | Mean Difference (Fixed, 95% CI) | Subtotals only | |
| 3.1 (0.5 x starting dose) 25 mg/day | 1 | 87 | Mean Difference (Fixed, 95% CI) | ‐4.0 [‐9.55, 1.55] |
| 3.2 (starting dose) 50 mg/day | 7 | 470 | Mean Difference (Fixed, 95% CI) | ‐12.04 [‐13.39, ‐10.68] |
| 3.3 (2 x starting dose) 100 mg/day | 10 | 413 | Mean Difference (Fixed, 95% CI) | ‐13.70 [‐14.83, ‐12.56] |
| 3.4 (4 x starting dose) 150, 200 mg/day | 4 | 129 | Mean Difference (Fixed, 95% CI) | ‐18.33 [‐20.26, ‐16.41] |
| 4 Pulse pressure Show forest plot | 22 | Mean Difference (Fixed, 95% CI) | Subtotals only | |
| 4.1 (0.5 x starting dose) 25 mg/day | 1 | 87 | Mean Difference (Fixed, 95% CI) | ‐3.0 [‐7.80, 1.80] |
| 4.2 (starting dose) 50 mg/day | 11 | 669 | Mean Difference (Fixed, 95% CI) | ‐2.30 [‐3.71, ‐0.90] |
| 4.3 (2 x starting dose) 100 mg/day | 12 | 495 | Mean Difference (Fixed, 95% CI) | ‐2.01 [‐3.24, ‐0.77] |
| 4.4 (4 x starting dose) 150, 200 mg/day | 3 | 121 | Mean Difference (Fixed, 95% CI) | ‐2.62 [‐4.82, ‐0.42] |
| Outcome or subgroup title | No. of studies | No. of participants | Statistical method | Effect size |
| 1 SBP Show forest plot | 9 | Mean Difference (Fixed, 95% CI) | Subtotals only | |
| 1.1 (0.25 x starting dose) 25 mg/day | 2 | 424 | Mean Difference (Fixed, 95% CI) | ‐6.33 [‐9.22, ‐3.44] |
| 1.2 (0.5 x starting dose) 50 mg/day | 2 | 339 | Mean Difference (Fixed, 95% CI) | ‐6.30 [‐9.47, ‐3.13] |
| 1.3 (starting dose) 100 mg/day | 3 | 410 | Mean Difference (Fixed, 95% CI) | ‐5.35 [‐8.12, ‐2.58] |
| 1.4 (2 x starting dose) 200 mg/day | 5 | 284 | Mean Difference (Fixed, 95% CI) | ‐11.54 [‐14.37, ‐8.71] |
| 1.5 (4 x starting dose) 400 mg/day | 2 | 193 | Mean Difference (Fixed, 95% CI) | ‐10.91 [‐15.42, ‐6.40] |
| 2 DBP Show forest plot | 9 | Mean Difference (Fixed, 95% CI) | Subtotals only | |
| 2.1 (0.25 x starting dose) 25 mg/day | 2 | 424 | Mean Difference (Fixed, 95% CI) | ‐3.64 [‐5.44, ‐1.85] |
| 2.2 (0.5 x starting dose) 50 mg/day | 2 | 339 | Mean Difference (Fixed, 95% CI) | ‐4.56 [‐6.42, ‐2.70] |
| 2.3 (starting dose) 100 & 120 mg/day | 3 | 410 | Mean Difference (Fixed, 95% CI) | ‐4.74 [‐6.50, ‐2.98] |
| 2.4 (2 x starting dose) 200 mg/day | 5 | 284 | Mean Difference (Fixed, 95% CI) | ‐10.25 [‐11.99, ‐8.51] |
| 2.5 (4 x starting dose) 400 mg/day | 2 | 193 | Mean Difference (Fixed, 95% CI) | ‐7.71 [‐10.72, ‐4.69] |
| 3 Heart rate Show forest plot | 5 | Mean Difference (Fixed, 95% CI) | Subtotals only | |
| 3.1 (0.5 x starting dose) 50 mg/day | 1 | 94 | Mean Difference (Fixed, 95% CI) | ‐5.6 [‐10.03, ‐1.17] |
| 3.2 (starting dose) 100 & 120 mg/day | 1 | 24 | Mean Difference (Fixed, 95% CI) | ‐15.0 [‐18.92, ‐11.08] |
| 3.3 (2 x starting dose) 200 mg/day | 2 | 40 | Mean Difference (Fixed, 95% CI) | ‐13.25 [‐17.04, ‐9.46] |
| 3.4 (4 x starting dose) 400 mg/day | 1 | 8 | Mean Difference (Fixed, 95% CI) | ‐20.00 [‐25.88, ‐14.12] |
| 4 Pulse pressure Show forest plot | 9 | Mean Difference (Fixed, 95% CI) | Subtotals only | |
| 4.1 (0.25 x starting dose) 25 mg/day | 2 | 424 | Mean Difference (Fixed, 95% CI) | ‐2.70 [‐5.23, ‐0.17] |
| 4.2 (0.5 x starting dose) 50 mg/day | 2 | 339 | Mean Difference (Fixed, 95% CI) | ‐1.74 [‐4.52, 1.04] |
| 4.3 (starting dose) 100 mg/day | 3 | 410 | Mean Difference (Fixed, 95% CI) | ‐0.58 [‐3.01, 1.85] |
| 4.4 (2 x starting dose) 200 mg/day | 5 | 284 | Mean Difference (Fixed, 95% CI) | ‐1.22 [‐3.62, 1.18] |
| 4.5 (4 x starting dose) 400 mg/day | 2 | 193 | Mean Difference (Fixed, 95% CI) | ‐3.30 [‐7.29, 0.69] |
| Outcome or subgroup title | No. of studies | No. of participants | Statistical method | Effect size |
| 1 SBP Show forest plot | 6 | Mean Difference (Fixed, 95% CI) | Subtotals only | |
| 1.1 (starting dose) 5 mg/day | 5 | 422 | Mean Difference (Fixed, 95% CI) | ‐11.40 [‐13.67, ‐9.13] |
| 1.2 (2 x starting dose) 10 mg/day | 2 | 134 | Mean Difference (Fixed, 95% CI) | ‐7.03 [‐11.07, ‐2.99] |
| 1.3 (4 x starting dose) 20 mg/day | 1 | 121 | Mean Difference (Fixed, 95% CI) | ‐7.6 [‐12.60, ‐2.60] |
| 2 DBP Show forest plot | 7 | Mean Difference (Fixed, 95% CI) | Subtotals only | |
| 2.1 (starting dose) 5 mg/day | 6 | 462 | Mean Difference (Fixed, 95% CI) | ‐8.16 [‐9.49, ‐6.84] |
| 2.2 (2 x starting dose) 10 mg/day | 3 | 173 | Mean Difference (Fixed, 95% CI) | ‐7.44 [‐9.88, ‐5.01] |
| 2.3 (4 x starting dose) 20 mg/day | 1 | 121 | Mean Difference (Fixed, 95% CI) | ‐8.5 [‐11.56, ‐5.44] |
| 3 Heart rate Show forest plot | 6 | Mean Difference (Fixed, 95% CI) | Subtotals only | |
| 3.1 (starting dose) 5 mg/day | 5 | 236 | Mean Difference (Fixed, 95% CI) | ‐6.91 [‐8.82, ‐4.99] |
| 3.2 (2 x starting dose) 10 mg/day | 3 | 173 | Mean Difference (Fixed, 95% CI) | ‐10.19 [‐12.87, ‐7.52] |
| 3.3 (4 x starting dose) 20 mg/day | 1 | 121 | Mean Difference (Fixed, 95% CI) | ‐11.1 [‐14.98, ‐7.22] |
| 4 Pulse pressure Show forest plot | 6 | Mean Difference (Fixed, 95% CI) | Subtotals only | |
| 4.1 (starting dose) 5 mg/day | 5 | 422 | Mean Difference (Fixed, 95% CI) | ‐3.35 [‐5.32, ‐1.38] |
| 4.2 (2 x starting dose) 10 mg/day | 2 | 134 | Mean Difference (Fixed, 95% CI) | 1.65 [‐1.96, 5.26] |
| 4.3 (4 x starting dose) 20 mg/day | 1 | 121 | Mean Difference (Fixed, 95% CI) | 0.9 [‐3.45, 5.25] |
| Outcome or subgroup title | No. of studies | No. of participants | Statistical method | Effect size |
| 1 SBP Show forest plot | 2 | Mean Difference (Fixed, 95% CI) | Subtotals only | |
| 1.1 (0.5 x starting dose) 5 mg/day | 1 | 148 | Mean Difference (Fixed, 95% CI) | ‐5.81 [‐10.55, ‐1.07] |
| 1.2 (starting dose) 10 mg/day | 1 | 146 | Mean Difference (Fixed, 95% CI) | ‐8.2 [‐12.94, ‐3.46] |
| 1.3 (2 x starting dose) 20 mg/day | 2 | 477 | Mean Difference (Fixed, 95% CI) | ‐11.25 [‐13.21, ‐9.29] |
| 2 DBP Show forest plot | 2 | Mean Difference (Fixed, 95% CI) | Subtotals only | |
| 2.1 (0.5 x starting dose) 5 mg/day | 1 | 148 | Mean Difference (Fixed, 95% CI) | ‐3.8 [‐6.54, ‐1.06] |
| 2.2 (starting dose) 10 mg/day | 1 | 146 | Mean Difference (Fixed, 95% CI) | ‐6.5 [‐9.24, ‐3.76] |
| 2.3 (2 x starting dose) 20 mg/day | 2 | 477 | Mean Difference (Fixed, 95% CI) | ‐7.94 [‐9.17, ‐6.71] |
| 3 Heart rate Show forest plot | 2 | Mean Difference (Fixed, 95% CI) | Subtotals only | |
| 3.1 (0.5 x starting dose) 5 mg/day | 1 | 148 | Mean Difference (Fixed, 95% CI) | ‐7.4 [‐10.34, ‐4.46] |
| 3.2 (starting dose) 10 mg/day | 1 | 146 | Mean Difference (Fixed, 95% CI) | ‐8.2 [‐11.14, ‐5.26] |
| 3.3 (2 x starting dose) 20 mg/day | 2 | 477 | Mean Difference (Fixed, 95% CI) | ‐13.40 [‐15.03, ‐11.77] |
| 4 Pulse pressure Show forest plot | 2 | Mean Difference (Fixed, 95% CI) | Subtotals only | |
| 4.1 (0.5x starting dose) 5 mg/day | 1 | 148 | Mean Difference (Fixed, 95% CI) | ‐1.1 [‐5.24, 3.04] |
| 4.2 (starting dose) 10 mg/day | 1 | 146 | Mean Difference (Fixed, 95% CI) | ‐1.7 [‐5.84, 2.44] |
| 4.3 (2 x starting dose) 20 mg/day | 2 | 477 | Mean Difference (Fixed, 95% CI) | ‐3.26 [‐5.00, ‐1.52] |
| Outcome or subgroup title | No. of studies | No. of participants | Statistical method | Effect size |
| 1 SBP Show forest plot | 1 | Mean Difference (IV, Fixed, 95% CI) | Subtotals only | |
| 1.1 Bevantolol 100mg/day | 1 | 35 | Mean Difference (IV, Fixed, 95% CI) | ‐13.0 [‐29.57, 3.57] |
| 1.2 Bevantolol 200mg/day | 1 | 35 | Mean Difference (IV, Fixed, 95% CI) | ‐9.0 [‐25.57, 7.57] |
| 1.3 Bevantolol 300mg/day | 1 | 35 | Mean Difference (IV, Fixed, 95% CI) | ‐7.0 [‐23.57, 9.57] |
| 1.4 Bevantolol 400mg/day | 1 | 35 | Mean Difference (IV, Fixed, 95% CI) | ‐8.0 [‐24.57, 8.57] |
| 2 DBP Show forest plot | 1 | Mean Difference (IV, Fixed, 95% CI) | Subtotals only | |
| 2.1 Bevantolol 100mg/day | 1 | 35 | Mean Difference (IV, Fixed, 95% CI) | ‐5.0 [‐15.52, 5.52] |
| 2.2 Bevantolol 200mg/day | 1 | 35 | Mean Difference (IV, Fixed, 95% CI) | ‐9.0 [‐19.52, 1.52] |
| 2.3 Bevantolol 300mg/day | 1 | 35 | Mean Difference (IV, Fixed, 95% CI) | ‐9.0 [‐19.52, 1.52] |
| 2.4 Bevantolol 400mg/day | 1 | 35 | Mean Difference (IV, Fixed, 95% CI) | ‐10.0 [‐20.52, 0.52] |
| 3 Heart rate Show forest plot | 1 | Mean Difference (IV, Fixed, 95% CI) | Subtotals only | |
| 3.1 Bevantolol 100mg/day | 1 | 35 | Mean Difference (IV, Fixed, 95% CI) | ‐13.0 [‐29.57, 3.57] |
| 3.2 Bevantolol 200mg/day | 1 | 35 | Mean Difference (IV, Fixed, 95% CI) | ‐9.0 [‐25.57, 7.57] |
| 3.3 Bevantolol 300mg/day | 1 | 35 | Mean Difference (IV, Fixed, 95% CI) | ‐7.0 [‐23.57, 9.57] |
| 3.4 Bevantolol 400mg/day | 1 | 35 | Mean Difference (IV, Fixed, 95% CI) | ‐8.0 [‐24.57, 8.57] |
| 4 Pulse pressure Show forest plot | 1 | Mean Difference (Fixed, 95% CI) | Subtotals only | |
| 4.1 Bevantolol 100mg/day | 1 | Mean Difference (Fixed, 95% CI) | ‐8.0 [‐22.52, 6.52] | |
| 4.2 Bevantolol 200mg/day | 1 | Mean Difference (Fixed, 95% CI) | 0.0 [‐14.52, 14.52] | |
| 4.3 Bevantolol 300mg/day | 1 | Mean Difference (Fixed, 95% CI) | 2.0 [‐12.56, 16.56] | |
| 4.4 Bevantolol 400mg/day | 1 | Mean Difference (Fixed, 95% CI) | 2.0 [‐12.52, 16.52] | |
| Outcome or subgroup title | No. of studies | No. of participants | Statistical method | Effect size |
| 1 SBP Show forest plot | 2 | Mean Difference (IV, Fixed, 95% CI) | Subtotals only | |
| 1.1 25 mg/day | 1 | 21 | Mean Difference (IV, Fixed, 95% CI) | 3.0 [‐11.79, 17.79] |
| 1.2 50 mg/day | 2 | 33 | Mean Difference (IV, Fixed, 95% CI) | ‐5.94 [‐17.57, 5.68] |
| 1.3 100 mg/day | 1 | 14 | Mean Difference (IV, Fixed, 95% CI) | ‐6.0 [‐22.94, 10.94] |
| 2 DBP Show forest plot | 2 | Mean Difference (IV, Fixed, 95% CI) | Subtotals only | |
| 2.1 25 mg/day | 1 | 21 | Mean Difference (IV, Fixed, 95% CI) | ‐8.0 [‐16.73, 0.73] |
| 2.2 50 mg/day | 2 | 33 | Mean Difference (IV, Fixed, 95% CI) | ‐4.41 [‐11.22, 2.40] |
| 2.3 100 mg/day | 1 | 14 | Mean Difference (IV, Fixed, 95% CI) | ‐2.0 [‐12.75, 8.75] |
| 3 Heart rate Show forest plot | 2 | Mean Difference (IV, Fixed, 95% CI) | Subtotals only | |
| 3.1 25 mg/day | 1 | 21 | Mean Difference (IV, Fixed, 95% CI) | ‐3.0 [‐12.93, 6.93] |
| 3.2 50 mg/day | 2 | 33 | Mean Difference (IV, Fixed, 95% CI) | ‐8.14 [‐15.91, ‐0.36] |
| 3.3 100 mg/day | 1 | 14 | Mean Difference (IV, Fixed, 95% CI) | ‐20.0 [‐32.60, ‐7.40] |
| 4 Pulse pressure Show forest plot | 2 | Mean Difference (Fixed, 95% CI) | Subtotals only | |
| 4.1 25 mg/day | 1 | 21 | Mean Difference (Fixed, 95% CI) | 11.0 [‐1.82, 23.82] |
| 4.2 50 mg/day | 2 | 33 | Mean Difference (Fixed, 95% CI) | ‐1.75 [‐11.86, 8.37] |
| 4.3 100 mg/day | 1 | 14 | Mean Difference (Fixed, 95% CI) | ‐4.0 [‐18.86, 10.86] |
| Outcome or subgroup title | No. of studies | No. of participants | Statistical method | Effect size |
| 1 SBP Show forest plot | 1 | 24 | Mean Difference (Fixed, 95% CI) | ‐21.2 [‐29.31, ‐13.09] |
| 1.1 Practolol 600mg/day | 1 | 24 | Mean Difference (Fixed, 95% CI) | ‐21.2 [‐29.31, ‐13.09] |
| 2 DBP Show forest plot | 1 | 24 | Mean Difference (Fixed, 95% CI) | ‐13.9 [‐17.00, ‐8.80] |
| 2.1 Practolol 600mg/day | 1 | 24 | Mean Difference (Fixed, 95% CI) | ‐13.9 [‐17.00, ‐8.80] |
| 3 Heart rate Show forest plot | 1 | 24 | Mean Difference (Fixed, 95% CI) | ‐14.0 [‐21.45, ‐6.55] |
| 3.1 Practolol 600mg/day | 1 | 24 | Mean Difference (Fixed, 95% CI) | ‐14.0 [‐21.45, ‐6.55] |
| 4 Pulse pressure Show forest plot | 1 | 24 | Mean Difference (Fixed, 95% CI) | ‐7.30 [‐14.41, ‐0.19] |
| 4.1 Practolol 600mg/day | 1 | 24 | Mean Difference (Fixed, 95% CI) | ‐7.30 [‐14.41, ‐0.19] |
| Outcome or subgroup title | No. of studies | No. of participants | Statistical method | Effect size |
| 1 SBP Show forest plot | 50 | Mean Difference (Fixed, 95% CI) | Subtotals only | |
| 1.1 0.25 x starting dose | 5 | 790 | Mean Difference (Fixed, 95% CI) | ‐5.34 [‐7.29, ‐3.38] |
| 1.2 0.5 x starting dose | 7 | 941 | Mean Difference (Fixed, 95% CI) | ‐5.71 [‐7.59, ‐3.82] |
| 1.3 starting dose | 30 | 2879 | Mean Difference (Fixed, 95% CI) | ‐9.29 [‐10.21, ‐8.38] |
| 1.4 2 x starting dose | 27 | 3026 | Mean Difference (Fixed, 95% CI) | ‐10.58 [‐11.45, ‐9.71] |
| 1.5 4 x starting dose | 9 | 1087 | Mean Difference (Fixed, 95% CI) | ‐8.90 [‐10.47, ‐7.34] |
| 1.6 8 x starting dose | 2 | 331 | Mean Difference (Fixed, 95% CI) | ‐8.29 [‐11.24, ‐5.35] |
| 2 DBP Show forest plot | 51 | Mean Difference (Fixed, 95% CI) | Subtotals only | |
| 2.1 0.25 x starting dose | 5 | 790 | Mean Difference (Fixed, 95% CI) | ‐3.59 [‐4.79, ‐2.39] |
| 2.2 0.5 x starting dose | 7 | 941 | Mean Difference (Fixed, 95% CI) | ‐4.27 [‐5.31, ‐3.22] |
| 2.3 starting dose | 31 | 2907 | Mean Difference (Fixed, 95% CI) | ‐7.06 [‐7.62, ‐6.51] |
| 2.4 2 x starting dose | 28 | 3065 | Mean Difference (Fixed, 95% CI) | ‐8.92 [‐9.47, ‐8.38] |
| 2.5 4 x starting dose | 9 | 1087 | Mean Difference (Fixed, 95% CI) | ‐7.17 [‐8.15, ‐6.18] |
| 2.6 8 x starting dose | 2 | 331 | Mean Difference (Fixed, 95% CI) | ‐7.20 [‐8.99, ‐5.40] |
| 3 Heart rate Show forest plot | 37 | Mean Difference (Fixed, 95% CI) | Subtotals only | |
| 3.1 0.25 x starting dose | 1 | 136 | Mean Difference (Fixed, 95% CI) | ‐2.9 [‐5.86, 0.06] |
| 3.2 0.5 x starting dose | 5 | 499 | Mean Difference (Fixed, 95% CI) | ‐4.34 [‐6.21, ‐2.47] |
| 3.3 starting dose | 20 | 1315 | Mean Difference (Fixed, 95% CI) | ‐9.80 [‐10.65, ‐8.94] |
| 3.4 2 x starting dose | 20 | 2175 | Mean Difference (Fixed, 95% CI) | ‐11.33 [‐12.06, ‐10.61] |
| 3.5 4 x starting dose | 8 | 556 | Mean Difference (Fixed, 95% CI) | ‐13.71 [‐15.00, ‐12.43] |
| 3.6 8 x starting dose | 2 | 331 | Mean Difference (Fixed, 95% CI) | ‐9.19 [‐11.21, ‐7.18] |
| 4 Pulse pressure Show forest plot | 50 | Mean Difference (Fixed, 95% CI) | Subtotals only | |
| 4.1 0.25 x starting dose | 5 | 790 | Mean Difference (Fixed, 95% CI) | ‐1.72 [‐3.43, ‐0.00] |
| 4.2 0.5 x starting dose | 7 | 941 | Mean Difference (Fixed, 95% CI) | ‐1.48 [‐3.13, 0.17] |
| 4.3 starting dose | 30 | 2913 | Mean Difference (Fixed, 95% CI) | 0.00 [‐2.78, ‐1.22] |
| 4.4 2 x starting dose | 27 | 3026 | Mean Difference (Fixed, 95% CI) | ‐1.39 [‐2.14, ‐0.65] |
| 4.5 4 x starting dose | 9 | 1087 | Mean Difference (Fixed, 95% CI) | ‐1.80 [‐3.16, ‐0.44] |
| 4.6 8 x starting dose | 2 | 331 | Mean Difference (Fixed, 95% CI) | ‐1.04 [‐3.67, 1.60] |
| 5 WDAE Show forest plot | 3 | 2618 | Risk Ratio (M‐H, Fixed, 95% CI) | 0.85 [0.50, 1.45] |
| 6 SBP combined starting dose and 2 x starting dose Show forest plot | 47 | 5246 | Mean Difference (Fixed, 95% CI) | ‐10.42 [‐11.11, ‐9.72] |
| 6.1 starting dose | 30 | 2509 | Mean Difference (Fixed, 95% CI) | ‐9.71 [‐10.75, ‐8.67] |
| 6.2 2 x starting dose | 27 | 2737 | Mean Difference (Fixed, 95% CI) | ‐10.99 [‐11.93, ‐10.06] |
| 7 DBP combined starting dose and 2 x starting dose Show forest plot | 48 | 5316 | Mean Difference (Fixed, 95% CI) | ‐8.27 [‐8.69, ‐7.84] |
| 7.1 starting dose | 31 | 2540 | Mean Difference (Fixed, 95% CI) | ‐7.23 [‐7.85, ‐6.60] |
| 7.2 2x starting dose | 28 | 2776 | Mean Difference (Fixed, 95% CI) | ‐9.16 [‐9.74, ‐8.58] |
| 8 Heart rate combined starting dose and 2 x starting dose Show forest plot | 33 | 3407 | Mean Difference (Fixed, 95% CI) | ‐10.93 [‐11.48, ‐10.37] |
| 8.1 starting dose | 20 | 1268 | Mean Difference (Fixed, 95% CI) | ‐10.03 [‐10.90, ‐9.17] |
| 8.2 2 x starting dose | 20 | 2139 | Mean Difference (Fixed, 95% CI) | ‐11.57 [‐12.30, ‐10.84] |
| 9 Pulse pressure combined starting dose and 2 x starting dose Show forest plot | 47 | 5246 | Mean Difference (Fixed, 95% CI) | ‐1.76 [‐2.34, ‐1.19] |
| 9.1 starting dose | 30 | 2509 | Mean Difference (Fixed, 95% CI) | ‐2.09 [‐2.94, ‐1.23] |
| 9.2 2 x starting dose | 27 | 2737 | Mean Difference (Fixed, 95% CI) | ‐1.49 [‐2.27, ‐0.71] |
| 10 SBP test for 2 x starting dose subgroup difference Show forest plot | 26 | 2197 | Mean Difference (Fixed, 95% CI) | ‐11.27 [‐12.22, ‐10.32] |
| 10.1 Atenolol | 12 | 495 | Mean Difference (Fixed, 95% CI) | ‐15.34 [‐16.86, ‐13.82] |
| 10.2 Nebivolol | 5 | 855 | Mean Difference (Fixed, 95% CI) | ‐5.26 [‐7.19, ‐3.34] |
| 10.3 Metoprolol | 5 | 284 | Mean Difference (Fixed, 95% CI) | ‐11.54 [‐14.37, ‐8.71] |
| 10.4 Bisoprolol | 2 | 134 | Mean Difference (Fixed, 95% CI) | ‐7.03 [‐11.07, ‐2.99] |
| 10.5 Betaxolol | 2 | 429 | Mean Difference (Fixed, 95% CI) | ‐11.63 [‐13.73, ‐9.53] |
| 11 DBP test for 2 x starting dose subgroup difference Show forest plot | 27 | 2236 | Mean Difference (Fixed, 95% CI) | ‐9.47 [‐10.06, ‐8.88] |
| 11.1 Atenolol | 12 | 495 | Mean Difference (Fixed, 95% CI) | ‐12.91 [‐13.89, ‐11.93] |
| 11.2 Nebivolol | 5 | 855 | Mean Difference (Fixed, 95% CI) | ‐5.82 [‐6.99, ‐4.65] |
| 11.3 Metoprolol | 5 | 284 | Mean Difference (Fixed, 95% CI) | ‐10.25 [‐11.99, ‐8.51] |
| 11.4 Bisoprolol | 3 | 173 | Mean Difference (Fixed, 95% CI) | ‐7.44 [‐9.88, ‐5.01] |
| 11.5 Betaxolol | 2 | 429 | Mean Difference (Fixed, 95% CI) | ‐8.08 [‐9.39, ‐6.77] |
| 12 Heart rate test for 2 x starting dose subgroup difference Show forest plot | 19 | 1346 | Mean Difference (Fixed, 95% CI) | ‐12.24 [‐13.05, ‐11.42] |
| 12.1 Atenolol | 10 | 413 | Mean Difference (Fixed, 95% CI) | ‐13.70 [‐14.83, ‐12.56] |
| 12.2 Nebivolol | 2 | 291 | Mean Difference (Fixed, 95% CI) | ‐5.94 [‐7.98, ‐3.90] |
| 12.3 Metoprolol | 2 | 40 | Mean Difference (Fixed, 95% CI) | ‐13.25 [‐17.04, ‐9.46] |
| 12.4 Bisoprolol | 3 | 173 | Mean Difference (Fixed, 95% CI) | ‐10.19 [‐12.87, ‐7.52] |
| 12.5 Betaxolol | 2 | 429 | Mean Difference (Fixed, 95% CI) | ‐14.43 [‐16.35, ‐12.51] |